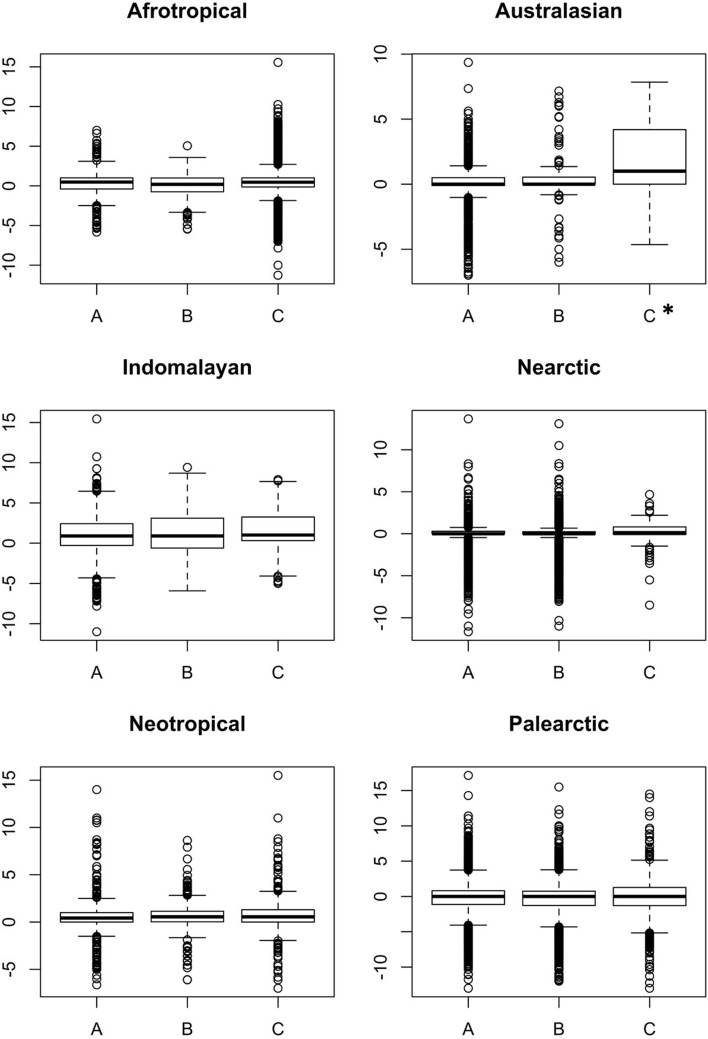
Fig. 3.
Change in human footprint within: a strictly protected areas (I–IV), b multiple-use areas (V–VI), and c areas with no IUCN category in each realm (during the years 1993–2009). Boxplots are based on the results of the generalized boosted models. An asterisk indicates that the comparison to strictly protected areas in that realm was statistically significant. Significance levels: *p < 0.05, **p < 0.01, ***p < 0.001

