Abstract
Since the first level response to public health emergencies was launched on January 25, 2020, in Heilongjiang province, China, the outbreak of COVID-19 seems to be under control. However, an outbreak of COVID-19 caused by imported cases developed in Harbin during April 2020. A mathematical model is established to investigate the transmission of COVID-19 in Harbin. Based on the dynamical analysis and data fitting, the research investigates the outbreak of COVID-19 in Harbin and estimates the outbreak size of COVID-19 in Harbin. The outbreak size estimated of COVID-19 in Harbin reaches 174, where 54% of infected cases were identified while 46% of infected cases were not found out. We should maintain vigilance against unfound infected people. Our findings suggest that the effective reproduction number decreased drastically in contrast with the value of 3.6 on April 9; after that the effective interventions were implemented by the Heilongjiang province government. Finally, the effective reproduction number arrived at the value of 0.04 which is immensely below the threshold value 1, which means that the Heilongjiang province government got the outbreak of COVID-19 in Harbin under control.
Keywords: COVID-19, Mathematical model, Harbin, Unfound infected people, The effective reproduction number, Interventions
Introduction
Since December 2019, Coronavirus Disease 2019 (COVID-19) spreads all provinces in China [1]. In March 2020, China government got the epidemic of COVID-19 under control by implementing the first-level response to public health emergencies (FLRPHE) and strict control measures [2]. However, the COVID-19 spreads rapidly all over the world, and 100,221,840 confirmed cases and 2,154,967 deaths were reported as of January 27, 2021.
An outbreak of COVID-19 in Harbin was caused by an imported case, the first related case was diagnosed and two asymptomatic cases were found on April 9 [3–5]. As of April 30, 68 confirmed cases and 23 asymptomatic cases were reported from the COVID-19 outbreak in Harbin. On March 19, an American student (H) carrying COVID-19 came back to Harbin from New York and then infected her neighbor (C) during the confinement period. Due to the infection within the family, G was infected with COVID-19 and then infected C by the dine together. Subsequently, C with cerebral apoplexy sought medical advice in the second hospital in Harbin and the first affiliated hospital of Harbin medical university, which caused that many patients, health care providers, doctors and nurses were infected with COVID-19 and then led to the local outbreak of COVID-19 in Harbin. The important events related to the outbreak of COVID-19 in Harbin are shown in Table 1.
Table 1.
The important events related to the outbreak of COVID-19 in Harbin
| Date | Event |
|---|---|
| Mar/19/2020 | The American student (H) arrived at Harbin from New York |
| Mar/27/2020 | The dine together including C, G and W (C’s mother) was held |
| Apr/2/2020 | C arrived the second hospital in Harbin and admitted to the hospital |
| Apr/6/2020 | C left the second hospital in Harbin, and arrived at the first |
| affiliated hospital of Harbin medical university and admitted to the hospital | |
| Apr/9/2020 | One confirmed case and three asymptomatic cases were reported |
| Apr/10/2020 | C was diagnosed with COVID-19 |
| Apr/11/2020 | H was diagnosed with COVID-19 |
| Apr/16/2020 | Steering group for prevention and control of COVID-19 in Harbin |
| was set up by Heilongjiang Provincial Party Committee | |
| Apr/28/2020 | H was defined as the infectious source of |
| the outbreak of COVID-19 in Harbin | |
| Apr/28/2020 | No new infectious case was reported in Harbin |
Mathematical modeling is used usually to explore the transmission of diseases such as COVID-19 and also predict the development trend of disease with the help of previous related information [6–11]. According to the confirmed cases outside of mainland China by 18th January, Imai et al. [12] inferred the epidemic size of COVID-19 in Wuhan. Using public information and mathematical models, Wu et al. [13] estimated the clinical severity of COVID-19. Tang et al. [14] evaluated the epidemic size in China, and the effect of control measures was assessed in China. With the help of the mathematical model and public information, Song et al. [9] estimated the epidemic size of COVID-19 in China and predicted the potential second epidemic in China. Subsequently, Song et al. [11] established a mathematical model, computed the basic reproduction number, and estimated the epidemic size of COVID-19 in Wuhan as of January 23, 2020. In addition, the bilinear neural network method can be used to study the differential equations [15, 16]. The transmission of COVID-19 in China has been largely studied [9, 11–14], but there is no related study on mathematical modeling of COVID-19 transmission in Harbin by now.
To study the spread of COVID-19 in Harbin, the basic reproduction number and the effective reproduction number were computed. The basic reproduction number is defined as the expected number of secondary cases produced by a single infection in a completely susceptible population [17, 18]. While the effective reproduction number is the mean number of secondary cases an infected person can cause in a population where there is some immunity or some interventions in place [19]. It is useful to compute the basic reproduction number to estimated the transmission capacity of COVID-19 when the outbreak occurs. However, as a result of interventions such as FLRPHE and isolation measures, the effective reproduction number changes in time, and then, it is necessary to investigate the effective reproduction number to combat COVID-19 [20]. Most studies investigated the spread of COVID-19 using susceptible-infectious-recovered (SIR) or susceptible-exposed-infectious-recovered (SEIR) model [13, 14, 21–28]. For example, Liu et al. [26] predicted the cumulative number of reported cases to a final size using the SIR model. Wu et al. [21] used the SEIR model to forecast the potential and international spread of COVID-19 in Wuhan, where they assumed that the infected people in the incubation period were not infectious. Here, we established a susceptible-unfound infected-found infected-removed (SIFR) model, where the unfound infected people include infected people in the incubation period and unfound asymptomatic and symptomatic infected people.
To estimate the epidemic size of COVID-19 and assess the effectiveness of interventions in Harbin, a mathematical model explaining the transmission dynamics of COVID-19 is established. The basic reproduction number and the effective reproduction number are computed, and dynamics are analyzed by rigorous mathematical analysis. Using the mathematical model and public information, the epidemic size of COVID-19 in Harbin is estimated and the effect of interventions on the transmission of COVID-19 in Harbin is evaluated.
The rest of the paper is organized as follows. In Sect. 2, the mathematical model is established and dynamics are analyzed. Section 3 gives the parameter estimation. The estimation of the epidemic size of COVID-19 in Harbin is given and the effectiveness of interventions is assessed. Section 5 presents the discussion and conclusion.
Mathematical modeling of COVID-19 transmission in Harbin and dynamic analysis
Based on the found infected cases in Harbin in April 2020, a mathematical model is used to compute the basic reproduction number, estimate the epidemic size of COVID-19 in Harbin, and assess the effect of interventions on the transmission of COVID-19 in Harbin.
The report of the WHO-China Joint Mission on COVID-19 [29] shows that the infected people in the incubation period have infectivity. In the model, several assumptions are given in the following. The natural birth rate and death rate are not considered since the period of the epidemic is short. The unfound infected people with COVID-19 have the same infectivity with infectious people with COVID-19 and found infected people are quarantined and could not infect healthy people. Removed people are not infected with COVID-19 again. The unfound infected people include infected people in the incubation period and unfound asymptomatic and symptomatic infected people.
The population (N) is divided into susceptible people (S), unfound infected people (I), found infected people (F) and removed people (R), respectively. Here, . Susceptible people become infected people by the transmission rate after contact with unfound infected people. Infected people are found out by the found rate p. Infected people are removed by the removed rates and , respectively. Here, the removed rate includes recovery rate and death rate due to disease. The flow diagram is shown in Fig. 1.
Fig. 1.
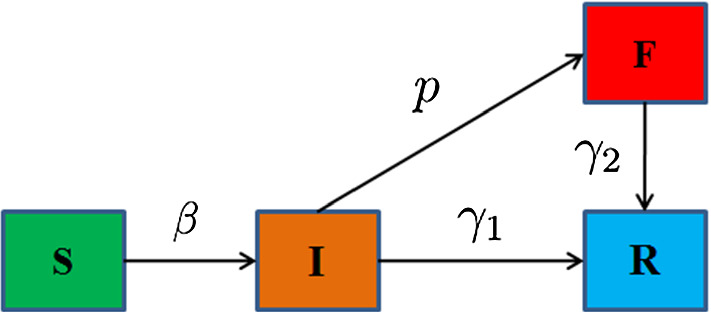
The transmission diagram of COVID-19 in Harbin. Where S, I, F and R represent the susceptible people, unfound infected people, found infected people and removed people
Based on the epidemiological patterns of COVID-19 in Harbin and previous work [21, 28, 30], the transmission dynamics of COVID-19 in Harbin is presented by the following differential equations
| 1 |
where the nonnegative initial values
| 2 |
Theorem 2.1
For system (1) with initial nonnegative initial values (2), the solutions of system (1) are nonnegative and ultimately bounded.
Proof
Through the Theorem 5.2.1 in [31], the solutions S(t), I(t), F(t) and R(t) are nonnegative instantly.
From the first equation of model (1), we obtain
Thus, , which means that S(t) is ultimately bounded.
From the equations of model (1), we have
Then , which means that I(t), F(t) and R(t) ultimately bounded. The proof is completed.
For system (1), the disease-free equilibrium with and . With the help of the next generation matrix theory [17, 18], the basic reproduction number is calculated, where
Then the effective reproduction number is
In what follows, the stability of the disease-free equilibrium is proved.
Theorem 2.2
For system (1),
-
(i)
The disease-free equilibrium is locally asymptotically stable if .
-
(ii)
If , then the disease-free equilibrium is globally asymptotically stable.
Proof
Since the stability of S(t) and R(t) is determined by the stability of I(t) and F(t), and , then system (1) is simplified into the following equations
| 3 |
The Jacobian matrix of system (3) at is obtained, where
Thus, the characteristic equation at is
If , then the roots and . Therefore, the disease-free equilibrium is locally asymptotically stable.
Now we prove the global stability of the disease-free equilibrium . Define the Lyapunov function
Apparently, . Differentiating L(t) along the solutions of system (3) yields
When , . Furthermore, the largest compact invariant set in is the singleton . Using the LaSalle invariance principle [32] and the local stability of , the disease-free equilibrium point is globally asymptotically stable. The proof is completed.
In the following, it follows from [33] that the epidemic size and peak value of COVID-19 in Harbin could be obtained.
The sum of the first and second equations of system (1) is
| 4 |
which means that and . Integration of the equation (4) from 0 to leads to
From the first equation of model (3), we have
| 5 |
It follows from equation (5) that the relation between the basic reproduction number and epidemic size of the COVID-19 is given.
Furthermore, integration of the first equation of model (3) from 0 to t yields
and then
When the derivative of I is zero (that is, ), we obtain the maximum number of infectives which is
| 6 |
Simulations are carried out to verify the theoretical results. Setting the parameters , , , and the initial value . Figure 2 shows that the disease-free equilibrium is stable when . Susceptible and removed people approach to and , respectively.
Fig. 2.
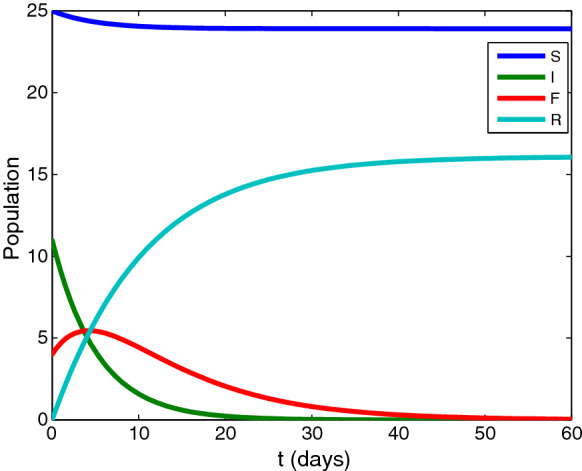
The solution behavior of the model (1). When , the disease-free equilibrium is stable
Setting the parameters , , , and the initial value . Figure 3 gives the relation between S and I which describes the orbits of the solutions of the model (1) in the (S, I) plane. The maximum number of infectives is obtained when the derivative of I is zero.
Fig. 3.
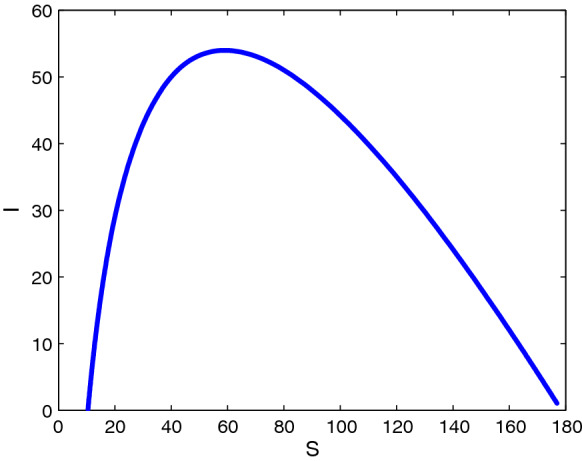
The relation between S and I describes the orbits of the solutions of the model (1) in the (S, I) plane
Parameters estimation
Data source
Data on found infected cases of COVID-19 from April 9 to April 30, 2020, in Harbin were obtained from the Health Commission of Heilongjiang Province [3]. The data set includes the cumulative number of found infected cases, newfound infected cases and cured cases. These data used are from publicly available data sources.
Parameters estimation
As of April 30, 68 confirmed cases and 23 asymptomatic cases were reported from the COVID-19 outbreak in Harbin [3]. According to the study in [34], the average time of treatment is 10 days ( and ). As of April 9, one confirmed case and three asymptomatic cases were reported. Then the initial values on April 9 are .
The initial values for two state variables and two unknown parameters were estimated using Bayesian methods. Multivariate Gaussian was chosen as the prior distribution of two unknown parameters. We chose the mean of the posterior distribution as the estimated value of the initial values and parameters, which were estimated by the Markov Chain Monte Carlo (MCMC) method. In view of the mathematical model and confirmed cases, using the MCMC method employing the adaptive Metropolis–Hasting algorithm with 20000 iterations and a 10000 iteration burn-in period [35], parameter values , p and initial values S(0), I(0) are estimated. In addition, the mean value, standard deviation (STD) and 95% confidence interval (95% CI) are given in Table 2.
Table 2.
Related parameters and initial values in Harbin
| Parameter | Descriptions | Mean | STD | 95% CI | Source |
|---|---|---|---|---|---|
| The transmission rate of | 0.8403 | 0.0036 | [0.8310, 0.8482] | Estimated | |
| COVID-19 per day | |||||
| p | The found probability of | 0.1128 | 0.0004 | [0.1086, 0.1172] | Estimated |
| infected people per day | |||||
| The recovery rate of | 0.1 | – | – | [34] | |
| unfound infected people | |||||
| The removed rate of | 0.1 | – | – | [34] | |
| found infected people | |||||
| Initial values | Descriptions | Mean | STD | 95% CI | Source |
| S(0) | Initial number of | 163 | 0.1736 | [158, 168] | Estimated |
| susceptible people | |||||
| I(0) | Initial number of | 11 | 0.12 | [8, 15] | Estimated |
| unfound infected people | |||||
| F(0) | Initial number of | 4 | – | – | Data |
| found infected people | |||||
| R(0) | Initial number of | 0 | – | – | Data |
| removed people |
Fitting results
Concerning the uncertainty of estimated parameters and initial values, the MCMC method is used to evaluate the performance of our model (1) by the estimated parameters and initial values in Table 2. Figure 4 shows the estimated cumulative infected cases and read data of COVID-19 in Harbin. Simulations are consistent with the reported cases, which validates the accuracy of our model.
Fig. 4.
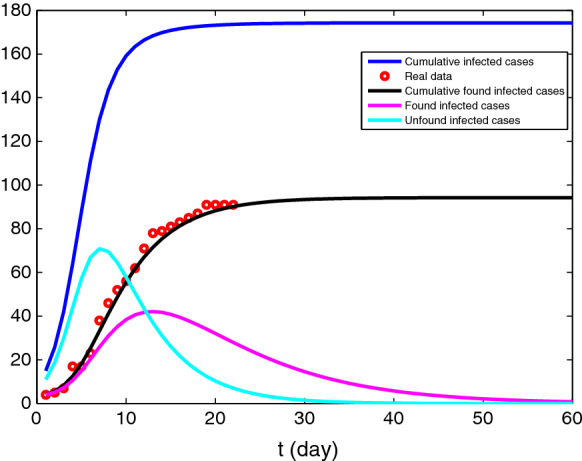
The estimated cumulative infectious cases of COVID-19 in Harbin
The spread of COVID-19 and the effect of interventions in Harbin
Estimating the spread of COVID-19 in Harbin
Simulation results of the estimated cumulative infected cases are shown in Fig. 4. Then we compute the basic reproduction number of 3.6 on April 9, 2020. Figure 4 shows that the cumulative number of infected people reached 174, the cumulative number of found infected people was 94 and the cumulative number of unfound infected people was 80.
The effect of interventions on the spread of COVID-19 in Harbin
The effective reproduction number for our model is shown in Fig. 5. On April 9, the effective reproduction number was 3.6 which was the maximum of . As time went on, decreased quickly and was less than the threshold value 1 after April 15. Subsequently, arrived at the minimum of 0.04 on April 30 which immensely below the threshold value 1. The outbreak of COVID-19 is under control when the effective reproduction number is less than 1. This implies that the outbreak of COVID-19 in Harbin in April 2020 was under control when effective interventions were implemented.
Fig. 5.
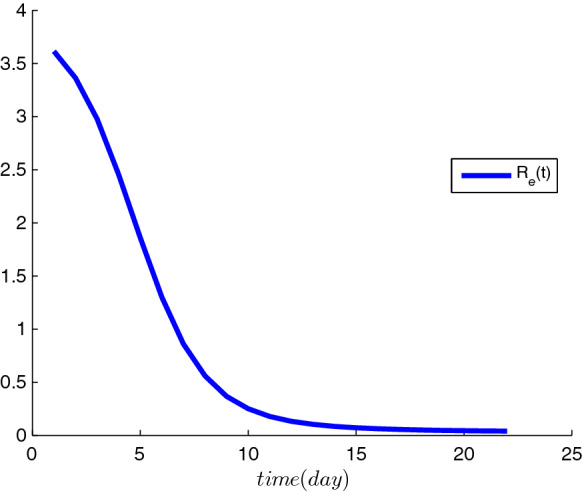
The effective reproduction number in Harbin
Discussion and conclusion
Since the first case of COVID-19 was reported in Harbin on April 9, 2020, COVID-19 caused 68 confirmed cases and 23 asymptomatic cases in Harbin from March to April 2020. In the paper, using the public information and our mathematical model, we estimated the COVID-19 outbreak size in Harbin in April 2020. Results show that the cumulative number of infected people reached 174, the cumulative number of found infected people was 94 and the cumulative number of unfound infected people was 80. To assess the effectiveness of interventions in Harbin, the effective reproduction number was estimated based on the public information and our mathematical model.
This is the first study to estimate the transmission potential of the COVID-19 outbreak in Harbin in April 2020. The cumulative number of infected people finally reached 174, where 54% of infected people were found and 46% of infected people were not found out. Although all close contacts tracked were detected, some infected people were not found out. Indeed, the unfound infected people might be the infected people in the incubation period, unfound asymptomatic and symptomatic infected people. Therefore, it is dangerous for public health to ignore unfound infected people. We must maintain vigilance against unfound infected people.
Our findings indicate that the effective reproduction number on April 9 reaches 3.6 which is consistent with the estimated value in China [14, 21, 30, 36]. Besides, the estimated basic reproduction number was 6.8 in Hubei province [34], and 3.6 in New York [37]. However, when the effective interventions were implemented by the Heilongjiang provincial government, the effective reproduction number drastically dropped and finally reached 0.04 which is greatly below the threshold value 1, which suggest that the outbreak of COVID-19 in Harbin in April 2020 was under control and no subsequent outbreak in Harbin.
The mathematical modeling used in the study is analogous to the transmission dynamics model of COVID-19 in [12, 13, 22–28, 38–44]. The SIFR model helps us to estimate the cumulative number of infected cases of COVID-19 in Harbin in April and the effective reproduction number using found infected cases. Nonetheless, there are several limitations. First, we assumed that infected people with COVID-19 in the incubation period have the same infectivity as infectious people with COVID-19, which caused that the outbreak size of COVID-19 in Harbin was overestimated. Second, the detailed interventions were not incorporated into our model, which might lead to overestimating the outbreak size of COVID-19 in Harbin in April 2020. Third, very little is known about the effect of temperature and precipitation on the transmission of COVID-19. Our estimation could be untrustworthy if temperature and precipitation have a strong impact on the transmission of COVID-19.
Although the transmission of COVID-19 has been under control in China, the epidemic situation of COVID-19 all over the world is serious. Now, an increasing number of imported infected cases got into China and a growing number of asymptomatic infected people were found, which might increase the risk of a local outbreak of COVID-19 in China. Therefore, we should stay alert in case that unfound infected people might cause local outbreaks of COVID-19 in China such as the outbreak of COVID-19 in Harbin in April 2020 [9, 45]. The resurgence of COVID-19 in Beijing was likely caused by a polluted environment-to-human transmission from food via cold chain logistics [46]. The polluted environment-to-human transmission from food via cold chain logistics brings new challenges and its effect on the transmission of COVID-19 would be assessed, which we leave as our future work. Also, the differences of spread of COVID-19 in different hospitals and more modeling and verification for different cities in China will bring challenges from analysis as well as regression, and we will leave this as a future work.
Acknowledgements
The authors would like to thank the editor and anonymous referees for their valuable comments and suggestions. This study is supported by the National Natural Science Foundation of China (11601291, 11871179, 11771374), the Fund Program for the Scientific Activities of Selected Returned Overseas Professionals in Shanxi Province (20200001), the Program for the Outstanding Innovative Teams (OIT) of Higher Learning Institutions of Shanxi, the Shanxi Scholarship Council of China (HGKY2019004), the Scientific and Technological Innovation Programs (STIP) of Higher Education Institutions in Shanxi (2019L0082), and the 1331 Engineering Project of Shanxi Province.
Declaration
Conflict of interest
All authors declare no conflicts of interest in this paper.
Footnotes
Publisher's Note
Springer Nature remains neutral with regard to jurisdictional claims in published maps and institutional affiliations.
References
- 1.Zhu N, Zhang D, Wang W, et al. A Novel Coronavirus from Patients with Pneumonia in China, 2019. N. Engl. J. Med. 2020;382:727–733. doi: 10.1056/NEJMoa2001017. [DOI] [PMC free article] [PubMed] [Google Scholar]
- 2.Chinadaily, Tibet activates highest-level public health alert. https://www.chinadaily.com.cn/a/202001/29/ WS5e318a36a3101282172739c1.html Accessed 30 Jan 2020
- 3.Health Commission of Heilongjiang Province http://wsjkw.hlj.gov.cn/index.php/Home/Zwgk/all/typeid/42. Accessed 30 Apr 2020
- 4.Chinese Center for Disease Control and Prevention. http://2019ncov.chinacdc.cn/2019-nCoV/. Accessed 30 Apr 2020 [DOI] [PMC free article] [PubMed]
- 5.National Health Commission of the People’s Republic of China. http://www.nhc.gov.cn/xcs/xxgzbd/gzbd_index.shtml Accessed 30 Apr 2020 [DOI] [PMC free article] [PubMed]
- 6.Song H, Jiang W, Liu S. Global dynamics of two heterogeneous SIR models with nonlinear incidence and delays. Int. J. Biomath. 2016;9:1650046. doi: 10.1142/S1793524516500467. [DOI] [Google Scholar]
- 7.Tian D, Song H. Global dynamics of a Vector-Borne disease model with two delays and nonlinear transmission rate. Math. Method Appl. Sci. 2017;40:6411–6423. doi: 10.1002/mma.4464. [DOI] [Google Scholar]
- 8.Song H, Liu S, Jiang W. Global dynamics of a multistage SIR model with distributed delays and nonlinear incidence rate. Math. Method Appl. Sci. 2017;40:2153–2164. [Google Scholar]
- 9.Song, H., Liu, F., Li, F., et al.: The Impact of Isolation on the Transmission of COVID-19 and Estimation of Potential Second Epidemic in China. Preprint (2020)
- 10.Song H, Tian D, Shan C. Modeling the effect of temperature on dengue virus transmission with periodic delay differential equations. Math. Biosci. Eng. 2020;17:4147–4164. doi: 10.3934/mbe.2020230. [DOI] [PubMed] [Google Scholar]
- 11.Song H, Li F, Jia Z, Jin Z, Liu S. Using traveller-derived cases in Henan Province to quantify the spread of COVID-19 in Wuhan. China. Nonlinear Dyn. 2020;101:1821–1831. doi: 10.1007/s11071-020-05859-1. [DOI] [PMC free article] [PubMed] [Google Scholar]
- 12.Imai, N., Dorigatti, I., Cori, A., et al.: Estimating the potential total number of novel Coronavirus (2019-nCoV) cases in Wuhan City, China. Imperial College London (22-01-2020). Publisher Full Text, (2020)
- 13.Wu JT, Leung K, Bushman M, et al. Estimating clinical severity of COVID-19 from the transmission dynamics in Wuhan China. Nat. Med. 2020;26:506–510. doi: 10.1038/s41591-020-0822-7. [DOI] [PMC free article] [PubMed] [Google Scholar]
- 14.Tang B, Xia F, Tang S, et al. The effectiveness of quarantine and isolation determine the trend of the COVID-19 epidemics in the final phase of the current outbreak in China. Int. J. Infect. Dis. 2020;95:288–293. doi: 10.1016/j.ijid.2020.03.018. [DOI] [PMC free article] [PubMed] [Google Scholar]
- 15.Zhang R, Bilige S. Bilinear neural network method to obtain the exact analytical solutions of nonlinear partial differential equations and its application to p-gBKP equation. Nonlinear Dyn. 2019;95:3041–3048. doi: 10.1007/s11071-018-04739-z. [DOI] [Google Scholar]
- 16.Zhang R, Li M, Yin H. Rogue wave solutions and the bright and dark solitons of the (3+ 1)-dimensional Jimbo-Miwa equation. Nonlinear Dyn. 2021;103:1071–1079. doi: 10.1007/s11071-020-06112-5. [DOI] [Google Scholar]
- 17.Diekmann O, Heesterbeek JAP, Metz JAJ. On the definition and the computation of the basic reproduction ratio in models for infectious diseases in heterogeneous populations. J. Math. Biol. 1990;28:365–382. doi: 10.1007/BF00178324. [DOI] [PubMed] [Google Scholar]
- 18.Van den Driessche P, Watmough J. Reproduction numbers and sub-threshold endemic equilibria for compartmental models of disease transmission. Math. Biol. 2002;180:29–48. doi: 10.1016/s0025-5564(02)00108-6. [DOI] [PubMed] [Google Scholar]
- 19.De Serres G, Gay NJ, Farrington CP. Epidemiology of transmissible diseases after elimination. Am. J. Epidemiol. 2000;151:1039–1048. doi: 10.1093/oxfordjournals.aje.a010145. [DOI] [PubMed] [Google Scholar]
- 20.Cao, Z., Zhang, Q., Lu, X., et al.: Estimating the effective reproduction number of the 2019-nCoV in China. MedRxiv (2020)
- 21.Wu JT, Leung K, Leung GM. Nowcasting and forecasting the potential domestic and international spread of the 2019-nCoV outbreak originating in Wuhan, China: a modelling study. Lancet. 2020;395:689–697. doi: 10.1016/S0140-6736(20)30260-9. [DOI] [PMC free article] [PubMed] [Google Scholar]
- 22.Tian J, Wu J, Bao Y, et al. Modeling analysis of COVID-19 based on morbidity data in Anhui China. Math. Biosci. Eng. 2020;17:2842–2852. doi: 10.3934/mbe.2020158. [DOI] [PubMed] [Google Scholar]
- 23.Prem K, Liu Y, Russell TW, et al. The effect of control strategies to reduce social mixing on outcomes of the COVID-19 epidemic in Wuhan, China: a modelling study. Lancet Publ. Health. 2020;5:e261–e270. doi: 10.1016/S2468-2667(20)30073-6. [DOI] [PMC free article] [PubMed] [Google Scholar]
- 24.Wang K, Lu Z, Wang X, et al. Current trends and future prediction of novel coronavirus disease (COVID-19) epidemic in China: a dynamical modeling analysis. Math. Biosci. Eng. 2020;17:3052–3061. doi: 10.3934/mbe.2020173. [DOI] [PubMed] [Google Scholar]
- 25.Chen TM, Rui J, Wang QP, et al. A mathematical model for simulating the phase-based transmissibility of a novel coronavirus. Infect. Dis. Poverty. 2020;9:1–8. doi: 10.1186/s40249-019-0617-6. [DOI] [PMC free article] [PubMed] [Google Scholar]
- 26.Liu Z, Magal P, et al. Predicting the cumulative number of cases for the COVID-19 epidemic in China from early data. Math. Biosci. Eng. 2020;17:3040–3051. doi: 10.3934/mbe.2020172. [DOI] [PubMed] [Google Scholar]
- 27.You S, Wang H, Zhang M, et al. Assessment of monthly economic losses in Wuhan under the lockdown against COVID-19. Humanit. Soc. Sci. Commun. 2020;7:1–12. doi: 10.1057/s41599-020-00545-4. [DOI] [Google Scholar]
- 28.Tian H, Liu Y, Li Y, et al. An investigation of transmission control measures during the first 50 days of the COVID-19 epidemic in China. Science. 2020;368:638–642. doi: 10.1126/science.abb6105. [DOI] [PMC free article] [PubMed] [Google Scholar]
- 29.World Health Organization (WHO). Coronavirus disease (COVID-2019) outbreak, report of the WHO-China Joint Mission on COVID-19. https://www.who.int/docs/default-source/coronaviruse/who-china-joint-mission-on-covid-19-final-report.pdf. Accessed 16 Feb 2020
- 30.Niehus R, De Salazar PM, Taylor AR, et al. Using observational data to quantify bias of traveller-derived COVID-19 prevalence estimates in Wuhan China. Lancet Infect. Dis. 2020;20:803–808. doi: 10.1016/S1473-3099(20)30229-2. [DOI] [PMC free article] [PubMed] [Google Scholar]
- 31.Smith, H.L.: Monotone Dynamical Systems: An Introduction to the Theory of Competitive and Cooperative Systems: An Introduction to the Theory of Competitive and Cooperative Systems. vol. 41. American Mathematical Soc., Providence (2008)
- 32.LaSalle, J.P.: The stability of dynamical systems. In: Regional Conference Series in Applied Mathematics, SIAM, Philadephia (1976)
- 33.Brauer, F., Castillo-Chavez, C.: Mathematical models for communicable diseases. Society for Industrial and Applied Mathematics, Philadelphia, PA (2012)
- 34.You, C., Deng, Y., Hu, W., et al.: Estimation of the time-varying reproduction number of COVID-19 outbreak in China. Int. J. Hyg. Environ. Health 228, 113555 (2020) [DOI] [PMC free article] [PubMed]
- 35.Haario H, Laine M, Mira A. DRAM: efficient adaptive MCMC. Stat. Comput. 2006;16:339–354. doi: 10.1007/s11222-006-9438-0. [DOI] [Google Scholar]
- 36.Huang SZ, Peng ZH, Jin Z. Studies of the strategies for controlling the COVID-19 epidemic in China: Estimation of control efficacy and suggestions for policy makers. Sci. Sin. Math. 2020;50:1–14. [Google Scholar]
- 37.Zou, D., Wang, L., Xu, P., et al.: Epidemic model guided machine learning for COVID-19 forecasts in the United States. MedRxiv (2020)
- 38.Li R, Pei S, Chen B, et al. Substantial undocumented infection facilitates the rapid dissemination of novel coronavirus (SARS-CoV-2) Science. 2020;368:489–493. doi: 10.1126/science.abb3221. [DOI] [PMC free article] [PubMed] [Google Scholar]
- 39.Read, J.M., Bridgen, J.R., Cummings, D A., et al.: Novel coronavirus 2019-nCoV: early estimation of epidemiological parameters and epidemic predictions. MedRxiv (2020) [DOI] [PMC free article] [PubMed]
- 40.Zhao S, Lin Q, Ran J, et al. Preliminary estimation of the basic reproduction number of novel coronavirus (2019-nCoV) in China, from 2019 to 2020: A data-driven analysis in the early phase of the outbreak. Int. J. Infect. Dis. 2020;92:214–217. doi: 10.1016/j.ijid.2020.01.050. [DOI] [PMC free article] [PubMed] [Google Scholar]
- 41.Arino J, Portet S. A simple model for COVID-19. Infect. Dis. Model. 2020;5:309–315. doi: 10.1016/j.idm.2020.04.002. [DOI] [PMC free article] [PubMed] [Google Scholar]
- 42.Reiner, R.C., Barber, R.M., et al.: Modeling COVID-19 scenarios for the United States. Nat. Med. 1–12, (2020) [DOI] [PMC free article] [PubMed]
- 43.Nande A, Adlam B, Sheen J, et al. Dynamics of COVID-19 under social distancing measures are driven by transmission network structure. PLoS Comput. Biol. 2021;17:e1008684. doi: 10.1371/journal.pcbi.1008684. [DOI] [PMC free article] [PubMed] [Google Scholar]
- 44.Huang, B., Wang, J., Cai, J., et al.: Integrated vaccination and physical distancing interventions to prevent future COVID-19 waves in Chinese cities. Nat. Hum. Behav. (2021). 10.1038/s41562-021-01063-2 [DOI] [PubMed]
- 45.Jia Z, Lu Z. Modelling COVID-19 transmission: from data to intervention. Lancet Infect. Dis. 2020;20:757–758. doi: 10.1016/S1473-3099(20)30258-9. [DOI] [PMC free article] [PubMed] [Google Scholar]
- 46.Pang X, Ren L, Wu S, et al. Cold-chain food contamination as the possible origin of COVID-19 resurgence in Beijing. Natl. Sci. Rev. 2020;7:1861–1864. doi: 10.1093/nsr/nwaa264. [DOI] [PMC free article] [PubMed] [Google Scholar]


