

Abstract
Objective
To determine if sarcopenia is a predictor of blood transfusion requirements in head and neck cancer free flap reconstruction (HNCFFR).
Methods
A single‐institution, retrospective review was performed of HNCFFR patients with preoperative abdominal imaging from 2014 to 2019. Demographics, comorbidities (modified Charlson Comorbidity Index [mCCI]), skeletal muscle index (cm2/m2), oncologic history, intraoperative data, and 30‐day postoperative complications (Clavien‐Dindo score [CD]) were collected. Binary logistic regression was performed to determine predictors of transfusion.
Results
Eighty (33.5%), 66 (27.6%), and 110 (46.0%) of n = 239 total patients received an intraoperative, postoperative, or any perioperative blood transfusion, respectively. Sixty‐two (25.9%) patients had sarcopenia. Patients receiving intraoperative transfusions had older age (P = .035), more frequent alcoholism (P = .028) and sarcopenia (P < .001), greater mCCI (P < .001), lower preoperative hemoglobin (P < .001), reconstruction with flaps other than forearm (P = .003), and greater operative times (P = .001), intravenous fluids (P < .001), and estimated blood loss (EBL, P < .001). Postoperative transfusions were associated with major complications (CD ≥ 3; P < .001). Multivariate regression determined sarcopenia (P = .023), mCCI (P = .013), preoperative hemoglobin (P = .002), operative time (P = .036), and EBL (P < .001) as independent predictors of intraoperative transfusion requirements. Postoperative transfusions were predicted by preoperative hemoglobin (P = .007), osseous flap (P = .036), and CD ≥ 3 (P < .001). A perioperative transfusion was predicted by sarcopenia (P = .021), preoperative hemoglobin (P < .001), operative time (P = .008), and CD ≥ 3 (P = .018).
Conclusion
Sarcopenia is associated with increased blood transfusions in HNCFFR. Patients should be counseled preoperatively on the associated risks, and the increased blood product requirement should be accounted in resource‐limited scenarios.
Level of Evidence
4.
Keywords: blood transfusion, free flap reconstruction, head and neck cancer, sarcopenia, skeletal muscle index

Head and neck cancer free flap reconstruction patients are at particularly high risk of requiring perioperative blood transfusions, which imposes additional risks and consequences. Sarcopenia, which was determined by measuring skeletal muscle mass using preoperative CT imaging, is highly prevalent in this patient population and has been associated with worse perioperative outcomes. In this retrospective cohort study, we determined that sarcopenia was and independent risk factor for blood transfusion after accounting for comorbidities, operative factors, and complications in head and neck cancer free flap reconstruction patients.
1. INTRODUCTION
Microvascular free flap reconstruction (FFR) is often the standard repair method after resection of advanced head and neck cancer (HNC). Free flaps are versatile and provide adequate tissue volume for restoration of both form and function after oncologic ablation. However, these procedures are often extensive in tissue removal, operative time, and utilization of medical resources including blood products.
The indications for blood product transfusion remain controversial, particularly in head and neck reconstruction where there is a paucity of quality studies. For patients without significant coronary disease, the current precept of transfusing is indicated with significant active bleeding and/or hemoglobin (Hgb) < 7 g/dL (hematocrit <21%), 1 the standard to which our institution also adheres.
Both administering and withholding transfusions have unique risks. In the acute setting, significant anemia carries the hazard of ischemia and tissue injury from inadequate oxygen delivery, potentially resulting in myocardial infarctions, cerebrovascular accidents, acute kidney injury, and ischemic hepatitis. 2 Significant anemia could also lead to flap failure, although this association has not been identified. 1 , 3 , 4 Conversely, transfusing carries risk of adverse consequences including allergic reactions, acute‐ and delayed‐hemolysis, transfusion‐associated cardiac overload, transfusion‐related lung injury, and transmission of viral pathogens. 2 Within both head and neck and plastic surgery FFR disciplines, transfusions have been associated with greater postoperative complications, 5 , 6 wound complications, 6 and unplanned readmission. 7 Also, transfusions in oncologic resection have been associated with earlier cancer recurrence and worse overall survival. 8 , 9 These in conjunction with the significant financial cost and limited availability of blood products necessitate careful consideration for those patients to whom transfusions are provided.
Preoperative identification of patients at risk for transfusion in FFR would enable surgeons to provide better preoperative counseling and address blood product availability. An emerging preoperative risk factor being analyzed is sarcopenia, which is the combination of low muscle strength, low muscle quantity or quality, and low physical performance. 10 Its etiology includes aging, inactivity, malnutrition, inflammation, and cancer cachexia. 10 Sarcopenia can be assessed objectively on radiologic measurements of skeletal muscle mass (SMM) and/or physical assessments of mobility and strength. 10 However, radiologically determined sarcopenia alone has substantial medical implications, especially in the surgical and oncologic specialties where computed tomography (CT) imaging is frequently obtained. 11 , 12 , 13 , 14 , 15 , 16 , 17 , 18 , 19 Within HNC resection and FFR, preoperative CT‐determined sarcopenia has demonstrated prognostic for complications and overall survival. 20 , 21 , 22 , 23 , 24 , 25 , 26 , 27
In addition to the overall reduced SMM, sarcopenic patients have reduced skeletal muscle capillary density and exercise capacity. 28 Furthermore, skeletal muscle requires substantial vascular supply and blood‐holding capacity for exercise demands. 29 Because of these, we hypothesize that sarcopenic patients have reduced total blood volume compared to nonsarcopenic patients. As a result, they may experience greater proportional blood loss and increased transfusion requirements from surgery. 30 , 31 , 32 , 33 To delineate this relationship and identify those patients at risk for transfusion, we sought to investigate sarcopenia and its effect on transfusion requirements with head and neck cancer free flap reconstruction (HNCFFR) where transfusions are highly prevalent.
2. METHODS
After obtaining Institutional Review Board approval, a retrospective, single‐center study was conducted at our tertiary referral center. Adult patients undergoing HNCFFR from January 1, 2014 through December 31, 2019 were collected. Subjects with pathologically confirmed head and neck malignancy and adequate 90‐day preoperative CT imaging of the abdomen were included for review. Patients with synchronous cancers, distant metastatic disease, immunodeficiency (ie, HIV), or bleeding disorders were excluded.
Patient demographics, modified Charlson Comorbidity Index (mCCI), 34 , 35 cancer data and staging according to the eighth edition American Joint Committee on Cancer (AJCC) Cancer Staging Manual, 36 prior chemotherapy or radiation therapy, preoperative Hgb, intraoperative details, and 30‐day postoperative courses were collected. Red blood cell transfusions were classified as intraoperative, 30‐day postoperative, or perioperative after combining both intra‐ and postoperative timelines. Malignancy occupying the oral cavity, oropharynx, hypopharynx, and/or larynx were collectively grouped as aerodigestive. Tumors located within the nasal cavity, paranasal sinuses, nasopharynx, major salivary glands, thyroid, parathyroid, or cutaneous areas were categorized as nonaerodigestive. The mCCI was calculated by the summation of the patient comorbidities. The calculation provided a weight of: 1.0 for hypertension, diabetes mellitus, coronary artery disease (CAD), congestive heart failure (CHF), cerebrovascular accident (CVA), chronic obstructive pulmonary disease (COPD), peripheral vascular disease (PVD), and connective tissue disorder; 2.0 for chronic kidney disease; and 3.0 for liver failure or cirrhosis. 34 , 35 Postoperative complications were categorized according to the Clavien‐Dindo (CD) classification. Those involving surgical or radiologic intervention, single‐ or multiorgan dysfunction, intensive care unit (ICU) management, or death were grouped as major complications (CD ≥ 3). 37
Skeletal muscle index (SMI, cm2/m2) was calculated as previously described using SliceOmatic v5.0 software (TomoVision, Magog, Canada). 20 Sarcopenia was determined as <41.6 cm2/m2 for males and <32.0 cm2/m2 for females. 38 Figure 1 provides a comparative example of these measurements in a sarcopenic (A) and a non‐sarcopenic (B) patient.
FIGURE 1.
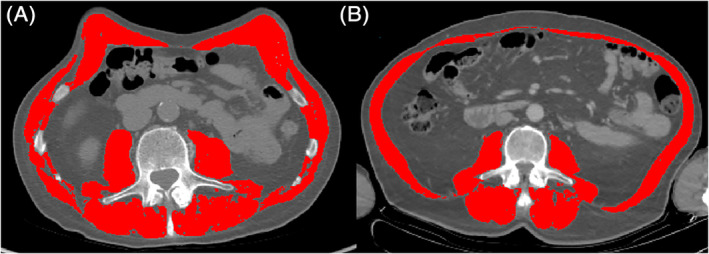
Axial CT comparison of a nonsarcopenic 47‐year‐old male with BMI of 21.0 kg/m2 and SMI of 60.1 cm2/m2 (A) and a sarcopenic 54‐year‐old male with BMI of 20.2 kg/m2 and SMI of 38.2 cm2/m2 (B). The highlighted areas indicate the isolated abdominal skeletal muscles at the third lumbar vertebra. BMI, body mass index; CT, computed tomography; SMI, skeletal muscle index
Statistical analyses were performed using SPSS v26.0 (IBM Inc., Armonk, New York). Nominal data were displayed as percentages and analyzed with two‐sided Pearson's χ 2 or Fisher's exact tests. Ordinal data were written as mean ± SD and analyzed using two‐sided Welch's t test or Mann‐Whitney U test. Statistical significance was determined at P < .05. Odds ratios (ORs) and 95% confidence intervals (CIs) were calculated for nominal variables.
Simple binary logistic regression analyses were performed for each independent variable on intraoperative, postoperative, and perioperative transfusion requirements. Significant variables on univariate regression were then included in the multivariate regression using the backward Wald method to identify independent predictors of transfusion requirements. Adjusted P values and ORs were calculated for those factors that remained significant in the final multivariate binary logistic regression model.
3. RESULTS
3.1. Cohort summary
A summary of the patient demographics, comorbidities, and intraoperative data can be found in Table 1. A total of 239 patients were included, which consisted predominantly of white (94.6%) males (68.21%) with average age of 60.4 ± 13.7 years and body mass index (BMI) of 25.7 ± 7.6 kg/m2. Significant smoking and alcohol abuse were present in 71.5% and 31.8% of patients, respectively. At least one major comorbidity (mCCI ≥ 1) was present in 62.8% of the cohort. Sarcopenia afflicted 25.9% of the study group. Most patients presented with advanced‐stage (stage III‐IV, 85.7%) squamous cell carcinoma (81.2%) of the aerodigestive tract (72.0%), 31.0% of whom had undergone prior chemotherapy and/or radiation therapy. Reconstruction utilized anterolateral thigh (36.8%), forearm (26.8%), fibula (19.7%), or other (16.7%) free flaps. Of these, 33.5% included an osseous component. The mean preoperative Hgb was 12.9 ± 1.9 mg/dL. Patients had an average operative time of 637 ± 169 minutes, were administered 5213 ± 2216 mL of intravenous fluids (IVF), and had EBL of 386 ± 335 mL. An intraoperative red blood cell transfusion was provided in 33.5% of patients.
TABLE 1.
Cohort preoperative and intraoperative summary
| Variable | All patients (n = 239) | Intraoperative transfusion | P value | OR (95% CI) | |
|---|---|---|---|---|---|
| No (n = 159) | Yes (n = 80) | ||||
| Age (y) | 60.4 ± 13.7 | 59.2 ± 14.2 | 62.9 ± 12.2 | .035 a | |
| Sex (M) | 68.2 | 69.2 | 66.3 | .661 b | 0.90 (0.49‐1.55) |
| Race (white) | 94.6 | 95.6 | 92.5 | .369 b | 0.57 (0.18‐1.75) |
| BMI (kg/m2) | 25.7 ± 7.6 | 26.3 ± 7.7 | 24.6 ± 7.3 | .088 a | |
| Underweight | 11.7 | 10.1 | 15.0 | .290 b | 1.58 (0.71‐3.52) |
| Normal | 45.6 | 45.9 | 45.0 | >.99 b | 0.96 (0.56‐1.65) |
| Overweight | 20.1 | 19.5 | 21.3 | .736 b | 1.11 (0.57‐2.16) |
| Obese | 22.6 | 24.5 | 18.8 | .331 b | 0.71 (0.36‐1.38) |
| Sarcopenia | 25.9 | 15.7 | 46.3 | <.001 b | 4.61 (2.50‐8.51) |
| Smoking | 71.5 | 69.2 | 76.3 | .289 b | 1.43 (0.77‐2.65) |
| Alcohol | 31.8 | 27.0 | 41.3 | .028 b | 1.89 (1.08‐3.34) |
| Diabetes | 15.5 | 14.5 | 17.5 | .572 b | 1.25 (0.61‐2.59) |
| HTN | 48.5 | 41.5 | 62.5 | .003 b | 2.35 (1.35‐4.08) |
| CVA | 4.6 | 3.8 | 6.3 | .514 b | 1.70 (0.50‐5.75) |
| CAD | 14.6 | 11.9 | 20.0 | .121 b | 1.84 (0.89‐3.81) |
| CHF | 10.5 | 6.3 | 18.8 | .006 b | 3.44 (1.47‐8.06) |
| PVD | 7.5 | 6.9 | 8.8 | .611 b | 1.29 (0.48‐3.47) |
| CKD | 5.9 | 3.8 | 10.0 | .077 b | 2.83 (0.95‐8.47) |
| COPD | 23.8 | 18.9 | 33.8 | .015 b | 2.19 (1.19‐4.03) |
| CT disorder | 2.9 | 2.5 | 3.8 | .689b | 1.51 (0.33‐6.92) |
| Liver failure | 2.1 | 0.6 | 5.0 | .044 b | 8.32 (0.91‐75.68) |
| mCCI e | <.001 d | ||||
| 0 | 37.2 | 46.5 | 18.8 | <.001 b | 0.27 (0.14‐0.50) |
| 1 | 23.4 | 23.3 | 23.8 | >.99 b | 1.03 (0.55‐1.93) |
| 2 | 18.8 | 13.8 | 28.7 | .008 b | 2.51 (1.30‐4.87) |
| ≥3 | 20.5 | 16.4 | 28.7 | .028 b | 2.06 (1.09‐3.92) |
| AJCC stage | .223 c | ||||
| I‐II | 14.3 | 16.6 | 10.0 | .239 b | 0.56 (0.24‐1.30) |
| III | 18.6 | 20.4 | 15.0 | .379 b | 0.59 (0.33‐1.43) |
| IV | 67.1 | 63.1 | 75.0 | .079 b | 1.76 (0.96‐3.21) |
| Tumor histology (SCC) | 81.2 | 79.9 | 83.8 | .599 b | 1.30 (0.64‐2.64) |
| Aerodigestive tumor | 72.0 | 71.1 | 73.8 | .761 b | 1.14 (0.62‐2.09) |
| Prior Chemo/XRT | 31.0 | 29.6 | 33.8 | .554 b | 1.21 (0.68‐2.16) |
| Free flap type | .004 c | ||||
| ALT | 36.8 | 35.2 | 40.0 | .481 b | 1.23 (0.71‐2.13) |
| Forearm | 26.8 | 32.7 | 15.0 | .003 b | 0.36 (0.18‐0.73) |
| Fibula | 19.7 | 20.1 | 18.8 | .864 b | 0.92 (0.46‐1.81) |
| Other | 16.7 | 11.9 | 26.3 | .009 b | 2.62 (1.31‐5.24) |
| Flap tissue (osseous) | 33.5 | 32.1 | 38.8 | .316 b | 1.34 (0.77‐2.35) |
| Operative time (min) | 637 ± 169 | 610 ± 152 | 691 ± 190 | .001 a | |
| Ischemia time (min) f | 106 ± 49 | 100 ± 45 | 119 ± 55 | .022 a | |
| IVF administered (mL) | 5213 ± 2216 | 4832 ± 2023 | 5970 ± 2394 | <.001 a | |
| Preoperative Hgb (g/dL) | 12.9 ± 1.9 | 13.5 ± 1.7 | 12.0 ± 1.9 | <.001 a | |
| EBL (mL) | 386 ± 335 | 273 ± 155 | 614 ± 461 | <.001 a | |
Note: Data presented as mean ± SD or percentage.
Significant analyses (P < 0.05) are listed in bold.
Abbreviations: AJCC, American Joint Committee on Cancer; ALT, anterolateral thigh; BMI, body mass index; CAD, coronary artery disease; Chemo/XRT, prior chemotherapy and/or radiation therapy; CHF, congestive heart failure; CI, confidence interval; CKD, chronic kidney disease; COPD, chronic obstructive pulmonary disorder; CT, connective tissue; CVA, cerebrovascular accident; EBL, estimated blood loss; Hgb, hemoglobin; HTN, hypertension; IVF, intravenous fluids; mCCI, modified Charlson Comorbidity Index; OR, odds ratio; PVD, peripheral vascular disease; RBC, red blood cells; SCC, squamous cell carcinoma.
Welch's t test, two‐sided.
Fisher's exact test, two‐sided.
Pearson's χ 2 test, two‐sided.
Mann‐Whitney U test, two‐sided.
Modified Charlson comorbidity index provided a weight of 1.0 for HTN, DM, CAD, CHF, CVA, COPD, PVD, and CT Disorder; 2.0 for CKD; and 3.0 for liver failure.
Ischemia time was recorded for n = 183 patients: n = 122 without transfusion, n = 61 with transfusion.
The 30‐day postoperative course is summarized in Table 2. A postoperative transfusion was provided to 66 patients (27.6%). The most frequent major complications after HNCFFR included returning to the operating room (17.2%), fistula (15.5%), and major pulmonary events (pneumonia, reintubation, or mechanical ventilation >48 hours; 12.6%). These often resulted in a prolonged stay (>48 hours) within the ICU (21.8%). Overall, 23.0% patients experienced a major complication (CD ≥ 3). Combining both intraoperative and 30‐day postoperative courses, 110 (46.0%) individuals received a perioperative transfusion.
TABLE 2.
Postoperative complications and transfusions
| Variable | All patients (n = 239) | Postoperative transfusion | P value | OR (95% CI) | |
|---|---|---|---|---|---|
| No (n = 173) | Yes (n = 66) | ||||
| Major cardiac event c | 1.7 | 0.6 | 4.5 | .065 a | 8.19 (0.84‐80.20) |
| Major pulmonary event d | 12.6 | 5.8 | 30.3 | <.001 a | 7.09 (3.10‐16.20) |
| Infectious complications | |||||
| SSI | 17.6 | 15.6 | 22.7 | .253 a | 1.59 (0.78‐3.23) |
| Sepsis | 2.5 | 1.2 | 6.1 | .051 a | 5.52 (0.99‐30.87) |
| CVA | 1.3 | 0.6 | 3.0 | .186 a | 5.38 (0.48‐60.30) |
| ARI/ARF | 0.4 | 0.0 | 1.5 | .276 a | N/A |
| Surgical complications | |||||
| Fistula | 15.5 | 11.6 | 25.8 | .009 a | 2.65 (1.29‐5.47) |
| Flap failure | 4.6 | 0.6 | 15.2 | <.001 a | 30.71 (3.85‐245.3) |
| Bleeding event e | 5.9 | 2.9 | 13.6 | .003 a | 5.31 (1.71‐16.49) |
| Seroma | 4.6 | 3.5 | 7.6 | .182 a | 2.28 (0.67‐7.75) |
| Chyle leak | 2.5 | 1.7 | 4.5 | .351 a | 2.70 (0.53‐13.72) |
| Return to operating room | 17.2 | 7.5 | 42.4 | <.001 a | 9.07 (4.30‐19.14) |
| Inpatient readmission | 12.1 | 10.4 | 16.7 | .190 a | 1.72 (0.77‐3.87) |
| ICU stay | |||||
| Total (d) | 3.0 ± 3.2 | 2.3 ± 1.2 | 5.0 ± 5.4 | <.001 b | |
| Prolonged (≥48 h) | 21.8 | 11.6 | 48.5 | <.001 a | 7.20 (3.68‐14.08) |
| CD ≥ 3 | 23.0 | 12.7 | 50.0 | <.001 a | 6.86 (3.56‐13.25) |
Note: Data presented as mean ± SD or percentage.
Significant analyses (P < 0.05) are listed in bold.
Abbreviations: ARI/ARF, acute renal insufficiency or acute renal failure; CD, Clavien‐Dindo score; CI, confidence interval; CVA, cerebrovascular accident; ICU, intensive care unit; OR, odds ratio; SSI, surgical site infection.
Fisher's exact test, two‐sided.
Mann‐Whitney U test, two‐sided.
Major cardiac events include myocardial infarction and cardiac arrest.
Major pulmonary events included pneumonia, reintubation, and prolonged (>48 hours) ventilator use.
Bleeding event includes hematomas and hemorrhages (ie, carotid blowout).
3.2. Factors associated with transfusions
A comparison of intra‐ and postoperatively transfused and nontransfused patients are displayed in Tables 1 and 2, respectively. Those receiving a transfusion during surgery were older (62.9 ± 12.2 vs 59.2 ± 14.2, P = .035), sarcopenic (46.3% vs 15.7%, P < .001), with lower preoperative Hgb (12.0 ± 1.0 vs 13.5 ± 1.7 g/dL, P < .001), higher mCCI (P < .001), and more alcohol abuse (41.3% vs 27.0%, P = .028). No difference was noted between sex, race, BMI, smoking, cancer stage, histology, or chemoradiation histories. Intraoperative transfusions were associated with non‐forearm flaps (85.0% vs 67.2%, P = .003), longer operative (691 ± 190 vs 610 ± 152 min, P = .001) and ischemia times (119 ± 55 vs 100 ± 45 min, P = .022), and greater IVF (5970 ± 2394 vs 4832 ± 2023 mL, P < .001) and EBL (614 ± 461 vs 273 ± 155 mL, P < .001).
Thirty‐day postoperative transfusions were associated with postoperative complications. Specifically, a transfusion was more likely in those incurring a major pulmonary complication, (30.3% vs 5.8%, P < .001), major bleeding event (hemorrhage or hematoma; 13.6% vs 2.9%, P = .003), postoperative fistula (25.8% vs 11.6%, P = .009), flap failure (15.2% vs 0.6%, P < .001), return to operating room (42.4% vs 7.5%, P < .001), and prolonged ICU stay (48.5% vs 11.6%, P < .001). When accounting for all complications, those classified as major (CD ≥ 3) were more common in the postoperatively transfused group (50.0% vs 12.7%, P < .001).
3.3. Binary logistic regressions of transfusion
Tables 3 and 4 summarize the univariate and multivariate binary logistic regressions of the predictive variables for intraoperative, postoperative, and overall perioperative transfusions. The final model of intraoperative transfusion included sarcopenia (P = .023, OR [95% CI] = 3.34 [1.18‐9.46]), preoperative Hgb (P = .002, OR = 0.61 [0.45‐0.83]), operative time (P = .036, OR = 1.003 [1.000‐1.007]), and EBL (P < .001, OR = 1.006 [1.003‐1.009]). Postoperative transfusion alone was predicted by preoperative Hgb (P = .007, OR = 0.72 [0.57‐0.92]), osseous flap (P = .036, OR = 2.54 [1.06‐6.06]), and CD ≥3 (P < .001, OR = 8.30 [3.35‐20.56]). The final regression model of receiving a 30‐day perioperative transfusion including all pre‐, intra‐, and postoperative variables demonstrated sarcopenia (P = .021, OR = 2.83 [1.17‐6.86]), preoperative Hgb (P < .001, OR = 0.059 [0.46‐0.76]), operative time (P = .008, OR = 1.004 [1.001‐1.006]), and CD ≥ 3 (P = .018, OR 2.98 [1.20‐7.39]) as independent predictive factors.
TABLE 3.
Binary logistic regression of intraoperative transfusion requirements
| Variable | Univariate | Multivariate | ||
|---|---|---|---|---|
| P value | OR (95% CI) | P value | OR (95% CI) | |
| Sex (male) | .646 | 0.87 (0.49‐1.55) | ||
| Race (white) | .324 | 0.57 (0.18‐1.75) | ||
| Age (y) | .046 | 1.02 (1.00‐1.04) | ||
| BMI (kg/m2) | .097 | 0.97 (0.93‐1.01) | ||
| Smoking | .254 | 1.43 (0.77‐2.65) | ||
| Alcohol | .027 | 1.89 (1.08‐3.34) | ||
| Sarcopenia | <.001 | 4.61 (2.50‐8.51) | .023 | 3.34 (1.18‐9.46) |
| mCCI (continuous) | <.001 | 1.37 (1.16‐1.62) | .013 | 1.49 (1.09‐2.05) |
| AJCC stage | ||||
| I‐II | .177 | 0.56 (0.24‐1.30) | ||
| III | .315 | 0.69 (0.33‐1.43) | ||
| IV | .066 | 1.76 (0.96‐3.21) | ||
| Aerodigestive tumor | .663 | 1.14 (0.63‐2.09) | ||
| Cancer histology (SCC) | .470 | 1.30 (0.64‐2.64) | ||
| Prior Chemo/XRT | .509 | 1.21 (0.68‐2.16) | ||
| Preoperative Hgb (g/dL) | <.001 | 0.63 (0.52‐0.76) | .002 | 0.61 (0.45‐0.83) |
| Free flap type | ||||
| ALT | .470 | 1.23 (0.71‐2.13) | ||
| Forearm | .004 | 0.36 (0.18‐0.73) | ||
| Fibula | .801 | 0.92 (0.46‐1.81) | ||
| Other | .006 | 2.62 (1.31‐5.24) | ||
| Flap tissue (osseous) | .306 | 1.34 (0.77‐2.35) | ||
| Operative time (min) | .001 | 1.003 (1.001‐1.005) | .036 | 1.003 (1.000‐1.007) |
| Ischemia time (min) | .016 | 1.008 (1.001‐1.014) | ||
| EBL (mL) | <.001 | 1.007 (1.005‐1.010) | <.001 | 1.006 (1.003‐1.009) |
| IVF (mL) | <.001 | 1.000 (1.000‐1.000) | ||
Note: All values with P < .10 upon univariate regression (bold) modeling were including in the initial multivariate model. Those variables with P < .05 on multivariate analysis using the backward Wald method were included in the final model and listed above.
Abbreviations: AJCC, American Joint Committee on Cancer; ALT, anterolateral thigh; BMI, body mass index; Chemo/XRT, chemotherapy and/or radiation therapy; CI, confidence interval; EBL, estimated blood loss; Hgb, hemoglobin; IVF, intravenous fluids; mCCI, modified Charlson Comorbidity Index; OR, odds ratio; SCC, squamous cell carcinoma.
TABLE 4.
Binary logistic regression of postoperative and perioperative transfusion requirements
| Variable | Postoperative | Perioperative | ||||||
|---|---|---|---|---|---|---|---|---|
| Univariate | Multivariate | Univariate | Multivariate | |||||
| P value | OR (95% CI) | P value | OR (95% CI) | P value | OR (95% CI) | P value | OR (95% CI) | |
| Sex (male) | .350 | 0.75 (0.41‐1.37) | .163 | 0.68 (0.39‐1.17) | ||||
| Race (white) | .038 | 0.303 (0.10‐0.94) | .256 | 0.51 (0.16‐1.62) | ||||
| Age (y) | .700 | 1.00 (0.98‐1.03) | .187 | 1.01 (0.99‐1.03) | ||||
| BMI (kg/m2) | .036 | 0.95 (0.91‐0.99) | .007 | 0.95 (0.91‐0.99) | ||||
| Smoking | .374 | 1.34 (0.70‐2.57) | .344 | 1.32 (0.75‐2.32) | ||||
| Alcohol | .014 | 2.10 (1.16‐3.79) | .051 | 1.73 (1.00‐2.99) | ||||
| Sarcopenia | .025 | 2.03 (1.10‐3.76) | <.001 | 3.72 (2.00‐6.90) | .021 | 2.83 (1.17‐6.86) | ||
| mCCI | .001 | 1.31 (1.11‐1.54) | <.001 | 1.36 (1.14‐1.61) | ||||
| AJCC stage IV | .080 | 1.78 (0.93‐3.83) | .024 | 1.90 (1.09‐3.32) | ||||
| Aerodigestive tumor | .629 | 1.17 (0.62‐2.23) | .596 | 1.17 (0.66‐2.06) | ||||
| Histology (SCC) | .342 | 0.71 (0.36‐1.43) | .924 | 0.97 (0.51‐1.86) | ||||
| Prior Chemo/XRT | .892 | 0.96 (0.52‐1.77) | .409 | 1.26 (.73‐2.18) | ||||
| Preop Hgb (g/dL) | .002 | 0.76 (0.65‐0.90) | .007 | 0.72 (0.57‐0.92) | <.001 | 0.63 (0.52‐0.75) | <.001 | 0.59 (0.46‐0.76) |
| Free flap type | ||||||||
| ALT | .611 | 1.16 (0.65‐2.09) | .502 | 1.20 (0.71‐2.03) | ||||
| Forearm | .001 | 0.24 (0.10‐0.56) | <.001 | 0.32 (0.17‐0.60) | ||||
| Fibula | .146 | 1.65 (0.84‐3.26) | .440 | 1.29 (0.68‐2.45) | ||||
| Other | .058 | 1.99 (0.98‐4.04) | .010 | 2.54 (1.25‐5.16) | ||||
| Flap tissue (osseous) | .005 | 2.32 (1.29‐4.15) | .036 | 2.54 (1.06‐6.06) | .025 | 1.86 (1.08‐3.19) | ||
| Operative time (min) | .008 | 1.002 (1.001‐1.004) | .001 | 1.003 (1.001‐1.004) | .008 | 1.004 (1.001‐1.006) | ||
| Ischemia time (min) | .010 | 1.009 (1.02‐1.015) | .014 | 1.008 (1.002‐1.014) | ||||
| EBL (mL) | .004 | 1.001 (1.000‐1.002) | <.001 | 1.007 (1.005‐1.009) | ||||
| IVF (mL) | .442 | 1.000 (1.000‐1.000) | .015 | 1.000 (1.000‐1.000) | ||||
| Intraoperative transfusion | <.001 | 3.52 (1.94‐6.37) | ||||||
| CD ≥ 3 | <.001 | 6.86 (3.56‐13.25) | <.001 | 8.30 (3.35‐20.56) | <.001 | 3.48 (1.83‐6.62) | .018 | 2.98 (1.20‐7.39) |
Note: A total of n = 66 thirty‐day postoperative and n = 110 perioperative (intra‐ and postoperative) blood transfusions occurred. All values with P < .05 upon univariate regression (bold) modeling were including in the initial multivariate model. Those variables with P < .05 on multivariate analysis using the backward Wald method were included in the final model and listed above.
Abbreviations: AJCC, American Joint Committee on Cancer; ALT, anterolateral thigh; BMI, body mass index; CD, Clavien‐Dindo score; Chemo/XRT, chemotherapy and/or radiation therapy; CI, confidence interval; EBL, estimated blood loss; Hgb, hemoglobin; IVF, intravenous fluids; mCCI, modified Charlson Comorbidity Index; OR, odds ratio; SCC, squamous cell carcinoma.
4. DISCUSSION
Herein we identified those patients and characteristics most likely to predict transfusion in HNCFFR. This population is at highest risk of requiring transfusion among head and neck surgeries due to the magnitude of resection and reconstruction required. After separation of transfusions into intra‐, post‐, and perioperative transfusions, sarcopenia remained an independent predictor of intraoperative and perioperative transfusions in this extensive analysis of pre‐, intra‐, and postoperative variables. To the best of our knowledge, our study is the first to separate transfusions into these different time frames and analyze them separately.
CT‐quantified SMM has remained a reliable, anthropometric measurement to identify patients at risk for postoperative complications and mortality across HNC and/or FFR patients. 20 , 21 , 22 , 23 , 24 , 25 , 26 , 27 Given that CT imaging is obtained in almost all HNCFFR cases, it would be prudent to extract as much information as possible from these diagnostic tests. Optimally, SMI measurements would be combined with clinical testing of strength and functionality to fit the most recent iteration of sarcopenia. 10 However, radiologically determined sarcopenia alone harbors substantial evidence of its negative effect in medical comorbidity and mortality. 11 , 12 , 13 , 14 , 15 , 16 , 17 , 18 , 19 , 20 , 21 , 22 , 23 , 24 , 25 , 26 , 27 To the best our knowledge, investigations combining SMM and strength/function measurements have not yet been performed in HNCFFR to suggest any improved postoperative prognostication.
Although SMI and BMI are correlated, 20 , 27 , 38 BMI does not differentiate between adipose or muscle composition. For instance, patients can have low SMI yet have normal or obese BMI. The converse can also be true with low BMI but normal SMI. BMI has not demonstrated any significant effect on 30‐day postoperative complications, transfusion rates, or mortality in HNCFFR. 39 , 40 However, SMI has been compellingly linked to a number of postoperative complications and survival in HNCFFR. 20 , 21 , 22 , 23 , 24 , 25 , 27 This study supplements those prior findings by demonstrating SMI as a more robust predictor of transfusions in HNCFFR than BMI. Therefore, significant evidence suggests the superiority of SMI to BMI in preoperative risk stratification in HNCFFR, which has been previously validated in lung and gastrointestinal malignancies. 41
The reported rates of sarcopenia in HNC range from 28.3% to 77%. 20 , 21 , 22 , 23 , 24 , 25 This variance may be attributed to the discrepancy of SMI cutoff values, the specific skeletal muscles measured, whether males and females had separate cutoff criteria, and the study group tumor characteristics. The sarcopenia cutoff values in this investigation were based on the 5th percentile of SMIs in a healthy, adult, Caucasian population. 38 Cutoffs for other HNC investigations 21 , 22 , 23 , 24 , 25 were established from a study of chemotherapy dose‐limited toxicity in HNC 42 or other cancer studies that do not involve HNC. 41 , 43 While other studies have analyzed sarcopenia prevalence at one head and neck tumor location, 21 , 22 , 23 , 24 , 25 this investigation included malignancies of all head and neck subsites rather than one specific region. Some studies have used cervical muscle instead of abdominal muscle to measure SMI. 22 , 26 These incongruencies may account for the variance of reported HNC sarcopenia rates. Large population‐based studies are needed to adequately determine SMI cutoff values to promote homogeneity in definitions and reported incidences.
Regardless of variable prevalence, sarcopenia in the HNC population is considerable. Its occurrence and etiology are similar to other advanced malignancies that impair nutritional and/or functional status. 11 , 12 , 44 , 45 Malnutrition in HNC is partially attributed to the high rates of alcohol abuse. Furthermore, advanced aerodigestive malignancy prevents the ingestion of food due to pain, physical obstruction, or functional dysphagia and aspiration. Cancer cachexia plays a prominent role by upregulating degradation and impairing anabolism of skeletal muscle. 46 Due to considerable rates of tobacco and ethanol use, HNC patients also have greater incidences of major comorbidities including COPD, CHF, CVA, PVD, and CAD. These diseases limit physical capacity to promote sedentary lifestyles and muscular atrophy.
Our study and prior literature have reported intraoperative and total perioperative transfusion rates in HNCFFR ranging 24.6% to 33.5% and 46.0% to 82.0%, respectively. 8 , 47 , 48 , 49 This high incidence is partly attributed to preoperative anemia frequently identified in HNC patients. 49 , 50 , 51 It is intuitive that certain comorbidities (e.g., renal failure), low Hgb, and more extensive resections or reconstructions with greater blood loss would elevate transfusion requirements, as identified in our and others' reports. 49 , 50 , 52 Including HNC patients undergoing free or pedicled flap reconstruction, Weber et al identified low preoperative Hgb, advanced T‐stage, and FFR as factors conferring the highest risk of perioperative transfusion. 50 Shah et al, although without evaluation of blood loss, determined female sex, advanced T‐stage, underweight BMI, low preoperative Hgb, and osseous flaps as predictors of intraoperative transfusion. 49 In a broader study on FFR, Kolbenschlag et al identified age > 60 years, myocutaneous flaps, low preoperative Hgb and platelets, and cardiac or renal insufficiency as predictors of intraoperative transfusion. 52 Only 5% of their 398 FFR involved the head/neck or trunk, however, and no records of EBL or change in Hgb were included. Our investigation identified similar results to these investigations on univariate analysis, but the inclusion of sarcopenia on multivariate regression failed to identify low BMI, advanced cancer stage, or flap type as independent predictors. This suggests preoperative sarcopenia may be a more powerful representation and predictor of the patient's response to their malignancy and surgery.
The exact etiology for increased transfusions in sarcopenia remains elusive. One explanation could be the smaller body volume reserve within sarcopenic patients, a phenomenon that has been observed in underweight patients. 40 However, BMI was insignificant after accounting for SMI in this study. We believe this can be attributed to the relatively higher vascular supply and density of skeletal muscle than adipose. Sarcopenic patients also have reduced SMM and capillary density, both which would diminish patient total blood volume and increase the relative detriment of blood loss. 28 Another argument for elevated transfusion is the extent of resection, evidenced by sarcopenic patients tending to have more advanced local disease, undergo more complex resections, and require reconstruction with flaps other than the smaller forearm free flaps. 20 With that speculation, the assumption would be that greater EBL would account for the need for transfusions, yet that was not observed in our results. There remains the possibility that EBL values were inaccurate as it is a crude approximation of volume, but the inaccuracy would arguably be distributed across patients equally. Another consideration is the physician's judgment for providing transfusion, as each anesthesiologist has their own tendencies regardless of guidelines. Regarding specifically postoperative transfusions, low Hgb and incurring a major postoperative complication are logical causes of requiring a transfusion, for which sarcopenia was not an independent predictor. Despite an unclear cause, the link between sarcopenia and transfusion requirements has been similarly documented in other investigations. 30 , 31 , 32 , 33
To mitigate the deleterious consequences of administering blood products, investigations have sought the use of more restrictive transfusion guidelines in otherwise asymptomatic patients. Studies in otolaryngology and other fields have not identified worse outcomes with more restrictive transfusion. 47 , 53 , 54 , 55 Investigations of these thresholds in sarcopenia patients may demonstrate different appropriate transfusion criteria.
Several implications exist for identifying preoperative sarcopenia in HNCFFR. As these patients are more likely to have transfusions, there is an expected increase in hospital cost and potential postoperative complications. 2 , 5 , 6 , 7 This should be discussed with the patient preoperatively and be considered in the setting of scarce blood product supply. Preoperative ABO cross‐matching and blood product preparation should be performed. Special attention should be made to hemostasis and IVF administration to prevent dilution and unnecessary blood loss. Patients with sarcopenia should also have multimodal, preoperative nutrition and rehabilitation maximized in order to minimize the effects of sarcopenia and major surgery. 56 , 57
Several limitations to this study exist. It is retrospective and therefore subject to bias of the medical documentation and interpretation. Due to limited recording, we did not include any preoperative nutrition or inflammatory laboratory values that have demonstrated a negative effect on surgical outcomes. 40 , 44 , 58 , 59 , 60 Our sample size is limited by patients with preoperative CT imaging of the abdomen, which generally are limited to those patients with positron emission tomography (PET) CT scans or CT angiograms. Furthermore, the CT scans must be of adequate quality to measure skeletal muscle (e.g., metallic screws in vertebrae that distort images). Utilizing cervical CT scans instead of abdominal CT scans to calculate SMI would increase the available population for sampling due to commonplace use in head and neck surgery. Calculating SMI using cervical skeletal muscle on head and neck CT imaging has been reported in several studies. These investigators estimated abdominal SMI using an equation that includes cervical skeletal muscle values and subsequently determined sarcopenia from those calculations. 22 , 23 , 25 , 26 , 42 , 61 Further investigations are required to define sarcopenia cutoff values using healthy, population‐based, cervical SMI values rather than determining sarcopenia from multivariable extrapolation.
5. CONCLUSIONS
Sarcopenia is associated with intraoperative and perioperative transfusions in HNCFFR and therefore may increase the risk of transfusion‐related complications. These should be discussed with patients preoperatively and taken into consideration in settings of limited blood product availability.
CONFLICT OF INTEREST
The authors declare no potential conflict of interest.
ACKNOWLEDGMENT
This work was supported in part by: The Department of Surgery and The Department of Otolaryngology–Head and Neck Surgery at Indiana University School of Medicine; V Foundation for Cancer Research (V2017‐021) to A. B.; American Cancer Society (132013‐RSG‐010‐01‐CCG) to A. B.
Jones AJ, Campiti VJ, Alwani M, et al. Sarcopenia is associated with blood transfusions in head and neck cancer free flap surgery. Laryngoscope Investigative Otolaryngology. 2021;6:200–210. 10.1002/lio2.530
Meeting Information: This manuscript was presented at The Triological Society 2020 Combined Sections Meeting in Coronado, CA, USA on January 23 to 25, 2020.
Funding information American Cancer Society, Grant/Award Number: 132013‐RSG‐010‐01‐CCG; V Foundation for Cancer Research, Grant/Award Number: V2017‐021
REFERENCES
- 1. Dort JC, Farwell DG, Findlay M, et al. Optimal perioperative care in major head and neck cancer surgery with free flap reconstruction: a consensus review and recommendations from the enhanced recovery after surgery society. JAMA Otolaryngol Head Neck Surg. 2017;143(3):292‐303. 10.1001/jamaoto.2016.2981. [DOI] [PubMed] [Google Scholar]
- 2. Delaney M, Wendel S, Bercovitz RS, et al. Transfusion reactions: prevention, diagnosis, and treatment. Lancet. 2016;388(10061):2825‐2836. 10.1016/S0140-6736(15)01313-6. [DOI] [PubMed] [Google Scholar]
- 3. Wong AK, Nguyen T, Peric M, et al. Analysis of risk factors associated with microvascular free flap failure using a multi‐institutional database. Microsurgery. 2015;35(1):6‐12. 10.1002/micr.22223. [DOI] [PubMed] [Google Scholar]
- 4. Kim MJ, Woo KJ, Park BY, Kang SR. Effects of transfusion on free flap survival: searching for an optimal hemoglobin threshold for transfusion. J Reconstr Microsurg. 2018;34(8):610‐615. 10.1055/s-0038-1648244. [DOI] [PubMed] [Google Scholar]
- 5. Appleton SE, Ngan A, Kent B, Morris SF. Risk factors influencing transfusion rates in DIEP flap breast reconstruction. Plast Reconstr Surg. 2011;127(5):1773‐1782. 10.1097/PRS.0b013e31820cf1dd. [DOI] [PubMed] [Google Scholar]
- 6. McMahon JD, Maciver C, Smith M, et al. Postoperative complications after major head and neck surgery with free flap repair ‐ prevalence, patterns, and determinants: a prospective cohort study. Br J Oral Maxillofac Surg. 2013;51(8):689‐695. 10.1016/j.bjoms.2013.04.015. [DOI] [PubMed] [Google Scholar]
- 7. Garg RK, Wieland AM, Hartig GK, Poore SO. Risk factors for unplanned readmission following head and neck microvascular reconstruction: results from the National Surgical Quality Improvement Program, 2011–2014. Microsurgery. 2017;37(6):502‐508. 10.1002/micr.30116. [DOI] [PubMed] [Google Scholar]
- 8. Danan D, Smolkin ME, Varhegyi NE, Bakos SR, Jameson MJ, Shonka DC. Impact of blood transfusions on patients with head and neck cancer undergoing free tissue transfer. Laryngoscope. 2015;125(1):86‐91. 10.1002/lary.24847. [DOI] [PubMed] [Google Scholar]
- 9. Fischer D, Neb H, Choorapoikayil S, Zacharowski K, Meybohm P. Red blood cell transfusion and its alternatives in oncologic surgery—a critical evaluation. Crit Rev Oncol Hematol. 2019;134:1‐9. 10.1016/j.critrevonc.2018.11.011. [DOI] [PubMed] [Google Scholar]
- 10. Cruz‐Jentoft AJ, Bahat GG, Bauer JJ, et al. Sarcopenia: revised European consensus on definition and diagnosis. Age Ageing. 2019;48(1):16‐31. 10.1093/ageing/afy169. [DOI] [PMC free article] [PubMed] [Google Scholar]
- 11. Mintziras I, Miligkos M, Wachter S, Manoharan J, Maurer E, Bartsch DK. Sarcopenia and sarcopenic obesity are significantly associated with poorer overall survival in patients with pancreatic cancer: systematic review and meta‐analysis. Int J Surg. 2018;59:19‐26. 10.1016/j.ijsu.2018.09.014. [DOI] [PubMed] [Google Scholar]
- 12. Yang M, Shen Y, Tan L, Li W. Prognostic value of sarcopenia in lung cancer: a systematic review. Chest. 2019;156(1):101‐111. 10.1016/j.chest.2019.04.115. [DOI] [PubMed] [Google Scholar]
- 13. Shachar SS, Williams GR, Muss HB, Nishijima TF. Prognostic value of sarcopenia in adults with solid tumours: a meta‐analysis and systematic review. Eur J Cancer. 2016;57:58‐67. 10.1016/j.ejca.2015.12.030. [DOI] [PubMed] [Google Scholar]
- 14. Lee JS, Kim YS, Kim EY, Jin W. Prognostic significance of CT‐determined sarcopenia in patients with advanced gastric cancer. PLoS One. 2018;13(8):e0202700. 10.1371/journal.pone.0202700. [DOI] [PMC free article] [PubMed] [Google Scholar]
- 15. Elliott JA, Doyle SL, Murphy CF, et al. Sarcopenia: prevalence, and impact on operative and oncologic outcomes in the multimodal management of locally advanced esophageal cancer. Ann Surg. 2017;266(5):822‐830. 10.1097/SLA.0000000000002398. [DOI] [PubMed] [Google Scholar]
- 16. Simonsen C, De HP, Bjerre ED, et al. Sarcopenia and postoperative complication risk in gastrointestinal surgical oncology: a meta‐analysis. Ann Surg. 2018;268(1):58‐69. 10.1097/SLA.0000000000002679. [DOI] [PubMed] [Google Scholar]
- 17. Silva de Paula N, de Aguiar Bruno K, Azevedo Aredes M, Gabriela VC. Sarcopenia and skeletal muscle quality as predictors of postoperative complication and early mortality in gynecologic cancer. Int J Gynecol Cancer. 2018;28(2):412‐420. 10.1097/IGC.0000000000001157. [DOI] [PubMed] [Google Scholar]
- 18. Kamarajah SK, Bundred J, Tan BHL. Body composition assessment and sarcopenia in patients with gastric cancer: a systematic review and meta‐analysis. Gastric Cancer. 2019;22(1):10‐22. 10.1007/s10120-018-0882-2. [DOI] [PubMed] [Google Scholar]
- 19. Jones K, Gordon‐Weeks A, Coleman C, Silva M. Radiologically determined sarcopenia predicts morbidity and mortality following abdominal surgery: a systematic review and meta‐analysis. World J Surg. 2017;41(9):2266‐2279. 10.1007/s00268-017-3999-2. [DOI] [PMC free article] [PubMed] [Google Scholar]
- 20. Alwani MM, Jones AJ, Novinger LJ, et al. Impact of sarcopenia on outcomes of autologous head and neck free tissue reconstruction. J Reconstr Microsurg. 2020;36(5):369‐378. 10.1055/s-0040-1701696. [DOI] [PubMed] [Google Scholar]
- 21. Tamaki A, Manzoor NF, Babajanian E, Ascha M, Rezaee R, Zender CA. Clinical significance of sarcopenia among patients with advanced oropharyngeal cancer. Otolaryngol Head Neck Surg. 2019;160(3):480‐487. 10.1177/0194599818793857. [DOI] [PubMed] [Google Scholar]
- 22. Bozkurt GG, Elhassan HA, Mahmutoglu AS, et al. Neck muscle mass index as a predictor of post‐laryngectomy wound complications. Ann Otol Rhinol Laryngol. 2018;127(11):841‐847. 10.1177/0003489418798660. [DOI] [PubMed] [Google Scholar]
- 23. Bril SI, Pezier TF, Tijink BM, Janssen LM, Braunius WW, de Bree R. Preoperative low skeletal muscle mass as a risk factor for pharyngocutaneous fistula and decreased overall survival in patients undergoing total laryngectomy. Head Neck. 2019;41(6):1745‐1755. 10.1002/hed.25638. [DOI] [PMC free article] [PubMed] [Google Scholar]
- 24. Achim V, Bash J, Mowery A, et al. Prognostic indication of sarcopenia for wound complication after total laryngectomy. JAMA Otolaryngol Head Neck Surg. 2017;143(12):1159‐1165. 10.1001/jamaoto.2017.0547. [DOI] [PubMed] [Google Scholar]
- 25. Chargi N, Bril SI, Swartz JE, Wegner I, Willems SM, de Bree R. Skeletal muscle mass is an imaging biomarker for decreased survival in patients with oropharyngeal squamous cell carcinoma. Oral Oncol. 2020;101:104519. 10.1016/j.oraloncology.2019.104519. [DOI] [PubMed] [Google Scholar]
- 26. Swartz JE, Pothen AJ, Wegner I, et al. Feasibility of using head and neck CT imaging to assess skeletal muscle mass in head and neck cancer patients. Oral Oncol. 2016;62:28‐33. 10.1016/j.oraloncology.2016.09.006. [DOI] [PubMed] [Google Scholar]
- 27. Jones AJ, Campiti VJ, Alwani M, et al. Skeletal muscle index's impact on discharge disposition after head and neck cancer free flap reconstruction. Otolaryngol Head Neck Surg. 2020. 10.1177/0194599820973232. [DOI] [PubMed] [Google Scholar]
- 28. Prior SJ, Ryan AS, Blumenthal JB, Watson JM, Katzel LI, Goldberg AP. Sarcopenia is associated with lower skeletal muscle capillarization and exercise capacity in older adults. J Gerontol A Biol Sci Med Sci. 2016;71(8):1096‐1101. 10.1093/gerona/glw017. [DOI] [PMC free article] [PubMed] [Google Scholar]
- 29. Joyner MJ, Casey DP. Regulation of increased blood flow (hyperemia) to muscles during exercise: a hierarchy of competing physiological needs. Physiol Rev. 2015;95(2):549‐601. 10.1152/physrev.00035.2013. [DOI] [PMC free article] [PubMed] [Google Scholar]
- 30. Jochum SB, Kistner M, Wood EH, et al. Is sarcopenia a better predictor of complications than body mass index? Sarcopenia and surgical outcomes in patients with rectal cancer. Colorectal Dis. 2019;21(12):1372‐1378. 10.1111/codi.14751. [DOI] [PubMed] [Google Scholar]
- 31. Bekki T, Abe T, Amano H, et al. Impact of low skeletal muscle mass index and perioperative blood transfusion on the prognosis for HCC following curative resection. BMC Gastroenterol. 2020;20(1):328. 10.1186/s12876-020-01472-z. [DOI] [PMC free article] [PubMed] [Google Scholar]
- 32. Chang CD, Wu JS, Mhuircheartaigh JN, et al. Effect of sarcopenia on clinical and surgical outcome in elderly patients with proximal femur fractures. Skeletal Radiol. 2018;47(6):771‐777. 10.1007/s00256-017-2848-6. [DOI] [PubMed] [Google Scholar]
- 33. Bokshan SL, Han A, Depasse JM, Marcaccio SE, Eltorai AEM, Daniels AH. Inpatient costs and blood transfusion rates of sarcopenic patients following thoracolumbar spine surgery. J Neurosurg Spine. 2017;27(6):676‐680. 10.3171/2017.5.SPINE17171. [DOI] [PubMed] [Google Scholar]
- 34. Charlson ME, Pompei P, Ales KL, MacKenzie CR. A new method of classifying prognostic comorbidity in longitudinal studies: development and validation. J Chronic Dis. 1987;40(5):373‐383. 10.1016/0021-9681(87)90171-8. [DOI] [PubMed] [Google Scholar]
- 35. Lakomkin N, Zuckerman SL, Stannard B, et al. Preoperative risk stratification in spine tumor surgery: a comparison of the modified Charlson Index, Frailty Index, and ASA Score. Spine. 2019;44(13):E782‐E787. 10.1097/BRS.0000000000002970. [DOI] [PubMed] [Google Scholar]
- 36. Amin MB, Edge SB, Greene FL, et al., eds. AJCC Cancer Staging Manual. 8th ed. New York: Springer; 2017. [Google Scholar]
- 37. Dindo D, Demartines N, Clavien P‐A. Classification of surgical complications: a new proposal with evaluation in a cohort of 6336 patients and results of a survey. Ann Surg. 2004;240(2):205‐213. 10.1097/01.sla.0000133083.54934.ae. [DOI] [PMC free article] [PubMed] [Google Scholar]
- 38. van der Werf A, Langius JAE, de van der Schueren MAE, et al. Percentiles for skeletal muscle index, area and radiation attenuation based on computed tomography imaging in a healthy Caucasian population. Eur J Clin Nutr. 2018;72(2):288‐296. 10.1038/s41430-017-0034-5. [DOI] [PMC free article] [PubMed] [Google Scholar]
- 39. Hyun D‐J, Joo Y‐H, Kim M‐S. Impact of pre‐operative body mass index in head and neck cancer patients undergoing microvascular reconstruction. J Laryngol Otol. 2017;131(11):972‐976. 10.1017/S0022215117001876. [DOI] [PubMed] [Google Scholar]
- 40. Crippen MM, Brady JS, Mozeika AM, Eloy JA, Baredes S, Park RCW. Impact of body mass index on operative outcomes in head and neck free flap surgery. Otolaryngol Head Neck Surg. 2018;159(5):817‐823. 10.1177/0194599818777240. [DOI] [PubMed] [Google Scholar]
- 41. Martin L, Birdsell L, Macdonald N, et al. Cancer cachexia in the age of obesity: skeletal muscle depletion is a powerful prognostic factor, independent of body mass index. J Clin Oncol. 2013;31(12):1539‐1547. 10.1200/JCO.2012.45.2722. [DOI] [PubMed] [Google Scholar]
- 42. Wendrich AW, Swartz JE, Bril SI, et al. Low skeletal muscle mass is a predictive factor for chemotherapy dose‐limiting toxicity in patients with locally advanced head and neck cancer. Oral Oncol. 2017;71:26‐33. 10.1016/j.oraloncology.2017.05.012. [DOI] [PubMed] [Google Scholar]
- 43. Prado CMM, Lieffers JR, McCargar LJ, et al. Prevalence and clinical implications of sarcopenic obesity in patients with solid tumours of the respiratory and gastrointestinal tracts: a population‐based study. Lancet Oncol. 2008;9(7):629‐635. 10.1016/S1470-2045(08)70153-0. [DOI] [PubMed] [Google Scholar]
- 44. Feliciano EMC, Kroenke CH, Meyerhardt JA, et al. Association of systemic inflammation and sarcopenia with survival in nonmetastatic colorectal cancer: results from the C SCANS study. JAMA Oncol. 2017;3(12):e172319. 10.1001/jamaoncol.2017.2319. [DOI] [PMC free article] [PubMed] [Google Scholar]
- 45. Zhuang C‐L, Huang D‐D, Pang W‐Y, et al. Sarcopenia is an independent predictor of severe postoperative complications and long‐term survival after radical gastrectomy for gastric cancer: analysis from a large‐scale cohort. Medicine. 2016;95(13):e3164. 10.1097/MD.0000000000003164. [DOI] [PMC free article] [PubMed] [Google Scholar]
- 46. Cruz‐Jentoft AJ, Sayer AA. Sarcopenia. Lancet. 2019;393(10191):2636‐2646. 10.1016/S0140-6736(19)31138-9. [DOI] [PubMed] [Google Scholar]
- 47. Puram SV, Yarlagadda BB, Sethi R, et al. Transfusion in head and neck free flap patients: practice patterns and a comparative analysis by flap type. Otolaryngol Head Neck Surg. 2015;152(3):449‐457. 10.1177/0194599814567107. [DOI] [PubMed] [Google Scholar]
- 48. Eskander A, Kang SY, Tweel B, et al. Quality indicators: measurement and predictors in head and neck cancer rree flap patients. Otolaryngol Head Neck Surg. 2018;158(2):265‐272. 10.1177/0194599817742373. [DOI] [PubMed] [Google Scholar]
- 49. Shah MD, Goldstein DP, McCluskey SA, et al. Blood transfusion prediction in patients undergoing major head and neck surgery with free‐flap reconstruction. Arch Otolaryngol Head Neck Surg. 2010;136(12):1199‐1204. 10.1001/archoto.2010.202. [DOI] [PubMed] [Google Scholar]
- 50. Weber RS. A model for predicting transfusion requirements in head and neck surgery. Laryngoscope. 1995;105(8 pt 2 suppl 73):1‐17. 10.1288/00005537-199508001-00001. [DOI] [PubMed] [Google Scholar]
- 51. Scott SN, Boeve TJ, McCulloch TM, Fitzpatrick KA, Karnell LH. The effects of epoetin alfa on transfusion requirements in head and neck cancer patients: a prospective, randomized, placebo‐controlled study. Laryngoscope. 2002;112(7 pt 1):1221‐1229. 10.1097/00005537-200207000-00015. [DOI] [PubMed] [Google Scholar]
- 52. Kolbenschlag J, Schneider J, Harati K, et al. Predictors of intraoperative blood transfusion in free tissue transfer. J Reconstr Microsurg. 2016;32(9):706‐711. 10.1055/s-0036-1586255. [DOI] [PubMed] [Google Scholar]
- 53. O'Neill AC, Barandun M, Cha J, Zhong T, Hofer SOP. Restrictive use of perioperative blood transfusion does not increase complication rates in microvascular breast reconstruction. J Plast Reconstr Aesthet Surg. 2016;69(8):1092‐1096. 10.1016/j.bjps.2016.04.021. [DOI] [PubMed] [Google Scholar]
- 54. Zhu C, Yin J, Wang B, et al. Restrictive versus liberal strategy for red blood‐cell transfusion in hip fracture patients: a systematic review and meta‐analysis. Medicine. 2019;98(32):e16795. 10.1097/MD.0000000000016795. [DOI] [PMC free article] [PubMed] [Google Scholar]
- 55. Salpeter SR, Buckley JS, Chatterjee S. Impact of more restrictive blood transfusion strategies on clinical outcomes: a meta‐analysis and systematic review. Am J Med. 2014;127(2):124‐131. 10.1016/j.amjmed.2013.09.017. [DOI] [PubMed] [Google Scholar]
- 56. Prado CM, Purcell SA, Laviano A. Nutrition interventions to treat low muscle mass in cancer. J Cachexia Sarcopenia Muscle. 2020;11(2):366‐380. 10.1002/jcsm.12525. [DOI] [PMC free article] [PubMed] [Google Scholar]
- 57. Müller‐Richter U, Betz C, Hartmann S, Brands RC. Nutrition management for head and neck cancer patients improves clinical outcome and survival. Nutr Res. 2017;48:1‐8. 10.1016/j.nutres.2017.08.007. [DOI] [PubMed] [Google Scholar]
- 58. Bano G, Trevisan C, Carraro S, et al. Inflammation and sarcopenia: a systematic review and meta‐analysis. Maturitas. 2017;96:10‐15. 10.1016/j.maturitas.2016.11.006. [DOI] [PubMed] [Google Scholar]
- 59. Danan D, Shonka DC, Selman Y, Chow Z, Smolkin ME, Jameson MJ. Prognostic value of albumin in patients with head and neck cancer. Laryngoscope. 2016;126(7):1567‐1571. 10.1002/lary.25877. [DOI] [PubMed] [Google Scholar]
- 60. Can B, Kara O, Kizilarslanoglu MC, et al. Serum markers of inflammation and oxidative stress in sarcopenia. Aging Clin Exp Res. 2017;29(4):745‐752. 10.1007/s40520-016-0626-2. [DOI] [PubMed] [Google Scholar]
- 61. Zwart AT, van der Hoorn A, van Ooijen PMAA, Steenbakkers RJHM, de Bock GH, Halmos GB. CT‐measured skeletal muscle mass used to assess frailty in patients with head and neck cancer. J Cachexia Sarcopenia Muscle. 2019;10(5):1060‐1069. 10.1002/jcsm.12443. [DOI] [PMC free article] [PubMed] [Google Scholar]