

Abstract
Objective—
Despite the early promising results of 18F-fluorodeoxyglucose positron emission tomography for assessment of vessel wall inflammation, its accuracy in prospective identification of vulnerable plaques has remained limited. Additionally, previous studies have indicated that 18F-fluorodeoxyglucose uptake alone may not allow for accurate identification of specific macrophage activation states. We aimed to determine whether combined measurement of glucose and glutamine accumulation—the 2 most important bioenergetic substrates for macrophages—improves the distinction of macrophage inflammatory states and can be utilized to image atherosclerosis.
Approach and Results—
Murine peritoneal macrophages (MΦ) were activated ex vivo into proinflammatory states with either lipopolysaccharide (MΦLPS) or interferon-γ+tumor necrosis factor-α (MΦIFN-γ+TNF-α). An alternative polarization phenotype was induced with interleukin-4 (MΦIL-4). The pronounced increase in 2-deoxyglucose uptake distinguishes MΦLPS from MΦIFN-γ+TNF-α, MΦIL-4, and unstimulated macrophages (MΦ0). Despite having comparable levels of 2-deoxyglucose accumulation, MΦIL-4 can be distinguished from both MΦIFN-γ+TNF-α and MΦ0 based on the enhanced glutamine accumulation, which was associated with increased expression of a glutamine transporter, Slc1a5. Ex vivo autoradiography experiments demonstrated distinct and heterogenous patterns of 18F-fluorodeoxyglucose and 14C-glutamine accumulation in atherosclerotic lesions of low-density lipoprotein receptor-null mice fed a high-fat diet.
Conclusions—
Combined assessment of glutamine and 2-deoxyglucose accumulation improves the ex vivo identification of macrophage activation states. Combined ex vivo metabolic imaging demonstrates heterogenous and distinct patterns of substrate accumulation in atherosclerotic lesions. Further studies are required to define the in vivo significance of glutamine uptake in atherosclerosis and its potential application in identification of vulnerable plaques.
Keywords: animals, energy metabolism, glucose, inflammation, mice
Development of noninvasive imaging techniques to quantify the abundance of macrophages in atherosclerotic plaques, and more importantly, their inflammatory phenotype, has been the focus of intense research.1 Macrophages demonstrate high functional heterogeneity and contribute to both the promotion and resolution of inflammation in atherosclerosis.2 Analogous to the type-1 and type-2 T-helper lymphocyte paradigm, extremes of the macrophage activation spectrum, have been classified as M1 (classically activated) and M2 (alternatively activated) polarization states.3 The abundance of proinflammatory M1 macrophages has been associated with atherosclerotic plaque vulnerability, whereas inflammation-resolving M2 macrophages seem to be associated with plaque stability.3 However, despite a few recently suggested ex vivo approaches, for example, folate receptor-β–targeted nuclear imaging,4 in vivo identification of macrophage activation states has remained a clinical challenge.
The high glycolytic capacity of macrophages has allowed the utilization of 18F-fluorodeoxyglucose (18F-FDG) positron emission tomography to monitor the macrophage burden of atherosclerotic lesions.5,6 Recently, it was shown that enhanced glucose uptake and glycolytic activity are pivotal aspects of macrophage activation in response to selected proinflammatory factors, such as hypoxia7,8 and modified low density lipoprotein (LDL),9,10 as well as pathogen-derived molecules, for example, lipopolysaccharide.6,11 However, enhanced glucose uptake is not a feature characteristic of all proinflammatory macrophages. For example, several proinflammatory stimuli with critical roles in atherosclerosis (interferon-γ, tumor necrosis factor-α [TNF-α], and interleukin-1β) do not increase glucose uptake.6,7 Similarly, M2 polarization, despite inducing significant changes in cellular metabolism, does not alter glucose uptake.6 Therefore, despite their significant functional heterogeneity and pathological roles in atherogenesis, pro- and anti-inflammatory macrophage states may not be distinguishable based on the glucose uptake alone, which would limit the utility of 18F-FDG as a biomarker to monitor macrophage activation and plaque vulnerability.
Glutamine is the most abundant amino acid in the body and serves as a main source of nitrogen and carbon for cells with long-known roles in wound healing and proliferation of malignant cells.12 Recent metabolomics studies have identified major changes in glutamine metabolism in macrophages on exposure to M1- or M2-polarizing agents.11,13 For example, lipopolysaccharide results in a marked intracellular accumulation of succinate, which is derived from glutamine metabolism and acts as an endogenous danger signal and enhances the production of proinflammatory cytokines.11 On the contrary, glutamine has been shown to be critical for the acquisition of the M2 polarization state and production of key anti-inflammatory cytokines through its role in protein glycosylation.13
Therefore, we hypothesized that combined imaging of glucose and glutamine accumulation would better characterize the metabolic divergence of macrophages and improve the characterization of macrophage inflammatory states. Using polarized murine macrophages in the current study, we demonstrated that the increased glutamine accumulation in inflammation-resolving macrophages induced by interleukin-4 (MΦIL-4) and the enhanced 2-deoxyglucose accumulation in the proinflammatory macrophages induced by lipopolysaccharide (MΦLPS) allow for their distinction from the proinflammatory macrophages induced by interferon-γ+TNF-α (MΦIFN-γ+TNF-α), which show glucose and glutamine uptake that is comparable with unstimulated macrophages (MΦ0). Additionally, we showed in our proof-of-principle ex vivo autoradiography experiments that 18F-FDG and 14C-glutamine have distinct accumulation patterns in atherosclerotic plaques of LDL receptor-null (LDL-R−/−) mice.
Materials and Methods
Materials and Methods are available in the online-only Data Supplement.
Results
Characterization of Polarized Macrophage Phenotypes
The gene expression profiles of macrophages exposed to lipopolysaccharide (MΦLPS), M1-polarizing agents (MΦIFNγ+TNF-α), or an M2-polarizing agent (MΦIL-4) were determined using a panel of polarization markers (Figure 1). Both interferon-γ+TNF-α and lipopolysaccharide upregulated the expression of distinct sets of M1 markers, that is, Cxcl9, Cxcl10, Il12b, and Stat1 in MΦIFN-γ+TNF-α; and Cxcl10, Il12b, Nos2, Stat1, and Tnf in MΦLPS (Figure 1A). MΦLPS also showed increased expression of several M2 polarization markers, for example, Arg1, consistent with the development of an endotoxin-tolerant phenotype.6 The principal component analysis score plots of M1 and M2 markers illustrate the separate clustering of MΦIFN-γ+TNF-α and MΦLPS, confirming their distinct proinflammatory states (Figure 1B and 1C). In addition, the M2 polarization state of MΦIL-4 was confirmed based on the expression of multiple M2 polarization markers (Figure 1A), which showed a clustering distinct from the other activation states in the principal component analysis score plot (Figure 1C).
Figure 1.

Induction of distinct polarization states in polarized macrophages. A, Heat map representation of the relative expression levels of M1 and M2 markers in MΦIFN-γ+TNF-α, MΦLPS, and MΦIL-4 cells. The expression level of each gene is represented using an ordinal scale ranging from the minimum (dark blue) to maximum (dark red) with the median values shown in white. B, Principal component analysis (PCA) score plot using M1 polarization markers showing separate clustering of MΦIFN-γ+TNF-α and MΦLPS from closely grouped MΦ0 and MΦIL-4. Principal component 1 (PC1) and PC2 describe 70.2% and 21.4% of the variance between the samples, respectively. C, PCA score plot using M2 polarization markers (with PC1 and PC2 describing 68.6% and 17.4% of the variance between the samples, respectively) shows separate clustering of MΦIL-4 from MΦ0 and MΦIFN-γ+TNF-α. Of note, PCA analysis of M2 markers shows a distinct MΦLPS cluster, consistent with the development of the endotoxin-tolerant phenotype. Colored dots represent individual biological replicates, and colored ellipses represent the confidence interval for each group (n=3, each pooled from 2 mice).
Time Course Analysis of 3H-2-Deoxyglucose and 3H-Glutamine Uptakes
We noted a ≈2-fold reduction in 3H-2-deoxyglucose accumulation during the initial 24 hours after plating of MΦ0, which was paralleled by a 2-fold increase in 3H-glutamine accumulation (Figure I in the online-only Data Supplement). Therefore, substrate accumulations in polarized macrophages are presented as normalized values to the uptake of MΦ0 at individual time points to adjust for this plating-related effect.
MΦIFN-γ+TNF-α demonstrated only a modest and transient increase in 3H-2-deoxyglucose accumulation at 24 hours (1.6-fold compared with MΦ0; P<0.05), which returned back to the level of MΦ0 by 48 hours (Figure 2A). However, lipopolysaccharide promoted a steady increase in 3H-2-deoxyglucose accumulation, which at 48 hours reached 6.8-fold of levels in MΦ0 (P<0.001; Figure 2A). 3H-2-deoxyglucose accumulation by MΦIL-4 remained comparable with MΦ0 throughout the 48-hour period (Figure 2A).
Figure 2.

Time course of 3H-2-deoxyglucose and 3H-glutamine accumulation in polarized macrophages. A, Assessment of 3H-2-deoxyglucose accumulation during a 48 h period in MΦIFN-γ+TNF-α, MΦLPS, and MΦIL-4 cells (***P<0.001 MΦLPS vs MΦ0; †P=0.05 MΦIFN-γ+TNF-α vs MΦ0). B, Assessment of 3H-glutamine accumulation during a 48 h period in MΦIFN-γ+TNF-α, MΦLPS, and MΦIL-4 (**P<0.01 MΦLPS vs MΦ0; ‡‡‡P<0.001 MΦIL-4 vs MΦ0). C, Plotting the combined 3H-2-deoxyglucose and 3H-glutamine accumulation allows distinction of the 3 activation states of macrophages at 48 h after stimulation (n=3 for 3H-2-deoxyglucose and n=5–7 for 3H-glutamine experiments).
Unlike the MΦIFN-γ+TNF-α, which demonstrated levels of 3H-glutamine accumulation comparable with MΦ0 throughout the 2-day stimulation (Figure 2B), MΦLPS showed a biphasic response characterized by an early drop at 6 hours to 67% (P<0.01), followed by a steady increase to baseline levels at 24 hours, and a 1.3-fold increase in the accumulation after 48 hours relative to MΦ0 (P<0.01; Figure 2B). For the first 6 hours, 3H-glutamine accumulation in MΦIL-4 remained similar to that seen in MΦ0 but increased to 1.4-fold above the MΦ0 level after 24 hours and remained constant for the next 24 hours (P<0.001; Figure 2B). The distinct profiles of the 3 macrophage activation states is best illustrated by plotting their respective levels of 3H-2-deoxyglucose versus 3H-glutamine accumulation (Figure 2C).
Expression of Glucose and Glutamine Transporters in Polarized Macrophages
We analyzed the mRNA expression of transporters that may account for the different uptake of glucose and glutamine in macrophages under different activation states. mRNA expression of Glut1 (glucose transporter-1), also called Slc2a1 (solute carrier family 2, member 1)—a major glucose transporter in macrophages6—was similar in MΦ0, MΦIFN-γ+TNF-α, and MΦIL-4 (Figure II in the online-only Data Supplement; Figure 3A). Consistent with the increased 2-deoxyglucose uptake, MΦLPS had 3-fold (P<0.001) and 8-fold higher (P<0.001) expression of Glut1 mRNA compared with MΦ0 at 6 (Figure II in the online-only Data Supplement) and 48 hours (Figure 3A) after stimulation, respectively. There was also a 2-fold increase in the expression of Slc2a1 in MΦIFNγ+TNF-α after 6 hours of stimulation (P=0.013; Figure II in the online-only Data Supplement), preceding the modest and temporary increase in 3H-2-deoxyglucose in MΦIFN-γ+TNF-α at 24 hours.
Figure 3.

mRNA expression of glucose and glutamine transporters. A, Reverse transcription-quantitative polymerase chain reaction analysis of Slc2a1 (Glut1) expression after 2 days of polarization demonstrates increased expression of Slc2a1 in MΦLPS, consistent with their increased 3H-2-deoxyglucose uptake. Enhanced expression of (B) Slc1a5 and (C) Slc3a2 was also detected in MΦLPS and MΦIL-4, respectively, consistent with their higher glutamine accumulation (n=3, each pooled from 2 mice).
Glutamine transport is a complex process and mediated through several amino acid transporters, including sodium-dependent neutral amino acid transporters, for example, SLC1A5 and LAT1 (large neutral amino acid transporter).14 Consistent with their increased glutamine uptake, there was a 2.2-fold increased expression of Slc1a5 in MΦIL-4 (Figure 3B; P=0.007) and a 5.5-fold increased expression of the heavy subunit of LAT1, also called Slc3a2, in MΦLPS (Figure 3C; P=0.002) at 48 hours after stimulation. Also, coinciding with the temporary drop in glutamine uptake at 6 hours after stimulation with lipopolysaccharide, there was a one-third reduction in expression of Slc1a5, despite an increase in expression of Slc3a2, in MΦLPS (Figure II in the online-only Data Supplement).
Expression of Glucose and Glutamine Transporters by Plaque Macrophages
To assess whether glucose or glutamine transporters were expressed in atherosclerotic plaques in vivo, the expression of GLUT1, SLC1A5, and SLC3A2 was examined by fluorescent immunostaining in aortic root atherosclerotic lesions of LDL-R−/− mice (Figure 4). Furthermore, to determine whether the expression of the 3 transporters was present in lesion macrophages, we performed coimmunostaining with an antibody against CD68—a pan monocyte/macrophage marker. All 3 transporters were abundantly expressed in atherosclerotic plaques and were primarily colocalized to CD68+ macrophages (Figure 4). Unlike the relatively ubiquitous expression of GLUT1 by plaque macrophages, SLC1A5 and SLC3A2 expression was more prominent on the medial and luminal sides of the plaques, respectively (Figure 4). In addition, SLC3A2, but not SLC1A5, expression could be detected in the aortic media and adventitia (Figure 4, yellow boxes in the right panels).
Figure 4.
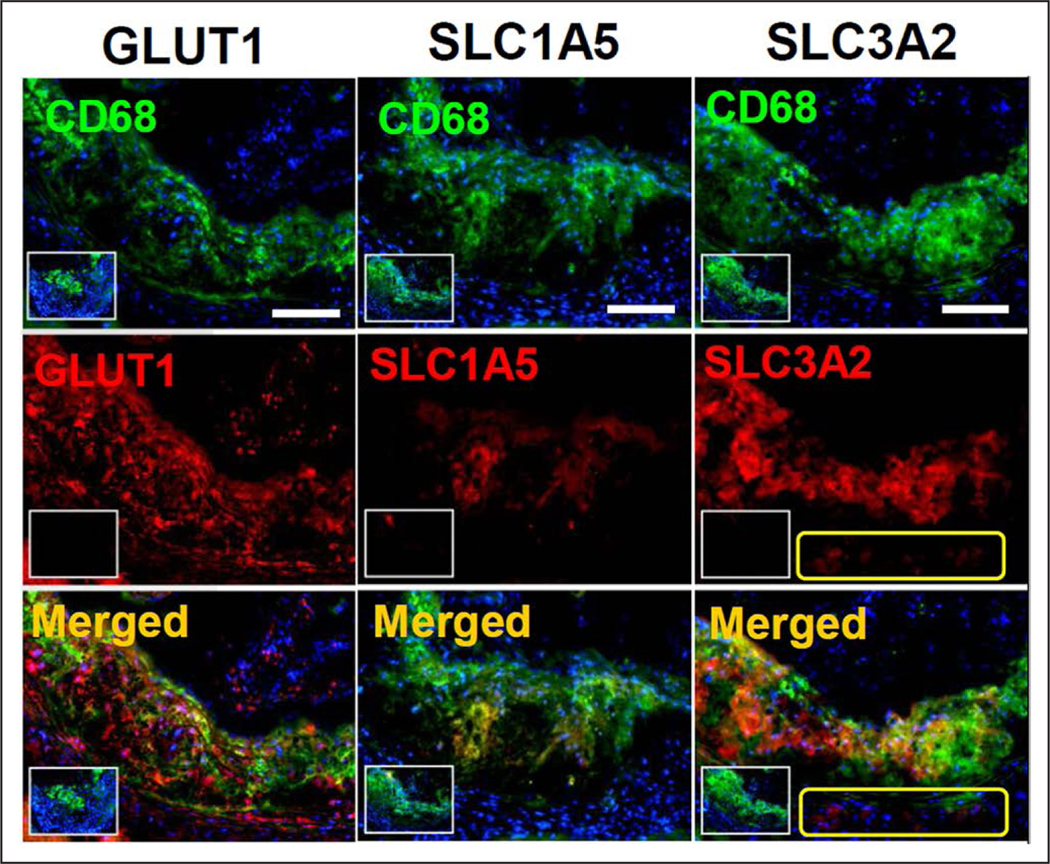
Expression of glucose and glutamine transporters by murine aortic plaque macrophages. Fluorescent immunostaining demonstrated colocalization of aortic root CD68+ macrophages with GLUT1 (glucose transporter-1; left) and 2 major glutamine transporters, that is, solute carrier family 1, member 5 (SLC1A5 [solute carrier family 1, member 5]; middle) and solute carrier family 3, member 2 (SLC3A2; right). Small insets represent negative control sections that were stained in the absence of primary antibody against individual transporter molecules but in the presence of CD68 to delineate macrophages in the atherosclerotic lesions. Yellow boxes in the right indicate expression of SLC3A2 in the medial and adventitial CD68− nonmacrophage cells. White scale bars (top): 200 μm.
Ex Vivo Autoradiography of Aorta
To assess the feasibility of a combined metabolic imaging approach, the uptake of both 18F-FDG and 14C-glutamine was measured in aortas isolated from LDL-R−/− mice fed with high-fat diet for 3 and 12 months using digital ex vivo autoradiography. Focal areas of increased 18F-FDG and 14C-glutamine accumulation were present along the aortas at both time points (Figure 5A; Figure III in the online-only Data Supplement). Interestingly, there was a considerable heterogeneity in the accumulation of 18F-FDG and 14C-glutamine, with plaques that avidly take up either both or only one of the metabolites. Of note, whereas the majority of atherosclerotic plaques with high 18F-FDG accumulation in the thoracic and proximal abdominal aorta demonstrated low-to-intermediate 14C-glutamine accumulation, the lesions in the distal abdominal aorta and proximal common iliac arteries had an intense accumulation of both 18F-FDG and 14C-glutamine, reflecting potential differences in plaque biology at different regions of aorta. The presence of unlabeled glutamine markedly decreased the accumulation of 14C-glutamine by atherosclerotic plaques, indicating the specificity of uptake (Figure 5B).
Figure 5.

Autoradiography of atherosclerotic aortas from LDL-R−/− mice fed with a high-fat diet for 3 months. A, Representative images of combined 18F-fluorodeoxyglucose (18F-FDG) and 14C-glutamine ex vivo autoradiography demonstrated different patterns of substrate accumulation in aortic atherosclerotic plaques. B, The specificity of 14C-glutamine uptake was determined through the coincubation with 20-mmol/L unlabeled glutamine, which resulted in a noticeable decrease in uptake throughout the aorta. C, The maximal 18F-FDG plaque accumulation was not statistically different between various segments of the aorta. On the contrary, 14C-glutamine accumulation (D, black bars) was significantly higher in the abdominal aorta compared with the remaining segments. Consistent with the visual assessment of plaque accumulation, coincubation with unlabeled glutamine (D, overlaid white bars) resulted in a statistically significant decline in quantitative maximal 14C-glutamine uptake throughout the aorta. (n=6 for nonblocking and 3 for blocking experiments). (#P=0.07, *P<0.05, and ***P<0.001 maximal plaque accumulation in the presence vs absence of unlabeled glutamine).
Quantification of the maximal accumulation in various segments of the aorta in 3-month high-fat diet–fed mice demonstrated a 6.6-fold higher normalized uptake of 18F-FDG compared with 14C-glutamine, which in the abdominal aorta reaches ≤52.0-fold for 18F-FDG (Figure 5C) and 7.9-fold for 14C-glutamine (Figure 5D) relative to the activity in the buffer. A similar pattern was observed in aortas of 12-month high-fat diet–fed mice, although with an overall trend toward a decreased accumulation of both substrates, in which the maximal uptake of 18F-FDG and 14C-glutamine reached ≤40.2- (Figure IIIB in the online-only Data Supplement) and 5.5-fold (Figure IIIC in the online-only Data Supplement) the activity present in the uptake buffer, respectively. Consistent with the visual assessment of the autoradiography images, the maximal 14C-glutamine accumulation in the atherosclerotic lesions from abdominal aorta was significantly higher than the ascending aorta (2.9- and 4.8-fold at 3 and 12 months, respectively), aortic arch (2.3- and 2.0-fold at 3 and 12 months, respectively), and descending thoracic aorta (2.0- and 2.8-fold at 3 and 12 months, respectively; Figure 5D; Figure IIIC in the online-only Data Supplement). The specificity of 14C-glutamine accumulation was confirmed by quantification of the autoradiography images of aortas coincubated with unlabeled glutamine, which significantly reduced the maximal plaque accumulation throughout the aorta, reaching ≤4.4-fold in plaques within the abdominal aorta (Figure 5D).
Nonatherosclerotic aortas from normal diet-fed wild-type mice demonstrated a significantly lower 14C-glutamine accumulation throughout the aorta (Figure IV in the online-only Data Supplement).
Heterogenous Expression of Glucose and Glutamine Transporters Throughout the Aorta
The expression of selected M1 (Cxcl9, Il1b, Il6, Tnfa, and Nos2) and M2 (Arg1, Ccl9, Cd36, Retnla, and Mrc1) polarization markers was evaluated in different segments of atherosclerotic aortas from LDL-R−/− mice fed with high-fat diet for 3 months using principal component analysis. As demonstrated by a principal component analysis score plot (Figure V in the online-only Data Supplement), different aortic segments clustered separately, indicating their heterogenous expression of macrophage polarization markers. Consistent with the high accumulation of 14C-glutamine in atherosclerotic plaques of the abdominal aorta, we noted a significantly higher expression of Slc1a5 and Slc3a2 in the abdominal aorta compared with the remaining segments (Figure 6). Despite the fact that 18F-FDG accumulation was similar in the different aortic segments, the expression of Slc2a1 (ie, Glut1) was also significantly higher in the abdominal aorta compared with the remaining segments.
Figure 6.

mRNA expression of glucose and glutamine transporters in atherosclerotic aortas. The expression of (A) Slc2a1 (Glut1), (B) Slc1a5, and (C) Slc3a2 was assessed in various segments of atherosclerotic aortas harvested from LDL-R−/− mice fed with a high-fat diet for 3 months (n=5).
Discussion
The broad metabolic specificity of 18F-FDG, which targets an essential and ubiquitous metabolic process, that is, glucose utilization, is a major limitation of 18F-FDG positron emission tomography in monitoring phenotypic changes of macrophages in inflammatory processes. Recent state-of-the-art metabolomics studies have shown that glutamine metabolism reprogramming is critical for both pro- and anti-inflammatory activation of macrophages.11,13 This finding prompted us to determine whether this intracellular metabolic reprogramming is associated with detectable changes in glutamine accumulation, which could be utilized for discrimination of macrophage polarization states.
Our data demonstrate that the combination of 2-deoxyglucose and glutamine accumulation allows for the discrimination of distinct polarization phenotypes in macrophages (Table). We also demonstrated significant induction of 2 different glutamine transporters, that is, Slc1a5 in MΦIL-4 and Slc3a2 in MΦLPS, as potential mechanisms of enhanced glutamine accumulation in activated macrophages and confirmed the expression of these transporters in plaque macrophages. Additionally, we demonstrated a heterogenous pattern of glutamine accumulation in murine aortic atherosclerotic lesions which is distinct from 2-deoxyglucose uptake. Together, our study identifies glutamine metabolism as a novel metabolic target for noninvasive imaging of macrophage phenotypes in atherosclerosis, which may improve the characterization of the inflammatory state of the vessel wall. Interestingly, the availability and promising experience with 18F-fluoroglutamine for imaging human neoplasms, for example, glioma, provide a venue to explore the utility of glutamine-targeted imaging in inflammatory processes.15
Table.
Ex Vivo Profiles of 2-Deoxyglucose and Glutamine Accumulation in Polarized Macrophages Allow for the Distinction of the Macrophage Activation States
| Polarization State | 2-Deoxyglucose Accumulation | Glutamine Accumulation | Ratio of Glutamine to 2-Deoxyglucose Accumulation |
|---|---|---|---|
| MΦIFN-γ+TNF-α | = | = | = |
| MΦLPS | ↑↑↑ | ↑ | ↓↓ |
| MΦIL-4 | = | ↑ | ↑ |
Symbols =, ↑, and ↓ indicate changes relative to MΦ0.
Our data demonstrate a significant divergence in glutamine accumulation depending on the macrophage activation state, which may be exploited to overcome the limitations of 18F-FDG6,7 for a better characterization of specific macrophage phenotypes in inflammatory processes. The ability to label glutamine with short half-life isotopes, for example, 11C and 13N, may allow for sequential same-day imaging of glutamine and glucose metabolism in cancers.12 However, this approach has never been applied to the imaging of inflammation. Our proof-of-principle autoradiography experiments using the short half-life 18F-FDG and long half-life 14C-glutamine demonstrate the ex vivo feasibility of this approach. Of note, despite the lower capacity of atherosclerotic lesions to accumulate 14C-glutamine compared with 18F-FDG, the maximal 14C-glutamine activity in plaque was 6-to-8 folds higher than the radioactivity present in the culture media, suggesting a promising level of tracer accumulation in atherosclerotic plaques to provide a diagnostically adequate target-to-blood ratio. Nevertheless, the comparison between the relative uptake values provides a roadmap for optimization of the in vivo imaging and suggests that a longer acquisition time, a higher dose of glutamine, or tracers with a higher specific activity might be required to overcome the lower relative capacity of plaques to accumulate glutamine compared with 18F-FDG. The in vivo feasibility of our proposed combined imaging approach needs to be further studied to determine the acquisition parameters and optimal tracer dose using radioisotopes suitable for in vivo positron emission tomography imaging.
Our experiments point to a considerable heterogeneity in 2-deoxyglucose and glutamine accumulation in atherosclerotic lesions along the aorta of LDL-R−/− mice. Of note, there was a consistent and distinct pattern of enhanced glutamine accumulation in atherosclerotic plaques in the abdominal aorta compared with plaques in the remaining segments, which was associated with a significantly higher expression of Slc1a5 and Slc3a2. Heterogeneity in various aspects of atherosclerotic plaques, including structural,16 thermal,16–18 pH,19 and matrix metalloproteinase activity,20 has been previously reported, and the potential implications of such biological heterogeneity for understanding plaque vulnerability have been proposed.20 To our knowledge, the current study is the first to demonstrate that plaques in different regions of aorta demonstrate considerable metabolic heterogeneity, in particular with respect to glutamine accumulation, which adds another level of biological complexity to molecular imaging of atherosclerosis.
From extrapolating the ex vivo uptake of substrates, one could speculate that the in vivo ratio of glutamine to 2-deoxyglucose accumulation may serve as a surrogate indicator of the prevailing macrophage phenotype. For example, a relatively higher glutamine uptake compared with 2-deoxyglucose accumulation may represent the predominance of an anti-inflammatory macrophage population. In contrast, plaques with a relatively higher 2-deoxyglucose accumulation, compared with glutamine, may represent lesions with a higher content of proinflammatory macrophages. However, the contribution of other vascular and perivascular cells in the differential accumulation of 2-deoxyglucose and glutamine remains to be determined. For examples, perivascular adipose tissue has been reported as a major determinant of 18F-FDG uptake in atherosclerotic vessels.21 In this study, perivascular tissues and adventitial fat were carefully removed from aortas before autoradiography experiments to exclude their contribution to 2-deoxyglucose and glutamine accumulation. However, the role of other major vascular cells (eg, endothelial cells and vascular smooth muscle cells) in the differential accumulation of 2-deoxyglucose and glutamine in various segments of atherosclerotic aortas remains to be determined.
Conclusions
In summary, our study provides the first evidence of feasibility and the potential utility of combined imaging of 2-deoxyglucose and glutamine accumulation for better characterization of the inflammatory state within atherosclerotic plaques. Further biological characterization is required to evaluate the potential benefits of an imaging approach based on the combination of 2-deoxyglucose/glutamine accumulation in the assessment of vessel wall inflammation, in particular in predicting plaque vulnerability.
Supplementary Material
Highlights.
Despite their markedly different inflammatory and bioenergetic profiles, pro- and anti-inflammatory activated states of macrophages induced by conventional polarizing agents (interferon-γ+TNF-α versus interleukin-4) may not be discriminated from nonstimulated macrophages by measurement of 2-deoxyglucose accumulation.
Combined measurement of glutamine and 2-deoxyglucose accumulation improves the ex vivo identification of macrophage activation states.
Heterogenous and distinct patterns of substrate accumulation can be identified in atherosclerotic plaques through combined 18F-FDG and 14C-glutamine autoradiography, indicating a novel level of metabolic complexity in atherosclerosis, urging further investigations of potential links to plaque biology and vulnerability.
Acknowledgments
High-throughput gene expression data were generated in the Core for Advanced Translational Technologies, University of Texas Health Science Center at San Antonio. Joe Cuellar kindly assisted in preparation of the gene expression methodology.
Sources of Funding
This work was supported by grants from the University of Texas Health Science Center at San Antonio (UTHSCSA) Julio Palmaz Endowment for Excellence in Radiology Research to S. Tavakoli and the National Institutes of Health (HL115858) to R. Asmis. High-throughput nanofluidic gene expression experiments were performed in the Core for Advanced Translational Technologies, UTHSCSA.
Nonstandard Abbreviations and Acronyms
- 18F-FDG
18F-fluorodeoxyglucose
- Glut1
glucose transporter-1
- LAT1
large neutral amino acid transporter
- LDL
low-density lipoprotein
- LDL-R−/−
low-density lipoprotein receptor-null
- MΦ0
resting macrophages
- MΦIFN-γ+TNF-α
IFN-γ+TNF-α stimulated macrophages
- MΦIL-4
IL-4 stimulated macrophages
- MΦLPS
LPS stimulated macrophages
- Slc2a1
solute carrier family 2, member 5
- TNF-α
tumor necrosis factor-α
Footnotes
Disclosures
None.
The online-only Data Supplement is available with this article at http://atvb.ahajournals.org/lookup/suppl/doi:10.1161/ATVBAHA.117.308848/-/DC1.
References
- 1.Tavakoli S, Vashist A, Sadeghi MM. Molecular imaging of plaque vulnerability. J Nucl Cardiol. 2014;21:1112–1128; quiz 1129. doi: 10.1007/s12350-014-9959-4. [DOI] [PMC free article] [PubMed] [Google Scholar]
- 2.Tavakoli S, Asmis R. Reactive oxygen species and thiol redox signaling in the macrophage biology of atherosclerosis. Antioxid Redox Signal. 2012;17:1785–1795. doi: 10.1089/ars.2012.4638. [DOI] [PMC free article] [PubMed] [Google Scholar]
- 3.Chinetti-Gbaguidi G, Colin S, Staels B. Macrophage subsets in atherosclerosis. Nat Rev Cardiol. 2015;12:10–17. doi: 10.1038/nrcardio.2014.173. [DOI] [PubMed] [Google Scholar]
- 4.Jager NA, Westra J, Golestani R, van Dam GM, Low PS, Tio RA, Slart RH, Boersma HH, Bijl M, Zeebregts CJ. Folate receptor-β imaging using 99mTc-folate to explore distribution of polarized macrophage populations in human atherosclerotic plaque. J Nucl Med. 2014;55:1945–1951. doi: 10.2967/jnumed.114.143180. [DOI] [PubMed] [Google Scholar]
- 5.Sadeghi MM. (18)F-FDG PET and vascular inflammation: time to refine the paradigm? J Nucl Cardiol. 2015;22:319–324. doi: 10.1007/s12350-014-9917-1. [DOI] [PMC free article] [PubMed] [Google Scholar]
- 6.Tavakoli S, Zamora D, Ullevig S, Asmis R. Bioenergetic profiles diverge during macrophage polarization: implications for the interpretation of 18F-FDG PET imaging of atherosclerosis. J Nucl Med. 2013;54:1661–1667. doi: 10.2967/jnumed.112.119099. [DOI] [PMC free article] [PubMed] [Google Scholar]
- 7.Folco EJ, Sheikine Y, Rocha VZ, Christen T, Shvartz E, Sukhova GK, Di Carli MF, Libby P. Hypoxia but not inflammation augments glucose uptake in human macrophages: implications for imaging atherosclerosis with 18fluorine-labeled 2-deoxy-D-glucose positron emission tomography. J Am Coll Cardiol. 2011;58:603–614. doi: 10.1016/j.jacc.2011.03.044. [DOI] [PubMed] [Google Scholar]
- 8.Folco EJ, Sukhova GK, Quillard T, Libby P. Moderate hypoxia potentiates interleukin-1β production in activated human macrophages. Circ Res. 2014;115:875–883. doi: 10.1161/CIRCRESAHA.115.304437. [DOI] [PMC free article] [PubMed] [Google Scholar]
- 9.Lee SJ, Thien Quach CH, Jung KH, Paik JY, Lee JH, Park JW, Lee KH. Oxidized low-density lipoprotein stimulates macrophage 18F-FDG uptake via hypoxia-inducible factor-1α activation through Nox2-dependent reactive oxygen species generation. J Nucl Med. 2014;55:1699–1705. doi: 10.2967/jnumed.114.139428. [DOI] [PubMed] [Google Scholar]
- 10.Ogawa M, Nakamura S, Saito Y, Kosugi M, Magata Y. What can be seen by 18F-FDG PET in atherosclerosis imaging? The effect of foam cell formation on 18F-FDG uptake to macrophages in vitro. J Nucl Med. 2012;53:55–58. doi: 10.2967/jnumed.111.092866. [DOI] [PubMed] [Google Scholar]
- 11.Tannahill GM, Curtis AM, Adamik J, et al. Succinate is an inflammatory signal that induces IL-1β through HIF-1α. Nature. 2013;496:238–242. doi: 10.1038/nature11986. [DOI] [PMC free article] [PubMed] [Google Scholar]
- 12.Rajagopalan KN, DeBerardinis RJ. Role of glutamine in cancer: therapeutic and imaging implications. J Nucl Med. 2011;52:1005–1008. doi: 10.2967/jnumed.110.084244. [DOI] [PMC free article] [PubMed] [Google Scholar]
- 13.Jha AK, Huang SC, Sergushichev A, Lampropoulou V, Ivanova Y, Loginicheva E, Chmielewski K, Stewart KM, Ashall J, Everts B, Pearce EJ, Driggers EM, Artyomov MN. Network integration of parallel metabolic and transcriptional data reveals metabolic modules that regulate macrophage polarization. Immunity. 2015;42:419–430. doi: 10.1016/j.immuni.2015.02.005. [DOI] [PubMed] [Google Scholar]
- 14.Umapathy NS, Dun Y, Martin PM, Duplantier JN, Roon P, Prasad P, Smith SB, Ganapathy V. Expression and function of system N glutamine transporters (SN1/SN2 or SNAT3/SNAT5) in retinal ganglion cells. Invest Ophthalmol Vis Sci. 2008;49:5151–5160. doi: 10.1167/iovs.08-2245. [DOI] [PMC free article] [PubMed] [Google Scholar]
- 15.Venneti S, Dunphy MP, Zhang H, et al. Glutamine-based PET imaging facilitates enhanced metabolic evaluation of gliomas in vivo. Sci Transl Med. 2015;7:274ra17. doi: 10.1126/scitranslmed.aaa1009. [DOI] [PMC free article] [PubMed] [Google Scholar]
- 16.Verheye S, De Meyer GR, Van Langenhove G, Knaapen MW, Kockx MM. In vivo temperature heterogeneity of atherosclerotic plaques is determined by plaque composition. Circulation. 2002;105:1596–1601. [DOI] [PubMed] [Google Scholar]
- 17.Stefanadis C, Diamantopoulos L, Vlachopoulos C, Tsiamis E, Dernellis J, Toutouzas K, Stefanadi E, Toutouzas P. Thermal heterogeneity within human atherosclerotic coronary arteries detected in vivo: a new method of detection by application of a special thermography catheter. Circulation. 1999;99:1965–1971. [DOI] [PubMed] [Google Scholar]
- 18.Krams R, Verheye S, van Damme LC, Tempel D, Mousavi Gourabi B, Boersma E, Kockx MM, Knaapen MW, Strijder C, van Langenhove G, Pasterkamp G, van der Steen AF, Serruys PW. In vivo temperature heterogeneity is associated with plaque regions of increased MMP-9 activity. Eur Heart J. 2005;26:2200–2205. doi: 10.1093/eurheartj/ehi461. [DOI] [PubMed] [Google Scholar]
- 19.Naghavi M, John R, Naguib S, Siadaty MS, Grasu R, Kurian KC, van Winkle WB, Soller B, Litovsky S, Madjid M, Willerson JT, Casscells W. pH Heterogeneity of human and rabbit atherosclerotic plaques; a new insight into detection of vulnerable plaque. Atherosclerosis. 2002;164:27–35. [DOI] [PubMed] [Google Scholar]
- 20.Razavian M, Tavakoli S, Zhang J, Nie L, Dobrucki LW, Sinusas AJ, Azure M, Robinson S, Sadeghi MM. Atherosclerosis plaque heterogeneity and response to therapy detected by in vivo molecular imaging of matrix metalloproteinase activation. J Nucl Med. 2011;52:1795–1802. doi: 10.2967/jnumed.111.092379. [DOI] [PMC free article] [PubMed] [Google Scholar]
- 21.Toczek J, Broisat A, Perret P, Desruet MD, Fagret D, Riou LM, Ghezzi C. Periaortic brown adipose tissue as a major determinant of [18F]-fluorodeoxyglucose vascular uptake in atherosclerosis-prone, apoE−/− mice. PLoS One. 2014;9:e99441. doi: 10.1371/journal.pone.0099441. [DOI] [PMC free article] [PubMed] [Google Scholar]
Associated Data
This section collects any data citations, data availability statements, or supplementary materials included in this article.