Abstract
Pre-eclampsia (PE) is a common complication of pregnancy, associated with maternal and fetal morbidity and mortality. In this study, we aimed to explore important long non-coding RNAs (lncRNAs) and their possible mechanisms in PE.
GSE60438 expression profile including 25 PE samples and 23 normal samples were obtained from gene expression omnibus (GEO) database. After normalization with betaqn package in R, differentially expressed lncRNAs (DElncRNAs) and mRNAs (DEmRNAs) were identified using the limma package. Gene Ontology (GO) and Kyoto encyclopedia of genes and genomes (KEGG) pathway were analyzed using DAVID 6.7 and GSEA 3.0. LncRNAs-mRNAs coexpression was implemented using weighted gene co-expression network analysis (WGCNA). MicroRNAs linked with these DElncRNAs and DEmRNAs were predicted and a competitive endogenous RNA (ceRNA) network was built.
A total of 53 DElncRNAs and 301 DEmRNAs were identified between control and PE samples. These DEmRNAs were enriched into pathways such as protein digestion and absorption, osteoclast differentiation. WGCNA constructed a lncRNA-mRNA coexpression network, among which SUMO1P3, NACAP1, NCF1C, ANXA2P1, GTF2IP1, NAPSB, OR7E37P were hub genes. ceRNA network was constructed together with microRNAs (miRNAs), and functional analysis indicated cellular membrane and sugar binding were involved in PE progression. Five lncRNAsANXA2P1, GTF2IP1, NACAP1, NCF1C and OR7E37P were successfully validated in our clinical specimens.
The DElncRNAs, including ANXA2P1, GTF2IP1, NACAP1, NCF1C and OR7E37P might play important roles in PE. However, the exact mechanism of these lncRNAs in prediction and diagnosis of PE should be further explored.
Keywords: preeclampsia, weight gene co-expression network analysis, predictive clinical biomarker
1. Introduction
Preeclampsia (PE) is characterized by new onset hypertension with other maternal organ dysfunction and fetal growth restriction.[1] As a highly variable and heterogeneous syndrome, PE is often associated with new-onset pretension, thrombocytopenia, impaired liver function, renal insufficiency, pulmonary edema, and cerebral disturbances.[2] It is estimated that 2% to 8% of pregnancies are affected by PE, which is evaluated to cause over 5000 maternal deaths worldwide per year and is considered as the leading cause of maternal and morbidity and mortality.[3] Delivery of the fetus and placenta is the only known cure for PE.[4]
The pathogenesis of PE is involved abnormal placentation and the development syndrome, but the exact underlying pathogenesis is largely unknown.[5] In recent years, long non-coding RNAs (lncRNAs) have been found play crucial roles in many diseases. Based on high-throughput techniques, several lncRNAs that might play important roles in PE have been identified in recent years. For example, He et al revealed that lncRNAs including LOC284100, LOC391533, and CEACAMP8 were aberrantly expressed in PE and might contribute to PE pathogenesis.[6] Long et al found lncRNA RP11-465L10.10 associated with the MMP9 gene was downregulated in PE patients.[7] Tong et al identified lncRNAs HK2P1, BNIP3P1, and PGK1P1 were core regulatory genes in PE.[8] In addition, microRNAs (miRNAs) have been reported as biomarkers in many diseases including cancer, cardiovascular disease, and diabetes mellitus.[9] Up-regulation of circulating miR-516-5p, miR-517-5p, miR-520a-5p, miR-525, and miR-526a is observed in PE.[10] Increasing evidence suggested that lncRNA might functions as miRNA spongers to regulate expression of target genes, which was termed as “competitive endogenous (ceRNA)”. Although aberrantly expressed mRNAs, lncRNAs, and miRNAs have been identified extensively in PE, the lncRNA-miRNA-mRNA network-ceRNA network has been poorly reported.
Weighted Gene Co-expression Network Analysis (WGCNA) draws gene expression network, in which pairs of genes were identified based on the correlated expression across samples.[11] WGCNA analysis has been widely applied in recent years to identify core genes involved in disease occurrence and development.[12,13] In this study, we identified the differentially expressed genes (DEGs), including differentially expressed mRNAs (DEmRNAs) and differentially expressed lncRNAs (DElncRNAs) between PE samples and normal samples. WGCNA was implemented on DEGs to construct coexpression network. Gene ontology (GO) and Kyoto encyclopedia of genes and genomes (KEGG) pathway analyses were performed for the DEmRNAs. Additionally, the hub lncRNAs were verified in clinical samples. Our research provided newly candidate genes that are important in PE and might have potential to serve as biomarkers in PE diagnosis.
2. Materials and methods
2.1. Data source
The raw data of expression profile of GSE60438 based on platforms of GPL6884 and GPL10558 were obtained from the gene expression omnibus (GEO) database (https://www.ncbi.nlm.nih.gov/geo/). This dataset included genome-wide transcriptome sequencing data on 65 normotensive and 60 PE patients and was contributed by Yong et al.[14] The sequencing data based on the platform of GPL6884, which included 48 samples from 25 PE samples and 23 normal samples, were extracted for further analysis.
2.2. Identification of DEGs
The sequencing data were downloaded and genes were annotated into mRNAs, and lncRNAs based on GENCODE database (release 26). Data were normalized with betaqn package in R (version 1.16.0; https://www.rdocumentation.org/packages/wateRmelon/versions/1.16.0/topics/betaqn-exprmethy450-methods). Further, differential gene expression analysis was implemented using the limma package (version 3.10.3) in R. The resulting P value was adjusted using Benjamini & Hochberg method. The mRNAs with adjusted P value <.05 and |log fold change (FC)| > 0.5 and the lncRNAs with adjusted P value <.05 were regarded as differentially expressed.
2.3. Functional enrichment analysis
The GO was performed using DAVID version 6.7 (https://david-d.ncifcrf.gov/) and visualized by GO plot in R.[15] KEGG pathway enrichment was implemented using Gene set enrichment analysis version 3.0 (GSEA) with the adjusted P value <.05 (https://www.genome.jp/kegg/). The pathway with normalized enrichment score (NES) >0 represented the activated pathway while pathway with NES <0 was suppressed.
2.4. Weighted correlation network analysis
WGCNA (version 1.61) in R was used to construct coexpression network. The input genes were first filtered by removing those with median absolute deviation (MAD) <0.01 and among the later 25% MAD. The genes with missing value were also removed. Then, the Pearson correlation coefficient (PCC) between each pair of genes was calculated, then the adjacency function was defined, and module partitioning was performed based on the threshold of minimal module size of 30 genes. In addition, correlation between gene modules and clinical phenotypes including age, gestational age, and infant weight was calculated and clinical phenotype-related modules were identified.
2.5. Construction and functional annotation of ceRNA network
The PCCs between DElncRNAs and differentially expressed mRNAs were calculated using psych package (version v1.8.12; https://www.rdocumentation.org/packages/psych/versions/1.8.12) in R based oncorr. test method. Coexpressed pairs were screened based on criteria of adjusted P value <.05 and |r| ≥ 0.75 and coexpression network was visualized using Cytoscape (version 3.7.0).
MiRNAs that could target the coexpressed lncRNAs and mRNAs were predicted from starbase database (http://starbase.sysu.edu.cn/starbase2/) and mirwalk database (http://mirwalk.umm.uni-heidelberg.de/). LncRNA-mRNA pairs regulated by the same miRNAs were integrated into lncRNA-miRNA-mRNA network and visualized by Cytoscape. The function of the mRNAs in these RNAs network was analyzed for GO and KEGG pathway enrichment using DAVID with P value <.05.[16]
2.6. Validation of hub lncRNAs in the ceRNA network by qRT-PCR
The decidua basalis was obtained from 5 PE patients and 5 normotensive maternal women who were delivered in the department of Obstetrics and Gynecology, Shanxi Bethune Hospital. This study was approved by the ethic committee of Shanxi Dayi Hospital.
Total RNA of decidua basalis was extracted using TRIzol reagent (Thermo Fisher). Qualified RNA was reverse-transcribed into cDNA using the Prime Script RT master mix (TaKaRa, Shiga, Japan). The amplification was performed on ViiA7 Real-time PCR System (Thermo Fisher) using Power SYBR Green PCR master (Thermo Fisher). The relative expression level of lncRNA was calculated using the 2−ΔΔCt method using GAPDH as internal control. The primers used are listed in Table 1.
Table 1.
The sequences of primers for qRT-PCR.
| Gene | Direction | Sequence (5–3) |
| SUMO1P3 | Forward | ACTGGCACCCCATCTCTTTG |
| SUMO1P3 | Reverse | CATCAGGGCCAATTCGCAAG |
| NACAP1 | Forward | GCTGAGACAGGGTCTGGAAC |
| NACAP1 | Reverse | CTGGACTTGTGCGGTTACCT |
| NCF1C | Forward | CAGTCATGGGGGACACCTTC |
| NCF1C | Reverse | TCCTGCCATTTCACCAGGAA |
| ANXA2P1 | Forward | AATGGGCATGGGGACTCAAG |
| ANXA2P1 | Reverse | ATGGGGAGCACCATTTCTGG |
| GTF2IP1 | Forward | CGAAAGTTGAAAAAGCTGTCGC |
| GTF2IP1 | Reverse | ATGCCATCAACCACCACACA |
| NAPSB | Forward | TCATCCAGTTTGCTCAGGGT |
| NAPSB | Reverse | TCGAAGACGGTCACATACGC |
| OR7E37P | Forward | ACAATGCTGGGTGTTGGTTTAC |
| OR7E37P | Reverse | TTCTGTGGGTCTGTAGAGATTG |
| GAPDH | Forward | TGACAACTTTGGTATCGTGGAAGG |
| GAPDH | Reverse | AGGCAGGGATGATGTTCTGGAGAG |
2.7. Statistical analysis
Each reaction of qRT-PCR was repeated 3 times and data were represented as mean ± standard deviation. Comparisons between groups were conducted by student's t test in Graphpad Prism 5.0. P < .05 was regarded as significant.
3. Results
3.1. DEGs identification in PE samples
A total of 14337 mRNAs and 11091 lncRNAs were included in the dataset of GSE60438. Among them, 96 upregulated mRNAs and 205 downregulated mRNAs as well as 26 upregulated ncRNAs and 27 downregulated ncRNAs were filtered out (Fig. 1A and B). Hierarchical clustering analysis was performed and the top 10 up-regulated and down-regulated genes were illustrated in heatmap (Fig. 1C).
Figure 1.
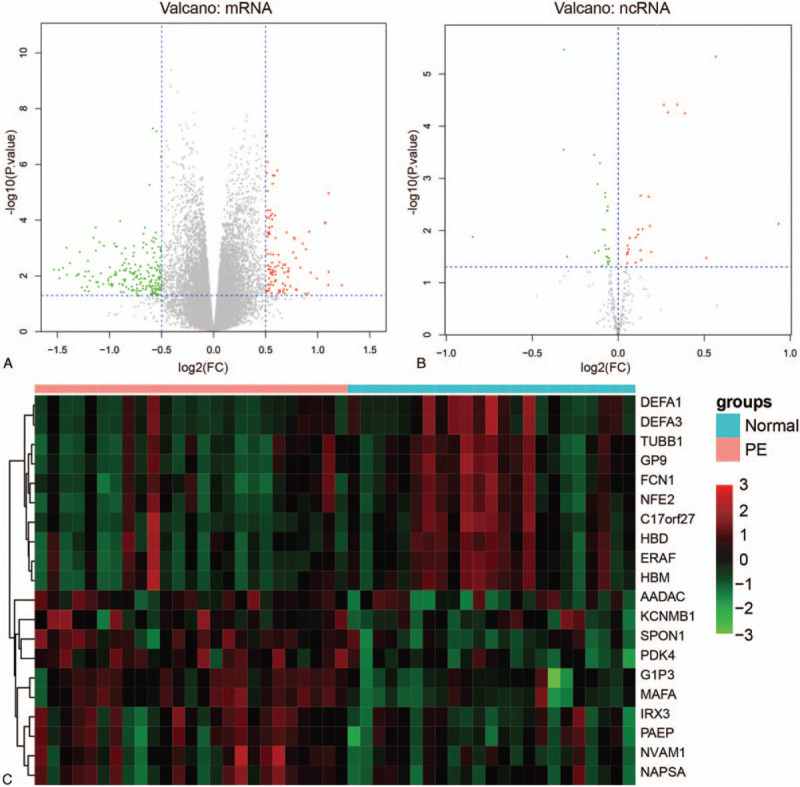
Differentially expressed genes (DEGs) identification between pre-eclampsia and normal samples. (A) Volcano plot of differentially expressed mRNAs (DEmRNAs). The vertical dotted lines represent |log2 fold change (FC)| > 0.5 and the horizontal lines represent P value <.05. Red spots represent up-regulated mRNAs and green spots represent down-regulated mRNAs in PE samples compared with normal samples. (B) Volcano plot of differentially expressed ncRNAs. Red spots represent up-regulated ncRNAs and green spots represent down-regulated ncRNAs in PE samples compared with normal samples. (C) Hierarchical clustering of top 10 expressed DEGs. The heatmap demonstrated the top 10 up-regulated and down-regulated genes in descending order by |log2(FC)|.
3.2. Functional annotation of DEmRNAs
To explore the biological function of these DEmRNAs, GO and KEGG pathway enrichment analyses were performed (Fig. 2). As a result, 25 GO terms including 10 biological process terms, 13 cellular component terms and 2 molecular function terms were significantly enriched (P < .05). The DEmRNAs were mainly enriched in biological processes including “oxygen transport” (P value =1.32E-06), “immune response” (P value =6.88E-06), “inflammatory response” (P value =1.32E-05), “cell adhesion” (P value =6.63E-06), “angiogenesis” (P value =2.28E-05), and “platelet degranulation” (P value =8.52E-05). The DEmRNAs were mainly located on “extracellular space” (P value =2.97E-17), “integral component of plasma membrane” (P value =1.47E-09), “proteinaceous extracellular matrix” (P value =3.31E-06), “plasma membrane” (P value =7.74E-05), and “cell surface” (P value =1.28E-04). These results revealed that these genes functioned in cell-cell communication and interaction. “Oxygen transporter activity” and “oxygen binding” were the 2 significant enriched molecular function terms by DEmRNAs.
Figure 2.
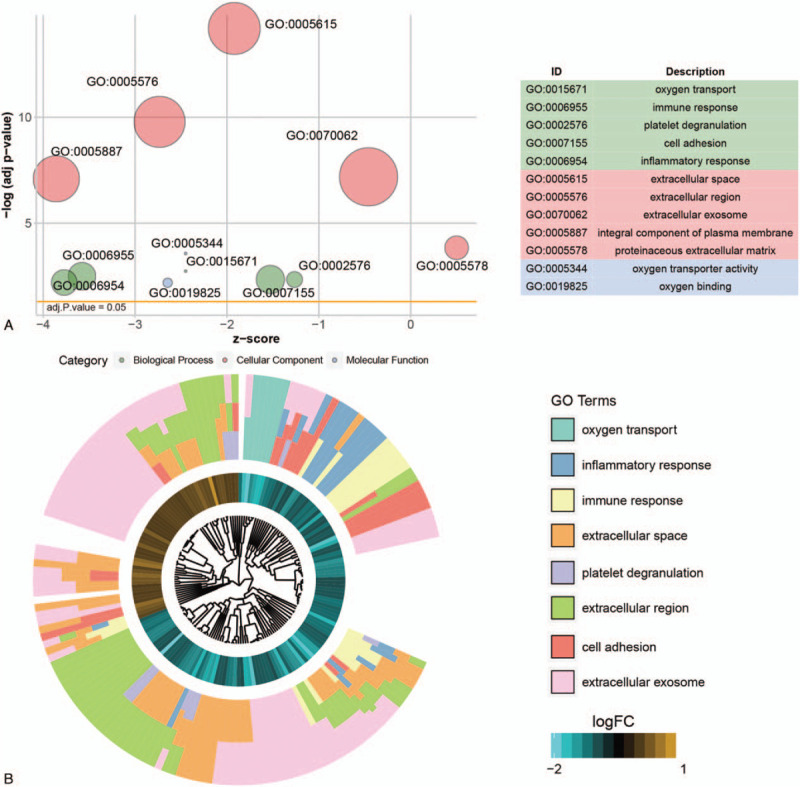
Gene ontology (GO) enrichment analysis. (A) The bubble plot of GO terms. X-axis represents the Z-score and y-axis represents the negative log adjusted P value. The area of the bubble positively correlates with the gene numbers in the indicated term. The green bubbles represent the GO terms enriched in biological process; the pink bubbles represented the GO terms enriched in cellular component and the blue bubbles represented the molecular function term. (B) GO cluster of genes in the top 8 GO term grouped by their expression level.
Next, KEGG pathway enrichment was performed and 85 significantly enriched pathways were identified. Among them, 15 pathways were activated (NES >0) and 70 pathways were suppressed (NES <0). Pathways such as “protein digestion and absorption,” “fatty acid degradation,” “valineleucine and isoleucine degradation,” “glyoxylate and dicarboxylate metabolism,” “histidine metabolism” were activated (Fig. 3A and B). The immune related pathways including “natural killer cell mediated cytotoxicity,” “primary immunodeficiency,” “rheumatoid arthritis,” “B cell receptor signaling pathway,” “T cell receptor signaling pathway,” “intestinal immune network for IgA production,” “chemokine signaling pathway,” “IL 17 signaling pathway,” “NF kappa B signaling pathway,” and “TNF signaling pathway” were significantly suppressed (Fig. 3A and B). “Protein digestion and absorption” pathway was the most significant active pathway (Fig. 3C). The “osteoclast differentiation pathway” was the most significantly suppressed one (Fig. 3D).
Figure 3.
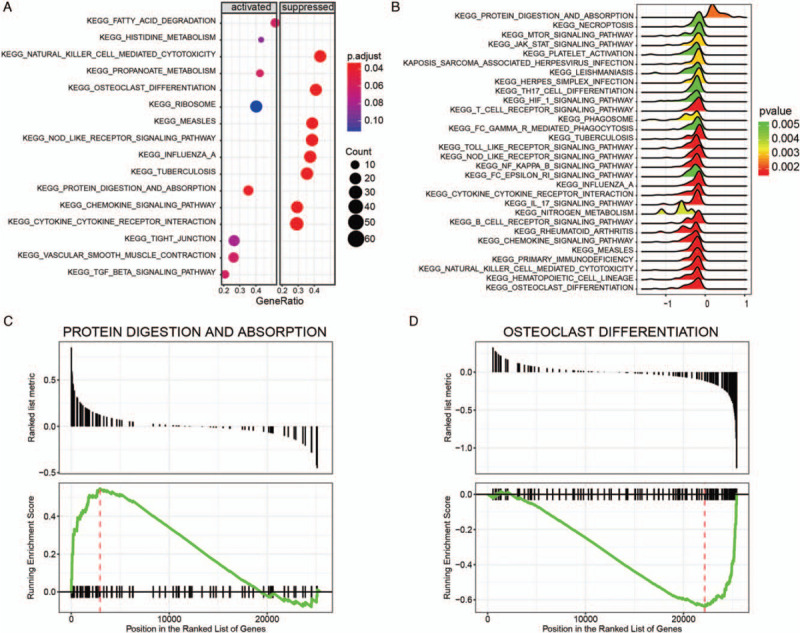
Gene set enrichment analysis of KEGG pathways. (A) Dot plot of dysregulated pathways in PE samples compared with normal samples. The color intensity of the nodes indicated KEGG pathways enriched degree. Horizontal axis indicated the gene ration as the proportion of differential genes in the whole gene set. The size represented the number counts in a certain pathway. (B) Ridge plot of dysregulated pathways. The colored intensity of peaks indicated enrichment significance. (C) The most activated pathway of “protein digestion and absorption.” Normalized enrichment score (NES) was positive for most genes in “protein digestion and absorption.” (D) The most suppressed pathway of “osteoclast differentiation.” NES was negative for most genes in “osteoclast differentiation” pathway.
3.3. WGCNA analysis of DEGs
By integrating the clinical symptom and the gene expression data, the expression profile of 305 DEGs in 48 samples were obtained. WGCNA analysis further filtered out 228 DEGs for further analysis. Most of these genes were significantly classified into 3 modules, including 131 genes in ME turquoise module, 60 genes in ME blue module, and 34 genes in ME brown module (Fig. 4A). Genes in the same module showed significant correlation, while revealed poor correlation other modules (Fig. 4A and 4B). Among the 3 identified modules, genes enriched in ME turquosis module showed higher degree, compared with those in the ME blue and ME brown modules. These data indicated that genes in ME turquosis demonstrated more function than genes in the other modules (Fig. 4C). In this network, high degree genes including TMEM71, SELL, Rgr, RGS18, P2RY13, NALP12, MCEMP1, LST1, LRG1, and LILRA2 were filtered out.
Figure 4.
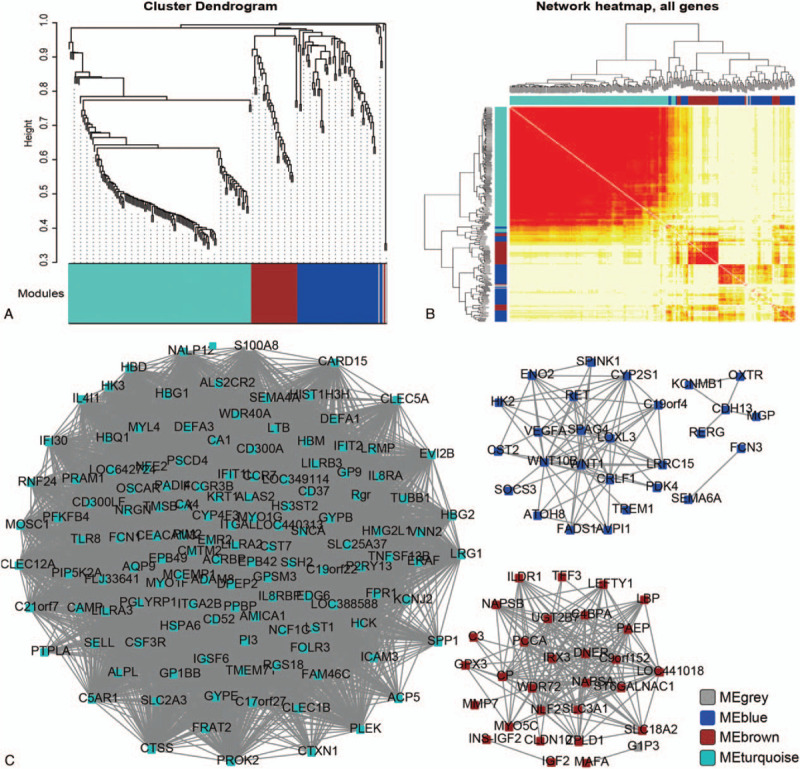
WGCNA analysis of DEGs. (A) Cluster dendrogram of DEGs in network. Different colors represented different modules. (B) Hierarchical clustering analysis of differently expressed genes. The color in the heatmap indicated correlated degree between the 2 genes. Genes in row and column were analyzed together. Deeper color represented the more correlation. (C) ncRNA-mRNA coexpression network construction. Blue: MEblue module; brown: MEbrown module; turquoise: MEturquoise module.
Clinical symptoms such as disease status, gestational age and infant weight showed great correlation with these 3 modules. However, maternal age did not reveal significant difference (Table 2).
Table 2.
The correlation between clinical phenotype and WGCNA modules.
| module | disease | age | gestational age (weeks) | infant weight (g) | |
| cor | MEbrown | 0.4495985 | −0.163577 | −0.3600296 | −0.3853923 |
| MEturquoise | −0.398738 | 0.0218055 | 0.3558121 | 0.5037802 | |
| MEblue | −0.555048 | 0.1298954 | 0.4023702 | 0.3802591 | |
| P value | MEbrown | 1.35E–03 | 0.2665997 | 0.011953145 | 6.83E–03 |
| MEturquoise | 5.00E–03 | 0.8830466 | 0.013065607 | 2.62E–04 | |
| MEblue | 4.23E–05 | 0.3788831 | 0.004580631 | 7.68E–03 |
3.4. Construction and functional annotation of ceRNA network
To further analyze the genes in the 3 modules, paired genes with adjusted P value <.05 and |r| ≥ 0.75 were calculated and a lncRNA-mRNA coexpression network was constructed (Fig. 5). There were 74 nodes and 102 edges including 58 mRNAs and 16 ncRNAs. High connect nodes were identified such as SUMO1P3, NACAP1, NCF1C, ANXA2P1, GTF2IP1, NAPSB, and OR7E37P.
Figure 5.
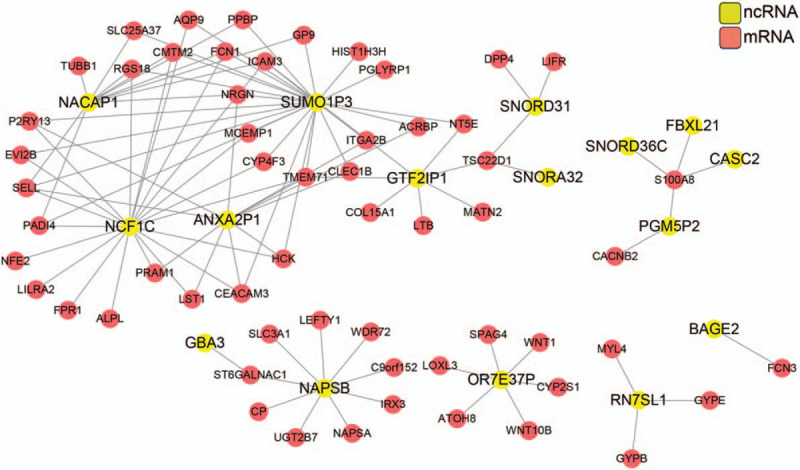
ncRNA-mRNA network construction for the genes from the 3 modules. Gene pairs were chosen using correlation ration |r|≥0.75 and adj. P value <.05. Red, mRNA; yellow, ncRNA.
We screened ncRNA-mRNA pairs regulated by a common miRNA, which was predicted from starbase and miRwalk databases. These ncRNA-mRNA pairs together with miRNAs were integrated into a ceRNA network including 25 mRNAs, 7 ncRNAs and 43 miRNAs (Fig. 6). Functional analysis of the network revealed that genes in this network were involved in molecular function of carbohydrate binding and sugar binding and were mostly located on cellular membrane (Table 3).
Figure 6.
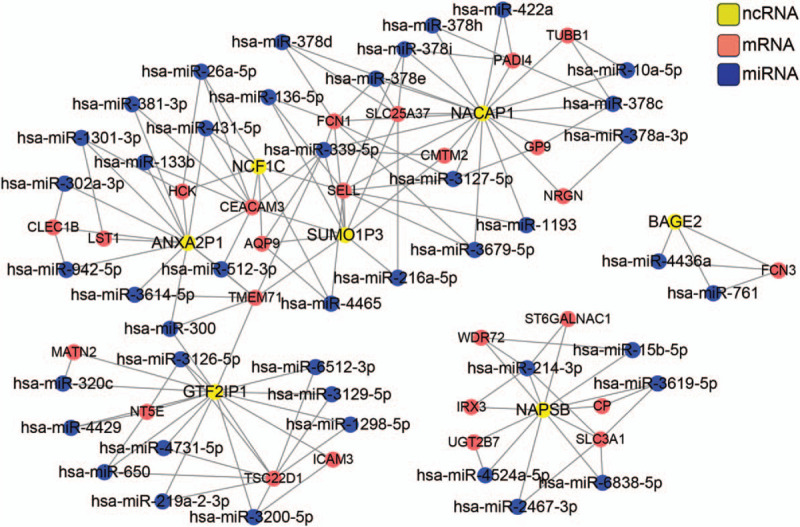
ceRNA network construction and functional analysis. Red, mRNA; yellow, ncRNA; blue, miRNA.
Table 3.
The enriched GO term from ceRNA network.
| Category | ID | Description | P value |
| CC | GO:0031224 | intrinsic to membrane | .00153 |
| CC | GO:0031226 | intrinsic to plasma membrane | .006676 |
| CC | GO:0005887 | integral to plasma membrane | .026502 |
| CC | GO:0031225 | anchored to membrane | .041611 |
| CC | GO:0016021 | integral to membrane | .046561 |
| CC | GO:0044421 | extracellular region part | .049485 |
| MF | GO:0005529 | sugar binding | .002708 |
| MF | GO:0030246 | carbohydrate binding | .014083 |
CC = cellular component, MF = molecular function.
3.5. Validation of hub lncRNAs in the ceRNA network by qRT-PCR
The 7 lncRNAs in the ceRNA network included SUMO1P3, NACAP1, NCF1C, ANXA2P1, GTF2IP1, NAPSB, and OR7E37P. Differential expression analysis revealed that SUMO1P3 (adjusted P value =.002074, logFC =0.266), NACAP1 (adjusted P value =.002074, logFC =0.266), ANXA2P1 (adjusted P value =.000408, logFC =0.567569), GTF2IP1 (adjusted P value =.002151, logFC =0.387), and NAPSB (adjusted P value =.007509, logFC =0.932425) were upregulated in PE patients while NCF1C (adjusted P value=.0131776, logFC =−0.847) and OR7E37P (adjusted P value =.031679, logFC =−0.29648) were downregulated. We further verified expression of these 7 lncRNAs in 5 PE patients and 5 normotensive maternal women. The characteristics of these women are displayed in Table 4. There was no significant difference between the 2 groups on maternal age (P > .05). The gestational age, infant birth weight, systolic blood pressure and diastolic blood pressure were significantly different between these 2 groups (P < .05).
Table 4.
Patient characteristics.
| Patient characteristics | PE | Normotensive | P |
| Maternal age, years | 30.6 ± 7.7 | 32.4 ± 4.6 | 0.67 |
| Gestational age, weeks | 33 ± 4.4 | 39 ± 4.8 | 0.0066 |
| Infant birth weight, g | 1862 ± 604.2 | 3482 ± 619.85 | 0.003 |
| Systolic blood pressure, mmHg | 156 ± 16.7 | 122.6 ± 4.4 | 0.0025 |
| Diastolic blood pressure, mmHg | 101.2 ± 11.0 | 75 ± 7.8 | 0.0025 |
| Proteinuria, g/24h | 3.2 ± 2.3 | NA | NA |
qRT-PCR results are displayed in Figure 7. The differential expression of the upregulated lncRNAs ANXA2P1, GTF2IP1, NACAP1 and the downregulated lncRNAs NCF1C, OR7E37P were successfully validated in our clinical specimens (P < .05). However, there is no significantly difference between control and PE patients on small ubiquitin-like modifier 1 pseudogene 3 (SUMO1P3) and NAPSB expression (P > .05).
Figure 7.
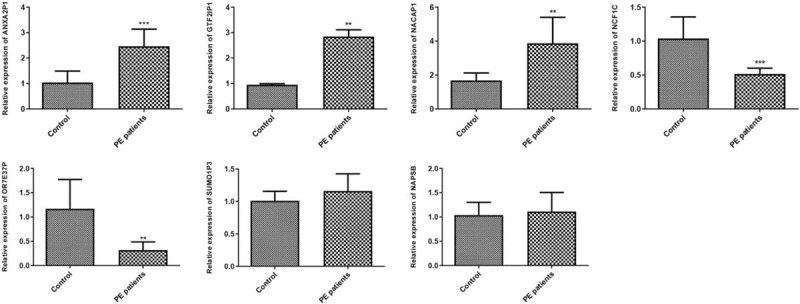
Validation of hub lncRNAs in the ceRNA network by qRT-PCR. Comparisons between groups were conducted by student's t test in Graphpad Prism 5.0. ∗∗ indicated P < .01, ∗∗∗ indicated P < .001.
4. Discussion
PE is defined as hypertension associated with one or more new-onset conditions including proteinuria, renal insufficiency, liver involvement, neurological complications, haematological complications, or uteroplacental dysfunction.[5] Various pathways have been implicated in the pathogenesis. In this study, we found DEGs were enriched in oxygen transport, immune response, inflammatory response, cell adhesion, angiogenesis, and platelet degranulation function. These genes were involved in immune related pathways and many other signaling pathways. Next, WGCNA analysis was performed to explore the hub genes combined with clinical syndrome. Further analysis revealed that disease, gestational age and infant weight were closely associated with identified modules. We identified 7 hub lncRNAs: SUMO1P3, NACAP1, NCF1C, ANXA2P1, GTF2IP1, NAPSB and OR7E37P. Five of these hub lncRNAs, including ANXA2P1, GTF2IP1, NACAP1, NCF1C, and OR7E37P were successfully validated in our clinical specimens.
The placental and maternal dysfunctions contribute to the pathogenesis of PE. Several genetic, angiogenic and other pathways have been showed in PE. Trophoblast invasion impairment would lead to imbalance between pro- and anti- angiogenic factors.[17,18] Endothelial cells count a lot in inflammatory response, which would up-regulated the cytokines and adhesion factors secretion in PE.[19,20] Additionally, placental oxygenation, redox and immune tolerance have also been involved in PE.[21,22] Our research is consistent with previous studies that DEGs enriched in oxygen transport, immune response, inflammatory response, cell adhesion and angiogenesis, platelet degranulation function. All these pathways have been implicated in PE. Notably, the “osteoclast differentiation” was found to be significantly suppressed in PE. During pregnancy, bone turnover increases significantly in order to meet the demands from the fetus.[23] Evidences suggested that bone metabolism is altered in hypertensive pregnancies compared with normotensive pregnancies and bone resorption is increased and bone formation is decreased in PE patients.[24,25] Vitoratos et al demonstrated that PE patients exhibit higher OPG (osteoprotegerin) levels, a key factor in inhibiting bone resorption, which might be compatible with lower bone turnover.[26] Consistent with these studies, our study supports that bone turnover in PE was suppressed in PE compared with control pregnancies.
Various investigations have been implemented for possible biomarkers in PE. Angiogenic factors emerged as important biomarkers in PE. Imbalance of these factors located in the central position of pathogenesis of PE. The expression of PIGF, sFLT1, and sENG differs significantly between women with PE and normotensive pregnancies. The ratio of sFLT1 to PIGF and PIGF to sENG is characterized with good performance in prediction.[27–30] In addition, ICAM-1 and VCAM-1 in endothelial dysfunction, cell free fetal DNA marker HYP2, NK cells in immune reaction, ROS in oxidative stress and other biomarkers including ADAM-12, PAPP-A, and PP-13 have been implicated their clinical function in PE.[31–34]
In our research, 7 hub genes: SUMO1P3, NACAP1, NCF1C, ANXA2P1, GTF2IP1, NAPSB, and OR7E37P were identified as the diagnostic biomarker in prediction of PE. All these genes including protein coding gene and non-coding gene have not been reported before.
Small ubiquitin-like modifier 1 pseudogene 3 (SUMO1P3) is a pseudogene-expressed lncRNA which served as the oncogenic lncRNA in many kinds of human malignancy. Differently expressed SUMO1P3 has been reported in gastric cancer, non-small cell lung cancer, bladder cancer and hepatocellular carcinoma, which revealed its diagnostic function.[35–39] Annex in A2 pseudogenes (ANXA2P1) is differently expressed pseudogenes between glioblastomas and normal control tissues.[40] Deletion breakpoints mapping to GTF2IP1 is associated with Williams–Beuren syndrome.[41] Over-expressed NAPSB has been identified in carcinoma of the uterine cervix and this result indicated its correlation with CACX.[42] To our surprise, the function of NACAP1, NCF1C and OR7E37P have yet to be reported. All these genes were firstly reported in pathology of PE, thus providing the underlying clinically predictive significance. Other points we should pay attention to are all these identified genes were pseudogenes and these remind us that pseudogenes could be new biomarkers in PE progress.
There are some limitations in this study. First, though 5 of these hub lncRNAs, including ANXA2P1, GTF2IP1, NACAP1, NCF1C, and OR7E37P were successfully validated in our clinical specimens, the sample size is relatively small. Further studies involved in a large sample size are still warranted. Second, though the key lncRNAs involved in PE were identified, the exact mechanism of these lncRNAs involved in PE should be further studied.
In conclusion, we identified 355 DEGs between PE and normal samples. Functional analysis showed that immune pathway, inflammation pathway, and cell adhesion pathway were involved in development of PE. Further WGCNA analysis constructed ncRNA-mRNA network. Three modules were constructed and hub genes were filtered out. The hub ncRNAs combined with physical status might not only mediate the relationship between biological pathways, but also offer novel insights into the diagnosis and pathogenesis of PE. Combined with miRNAs, ceRNA network was constructed. Hub lncRNAs including SUMO1P3, NACAP1, NCF1C, ANXA2P1, GTF2IP1, NAPSB, and OR7E37P were identified and 5 lncRNAs ANXA2P1, GTF2IP1, NACAP1, NCF1C, and OR7E37P were successfully validated in our clinical specimens. However, further validation in a large sample size set and molecular mechanism of these key lncRNAs should be investigated in future.
Author contributions
Acquisition of data: Xiaohong Hou
Analysis and interpretation of data: Jing He, Kang Liu
Conceptualization: Jing He.
Data curation: Kang Liu, Jieqiang Lu.
Drafting the manuscript: Jing He
Formal analysis: Jing He.
Methodology: Kang Liu, Xiaohong Hou, Jieqiang Lu.
Project administration: Jing He.
Revision of manuscript for important intellectual content: Jieqiang Lu
Footnotes
Abbreviations: ANXA2P1 = annex in A2 pseudogenes, ceRNA = competitive endogenous RNA, DEGs = differentially expressed genes, DElncRNAs = differentially expressed lncRNAs, DEmRNAs = differentially expressed mRNAs, FC = fold change, GEO = gene expression omnibus, GSEA = gene set enrichment analysis, GO = gene ontology, KEGG = kyoto encyclopedia of genes and genomes, lncRNAs = long non-coding RNAs, MAD = median absolute deviation, miRNAs = microRNAs, NES = normalized enrichment score, PCC = Pearson correlation coefficient, PE = pre-eclampsia, OPG = osteoprotegerin, SUMO1P3 = Small ubiquitin-like modifier 1 pseudogene 3, WGCNA = weighted gene co-expression network analysis.
How to cite this article: He J, Liu K, Hou X, Lu J. Identification and validation of key non-coding RNAs and mRNAs using co-expression network analysis in pre-eclampsia. Medicine. 2021;100:14(e25294).
This study was approved by the ethic committee of Shanxi Dayi Hospital.
The datasets used and analyzed in the current study are available from (GEO) database (https://www.ncbi.nlm.nih.gov/geo/) with accession number of GSE60438.
The authors have no funding and conflicts of interests to disclose.
The datasets generated during and/or analyzed during the current study are available from the corresponding author on reasonable request.
References
- [1].Lowe SA, Bowyer L, Lust K, et al. SOMANZ guidelines for the management of hypertensive disorders of pregnancy 2014. Aus New Zealand J Obstet Gynaecol 2015;55:e1–29. [DOI] [PubMed] [Google Scholar]
- [2].American College of Obstetricians and Gynecologists. Hypertension in pregnancy. Report of the American College of Obstetricians and Gynecologists’ task force on hypertension in pregnancy. Obstet Gynecol 2013;122:1122–31. [DOI] [PubMed] [Google Scholar]
- [3].Steegers EAP, von Dadelszen P, Duvekot JJ, et al. Pre-eclampsia. Lancet 2010;376:631–44. [DOI] [PubMed] [Google Scholar]
- [4].Cox AG, Marshall SA, Palmer KR, et al. Current and emerging pharmacotherapy for emergency management of preeclampsia. Exp Opin Pharmacother 2019;20:701–12. [DOI] [PubMed] [Google Scholar]
- [5].Phipps EA, Thadhani R, Benzing T, et al. Pre-eclampsia: pathogenesis, novel diagnostics and therapies. Nat Rev Nephrol 2019;15:275–89. [DOI] [PMC free article] [PubMed] [Google Scholar]
- [6].He X, He Y, Xi B, et al. LncRNAs expression in preeclampsia placenta reveals the potential role of LncRNAs contributing to preeclampsia pathogenesis. PLoS One 2013;8:e81437. [DOI] [PMC free article] [PubMed] [Google Scholar]
- [7].Long W, Rui C, Song X, et al. Distinct expression profiles of lncRNAs between early-onset preeclampsia and preterm controls. Clinica Chimica Acta 2016;463:193–9. [DOI] [PubMed] [Google Scholar]
- [8].Tong J, Zhao W, Lv H, et al. Transcriptomic profiling in human decidua of severe preeclampsia detected by RNA sequencing. J Cell Biochem 2018;119:607–15. [DOI] [PubMed] [Google Scholar]
- [9].Creemers EE, Tijsen AJ, Pinto YM, et al. Circulating microRNAs: novel biomarkers and extracellular communicators in cardiovascular disease? Circ Res 2012;110:483–95. [DOI] [PubMed] [Google Scholar]
- [10].Hromadnikova I, Kotlabova K, Ondrackova M, et al. Circulating C19MC microRNAs in preeclampsia, gestational hypertension, and fetal growth restriction. Mediators Inflamm 2013;2013:186041. [DOI] [PMC free article] [PubMed] [Google Scholar]
- [11].Giulietti M, Righetti A, Principato G, et al. LncRNA co-expression network analysis reveals novel biomarkers for pancreatic cancer. Carcinogenesis 2018;39:1016–25. [DOI] [PubMed] [Google Scholar]
- [12].Huang T, Wang Y, Wang Z, et al. Weighted gene co-expression network analysis identified cancer cell proliferation as a common phenomenon during perineural invasion. Onco Targets Ther 2019;12:10361–74. [DOI] [PMC free article] [PubMed] [Google Scholar]
- [13].Xia WX, Zhang LH, Liu YW. Weighted gene co-expression network analysis reveals six hub genes involved in and tight junction function in pancreatic adenocarcinoma and their potential use in prognosis. Genetic Testing Mol Biomarkers 2019;23:829–36. [DOI] [PubMed] [Google Scholar]
- [14].Yong HE, Melton PE, Johnson MP, et al. Genome-wide transcriptome directed pathway analysis of maternal pre-eclampsia susceptibility genes. PloS One 2015;10:e0128230. [DOI] [PMC free article] [PubMed] [Google Scholar]
- [15].Walter W, SanchezCabo F, Ricote M. GOplot: an R package for visually combining expression data with functional analysis. Bioinformatics (Oxford, England) 2015;31:2912–4. [DOI] [PubMed] [Google Scholar]
- [16].Juhas M, Crook DW, Hood DW, et al. Secretion systems: tools of bacterial horizontal gene transfer and virulence. Cell Microbiol 2008;10:2377–86. [DOI] [PMC free article] [PubMed] [Google Scholar]
- [17].Lu F, Longo M, Tamayo E, et al. The effect of over-expression of sFlt-1 on blood pressure and the occurrence of other manifestations of preeclampsia in unrestrained conscious pregnant mice. Am J Obstet Gynecol 2007;196:396.e391-396.e397. [DOI] [PubMed] [Google Scholar]
- [18].Roberts JM, Rajakumar A. Preeclampsia and soluble fms-like tyrosine kinase 1. J Clin Endocrinol Metab 2009;94:2252–4. [DOI] [PMC free article] [PubMed] [Google Scholar]
- [19].Daniel Y, Kupferminc MJ, Baram A, et al. Plasma soluble endothelial selectin is elevated in women with pre-eclampsia. Hum Reprod 1998;13:3537–41. [DOI] [PubMed] [Google Scholar]
- [20].Henriksen T. The role of lipid oxidation and oxidative lipid derivatives in the development of preeclampsia. Sem Perinatol 2000;24:29–32. [DOI] [PubMed] [Google Scholar]
- [21].Myatt L, Cui X. Oxidative stress in the placenta. Histochem Cell Biol 2004;122:369–82. [DOI] [PubMed] [Google Scholar]
- [22].Rahimi Z, Malek-Khosravi S, Rahimi Z, et al. MTHFR C677T and eNOS G894T variants in preeclamptic women: contribution to lipid peroxidation and oxidative stress. Clin Biochem 2013;46:143–7. [DOI] [PubMed] [Google Scholar]
- [23].Pitkin RM. Calcium metabolism in pregnancy and the perinatal period: a review. Am J Obstet Gynecol 1985;151:99–109. [DOI] [PubMed] [Google Scholar]
- [24].Shaarawy M, Zaki S, Ramzi AM, et al. Feto-maternal bone remodeling in normal pregnancy and preeclampsia. J Soc Gynecol Investig 2005;12:343–8. [DOI] [PubMed] [Google Scholar]
- [25].Anim-Nyame N, Sooranna SR, Jones J, et al. Biochemical markers of maternal bone turnover are elevated in pre-eclampsia. BJOG 2001;108:258–62. [DOI] [PubMed] [Google Scholar]
- [26].Vitoratos N, Lambrinoudaki I, Rizos D, et al. Maternal circulating osteoprotegerin and soluble RANKL in pre-eclamptic women. Eur J Obstet Gynecol Reprod Biol 2011;154:141–5. [DOI] [PubMed] [Google Scholar]
- [27].Kusanovic JP, Romero R, Chaiworapongsa T, et al. A prospective cohort study of the value of maternal plasma concentrations of angiogenic and anti-angiogenic factors in early pregnancy and midtrimester in the identification of patients destined to develop preeclampsia. J Matern Fetal Neona 2009;22:1021–38. [DOI] [PMC free article] [PubMed] [Google Scholar]
- [28].Kleinrouweler CE, Wiegerinck MMJ, Ris-Stalpers C, et al. Accuracy of circulating placental growth factor, vascular endothelial growth factor, soluble fms-like tyrosine kinase 1 and soluble endoglin in the prediction of pre-eclampsia: a systematic review and meta-analysis. BJOG 2012;119:778–87. [DOI] [PubMed] [Google Scholar]
- [29].Chappell LC, Duckworth S, Seed PT, et al. Diagnostic accuracy of placental growth factor in women with suspected preeclampsia. Circulation 2013;128:2121–31. [DOI] [PubMed] [Google Scholar]
- [30].Moore Simas TA, Crawford SL, Bathgate S, et al. Angiogenic biomarkers for prediction of early preeclampsia onset in high-risk women. J Maternal-Fetal Neonatal Med 2014;27:1038–48. [DOI] [PubMed] [Google Scholar]
- [31].Grill S, Rusterholz C, Zanetti-Dällenbach R, et al. Potential markers of preeclampsia--a review. Reprod Biol Endocrinol 2009;7:70. [DOI] [PMC free article] [PubMed] [Google Scholar]
- [32].Lockwood CJ, Huang SJ, Chen CP, et al. Decidual cell regulation of natural killer cell–recruiting chemokines: implications for the pathogenesis and prediction of preeclampsia. Am J Pathol 2013;183:841–56. [DOI] [PMC free article] [PubMed] [Google Scholar]
- [33].Kim SY, Kim HJ, Park SY, et al. Early prediction of hypertensive disorders of pregnancy using cell-free fetal DNA, cell-free total DNA, and biochemical markers. Fetal Diagn Ther 2016;40:255–62. [DOI] [PubMed] [Google Scholar]
- [34].McCarthy FP, Ryan RM, Chappell LC. Prospective biomarkers in preterm preeclampsia: a review. Pregnancy Hypertens 2018;14:72–8. [DOI] [PubMed] [Google Scholar]
- [35].Mei D, Song H, Wang K, et al. Up-regulation of SUMO1 pseudogene 3 (SUMO1P3) in gastric cancer and its clinical association. Med Oncol 2013;30:709. [DOI] [PubMed] [Google Scholar]
- [36].Li PF, Chen SC, Xia T, et al. Non-coding RNAs and gastric cancer. World J Gastroenterol 2014;20:5411–9. [DOI] [PMC free article] [PubMed] [Google Scholar]
- [37].Zhang Y, Li Y, Han L, et al. SUMO1P3 is associated clinical progression and facilitates cell migration and invasion through regulating miR-136 in non-small cell lung cancer. Biomed Pharmacother 2019;113:108686. [DOI] [PubMed] [Google Scholar]
- [38].Tian C, Jin Y, Shi S. Long non-coding RNA SUMO1P3 may promote cell proliferation, migration, and invasion of pancreatic cancer via EMT signaling pathway. Oncol Lett 2018;16:6109–15. [DOI] [PMC free article] [PubMed] [Google Scholar]
- [39].Zhou Y, He P, Xie X, et al. Knockdown of SUMO1P3 represses tumor growth and invasion and enhances radiosensitivity in hepatocellular carcinoma. Mol Cell Biochem 2019;450:125–34. [DOI] [PubMed] [Google Scholar]
- [40].Li S, Zou H, Shao YY, et al. Pseudogenes of annexin A2, novel prognosis biomarkers for diffuse gliomas. Oncotarget 2017;8:106962–75. [DOI] [PMC free article] [PubMed] [Google Scholar]
- [41].Bayés M, Magano LF, Rivera N, et al. Mutational mechanisms of Williams–Beuren syndrome deletions. Am J Hum Genet 2003;73:131–51. [DOI] [PMC free article] [PubMed] [Google Scholar]
- [42].Roychowdhury A, Samadder S, Das P, et al. Deregulation of H19 is associated with cervical carcinoma. Genomics 2020;112:961–70. [DOI] [PubMed] [Google Scholar]


