Abstract
A molecular docking approach was employed to evaluate the binding affinity of six triterpenes, namely epifriedelanol, friedelin, α-amyrin, α-amyrin acetate, β-amyrin acetate, and bauerenyl acetate, towards the cannabinoid type 1 receptor (CB1). Molecular docking studies showed that friedelin, α-amyrin, and epifriedelanol had the strongest binding affinity towards CB1. Molecular dynamics simulation studies revealed that friedelin and α-amyrin engaged in stable non-bonding interactions by binding to a pocket close to the active site on the surface of the CB1 target protein. The studied triterpenes showed a good capacity to penetrate the blood–brain barrier. These results help to provide some evidence to justify, at least in part, the previously reported antinociceptive and sedative properties of Vernonia patula.
Keywords: molecular docking, molecular dynamics, triterpenes, Vernonia patula
1. Introduction
The cannabinoid receptors (CB) belong to the superfamily of G protein-coupled receptors and are divided into two major types: CBR type-1 (CB1) and CBR type-2 (CB2). The CB1 receptors are commonly found in the central nervous system (CNS) and mostly control pain, movement, and neurotic parameters [1,2,3]. CB1 can be also found in peripheral tissues including retina [4], colon [5], testis [6], sperm cells [7], and adipocytes [8]. In contrast, CB2 receptors are mostly found in peripheral tissues [9]. Cannabinoids have already demonstrated great potential for the treatment of pain, inflammation, and neurodegenerative disorders [10,11,12]. These include the phytocannabinoids from Cannabis sativa and other plant-derived cannabinoid-like molecules called cannabimimetics that can interact with the endogenous cannabinoid system [13].
Vernonia patula (Dryand.) Merr. (Asteraceae) (VP) is an annual herb widely distributed throughout Southeast Asia. It is used medicinally for malaria, colds, fevers, respiratory ailments, and convulsions [14,15]. The leaves are used for their analgesic properties [16]. The aerial parts of VP have displayed antioxidant and anti-inflammatory activity [17]. Several Vernonia species, including VP, have also demonstrated antinociceptive and sedative properties [18,19,20]. The aerial parts of VP are known to contain flavonoids, simple phenolics, and terpenoids [21,22,23]. Previous reports have indicated that triterpenes could act as CB1 receptor agonists [24]. In the present work, we conducted molecular docking and molecular dynamics simulation studies on six triterpenes previously reported in the aerial parts of VP against the CB1 receptor with a view to (i) validating the medicinal properties of this plant and (ii) identifying new plant-derived cannabimimetic drug templates.
2. Results
2.1. HPLC-DAD-MS Analysis
The results of the HPLC-DAD-MS analysis (Figures S1–S3) indicated the presence of epifriedelanol (1), friedelin (2), α-amyrin (3) and α-amyrin acetate (4), β-amyrin acetate (5), and bauerenyl acetate (6) in VP.
2.2. Prediction of the Pharmacokinetic and Drug-Likeness Properties
All triterpenes had a molecular weight of less than 500 g/mol. Their Moriguchi LogP (MLogP) values were higher than those of the tetrahydrocannabinol (THC) control, while their polar surface areas were lower than THC (Table 1). All compounds showed high lipophilicity and insolubility in the Bioavailability Radar plots (Figure S4). Friedelin and α-amyrin demonstrated a similar human intestine absorption prediction score to that of THC (0.99). All triterpenes showed a good capacity to penetrate the blood–brain barrier. Friedelin showed the highest blood–brain barrier penetration prediction score (0.99), comparable to THC (1.00).
Table 1.
Drug-likeness parameters prediction for tetrahydrocannabinol (THC), epifriedelanol (1), friedelin (2), α-amyrin (3) and α-amyrin acetate (4), β-amyrin acetate (5), and bauerenyl acetate (6).
| Parameters | THC | (1) | (2) | (3) | (4) | (5) | (6) |
|---|---|---|---|---|---|---|---|
| Structural formula | C21H30O2 | C30H52O | C30H50O | C30H50O | C32H52O2 | C32H52O2 | C32H52O3 |
| Molecular weight (g/mol) | 314.46 | 428.73 | 426.72 | 426.72 | 468.75 | 468.75 | 468.75 |
| Blood–brain barrier (p.s.) a | 1.00 | 0.96 | 0.99 | 0.84 | 0.83 | 0.83 | 0.83 |
| MLogP b | 4.39 | 7.07 | 6.92 | 6.92 | 7.08 | 7.08 | 7.08 |
| TPSA c (Å2) | 29.46 | 20.23 | 17.07 | 20.23 | 26.30 | 26.30 | 26.30 |
| Human intestinal absorption (p.s.) | 0.99 | 0.99 | 0.99 | 0.99 | 0.99 | 0.99 | 0.99 |
| Human oral bioavailability | NSP d | 0.5857 | 0.6857 | NSP | NSP | NSP | NSP |
| Bioavailability score | 0.55 | 0.55 | 0.55 | 0.55 | 0.55 | 0.55 | 0.55 |
a p.s. = prediction score. b MLogP = Log Poil/water. c TPSA = topological polar surface area. d NSP = negative score prediction.
2.3. Molecular Docking
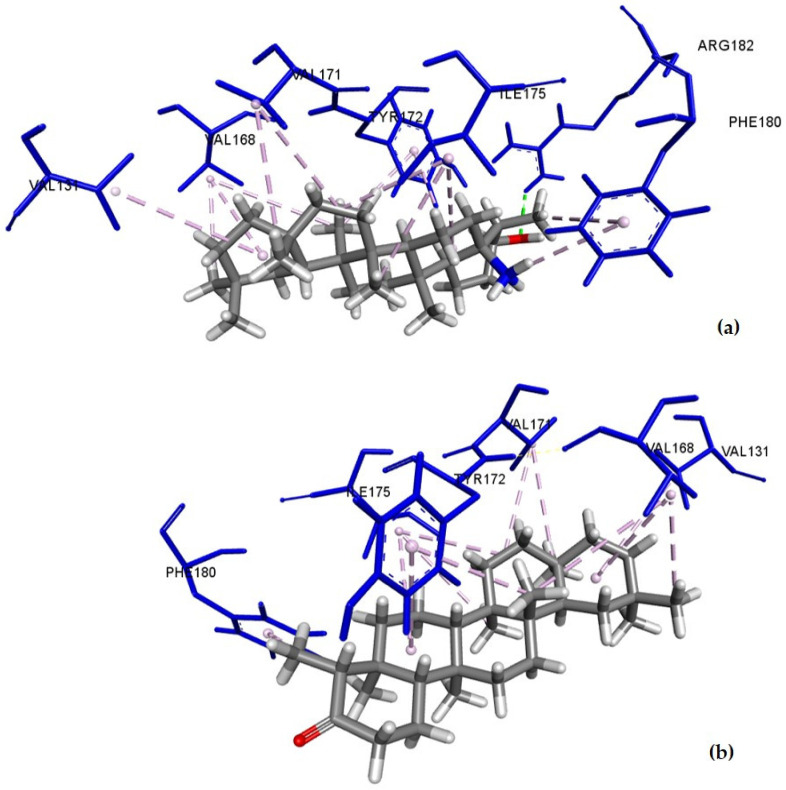
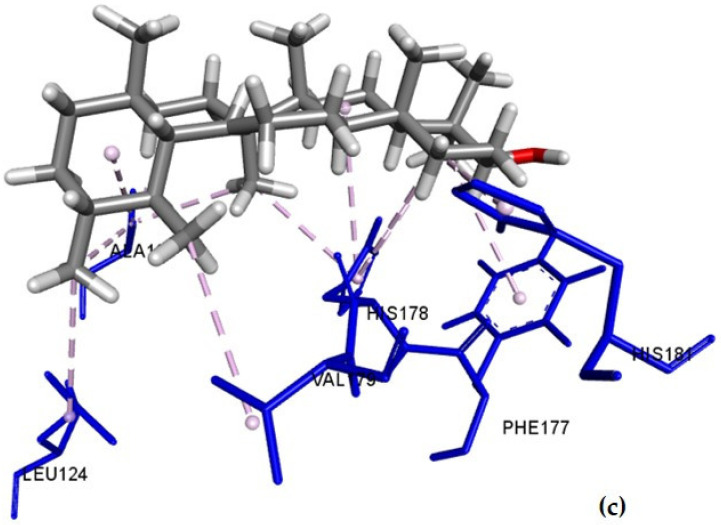
Alpha-amyrin, friedelin, and epifriedelanol displayed the best binding affinities for CB1 with scores of −8.3, −8.1, and −8.1 kcal/mol, respectively. The THC control had a predictive binding affinity of −9.4 kcal/mol. The amino acid residues of CB1 involved in the binding with THC, epifriedelanol (1), friedelin (2), and α-amyrin (3) with their bonding distances are depicted in Table 2. The predictive binding affinity of the remaining triterpenes towards CB1 are shown in Table S1. The intermolecular binding interactions of epifriedelanol–CB1, friedelin–CB1, and α-amyrin–CB1 are depicted in Figure 1. THC showed 16 interactions, including one conventional H-bond (THC-OH·Met384-S), one Pi-Sigma, one amide-Pi stacking, and six alkyl and seven Pi-Alkyl bonds. It formed non-bonding interactions with both Phe102 and Phe379 residues within the active site of the CB1 protein. Epifriedelanol formed one conventional H-bond (Arg182-NH2·Epifriedelanol-O), and 13 hydrophobic (9 alkyl and 4 Pi-alkyl) non-bonding interactions. Friedelin formed 13 hydrophobic (9 alkyl and 4 Pi-alkyl) non-bonding interactions. Both epifriedelanol and friedelin were found to bind to a pocket containing residues Ile175, Tyr172, and Phe180 that were close to the active binding site of the THC control. Alpha-amyrin formed 12 hydrophobic (6 alkyl and 6 Pi-alkyl) non-bonding interactions with residues Ala120, Phe177, His178, and Val179, also close to the active binding site.
Table 2.
Intermolecular interactions of THC, epifriedelanol, friedelin, and α-amyrin with CB1.
| Ligand | Binding Affinity (kcal/mol) | Binding Residues | Category | Type | Distance (Å) |
|---|---|---|---|---|---|
| THC | −9.4 | Met384 | Hydrogen Bond | Conventional | 2.59 |
| Met103 | Hydrophobic | Pi-Sigma | 3.67 | ||
| Met103 | Hydrophobic | Amide-Pi Stacked | 4.71 | ||
| Ile105 | Hydrophobic | Alkyl | 4.27 | ||
| Leu111 | Hydrophobic | Alkyl | 5.12 | ||
| Ile119 | Hydrophobic | Alkyl | 4.54 | ||
| Val196 | Hydrophobic | Alkyl | 3.97 | ||
| Ala380 | Hydrophobic | Alkyl | 4.16 | ||
| Met103 | Hydrophobic | Alkyl | 4.93 | ||
| Ile105 | Hydrophobic | Pi-Alkyl | 5.19 | ||
| Phe102 | Hydrophobic | Pi-Alkyl | 5.24 | ||
| Phe102 | Hydrophobic | Pi-Alkyl | 4.70 | ||
| Phe108 | Hydrophobic | Pi-Alkyl | 4.16 | ||
| Phe108 | Hydrophobic | Pi-Alkyl | 3.76 | ||
| His178 | Hydrophobic | Pi-Alkyl | 4.76 | ||
| Phe379 | Hydrophobic | Pi-Alkyl | 5.15 | ||
| Friedelin | −8.1 | Val171 | Hydrophobic | Alkyl | 4.65 |
| Ile175 | Hydrophobic | Alkyl | 4.45 | ||
| Val171 | Hydrophobic | Alkyl | 4.81 | ||
| Val168 | Hydrophobic | Alkyl | 4.01 | ||
| Ile175 | Hydrophobic | Alkyl | 5.14 | ||
| Val168 | Hydrophobic | Alkyl | 5.34 | ||
| Val131 | Hydrophobic | Alkyl | 5.26 | ||
| Val168 | Hydrophobic | Alkyl | 4.3 | ||
| Ile175 | Hydrophobic | Alkyl | 5.43 | ||
| Tyr172 | Hydrophobic | Pi-Alkyl | 4.82 | ||
| Tyr172 | Hydrophobic | Pi-Alkyl | 4.64 | ||
| Phe180 | Hydrophobic | Pi-Alkyl | 4.93 | ||
| Phe180 | Hydrophobic | Pi-Alkyl | 4.69 | ||
| α-amyrin | −8.3 | Ala120 | Hydrophobic | Alkyl | 4.27 |
| Leu124 | Hydrophobic | Alkyl | 4.83 | ||
| Val179 | Hydrophobic | Alkyl | 4.74 | ||
| Ala120 | Hydrophobic | Alkyl | 4.03 | ||
| Ala120 | Hydrophobic | Alkyl | 4.20 | ||
| Ala120 | Hydrophobic | Alkyl | 3.88 | ||
| Phe177 | Hydrophobic | Pi-Alkyl | 4.98 | ||
| His178 | Hydrophobic | Pi-Alkyl | 4.95 | ||
| His178 | Hydrophobic | Pi-Alkyl | 4.96 | ||
| His178 | Hydrophobic | Pi-Alkyl | 4.80 | ||
| His178 | Hydrophobic | Pi-Alkyl | 4.22 | ||
| His181 | Hydrophobic | Pi-Alkyl | 4.41 | ||
| Epifriedelanol | −8.1 | Arg182 | Hydrogen Bond | Conventional | 2.32 |
| Val171 | Hydrophobic | Alkyl | 4.73 | ||
| Ile175 | Hydrophobic | Alkyl | 4.53 | ||
| Val171 | Hydrophobic | Alkyl | 4.93 | ||
| Val168 | Hydrophobic | Alkyl | 4.11 | ||
| Ile175 | Hydrophobic | Alkyl | 5.20 | ||
| Val168 | Hydrophobic | Alkyl | 5.37 | ||
| Val131 | Hydrophobic | Alkyl | 5.37 | ||
| Val168 | Hydrophobic | Alkyl | 4.30 | ||
| Ile175 | Hydrophobic | Alkyl | 5.46 | ||
| Tyr172 | Hydrophobic | Pi-Alkyl | 4.76 | ||
| Tyr172 | Hydrophobic | Pi-Alkyl | 4.62 | ||
| Phe180 | Hydrophobic | Pi-Alkyl | 4.76 | ||
| Phe180 | Hydrophobic | Pi-Alkyl | 4.88 |
Figure 1.
Docked pose of (a) epifriedelanol; (b) friedelin; (c) α-amyrin in the CB1 binding site showing molecular interactions—hydrogen and hydrophobic bonds as green and pink/purple dashed lines, respectively, generated by BIOVIA Discovery Studio visualizer.
2.4. Molecular Dynamics (MD) Simulations
2.4.1. Total Potential Energy Calculations
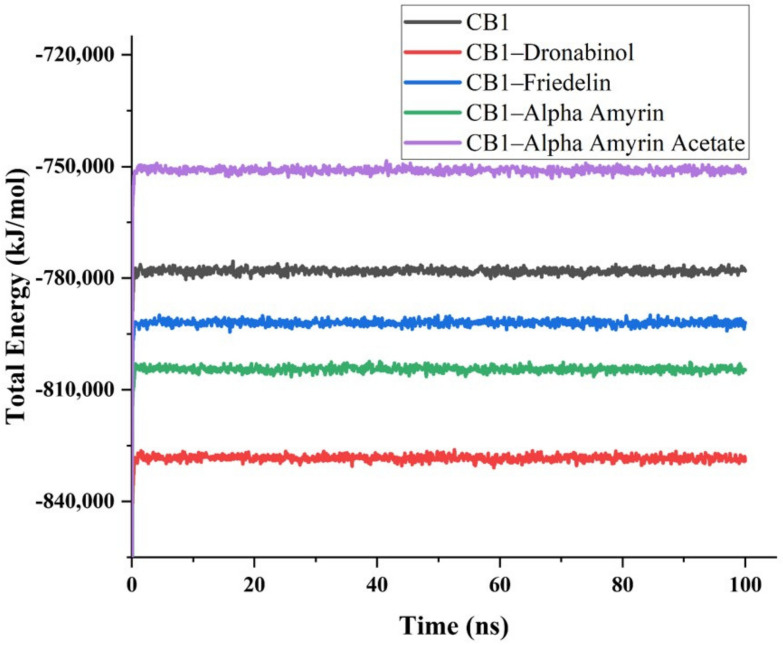
Molecular dynamics simulations were conducted to further analyze the stability and binding affinities of the triterpene–CB1 complexes compared to the THC–CB1 complex. As both friedelin and epifriedelanol are structurally similar, only friedelin was selected for molecular dynamics simulations. Alpha-amyrin was also considered as it showed the best docking score among all triterpenes. Alpha-amyrin acetate was selected as a representative for acetate-containing compounds. The total potential energies of CB1, CB1–THC, CB1–friedelin, CB1–α-amyrin, and CB1–α-amyrin acetate were calculated for a period of 100 ns. Values obtained for the energy-minimized initial conformations at 0 ps were −1024595.105, −1090152.423, −1045113.241, −1056698.855, and −992631.612 kJ/mol, respectively. The values obtained for each studied system after a few picoseconds were −790249.746, −842086.509, −804131.370, −815489.160, and −761594.499 kJ/mol, respectively. The total potential energies of the studied systems remained stable throughout the 100 ns simulation period (Figure 2). The CB1–THC complex showed the lowest potential energy, successfully binding at the active site of CB1. The triterpenes were found to bind strongly to a pocket at the surface of the target protein, close to the active binding site of THC. The CB1–friedelin and CB1–α-amyrin complexes showed lower potential energy values than CB1 alone. The CB1–α-amyrin acetate complex showed higher energy than CB1 alone. All complexes were stable and in compliance with the docking scores obtained.
Figure 2.
Total potential energies (kJ/mol) of the CB1 protein and the CB1–ligand complexes as a function of time.
2.4.2. Principal Components Analysis of MD Simulations
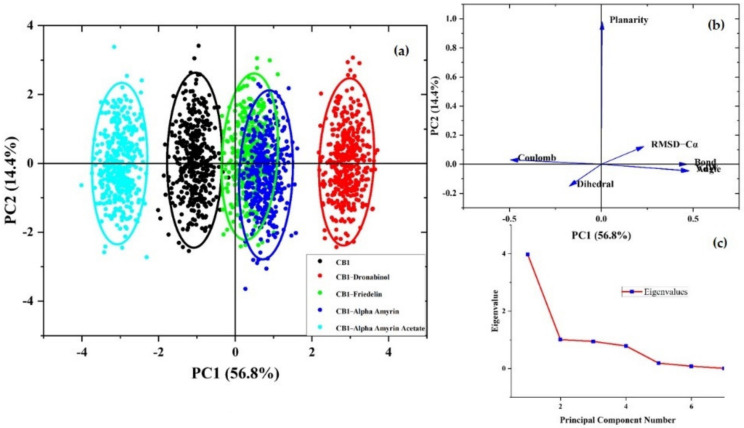
The PCA scores plot reveals different clusters formation of the protein and the protein–ligand complexes based on their structure and energy profiles (Figure 3a). The cluster for the α-amyrin–CB1 complex overlapped the one for the friedelin–CB1 complex. On the PC2 axis, the friedelin–CB1 cluster showed a similar pattern to the CB1 cluster, but more compactness. The α-amyrin acetate–CB1 complex formed a distinct cluster showing negative correlation on the PC1 axis differing from the other triterpene–CB1 and THC–CB1 complexes. The cluster of the THC–CB1 complex was further away from the CB1 cluster compared to the other complexes. The loading plot generated from the molecular dynamics (MD) energy profiles, and structural data showed the bond, angle, and Van der Waals energies and RMSD-Cα values as the major contributing factors for the stabilizing of the protein and the complexes (Figure 3b). A scree plot showing the eigenvalues further validated the analyses (Figure 3c).
Figure 3.
(a) Score plot presenting five data clusters in a different color, where each dot represents the one-time point. The clustering is attributable as CB1 (black), THC–CB1 (red), friedelin–CB1 (green), α-amyrin–CB1 (blue), and α-amyrin acetate–CB1 (turquoise); (b) loading plot generated from the MD energy profiles and structural data; (c) scree plot with eigenvalues.
2.4.3. Stability Analysis
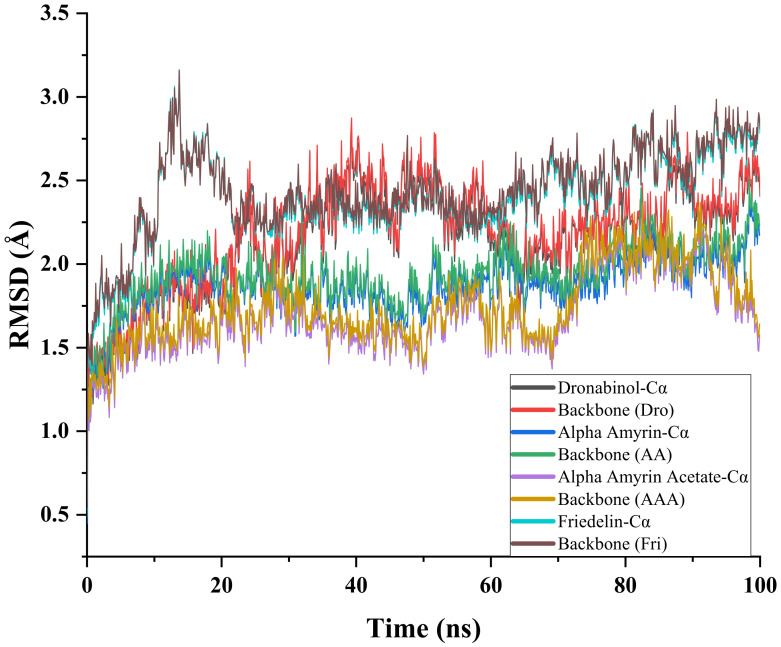
The atomic root mean square deviations (RMSDs) of Cα atoms of CB1 and of the selected CB1–triterpene complexes were analyzed to compare their structural stability (Figure 4). All complexes reached equilibrium after 50 ns. The α-amyrin acetate–CB1 complex exhibited the lowest RMSD value among all complexes. A decrease in RMSD was observed for this complex from 80 to 100 ns, suggesting that this complex may not be stable overall. The RMSD value of the α-amyrin–CB1 complex showed a more stable pattern than the corresponding acetate complex. The RMSD values obtained for the α-amyrin–CB1 and the α-amyrin acetate–CB1 complexes were lower than those of CB1 alone, which suggest that α-amyrin and α-amyrin acetate contributed to lower the energy of the protein and made the protein more stable. The RMSDs of the CB1–THC and CB1–friedelin complexes fluctuated greatly from 10 to 60 ns and then stabilized. The value of the CB1–THC complex reached 2.0–2.2 Å after 60 ns. The RMSD of the CB1–friedelin complex fluctuated mostly between 10 and 20 ns, then showed a steady increase over the simulation period. These relatively higher deviations compared to the RMSD of the CB1 structure suggested that THC and friedelin may change the protein conformation at the binding site.
Figure 4.
Time series of the RMSD of alpha-carbon atoms (Cα) and of the whole backbone atoms for CB1 and CB1–ligand complexes.
2.4.4. Residue Mobility Analysis
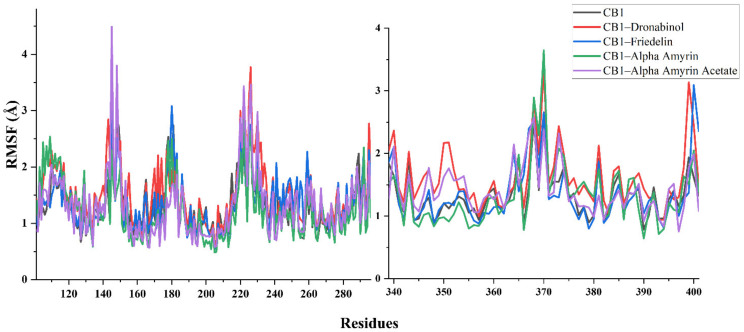
The binding of THC to CB1 was found to primarily induce local flexibility of the active site residues and revealed that the protein became more flexible in all regions. In contrast, the α-amyrin–CB1 and the friedelin–CB1 complexes showed the lowest RMSF, indicating that the binding of α-amyrin and friedelin to CB1 made the protein less flexible. The α-amyrin acetate–CB1 complex showed a similar trend to the THC–CB1 complex in terms of residue motility analysis (Figure 5).
Figure 5.
Structural behavioral changes of the CB1 protein by RMSF per residue with a focus on 101–300 and 333–401 residues.
2.5. MM-PBSA Binding Free Energy Analysis
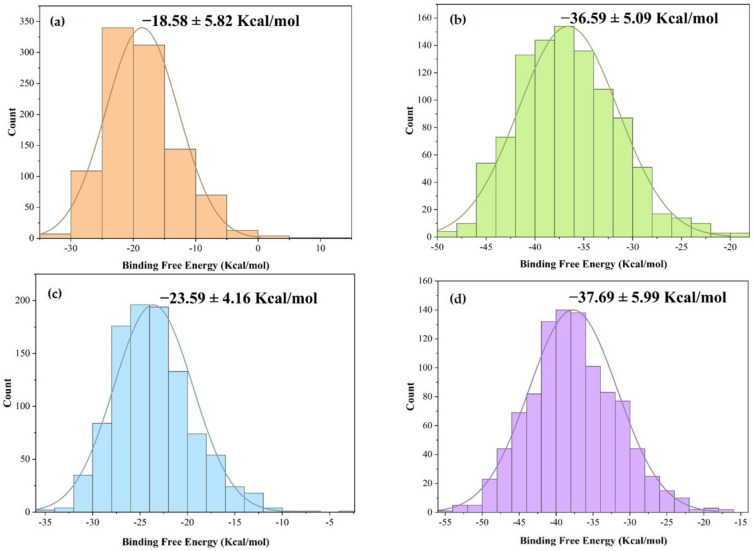
Additional calculations of the binding free energies of the CB1–ligand complexes investigated in the molecular dynamics simulations using the molecular mechanics Poisson–Boltzmann surface area (MM-PBSA) method are presented in Figure 6. Alpha-amyrin acetate showed the highest binding free energy value (−36.6 ± 5.09 Kcal/mol) among the selected triterpenes.
Figure 6.
Histogram of the binding free energy value obtained for (a) CB1–α-amyrin; (b) CB1–α amyrin acetate; (c) CB1–friedelin; (d) CB1–THC, where bell-shaped curves represent a Gaussian fit.
3. Discussion
It has previously been demonstrated that the aerial parts of VP are antinociceptive and can induce sedation by suppressing locomotor activity and exploratory behavior in mice. This has been linked with the presence of phenolic compounds predicted to interact with CB1 [20,23,25]. However, it has also been reported that triterpenes, including α-amyrin and β amyrin, could induce in vivo antinociceptive and anti-inflammatory effects via activation of the cannabinoid receptors [24,26]. Other terpenoids with effects on the CNS include α-pinene, which suppresses locomotor activity, increases sleeping time, and produces an anxiolytic effect in vivo [27], and phytol and terpinolene with sedative and locomotor suppressive effects [28,29]. Similar sleep-inducing and locomotor relaxant effects have been reported for citral, limonene, and myrcene [30]. A decrease in locomotor activity can be correlated to a potential CNS depression [31]. Myrcene and α-pinene have been shown to increase the GABAA receptor activity in vitro and potentiate the release of inhibitory neurotransmitters [32]. Moreover, it was also reported that GABAA-stimulating drugs such as flurazepam can synergistically potentiate the cataleptic effects of THC in mice [33].
The purpose of our computational studies was to evaluate the predictive binding affinity of VP triterpenes towards the CB1 receptor and carry out molecular dynamics simulations to describe the nature of the interactions of these triterpenes with CB1. Friedelin, α-amyrin, and epifriedelanol showed a strong binding affinity for the CB1 receptor in our molecular docking study. Molecular dynamics simulations, through stability and residue mobility analyses, was used to understand the structural variations and conformational flexibility of the CB1 protein and CB1 complexed with the selected triterpenes. All the studied triterpenes showed stable binding throughout the molecular dynamics simulations. The most stable interactions with CB1 were predicted for α-amyrin and friedelin. The latter had a blood–brain barrier penetration prediction score comparable to THC. Our molecular docking and molecular dynamics simulation results suggest that by interacting with CB1 receptors, VP triterpenes could contribute to the significant antinociceptive and CNS-depressant activity we have previously demonstrated for this plant [20].
4. Materials and Methods
4.1. Plant Collection and Extraction
The aerial parts of VP were collected from Chittagong (Bangladesh) in 2015. The plant material was identified by M.A. Ali at the Bangladesh National Herbarium in Dhaka where a voucher specimen (DACB: 35107) is kept for future reference. The dried powdered aerial parts of VP (100 g) were macerated in ethyl acetate (EtOAc; 1.5 L) for 5 days at 25 ± 2 °C, with occasional shaking. The resulting filtrate was concentrated under reduced pressure to afford the final extract (6.2 g, 6.2% yield).
4.2. HPLC-DAD-MS Analysis
The extract (10 mg) was subjected to solid phase extraction (SPE) using a Hypersep C18 cartridge (Thermo Scientific, Waltham, MA, USA) eluting sequentially with 70, 80, 90, and 100% methanol (MeOH). Fraction 1 (1.5 mg), fraction 2 (1.8 mg), fraction 3 (2.1 mg), and fraction 4 (4.2 mg) were collected, and stock solutions (0.1 mg/mL) were prepared for further analysis. The sample solution and blank control were all stored at 4 °C and filtered through a 0.22 μm PTFE syringe filter (Thermo Scientific, Waltham, MA, USA) prior to analysis by HPLC-DAD-MS. Analysis was carried out using an Agilent HPLC 1260 binary pump and a Sunfire C18 column (2.1 × 150 mm, 3.5 µm) (Waters, Milford, MA, USA). The diode array detector (DAD) was set at λ = 210, 254, 269, and 310 nm. The known, or suspected, major adducts for all samples were registered in the positive electrospray ionization (ESI) mode either as [M+H]+ or [M+Na]+. The mobile phase used was a gradient of 1% formic acid in water and acetonitrile (solvents A and B, respectively) at a flow rate of 0.2 mL/min. Elution was performed as follows; Fraction 1 (0 to 30 min—60 to 80% solvent B), fraction 2 (0 to 30 min—70 to 90% solvent B), fraction 3 (0 to 30 min—80 to 100% solvent B), and fraction 4 (0 to 30 min—100% solvent B).
4.3. Prediction of Pharmacokinetic and Drug-Likeness Properties
Absorption, distribution, metabolism, excretion, and toxicity (ADMET) properties of the selected triterpenes were determined using the online ADMET structure-activity relationship database (admetSAR). The specific pharmacokinetic profile for each compound was obtained using compound specific SMILES strings [34]. MLogP was used as an alternative to the regular LogP model [35]. In addition, drug-likeness and molecular properties of the triterpenes were calculated using SwissADME, and Bioavailability Radar plots were generated taking account of lipophilicity, size, polarity, solubility, flexibility, and saturation [36].
4.4. Molecular Docking
4.4.1. Ligands Optimization
As triterpenes had been reported as CB1 receptor agonists [23], we decided to consider six triterpenes, namely epifriedelanol (1), friedelin (2), α-amyrin (3), α-amyrin acetate (4), β-amyrin acetate (5), and bauerenyl acetate (6) (Figure S5), previously reported in the aerial parts of VP [4,5] as the putative ligands for our in silico analyses. Optimizations for the triterpenes and vibrational frequency calculations were determined at gaseous phase using the Gaussian 09 software version A.02 [37] with a semi-empirical PM6 method [38]. The three dimensional structures of each compound were obtained from the PubChem database (https://pubchem.ncbi.nlm.nih.gov/, accessed on 26 March 2021), geometry-optimized, and saved in PDB format using GaussView v.5.0 (https://gaussian.com/gaussview6/, accessed on 26 March 2021).
4.4.2. Protein Optimization
The crystal structure of the human CB1 cannabinoid receptor and its active site [39,40] was retrieved from the RSCB Protein Data Bank (PDB ID: 5U09). The heteroatoms and water molecules were removed from the crystal structure using PyMOL Molecular Graphics System v. 1.3 (https://pymol.org, accessed on 26 March 2021) [41]. The structure of the protein was further optimized using the Swiss-PDB viewer software (v.4.1.0) based on the energy minima. The protein and ligand structures were saved in the PDBQT format.
4.4.3. Determination of Ligand-Protein Binding Affinities and Non-Bonding Interactions
The active binding pocket of CB1 was predicted by CASTp (v. 3.0) [42]. The protein showed the highest pocket area and volume at 652.65 Å2 and 331.44 Å3, respectively. The grid box was generated so as to include the CB1 binding site residues, with a center set at 12.5230, 7.2495, and 17.7743 Å and a size set at 81.5, 81.5, and 81.5 Å in x, y, and z directions, respectively. Autodock Vina (v.1.1.2) was used to perform the molecular docking study [43]. The docked pose of the lowest binding free energy conformer (highest probable binding affinity) with CB1 was analyzed using PyMOL Molecular Graphics System (v. 1.3) (https://pymol.org, accessed on 26 March 2021), Drug Discovery Studio (v. 4.1) (https://www.3dsbiovia.com, accessed on 26 March 2021), and LigPlot+ (v. 1.4.5) (https://www.ebi.ac.uk/thornton-srv/software/LigPlus/, accessed on 26 March 21).
4.5. Molecular Dynamics Simulations
4.5.1. Total Potential Energy Calculations
The molecular dynamics (MD) simulations were performed on the CB1, CB1–THC, and three selected triterpene–CB1 complexes, namely CB1–friedelin, CB1–α-amyrin, and CB1–α-amyrin acetate. The first two complexes were chosen based on the highest docking scores obtained in the molecular docking study. The third complex was selected to observe the influence of an acetate group on the protein–ligand interactions. MD simulations were conducted using YASARA Dynamics v. 20.8.1 [44]. The AMBER14 force field was employed to simulate the macromolecular system [45]. Each protein was subject to hydrogen bond optimization prior to simulation [44], and the transferable intermolecular potential 3-point (TIP3P) water model was used by incorporating Cl− and/or Na+ ions. Periodic boundary conditions were incorporated to perform the simulations, where the cell size was 10 Å larger than the protein size in all cases. The initial energy minimization for each system was performed using the steepest gradient approach (5000 cycles), MD simulations were carried out using the particle-mesh Ewald (PME) method to designate long-range electrostatic interactions at a cut off distance of 8 Å and defining physiological conditions at 298 °K, pH 7.4, 0.9% NaCl [46]. The simulation temperature was controlled using a Berendsen thermostat with the pressure kept constant. A multiple time step algorithm was employed with a time step of 2.00 fs [47]. Finally, MD simulations were performed for 100 ns at constant pressure and Berendsen thermostat, and snapshots were saved every 100 ps. Further analysis was conducted using the default YASARA MACRO script [48].
4.5.2. Principal Component Analysis of MD Simulation Data
Principal component analysis (PCA) was used to analyze any subtle variability among the structural and energy profile data obtained from MD simulations for the selected triterpene–CB1 complexes and CB1 alone. Bond energies, bond angle energies, dihedral angle energies, planarity energies, Coulomb energies, Van der Waals energies, and RMSD-Cα values were included as the variables [49,50,51]. Multivariate responses were arranged in an X matrix according to the following equation:
| (1) |
where Tk describes how the samples relate to each other, Pk demonstrates how the variables relate to each other, k is the number of factors included in the model, and E is the matrix of residuals. PCA was conducted using the OriginPro 2021 (Principal Component Analysis app v.1.50) software package.
4.5.3. Stability and Residue Mobility Analyses
The root mean square deviations (RMSDs) of Cα atoms on the backbone of the CB1 protein and of the selected CB1–triterpene complexes were calculated during the MD simulation period using YASARA macro file followed by OriginPro 2021. Root mean square fluctuation (RMSF) analysis using YASARA macro script and OriginPro 2021 was used to observe the regions that fluctuated during the MD simulation period.
4.6. MM-PBSA Binding Free Energy Calculations
The molecular mechanics Poisson–Boltzmann surface area (MM-PBSA) method [52] was used to calculate the binding free energies of the CB1–ligand complexes investigated in the molecular dynamics simulations. Default macro scripts of YASARA dynamics were employed for the calculations. Selected snapshots from the last 50 ns MD simulation were used for all CB1–ligand complexes. Protein ligand binding free energy values were calculated using the following equation:
| ΔGbinding = ΔGcomplex − [ΔGligand + ΔGprotein], and ΔGbinding = ΔGMM + ΔGPB+ΔGSA–TΔS = (ΔGelec+ ΔGVdW) + ΔGPB + ΔGSA–TΔS |
(2) |
where ΔGcomplex = total free energy of the protein–ligand complex in solvent, ΔGligand = total energy of the ligand in solvent, and ΔGprotein = total energy of the protein in solvent. ΔGMM = molecular mechanics interaction energy, where the ΔGelec and ΔGVdW are the electrostatic and Van der Waals interactions, respectively. ΔGPB and ΔGSA represent polar solvation and nonpolar solvation energy, respectively. TΔS (temperature = T and entropy = S) is the contribution of entropy to the free energy.
Supplementary Materials
The following are available online at https://www.mdpi.com/1422-0067/22/7/3595/s1.
Author Contributions
Conceptualization, M.A.S.; methodology, M.A.S. and M.S.R.; software, M.A.S. and M.S.R.; validation, M.A.S., M.S.R. and V.S.; formal analysis, M.A.S., M.S.R. and V.S.; investigation, M.A.S. and M.S.R.; resources, M.A.S. and M.S.R.; data curation, M.A.S. and M.S.R.; writing—original draft preparation, M.A.S. and M.S.R.; writing—review and editing, M.A.S., G.T.T. and V.S.; visualization, M.A.S. and M.S.R.; supervision, G.T.T.; project administration, G.T.T. All authors have read and agreed to the published version of the manuscript.
Funding
This research received no external funding.
Data Availability Statement
All data generated or analyzed during this study are included in this published article (and its Supplementary Information files).
Conflicts of Interest
The authors declare no conflict of interest.
Footnotes
Publisher’s Note: MDPI stays neutral with regard to jurisdictional claims in published maps and institutional affiliations.
References
- 1.Giuffrida A., Parsons L., Kerr T., De Fonseca F.R., Navarro M., Piomelli D. Dopamine activation of endogenous cannabinoid signaling in dorsal striatum. Nat. Neurosci. 1999;2:358–363. doi: 10.1038/7268. [DOI] [PubMed] [Google Scholar]
- 2.Hampson R.E., Deadwyler S.A. Cannabinoids, hippocampal function and memory. Life Sci. 1999;65:715–723. doi: 10.1016/S0024-3205(99)00294-5. [DOI] [PubMed] [Google Scholar]
- 3.Cravatt B.F., Lichtman A.H. The endogenous cannabinoid system and its role in nociceptive behavior. J. Neurobiol. 2004;61:149–160. doi: 10.1002/neu.20080. [DOI] [PubMed] [Google Scholar]
- 4.Straiker A.J., Maguire G., Mackie K., Lindsey J. Localization of cannabinoid CB1 receptors in the human anterior eye and retina. Invest. Ophthalmol. Vis. Sci. 1999;40:2442–2448. [PubMed] [Google Scholar]
- 5.Wright K., Rooney N., Feeney M., Tate J., Robertson D., Welham M., Ward S. Differential expression of cannabinoid receptors in the human colon: Cannabinoids promote epithelial wound healing. Gastroenterology. 2005;129:437–453. doi: 10.1016/j.gastro.2005.05.026. [DOI] [PubMed] [Google Scholar]
- 6.Gerard C.M., Mollereau C., Vassart G., Parmentier M. Molecular cloning of a human cannabinoid receptor which is also expressed in testis. Biochem. J. 1991;279:129–134. doi: 10.1042/bj2790129. [DOI] [PMC free article] [PubMed] [Google Scholar]
- 7.Schuel H., Chang M.C., Burkman L.J., Picone R.P., Makriyannis A., Zimmerman A.M., Zimmerman S. Marihuana and Medicine. Springer; Totowa, NJ, USA: 1999. Cannabinoid receptors in sperm; pp. 335–345. [DOI] [Google Scholar]
- 8.Roche R., Hoareau L., Bes-Houtmann S., Gonthier M.-P., Laborde C., Baron J.-F., Haffaf Y., Cesari M., Festy F. Presence of the cannabinoid receptors, CB1 and CB2, in human omental and subcutaneous adipocytes. Histochem. Cell Biol. 2006;126:177–187. doi: 10.1007/s00418-005-0127-4. [DOI] [PubMed] [Google Scholar]
- 9.Liu Q.R., Pan C.H., Hishimoto A., Li C.Y., Xi Z.X., Llorente-Berzal A., Viveros M.P., Ishiguro H., Arinami T., Onaivi E.S. Species differences in cannabinoid receptor 2 (CNR2 gene): Identification of novel human and rodent CB2 isoforms, differential tissue expression and regulation by cannabinoid receptor ligands. Genes, Brain Behav. 2009;8:519–530. doi: 10.1111/j.1601-183X.2009.00498.x. [DOI] [PMC free article] [PubMed] [Google Scholar]
- 10.Cheng Y., Hitchcock S.A. Targeting cannabinoid agonists for inflammatory and neuropathic pain. Expert Opin. Investig. Drugs. 2007;16:951–965. doi: 10.1517/13543784.16.7.951. [DOI] [PubMed] [Google Scholar]
- 11.Koob G.F. The neurobiology of addiction: A neuroadaptational view relevant for diagnosis. Addiction. 2006;101:23–30. doi: 10.1111/j.1360-0443.2006.01586.x. [DOI] [PubMed] [Google Scholar]
- 12.Williams J.T., Ingram S.L., Henderson G., Chavkin C., von Zastrow M., Schulz S., Koch T., Evans C.J., Christie M.J. Regulation of µ-opioid receptors: Desensitization, phosphorylation, internalization, and tolerance. Pharmacol. Rev. 2013;65:223–254. doi: 10.1124/pr.112.005942. [DOI] [PMC free article] [PubMed] [Google Scholar]
- 13.Kumar A., Premoli M., Aria F., Bonini S.A., Maccarinelli G., Gianoncelli A., Memo M., Mastinu A. Cannabimimetic plants: Are they new cannabinoidergic modulators? Planta. 2019;249:1681–1694. doi: 10.1007/s00425-019-03138-x. [DOI] [PubMed] [Google Scholar]
- 14.Khare C.P. Indian Medicinal Plants: An Illustrated Dictionary. Springer; Berlin/Heidelberg, Germany: 2007. [DOI] [Google Scholar]
- 15.Mollik M.A.H., Hossan M.S., Paul A.K., Taufiq-Ur-Rahman M., Jahan R., Rahmatullah M. A comparative analysis of medicinal plants used by folk medicinal healers in three districts of Bangladesh and inquiry as to mode of selection of medicinal plants. Ethnobot. Res. Appl. 2010;8:195–218. doi: 10.17348/era.8.0.195-218. [DOI] [Google Scholar]
- 16.Jahan N., Hossain M.A., Mahmud S.M.N., Tongchongya J., Hasan M.N., Rahmatullah M. Medicinal plants used by a Tonchongya tribal community at Taknatala village in Rangamati District, Bangladesh. J. Chem. Pharm. Res. 2015;7:128–132. doi: 10.33552/appr.2019.01.000523. [DOI] [Google Scholar]
- 17.Hira A., Dey S.K., Howlader M.S., Ahmed A., Hossain H., Jahan I.A. Anti-inflammatory and antioxidant activities of ethanolic extract of aerial parts of Vernonia patula (Dryand.) Merr. Asian Pac. J. Trop. Biomed. 2013;3:798–805. doi: 10.1016/S2221-1691(13)60158-6. [DOI] [PMC free article] [PubMed] [Google Scholar]
- 18.Iwalewa E., Iwalewa O., Adeboye J. Analgesic, antipyretic, anti-inflammatory effects of methanol, chloroform and ether extracts of Vernonia cinerea less leaf’. J. Ethnopharmacol. 2003;86:229–234. doi: 10.1016/S0378-8741(03)00081-3. [DOI] [PubMed] [Google Scholar]
- 19.Temponi Vdos S., da Silva J.B., Alves M.S., Ribeiro A., de Jesus Ribeiro Gomes de Pinho J., Yamamoto C.H., Pinto M.A., Del-Vechio-Vieira G., Vieira de Sousa O.V. Antinociceptive and anti-inflammatory effects of ethanol extract from Vernonia polyanthes leaves in rodents. Int. J. Mol. Sci. 2012;13:3887–3899. doi: 10.3390/ijms13033887. [DOI] [PMC free article] [PubMed] [Google Scholar]
- 20.Siraj M.A., Howlader M.S.I., Rahaman M.S., Shilpi J.A., Seidel V. Antinociceptive and sedative activity of Vernonia patula and predictive interactions of its phenolic compounds with the cannabinoid type 1 receptor. Phytother. Res. 2020:1–11. doi: 10.1002/ptr.6876. [DOI] [PubMed] [Google Scholar]
- 21.Herrera C., Chanco G., Sison F. Chemical and pharmacological studies on Vernonia patula (Dry.) Merr. and Vernonia cinerea (Linn.) Less; Proceedings of the 4th Asian Symposium on Medicinal Plants and Spices; Bangkok, Thailand. 15–19 September 1980. [Google Scholar]
- 22.Liang Q.-L., Min Z.-D. Studies on the constituents from the herb of Vernonia patula. Zhongguo Zhong Yao Za Zhi. 2003;28:235–237. [PubMed] [Google Scholar]
- 23.Lin Y.-L., Wang W.-Y. Chemical constituents of Vernonia patula. Chin. Pharm. J. 2002;54:187–192. [Google Scholar]
- 24.da Silva K.A.S., Paszcuk A.F., Passos G.F., Silva E.S., Bento A.F., Meotti F.C., Calixto J.B. Activation of cannabinoid receptors by the pentacyclic triterpene α, β-amyrin inhibits inflammatory and neuropathic persistent pain in mice. Pain. 2011;152:1872–1887. doi: 10.1016/j.pain.2011.04.005. [DOI] [PubMed] [Google Scholar]
- 25.Dikmen D.Y., Okcay Y., Arslan R., Bektas N. Cannabinoid system involves in the analgesic effect of protocatechuic acid. DARU J. Pharm. Sci. 2019;27:605–612. doi: 10.1007/s40199-019-00288-x. [DOI] [PMC free article] [PubMed] [Google Scholar]
- 26.Dutra R.C., da Silva K.A.B.S., Bento A.F., Marcon R., Paszcuk A.F., Meotti F.C., Pianowski L.F., Calixto J.B. Euphol, a tetracyclic triterpene produces antinociceptive effects in inflammatory and neuropathic pain: The involvement of cannabinoid system. Neuropharmacology. 2012;63:593–605. doi: 10.1016/j.neuropharm.2012.05.008. [DOI] [PubMed] [Google Scholar]
- 27.Kasuya H., Iida S., Ono K., Satou T., Koike K. Intracerebral distribution of α-pinene and the anxiolytic-like effect in mice following inhaled administration of essential oil from Chamaecyparis obtuse. Nat. Prod. Commun. 2015;10:1934578X1501000841. doi: 10.1177/1934578X1501000841. [DOI] [PubMed] [Google Scholar]
- 28.Ito K., Ito M. The sedative effect of inhaled terpinolene in mice and its structure–activity relationships. J. Nat. Med. 2013;67:833–837. doi: 10.1007/s11418-012-0732-1. [DOI] [PubMed] [Google Scholar]
- 29.Costa J.P., de Oliveira G.A.L., de Almeida A.A.C., Islam M.T., de Sousa D.P., de Freitas R.M. Anxiolytic-like effects of phytol: Possible involvement of GABAergic transmission. Brain Res. 2014;1547:34–42. doi: 10.1016/j.brainres.2013.12.003. [DOI] [PubMed] [Google Scholar]
- 30.Do Vale T.G., Furtado E.C., Santos Jr J., Viana G. Central effects of citral, myrcene and limonene, constituents of essential oil chemotypes from Lippia alba (Mill.) NE Brown. Phytomedicine. 2002;9:709–714. doi: 10.1078/094471102321621304. [DOI] [PubMed] [Google Scholar]
- 31.Howlader M., Islam S., Siraj M., Dey S.K., Hira A., Ahmed A., Hossain M. Ficus hispida bark extract prevents nociception, inflammation, and CNS stimulation in experimental animal model. Evid. Based Compl. Alt. 2017 doi: 10.1155/2017/7390359. [DOI] [PMC free article] [PubMed] [Google Scholar]
- 32.Kessler A., Sahin-Nadeem H., Lummis S.C., Weigel I., Pischetsrieder M., Buettner A., Villmann C. GABAA receptor modulation by terpenoids from Sideritis extracts. Mol. Nutr. Food Res. 2014;58:851–862. doi: 10.1002/mnfr.201300420. [DOI] [PMC free article] [PubMed] [Google Scholar]
- 33.Pertwee R.G., Greentree S., Swift P. Drugs which stimulate or facilitate central GABAergic transmission interact synergistically with delta-9-tetrahydrocannabinol to produce marked catalepsy in mice. Neuropharmacology. 1988;27:1265–1270. doi: 10.1016/0028-3908(88)90029-9. [DOI] [PubMed] [Google Scholar]
- 34.Yang H., Lou C., Sun L., Li J., Cai Y., Wang Z., Li W., Liu G., Tang Y. admetSAR 2.0: Web-service for prediction and optimization of chemical ADMET properties. Bioinformatics. 2019;35:1067–1069. doi: 10.1093/bioinformatics/bty707. [DOI] [PubMed] [Google Scholar]
- 35.Sterling T., Kogler D., Anderson M., Brodowicz M. SLOWER: A performance model for Exascale computing. Supercomput. Front. Innov. 2014;1:42–57. doi: 10.14529/jsfi140203. [DOI] [Google Scholar]
- 36.Daina A., Michielin O., Zoete V. SwissADME: A free web tool to evaluate pharmacokinetics, drug-likeness and medicinal chemistry friendliness of small molecules’. Sci. Rep. 2017;7:42717. doi: 10.1038/srep42717. [DOI] [PMC free article] [PubMed] [Google Scholar]
- 37.Frisch M.J., Trucks G.W., Schlegel H.B., Scuseria G.E., Robb M.A., Cheeseman J.R., Scalmani G., Barone V., Mennucci B., Petersson G.A., et al. Gaussian 09 Revision D. 01. Gaussian; Wallingford, UK: 2009. [Google Scholar]
- 38.Stephens P.J., Devlin F.J., Chabalowski C.F., Frisch M.J. Ab initio calculation of vibrational absorption and circular dichroism spectra using density functional force fields. J. Phys. Chem. 1994;98:11623–11627. doi: 10.1021/j100096a001. [DOI] [Google Scholar]
- 39.Jung S.W., Cho A.E., Yu W. Exploring the ligand efficacy of cannabinoid receptor 1 (CB1) using molecular dynamics simulations. Sci. Rep. 2018;8:1–11. doi: 10.1038/s41598-018-31749-z. [DOI] [PMC free article] [PubMed] [Google Scholar]
- 40.Chung H., Fierro A., Pessoa-Mahana C.D. Cannabidiol binding and negative allosteric modulation at the cannabinoid type 1 receptor in the presence of delta-9-tetrahydrocannabinol: An In Silico study. PLoS ONE. 2019;14:e0220025. doi: 10.1371/journal.pone.0220025. [DOI] [PMC free article] [PubMed] [Google Scholar]
- 41.DeLano W.L. The PyMOL Molecular Graphics System. Schrodinger LLC.; New York, NY, USA: 2002. Version 1.1 beta4. [Google Scholar]
- 42.Dundas J., Ouyang Z., Tseng J., Binkowski A., Turpaz Y., Liang J. CASTp: Computed atlas of surface topography of proteins with structural and topographical mapping of functionally annotated residues. Nucleic Acids Res. 2006;34:W116–W118. doi: 10.1093/nar/gkl282. [DOI] [PMC free article] [PubMed] [Google Scholar]
- 43.Trott O., Olson A.J. AutoDock Vina: Improving the speed and accuracy of docking with a new scoring function, efficient optimization, and multithreading. J. Comput. Chem. 2010;31:455–461. doi: 10.1002/jcc.21334. [DOI] [PMC free article] [PubMed] [Google Scholar]
- 44.Krieger E., Dunbrack R.L., Hooft R.W., Krieger B. Assignment of protonation states in proteins and ligands: Combining pK a prediction with hydrogen bonding network optimization. In: Gore M., Jagtap U.B., editors. Computational Drug Discovery and Design, Methods in Molecular Biology. Springer Science + Business Media; New York, NY, USA: 2012. pp. 405–421. [DOI] [PubMed] [Google Scholar]
- 45.Dickson C.J., Madej B.D., Skjevik Å.A., Betz R.M., Teigen K., Gould I.R., Walker R.C. Lipid14: The amber lipid force field. J. Chem. Theory Comput. 2014;10:865–879. doi: 10.1021/ct4010307. [DOI] [PMC free article] [PubMed] [Google Scholar]
- 46.Krieger E., Nielsen J.E., Spronk C.A., Vriend G. Fast empirical pKa prediction by Ewald summation. J. Mol. Graph. Model. 2006;25:481–486. doi: 10.1016/j.jmgm.2006.02.009. [DOI] [PubMed] [Google Scholar]
- 47.Krieger E., Vriend G. New ways to boost molecular dynamics simulations. J. Comput. Chem. 2015;36:996–1007. doi: 10.1002/jcc.23899. [DOI] [PMC free article] [PubMed] [Google Scholar]
- 48.Krieger E., Koraimann G., Vriend G. Increasing the precision of comparative models with YASARA NOVA—A self-parameterizing force field. Proteins. 2002;47:393–402. doi: 10.1002/prot.10104. [DOI] [PubMed] [Google Scholar]
- 49.Islam R., Parves M.R., Paul A.S., Uddin N., Rahman M.S., Mamun A.A., Hossain M.N., Ali M.A., Halim M.A. A molecular modeling approach to identify effective antiviral phytochemicals against the main protease of SARS-CoV-2. J. Biomol. Struct. Dyn. 2020:1–12. doi: 10.1080/07391102.2020.1761883. [DOI] [PMC free article] [PubMed] [Google Scholar]
- 50.Martens H., Naes T. Multivariate Calibration. John Wiley & Sons; Chichester, UK: 1992. [Google Scholar]
- 51.Wold S., Esbensen K., Geladi P. Principal component analysis. Chemom. Intell. Lab. Syst. 1987;2:37–52. doi: 10.1016/0169-7439(87)80084-9. [DOI] [Google Scholar]
- 52.Ahmed S., Mahtarin R., Ahmed S.S., Akter S., Md. Islam S., Al Mamun A., Islam R., Hossain M.N., Ali M.A., Sultana M.U.C., et al. Investigating the binding affinity, interaction, and structure-activity-relationship of 76 prescription antiviral drugs targeting RdRp and Mpro of SARS-CoV-2. J. Biomol. Struct. Dyn. 2020 doi: 10.1080/07391102.2020.1796804. [DOI] [PMC free article] [PubMed] [Google Scholar]
Associated Data
This section collects any data citations, data availability statements, or supplementary materials included in this article.
Supplementary Materials
Data Availability Statement
All data generated or analyzed during this study are included in this published article (and its Supplementary Information files).


