Abstract
We report the synthesis of hybrid thin films based on polymethyl methacrylate) (PMMA) and polystyrene (PS) doped with 1%, 3%, 5%, and 7% of cerium dioxide nanoparticles (CeO2 NPs). The As-prepared thin films of (PMMA-PS) incorporated with CeO2 NPs are deposited on a glass substrate. The transmittance T% (λ) and reflectance R% (λ) of PMMA-PS/CeO2 NPs thin films are measured at room temperature in the spectral range (250–700) nm. High transmittance of 87% is observed in the low-energy regions. However, transmittance decreases sharply to a vanishing value in the high-energy region. In addition, as the CeO2 NPs concentration is increased, a red shift of the absorption edge is clearly observed suggesting a considerable decrease in the band gap energy of PMMA-PS/CeO2 NPs thin film. The optical constants (n and k) and related key optical and optoelectronic parameters of PMMA-PS/Ce NPs thin films are reported and interpreted. Furthermore, Tauc and Urbach models are employed to elucidate optical behavior and calculate the band gaps of the as-synthesized nanocomposite thin films. The optical band gap energy of PMMA-PS thin film is found to be 4.03 eV. Optical band gap engineering is found to be possible upon introducing CeO2 NPs into PMMA-PS polymeric thin films as demonstrated clearly by the continuous decrease of optical band gap upon increasing CeO2 content. Fourier-transform infrared spectroscopy (FTIR) analysis is conducted to identify the major vibrational modes of the nanocomposite. The peak at 541.42 cm−1 is assigned to Ce–O and indicates the incorporation of CeO2 NPs into the copolymers matrices. There were drastic changes to the width and intensity of the vibrational bands of PMMA-PS upon addition of CeO2 NPs. To examine the chemical and thermal stability, thermogravimetric (TGA) thermograms are measured. We found that (PMMA-PVA)/CeO2 NPs nanocomposite thin films are thermally stable below 110 °C. Therefore, they could be key candidate materials for a wide range of scaled multifunctional smart optical and optoelectronic devices.
Keywords: hybrid thin films, optical properties, CeO2 nanoparticles, polystyrene (PS), polymethyl methacrylate (PMMA), chemical properties, thermal properties
1. Introduction
Nanocomposites based on blending polymers with inorganic nanoparticles have attracted much attention owing to their projected extraordinary thermal, optical, electrical and antibacterial properties [1,2,3,4]. The motivation for using inorganic materials stems from their high thermal stability, good electrical properties and high refractive index n [5,6]. However, previous studies indicate several drawbacks and insufficient capability of inorganic nanoparticles to serve a variety of modern device applications [7]. Of these disadvantages, there are the deficiency of elasticity, high cost and their high densities. As a result, several researchers were motivated to search for nanocomposite materials based on blending inorganic nanoparticles with organic materials to improve their properties and obtain nanocomposites with better features. Owing to the outstanding properties of organic materials such as good flexibility, lower weight compared to inorganic materials, as well as the easiness of preparation, low processing cost, good influence resistance [8,9,10], recyclability and being environmentally friendly, they serve as excellent candidates for inorganic-organic nanocomposites [11,12].
High transparency and high refractive index are two essential optical parameters that are highly demanded for the manufacturing of smart multi-functional optoelectronics devices [9]. Careful design of such nanocomposites could yield materials that can be employed in sophisticated sensors [13,14], optical crystals [15], micro-lenses for imaging and medical applications [16,17] and ultra-fast data transmission [10]. Polymers with high refractive indices are key candidate materials for smart-scaled multi-functional materials. For instance, poly(thiophene) exhibits a refractive index of 2.12 at a wavelength of 632 nm [16,18,19,20]. However, they are difficult to prepare. Despite the high absorption coefficient and apart from the difficulty of preparing, it absorbs light in the visible light region and has high optical dispersion [15]. In light of the above issues, overcoming these limitations and developing organic materials with better properties becomes of utmost importance.
The main challenge is to explore the possibility of preparing polymers thin films with specific properties for specific applications. Polymethyl methacrylate (PMMA) polymer has an excellent optical, electrical, mechanical, and thermal characteristic. The exceptional properties of PMMA such as, high transparency, environmental stability, low cost, easy preparation and shaping at low temperature make it an excellent candidate for fabricating thin films [21,22,23]. However, its application is limited at higher temperatures owing to its relatively poor thermal stability [24]. To overcome this problem, elaborated technological techniques are applied to improve different characteristics of PMMA polymer [24,25,26]. Polystyrene (PS) is one of the most common thermoplastic polymers. It is colorless and transparent in the visible region. PS has a good formability, a good rigidity, electric and thermal insulation, easy processing and long-term stability [27,28,29]. The outstanding properties of polystyrene such as its low cost and high refractive index of 1.59 at a wavelength of 632 nm make it an excellent choice for several optical applications [8].
Controlling the properties of materials is like sculpturing uniquely on scrolls. The properties of the films can be tuned in several ways, such as changing the film thickness [30,31,32,33,34] or by developing hybrid films of the metal oxide polymer [8,35]. In addition, the properties of the polymers can be improved by introducing nanoparticles into the polymer matrix. This is an approach that opens the door to many applications in various fields. The merging of nanoparticles into the polymer matrix improves their optical, mechanical, thermal and electronic properties [8,36,37]. Due to the simple synthesis and low cost of preparation, the merging of inorganic building blocks in the organic matrix is an effective way to improve the properties while maintaining high transparency [38,39]. Amongst nanoparticles, cerium oxide nanoparticles (CeO2 NPs) have attracted much attention for their high stability, surface chemistry, and biocompatibility [40,41,42]. CeO2 NPs are transparent in the visible region and have a refractive index of 2.2 at a wavelength of 632 nm [8,43]. Pure CeO2 exhibits a wide indirect optical band gap and energy-wide band gap that operates effectively in the ultraviolet (UV) region and thus it could be an excellent choice for different optical and electronic applications [44,45].
Optics are playing a crucial role in many of our day-to-day applications. The refractive index is one of the most significant parameters in photonics. An increase in the efficiency of the photonic devices, like LEDs, modern solar systems, can be performed by engineering the refractive index mismatch of materials used in the optical devices. The novelty of this work is underlined by refractive index modulation using polymer nanocomposites treated with inorganic fillers. Other related optical parameters of the fabricated optical devices can be tuned accordingly. By careful choice of synthetic methods and manipulating the distinctive physics of the polymeric nanocomposites in such materials, novel-scaled functional polymer–inorganic nanocomposites can be designed and manufactured for new and interesting optoelectronic applications.
2. Experimental Details and Techniques
Polystyrene (PS) with a molecular weight 104.1 g/mol, polymethyl methacrylate (PMMA) with a molecular weight 3617 g/mol, and Ceria NPs with molecular weight 172 g/mol were purchased from Sigma Aldrich (St. Louis, MO, USA). Polystyrene (PS) solution was prepared in a conical flask by dissolving 2 g of PS in 200 mL of tetrahydrofuran (THF) Sol(A) and then placed on a stirrer for 1 h. Polymethyl methacrylate (PMMA) solution was prepared by dissolving 2 g of PMMA in 200 mL THF Sol(B) under continuous stirring for 1 h. Immediately after that, Sol (A) was added to Sol (B) under continuous stirring to synthesize 1:1 co-polymeric matrix. The polymeric mixture is expected to exhibit extraordinary physical, thermal and optical properties. Cerium oxide nanoparticles purchased from (Sigma Aldrich, St. Louis, MO, USA) of size (25–50) nm were added to as-prepared copolymers matrix with different concentration ratios (1%, 3%, 5% and 7%). To ensure that CeO2 nanoparticles were incorporated homogenously into the PMMA-PS matrix, the solution was alternatively mixed on a magnetic stirrer and a sonication rod. The substrates were cleaned and rinsed using ethanol and distilled water. The PMMA-PS/CeO2 nanocomposite thin films were synthesized by dip-coating technique. The two layers were dried at 70 °C for 30 min for each layer. The effect of introducing CeO2 nanoparticles on the optical properties was performed using UV-Vis spectrophotometer (U-3900H) (Hitachi, Fukuoka, Japan) with a total internal integrating sphere. Particularly, transmittance T% (λ) and reflectance R% (λ) of PMMA-PS/CeO2NPs thin films at room temperature in (250–700) nm spectral range are measured and interpreted. Electron Scanning Microscope (SEM) (Quanta FEG 450) (FELMI-ZFE, Graz, Austria) is utilized to investigate the surface morphology of as-prepared thin films. Thermogravimetric analysis (TGA) technique is used to study thermal stability of as-synthesized doped polymeric thin films. To identify the major vibration modes and types of different bonding networks of the PMMA-PS/CeO2 nanocomposites, Fourier transform infrared spectroscopy (FTIR) (Bruker Vertex 80 and Hyperion 2000 microscope) (Bruker Optics, Karlsruhe, Germany) analysis is conducted.
3. Result and Discussion
3.1. Optical Properties of PMMA-PS/Ce NPs Thin Film
3.1.1. Transmittance and Reflectance
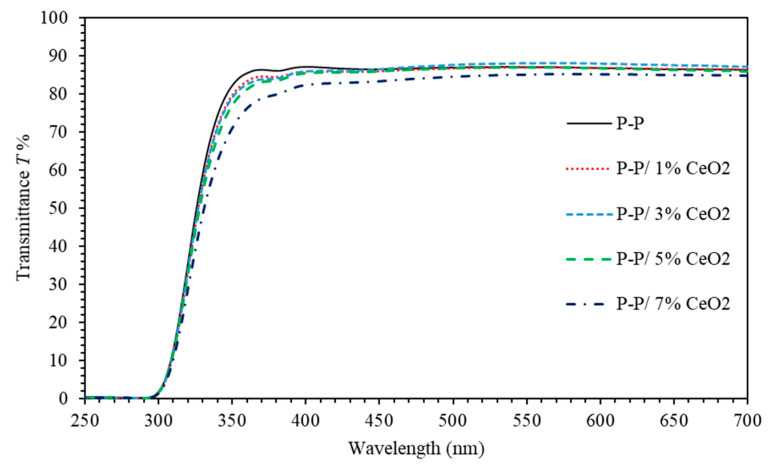
UV-Vis spectrophotometer was used to explore and investigate the optical properties of PMMA-PS thin films doped with various Ce NPs concentrations. Figure 1 shows the transmittance of PMMA-PS/Ce NPs thin films. Analysis and interpretation of transmittance data can be partitioned into two spectral regions. Namely, low energy region nm in which all samples exhibit a high transparency of about 87%. The high energy region ( nm is where transmittance starts to decay to a vanishing value. This region contains the absorption edge [46] that is red-shifted upon increasing the concentration of Ce NPs in the polymeric matrix suggesting a significant reduction of optical band gap energy of (PMMA-PS)/CeO2 nanocomposite thin films [47]. The incorporation of CeO2 NPs into polymeric matrix leads to a compression of the host matrix. Compressive strain introduced into PMMA-PS matrix can cause a red shift as a result of the changes of a built-in electric field. The polarization should be affected by doping and causes a red shift.
Figure 1.
The transmittance of (PMMA-PS)/CeO2 nanocomposite thin films incorporated with different CeO2 NPs concentrations.
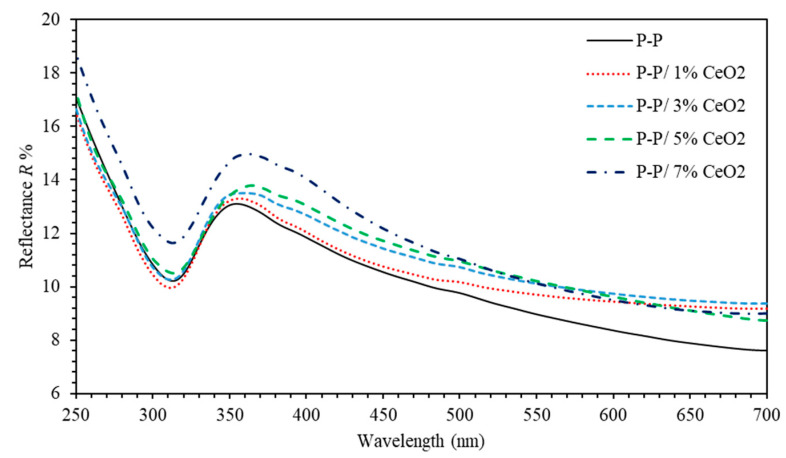
Figure 2 shows the reflectance of (PMMA-PS)/CeO2 nanocomposite thin films. It can be clearly observed that reflectance of PMMA-PS, PMMA-PS/1%, 3%, 5%, and 7% CeO2NPs thin film exhibit values of (7.6–10.1%), (9.2–9.8%), (9.3–10.2%), (8.7–10.4%), (9–11.5%), respectively.
Figure 2.
The reflectance of (PMMA-PS)/CeO2 nanocomposite thin films with various CeO2 NPs concentrations.
3.1.2. Extinction Coefficient and Refractive Index
The extinction coefficient k for all samples was calculated using the formula where is the absorption coefficient defined by where d is the thickness of thin films estimated to be 250 nm [48,49]. The use of inorganic ceria nanoparticles into the polymer matrix can provide high-performance novel materials that find applications in many industrial fields. With this respect, frequently considered features are optical properties such as light absorption.
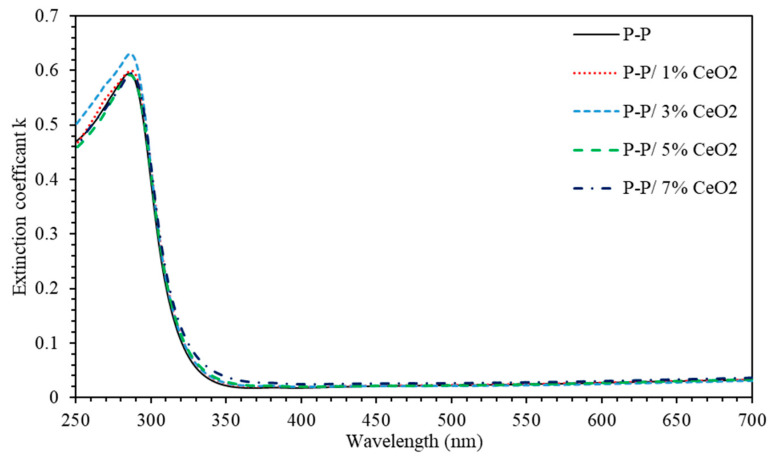
Figure 3 shows the extinction coefficient k calculated in the spectral range (250–700) nm as a function of incident wavelength. For the spectral range nm, k exhibits a vanishing value for all investigated thin film samples; this means that thin films allow electromagnetic waves to pass through without any decay or damping for photons with wavelengths λ ≥ 350 nm. In the high frequency regions, nm, k increases and attains a maximum value at 290 nm. This can be attributed to extremely high absorption of the energetic EM waves in this region. Figure 3 indicates that such energetic EM waves having energies very close to the optical band gap energy of the nanocomposite thin film are largely absorbed. Exceptionally, (PMMA-PS)/CeO2 3% nanocomposite thin films exhibit the highest extinction coefficient indicating that energetic EM waves are completely absorbed in this case.
Figure 3.
Extinction coefficient k of (PMMA-PS)/CeO2 nanocomposite thin films with various CeO2 NPs concentrations.
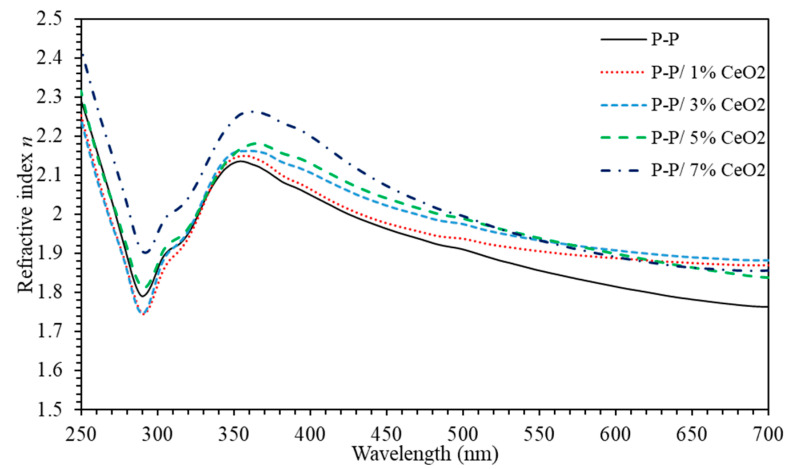
Refractive index (n) is generally associated with the electronic polarization of ions and local field inside optical materials. Compared to inorganic solids, optical applications of polymers are often limited due to the relatively narrow range of the refractive index. Thus, the introduction of inorganic nanoparticles into a polymer matrix can result in polymeric nanocomposites with extreme refractive index, which finds potential applications in lenses, optical filters, reflectors, optical waveguides, optical adhesives, solar cells, or antireflection films. To elucidate a deeper insight into optical properties, refractive index (N) is essentially composed of real part (n) and imaginary part (k); () where [50]. Figure 4 shows that n of PMMA-PS exhibits values ranging between 1.76 and 2.13. Introducing 1% of CeO2 NPs into polymeric matrix leads to a slight increase of n (1.86–2.15). As the CeO2 NPs concentrations is increased to 3%, 5%, and 7%, n continuously increases to (1.88–2.15), (1.83–2.18) and (1.85–2.26). Consequently, (PMMA-PS)/CeO2 nanocomposite thin films could be potential candidates as excellent reflective material [51].
Figure 4.
The refractive index (n) of (PMMA-PS)/CeO2 nanocomposite thin films with various CeO2 NPs concentrations.
3.1.3. Band Gap Energy Eg
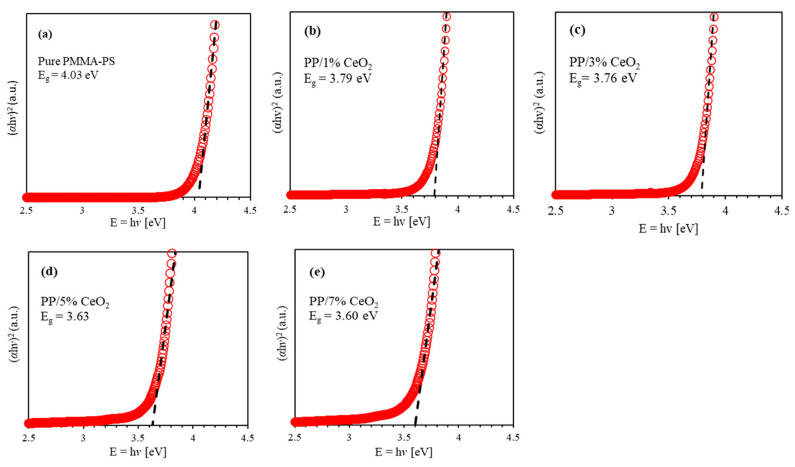
Optical band gap energy of as-prepared doped thin films is investigated using Tauc plot model. According to this model, , where B is a constant related to the type of the thin film. Figure 5 shows the relationship between the energy of incident photons () and . The optical band gap energy Eg of (PMMA-PS)/CeO2 nanocomposite thin films with various CeO2 NPs concentrations is obtained by extrapolating the liner part of Tauc plot to the interception of the incident photon energy (). The obtained optical band gap energy of PMMA-PS is calculated to be Eg = 4.03 eV consistent with previously reported values [52,53]. As the CeO2 NPs concentrations is increased to 1%, 3%, 5%, and 7%, optical band gap decreases to 3.97 eV, 3.76 eV, 3.63 eV, and 3.6 eV respectively. Thus, band gap engineering could be achieved effectively by inserting a specific concentration of CeO2 NPs in the polymeric thin films.
Figure 5.
The Tauc plot for energy band gap Eg of (PMMA-PS)/CeO2 nanocomposite thin films containing various CeO2 NPs concentrations. (a) Band gap of Pure PMMA-PS; (b) Band gap of PMMA-PS/1% CeO2; (c) Band gap of PMMA-PS/3% CeO2; (d) Band gap of PMMA-PS/5% CeO2; (e) Band gap of PMMA-PS/5% CeO2.
Refractive index dispersion is one of the most crucial parameters. Moreover, calculating dispersion energies is essential to obtain a deeper insight into the applications of (PMMA-PS)/CeO2 nanocomposite thin films for optical devices [51]. Therefore, refractive index and dispersion energies must be studied carefully to specify the potential application of the material [54].
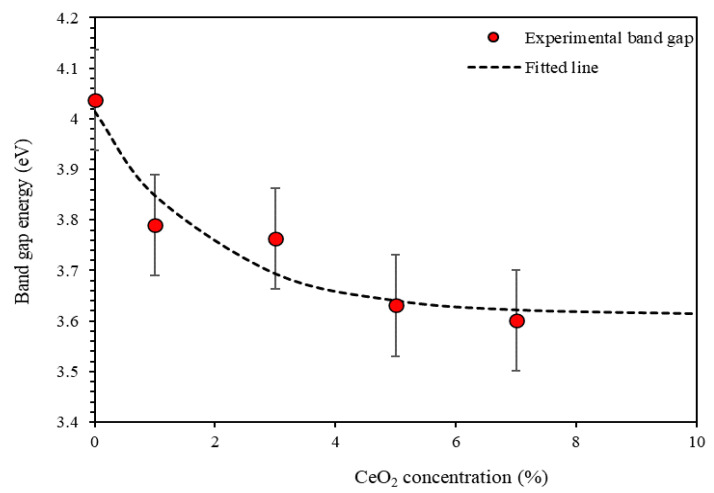
Figure 6 shows optical band gap energy Eg plotted versus CeO2 NPs concentration (%). It can be noticed that Eg decreases exponentially with ceria NPs concentration.
Figure 6.
The energy band gap Eg of PMMA-PS as a function of CeO2 concentration.
Wemple DiDomenico Model
Wemple DiDomenico model (WDD) is a classical single effective-oscillator model. This model can be utilized to calculate key optical dispersion parameters such as effective single oscillator energy and dispersion energy for certain optical materials. The parameter provides essential information about the band structure of the polymeric thin film, while is associated with the mean potency of interband photosensitive transitions and the structural fluctuations [55]. Furthermore, WDD model can be employed to estimate other optical parameters such as the zero frequency-refractive index , zero-frequency dielectric constant , and the spectral moments and . The relationships of different parameters can be expressed as,
| (1) |
Equation (1) can be rewritten as,
| (2) |
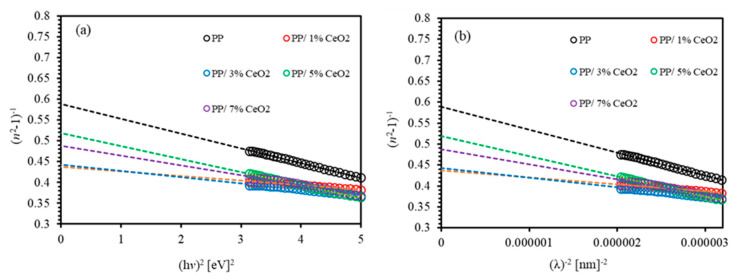
The energy of incident photon can be plotted against to obtain the values of dispersion parameters from the slope of the obtained straight line ( and the interception with the vertical axis . Figure 7a,b display versus and versus of (PMMA-PS)/CeO2 nanocomposite thin films incorporated with various concentrations of CeO2 NPs. The values of the two important dispersion parameters and obtained from the two plots are listed in Table 1. Careful inspection of the values of and parameters of PMMA-PS are found to be 6.893 eV and 4.063 eV, respectively. The corresponding attained values of (PMMA-PS)/CeO2 1% are 14.484 eV and 6.333 eV, indicating a significant increase as only a small concentration of CeO2 NPs are incorporated into polymeric films.
Figure 7.
(a) The (n2 − 1)−1 versus (hv)2; (b) The (n2 − 1)−1 versus (λ)−2 of (PMMA-PS)/CeO2 nanocomposite thin films with various CeO2 NPs concentrations.
Table 1.
Some optical parameters for PMMA-PS and PMMA-PS incorporation with CeO2 NPs.
| Parameter | P-P | P-P/1% CeO2 NPs | P-P/3% CeO2 NPs | P-P/5% CeO2 NPs | P-P/7% CeO2 NPs |
|---|---|---|---|---|---|
| Dispersion energy Ed (eV) | 6.893 | 14.484 | 12.268 | 7.832 | 9.288 |
| Effective single oscillator E0 (eV) | 4.063 | 6.333 | 5.433 | 4.065 | 4.542 |
| Zero-frequency refractive index n0 | 1.642 | 1.812 | 1.804 | 1.710 | 1.744 |
| Zero-frequency dielectric constant ε0 | 2.696 | 3.286 | 3.257 | 2.926 | 3.044 |
| Optical oscillator strength f (eV)2 | 28.011 | 91.743 | 66.666 | 31.847 | 42.194 |
| Optical moments M−1 | 1.696 | 2.286 | 2.257 | 1.926 | 2.044 |
| Optical moments M−3 (eV−2) | 0.102 | 0.056 | 0.076 | 0.116 | 0.099 |
| Oscillator length strength S0 × 10−5 | 1.804 | 5.728 | 4.139 | 2.119 | 2.523 |
| Average oscillator wavelength λ0 | 306.200 | 199.389 | 232.683 | 302.325 | 282.096 |
| Urbach energy EU (meV) | 182.495 | 186.216 | 187.360 | 194.476 | 207.675 |
By rewriting Equation (2) and setting [56], the and are related by the formula,
| (3) |
The obtained values of are presented in Table 1. The calculated values of are consistent with the theoretical and the experimental values of the normal refractive index. The estimated values of and of PMMA-PS are found to be 2.696 and 1.642, respectively. Introducing CeO2 NPs into PMMA-PS boost the values of and for all investigated thin film samples. In addition, the interplay between and the optical oscillator strength (f) of the optical transition between the initial state and the final state can be expressed as [57,58]. The obtained values of f are displayed in Table 1. Moreover, the effective single oscillator moments and can be correlated with dispersion parameters [59,60,61].
| (4) |
| (5) |
As demonstrated by Table 1, the values of optical moments and of PMMA-PS are obtained to be 1.696 and 0.102 (eV−2), respectively; while for (PMMA-PS)/1% CeO2 NPs, the value of increases to 2.286 and the value of decreases to 0.056 eV−2. This behavior could be explained in terms of the significant decrease in the polarization of (PMMA-PS)/CeO2 NPs nanocomposite thin films [62].
Sellmeier Oscillator Parameters
From another perspective, we employ Sellmeier oscillator model to elucidate the dispersion in thin films in terms of the average oscillator wavelength () and on the oscillator length strength (). Refractive index and the squared wavelength at higher wavelength are related to and by the formula,
| (6) |
By plotting versus , we calculate from the slope of the resulting straight line . The values of () can be obtained from the intercept with the vertical axis as can be clearly seen from Figure 7b. It clearly shows that the refractive index at higher wavelength adopts Sellmeier’s dispersion relation. The calculated values of and are tabulated in Table 1. It reveals that and of PMMA-PS are found to be 306.200 × 10⁻⁵ and 306.200 nm, respectively. For PMMA-PS/CeO2 NPs nanocomposites S0 decreases and λ0 increases. These tendencies hold up to 5% of CeO2 NPs incorporated into polymeric films.
Urbach Energy
To obtain a deeper insight into optical properties of thin films, order of crystallinity for PMMA-PS/CeO2 nanocomposite thin films is investigated by calculating Urbach energy EU. The absorption coefficient is related to EU via , where is a constant. By plotting versus incident photon energy (, can be determined by extrapolating the straight line below the absorption band edge. The estimated values of of PMMA-PS/CeO2 nanocomposite samples are presented in Table 1. For unloaded PMMA-PS thin film, is found to be 182.495 meV. It is observed that value of EU of PMMA-PS/7% CeO2 has increased to 207.675 meV suggesting a significant disorder and surface interactions in the polymeric thin films loaded with ceria nanoparticles.
3.2. FTIR Analysis
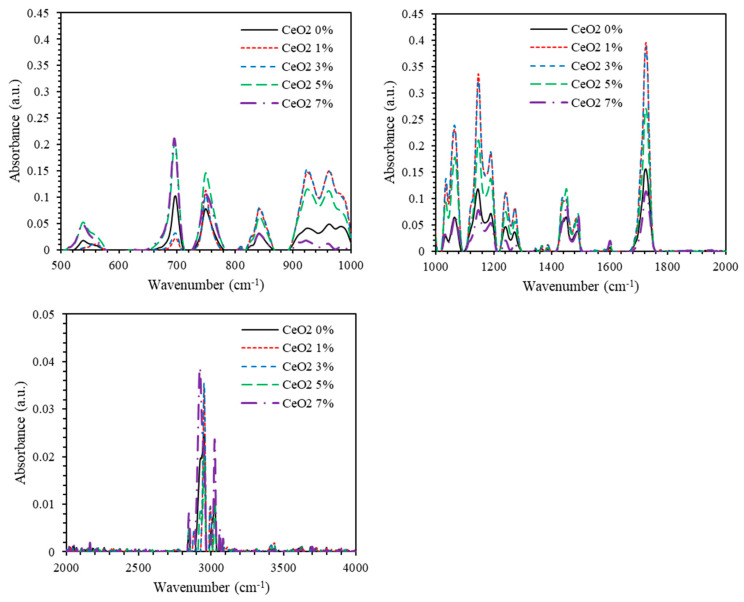
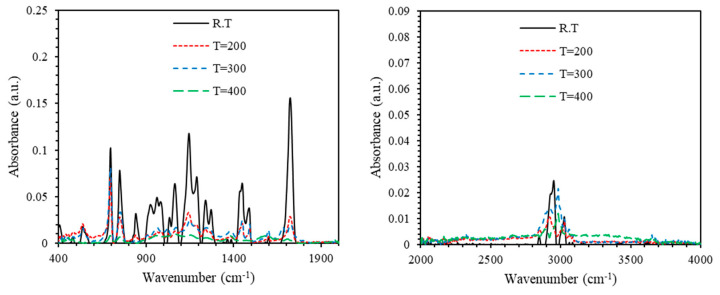
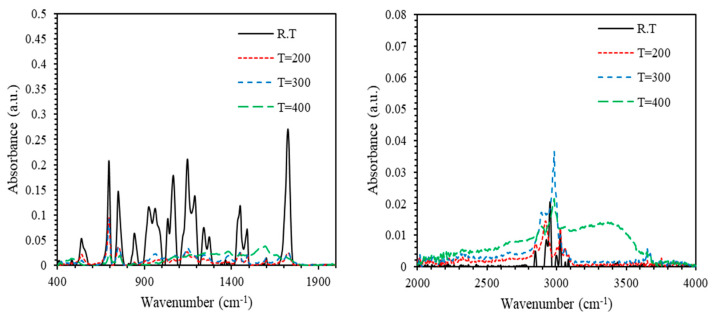
Fourier Transform Infrared Spectroscopy (FTIR) is employed to explore and identify the vibrational bands of the loaded PMMA-PS thin films. Figure 8 shows the FTIR spectra of PMMA-PS and PMMA-PS doped by CeO2 NPs. The vibrational bands observed in the FTIR spectrum are typical of those of PMMA and PS polymers. The vibrational bands associated with bending of C–H bonds are registered in the 1000–700 cm−1 spectral range. The vibrational bands located in the 1000–1300 cm−1 range are assigned to C–O stretching. The vibrational bands recorded in between 1300–1400 cm−1 are assigned to –CH3 bending, while a band at 1449 cm−1 could be ascribed to the –CH2 bending. Band at 1484 cm−1 could be ascribed to the C=C bonds. The bands appearing between 1600–1800 cm−1 are associated with C=O bonds. Bands identified between 2800–3200 cm−1 are allocated to the C–H stretching. The six IR bands located in the 1000–1300 cm−1 spectral range are associated with C–O vibrational modes. As the dipole moment changes due to the vibrations of atoms, two IR bands are associated with symmetric stretch, two with asymmetric stretch and two with the C–O bending. The wide spectral range identifies the locations of different IR bands in the nanocomposite thin films. Finally, the peak appearing at 541.42 cm−1 in the nanocomposites is clearly associated with Ce–O suggesting homogenous incorporation of CeO2 NPs into the co-polymer’s matrices. Furthermore, significant changes observed in width and intensity of the vibrational bands of PMMA-PS upon addition of CeO2 NPs indicate the strong influence of ceria NPs on the spectroscopy of the blended polymer. Table 2 presents the peak positions of all major vibrational bands of PMMA-PS doped by CeO2 NPs. The two main factors that influence the intensity of an IR absorption band are the intermolecular bonding between PMMA-PS matrix and Ce NPs as well as the change in dipole moment that occurs during a vibration.
Figure 8.
The FTIR spectra of PMMA-PS, and PMMA-PS doped by CeO2 NPs.
Table 2.
The peak positions of all vibrational bands of PMMA-PS, and PMMA-PS doped with CeO2 NPs.
| Vibrational Band | PMMA-PS | PMMA-PS/CeO2
1% |
PMMA-PS/CeO2
3% |
PMMA-PS/CeO2
5% |
PMMA-PS/CeO2
7% |
|---|---|---|---|---|---|
| Ce–O | -- | 541.42 | 541.42 | 541.42 | 541.42 |
| C–H bending | 704.03 | 706.03 | 693.74 | 697.86 | 697.86 |
| 753.44 | 7.45.20 | 753.44 | 751.38 | 753.44 | |
| 841.96 | 844.02 | 844.02 | 844.02 | 841.96 | |
| 965.47 | 963.41 | 963.41 | 963.41 | 963.41 | |
| C–O stretching | 1035.46 | 1037.52 | 1037.52 | 1037.52 | 1035.46 |
| 1068.40 | 1068.40 | 1066.34 | 1068.40 | 1070.46 | |
| 1148.68 | 1148.68 | 1148.68 | 1148.68 | 1150.47 | |
| 1187.79 | 1191.91 | 1191.91 | 1191.91 | 1191.91 | |
| 1251.61 | 1243.38 | 1243.38 | 1245.44 | 1245.44 | |
| 1280.43 | 1274.26 | 1274.26 | 1276.32 | 1276.32 | |
| –CH3 bending | 1371.01 | 1366.89 | 1366.89 | 1366.89 | 1368.95 |
| 1389.54 | 1385.42 | 1387.48 | 1385.42 | 1385.42 | |
| –CH2 bending | 1449.24 | 1451.29 | 1447.18 | 1449.24 | 1451.29 |
| C=C | 1484.23 | 1486.29 | 1486.29 | 1490.41 | 1492.47 |
| C=O | 1601.57 | 1599.51 | 1603.63 | 1603.63 | 1601.57 |
| 1725.03 | 1725.08 | 1725.08 | 1725.08 | 1725.08 | |
| C–H stretching | 2800–3200 | 2800–3200 | 2800–3200 | 2800–3200 | 2800–3200 |
3.3. Thermogravimetric Analysis (TGA)
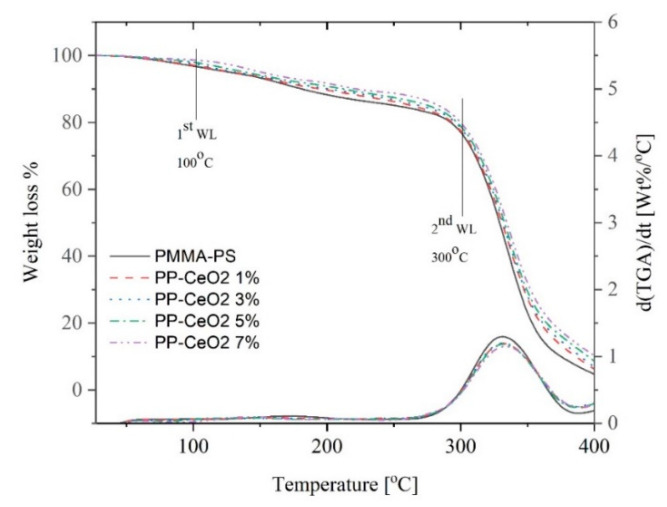
To elucidate thermal stability of doped polymeric thin films investigated in this study, thermogravimetric analysis (TGA) (weight loss %) with respect to temperature and derivative thermogravimetric analysis (DTG) are measured for PMMA-PS, and PMMA-PS incorporated CeO2 NPs. A weight loss and differential thermogravimetry curve (first derivative of the weight with respect to temperature) of PMMA-PS and PMMA-PS incorporated CeO2 NPs are shown in Figure 9. Two main regions of weight loss and first derivative weight loss are observed. The first is identified in the 100–200 °C range. In this region, the estimated weight loss is estimated to be 3–12% that could be attributed to adsorbed water. In the second region, mainly observed between 300 °C and 400 °C, the weight loss decreases from 90% to 20%. Such a large weight loss is clear indication of thermal decomposition suggesting that doped polymeric thin films exhibit low chemical stability at high temperature. Furthermore, a maximum rate of weight loss is observed at 330 °C, for PMMA-PS thin films. This maximum rate shifts slightly towards a high temperature region as the concentration of CeO2 NPs inserted into PMMA-PS matrix is increased.
Figure 9.
The weight loss and 1st derivative of weight loss of PMMA-PS incorporated with different concentrations of CeO2 NPs as a function of temperature.
Figure 10 and Figure 11 show the FTIR spectra of PMMA-PS and PMMA-PS/5%CeO2 for thin film samples processed at different annealing temperatures. For thin film samples annealed at temperatures 200–400 °C, absorbance of both PMMA-PS and PMMA-PS/CeO2 exhibits a sharp shrink away. This could be attributed to the elimination of C–H bending of PMMA-PS, and C–H bending and C–O stretching of PMMA-PS/5% CeO2.
Figure 10.
The absorbance of PMMA-PS processed at different annealing temperatures.
Figure 11.
The absorbance of PMMA-PS/5% CeO2 processed at different annealing temperatures.
3.4. Surface Morphology of PMMA-PS/CeO2 Thin Films
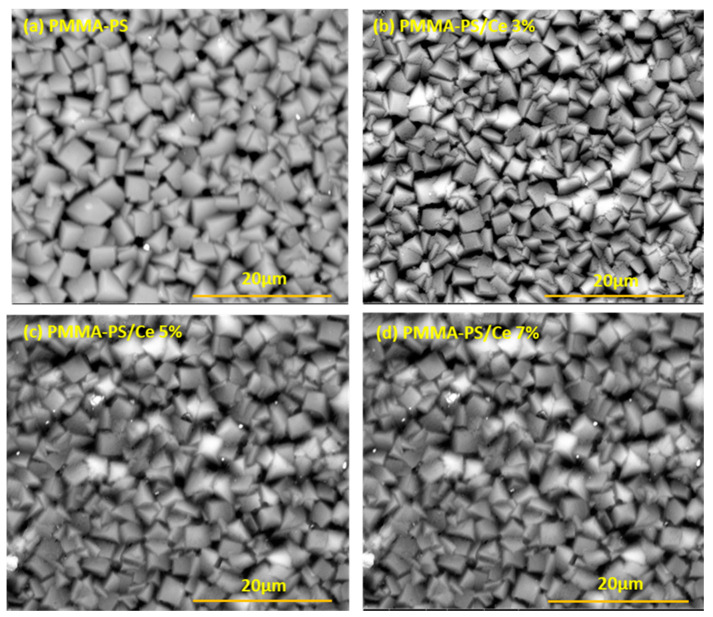
The ability to control the orientation of block copolymer thin film features relative to the surface is key to the material’s usefulness for patterning. For example, a surface appears as meandering fingerprint line/space patterns for CeO2 to be homogenously inserted and distributed. For PMMA-PS, several well-established and effective surface pre-treatments for dictating the domain orientations of self-assembled patterns are essentially possible. Even with appropriate surface pre-treatments, self-assembly of PMMA-PS patterns are relatively sensitive to the concentration of CeO2 NPs. Exciting recent advances in block copolymer-based patterning have used self-assembly to achieve alignment and registration of features by directing meandering self-assembled fingerprint patterns. Surface morphology of (PMMA-PS)/CeO2 NPs at 20 μm magnification are presented in Figure 12. Figure 12a shows that undoped PMMA-PS thin films exhibit an organized texture. Figure 12b–d show a small effect of the CeO2 NPs immersed into thin film matrix on the surface of doped PMMA-PS nanocomposite thin films. Furthermore, we examine SEM micrographs to investigate the morphology and dispersion of CeO2 NPs on the surface of PMMA-PS films. Good dispersion of CeO2 NPs on the surface of the PMMA-PS thin films is revealed. This provides a substantial evidence of the validity of our synthesis process of obtaining CeO2 NPs. SEM images indicate that measured size of CeO2 NPs is in 25–50 nm.
Figure 12.
SEM (scanning electron microscope) cross sections of chemically developed images of thin-films of (a) PMMA-PS (polymethyl methacrylate-polystyrene) block copolymers, (b) PMMA-PS/CeO2 3%, (c) PMMA-PS/CeO2 5%, and (d) PMMA-PS/CeO2 7%.
4. Conclusions
In summary, (PMMA-PS)/CeO2 nanocomposite thin films doped with different concentrations of CeO2-NPs (0 to 7%) are synthesized and deposited on glass substrates via dip-coating technique. As-grown thin films are investigated to elucidate the spectral behavior of key optical parameters such as transmittance, reflectance, absorption coefficient, refractive index, and extinction coefficient. Furthermore, a combination of classical models such as Tauc, Wemple DiDomenicol, and Sellmeier oscillator models are employed to calculate the optical band gap energy, dispersion parameters, and optoelectronic parameters of the loaded (PMMA-PS) thin films. Un-doped PMMA-PS exhibits a high transparency of about 87%. The transmittance decreases dramatically to a vanishing value in the high energy region ( nm. Reflectance is found to increase as the concentration of ceria NPs loads increases. Furthermore, refractive index n of PMMA-PS exhibits values ranging between 1.76 and 2.13. Interestingly, introducing 7% of CeO2 NPs into polymeric matrix leads to a slight increase of n to 1.85–2.26. Therefore, PMMA-PS/CeO2 nanocomposite could be used for high reflective coatings and candidates for strong optical confinement applications. The optical band gap obtained of PMMA-PS copolymers thin films is ≈4.03 indicating that it is an insulating dielectric material. Introducing CeO2 nanoparticles into the copolymers matrix decreases the optical band gap and thus it is possible to engineer the optical properties of this novel material. To elucidate a deeper understanding of the vibrational modes of PMMA-PS/CeO2 nanocomposite thin films, we carry out FTIR measurements. We identify and interpret all vibrational bands associated with formation, rotation, and twisting of different bonds involved in the investigated polymerized thin film. Evidently, major changes are observed in width and intensity of the vibrational bands of PMMA-PS upon merging of CeO2 NPs in copolymers matrix. In addition, TGA and DTG studies demonstrate that introducing higher concentrations of CeO2 NPs into PMMA-PS nanocomposite enhances thermal stability significantly. Surface morphology of PMMA-PS/CeO2 NPs at 20 μm magnification shows that PMMA-PS exhibit an amorphous nature with a smooth surface. The SEM images show homogenous dispersion of CeO2 NPs on the surface of the PMMA-PS thin films. Having obtained an interesting result on exploiting and understanding the physical mechanisms behind tuning the optical parameters of the polymer-inorganic filler nanocomposites, we are motivated to investigate the effect of changing the types of inorganic fillers, as well as their compositional content on tuning optical parameters of different polymer nanocomposites. Such future investigations are predicted to yield organic-inorganic systems of prime importance for the fabrication of state-of-art optoelectronic multifunctional devices. Furthermore, we are planning to introduce transition metal oxides into different polymeric matrices to examine the possibility of inducing strong magnetic properties to fabricate onto magnetic devices.
Our detailed and comprehensive investigations of the optical, morphological, lattice dynamical, and thermal properties of PMMA-PS/CeO2 NPs nanocomposite thin films reveal that they could be utilized in manufacturing realistic-scaled smart multifunctional devices.
Acknowledgments
The authors would like to thank Jordan University of Science and Technology in Jordan for the support provided by the Deanship of Scientific Research on project number 20180246. The authors would like to thank M-Ali Al-Akhras for his help in using the facilities of the Center of Nanotechnology and the Laboratory of Biomedical Physics.
Author Contributions
Conceptualization, A.A.B.-S., A.A.A., A.M.A., I.A.Q. and I.A.A.; Data curation, A.A.B.-S., A.A.A. and A.M.A.; Formal analysis, A.A.B-S, A.M.A., I.A.A. and A.A.A.; Funding acquisition, A.A.A., A.M.A. and I.A.Q.; Investigation, A.A.B.-S., A.A.A., A.M.A., I.A.Q. and I.A.A.; Methodology, A.A.B.-S., A.A.A., A.M.A., I.A.Q. and I.A.A.; Project administration, A.A.A. and A.M.A.; Resources, A.A.A., A.M.A. and I.A.Q.; Supervision, A.A.A., A.M.A. and I.A.Q.; Validation, A.A.A., A.M.A. and I.A.Q.; Visualization, A.A.B.-S., A.A.A., A.M.A., I.A.Q. and I.A.A.; Writing—original draft, A.A.B.-S., A.A.A., A.M.A., I.A.Q. and I.A.A.; Writing—review & editing, A.A.B.-S., A.A.A., A.M.A., I.A.Q. and I.A.A. All authors have read and agreed to the published version of the manuscript.
Funding
This research received no external funding.
Institutional Review Board Statement
Not applicable.
Informed Consent Statement
Not applicable.
Data Availability Statement
Data availability upon request.
Conflicts of Interest
The authors declare no conflict of interest.
Footnotes
Publisher’s Note: MDPI stays neutral with regard to jurisdictional claims in published maps and institutional affiliations.
References
- 1.Al-Asbahi B.A. Influence of SiO2/TiO2 nanocomposite on the optoelectronic properties of PFO/MEH-PPV-based OLED devices. Polymers. 2018;10:800. doi: 10.3390/polym10070800. [DOI] [PMC free article] [PubMed] [Google Scholar]
- 2.Wu S., Peng S., Wang C.H. Multifunctional Polymer Nanocomposites Reinforced by Aligned Carbon Nanomaterials. Polymers. 2018;10:542. doi: 10.3390/polym10050542. [DOI] [PMC free article] [PubMed] [Google Scholar]
- 3.Kumar S., Sarita, Nehra M., Dilbaghi N., Tankeshwar K., Kim K.-H. Recent advances and remaining challenges for polymeric nanocomposites in healthcare applications. Prog. Polym. Sci. 2018;80:1–38. doi: 10.1016/j.progpolymsci.2018.03.001. [DOI] [Google Scholar]
- 4.Reyes-Acosta M.A., Torres-Huerta A.M., Domínguez-Crespo M.A., Flores-Vela A.I., Dorantes-Rosales H.J., Andraca-Adame J.A. Thermal, Mechanical and UV-Shielding Properties of Poly(Methyl Methacrylate)/Cerium Dioxide Hybrid Systems Obtained by Melt Compounding. Polymers. 2015;7:1638–1659. doi: 10.3390/polym7091474. [DOI] [Google Scholar]
- 5.Xia Y., Zhang C., Wang J.-X., Wang D., Zeng X.-F., Chen J.-F. Synthesis of Transparent Aqueous ZrO2 Nanodispersion with a Controllable Crystalline Phase without Modification for a High-Refractive-Index Nanocomposite Film. Langmuir. 2018;34:6806–6813. doi: 10.1021/acs.langmuir.8b00160. [DOI] [PubMed] [Google Scholar]
- 6.Wang W., Zhang B., Jiang S., Bai H., Zhang S. Use of CeO2 Nanoparticles to Enhance UV-Shielding of Transparent Regenerated Cellulose Films. Polymers. 2019;11:458. doi: 10.3390/polym11030458. [DOI] [PMC free article] [PubMed] [Google Scholar]
- 7.Kang T., Kim Y.G., Kim D., Hyeon T. Inorganic nanoparticles with enzyme-mimetic activities for biomedical applications. Co-ord. Chem. Rev. 2020;403:213092. doi: 10.1016/j.ccr.2019.213092. [DOI] [Google Scholar]
- 8.James J., Unni A.B., Taleb K., Chapel J.-P., Kalarikkal N., Varghese S., Vignaud G., Grohens Y. Surface engineering of polystyrene–cerium oxide nanocomposite thin films for refractive index enhancement. Nano-Struct. Nano-Objects. 2019;17:34–42. doi: 10.1016/j.nanoso.2018.11.001. [DOI] [Google Scholar]
- 9.Lee L.-H., Chen W.-C. High-Refractive-Index Thin Films Prepared from Trialkoxysilane-Capped Poly(methyl methacrylate)—Titania Materials. Chem. Mater. 2001;13:1137–1142. doi: 10.1021/cm000937z. [DOI] [Google Scholar]
- 10.Shambat G., Ellis B., Majumdar A., Petykiewicz J., Mayer M., Sarmiento T., Harris J., Haller E., Vuckovic J. Ultrafast directly modulated single-mode photonic crystal nanocavity light-emitting diode. Solid State Devices Mater. 2012;2:1–6. doi: 10.7567/ssdm.2012.a-5-1. [DOI] [PubMed] [Google Scholar]
- 11.Schneiderman D.K., Hillmyer M.A. 50th Anniversary Perspective: There Is a Great Future in Sustainable Polymers. Macromolecules. 2017;50:3733–3749. doi: 10.1021/acs.macromol.7b00293. [DOI] [Google Scholar]
- 12.Hong M., Chen E.Y.-X. Chemically recyclable polymers: A circular economy approach to sustainability. Green Chem. 2017;19:3692–3706. doi: 10.1039/C7GC01496A. [DOI] [Google Scholar]
- 13.Carotenuto G., Giannini C., Siliqi D., Nicolais L. Nanocomposites Based on Metal and Metal Sulfide Clusters Embedded in Polystyrene. Polymers. 2011;3:1352–1362. doi: 10.3390/polym3031352. [DOI] [Google Scholar]
- 14.Girault P., Lorrain N., Poffo L., Guendouz M., Lemaitre J., Carré C., Gadonna M., Bosc D., Vignaud G. Integrated polymer micro-ring resonators for optical sensing applications. J. Appl. Phys. 2015;117:104504. doi: 10.1063/1.4914308. [DOI] [Google Scholar]
- 15.Lü C., Yang B. High refractive index organic–inorganic nanocomposites: Design, synthesis and application. J. Mater. Chem. 2009;19:2884–2901. doi: 10.1039/b816254a. [DOI] [Google Scholar]
- 16.Zhang Q., Fang Z., Cao Y., Du H., Wu H., Beuerman R., Chan-Park M.B., Duan H., Xu R. High Refractive Index Inorganic–Organic Interpenetrating Polymer Network (IPN) Hydrogel Nanocomposite toward Artificial Cornea Implants. ACS Macro Lett. 2012;1:876–881. doi: 10.1021/mz300078y. [DOI] [PubMed] [Google Scholar]
- 17.Zhang Q., Su K., Chan-Park M.B., Wu H., Wang D., Xu R. Development of high refractive ZnS/PVP/PDMAA hydrogel nanocomposites for artificial cornea implants. Acta Biomater. 2014;10:1167–1176. doi: 10.1016/j.actbio.2013.12.017. [DOI] [PubMed] [Google Scholar]
- 18.Rogers H.G., Gaudiana R.A., Hollinsed W.C., Kalyanaraman P.S., Manello J.S., McGowan C., Minns R.A., Sahatjian R. Highly amorphous, birefringent, para-linked aromatic polyamides. Macromolecules. 1985;18:1058–1068. doi: 10.1021/ma00148a003. [DOI] [Google Scholar]
- 19.Yang C.J., Jenekhe S.A. Effects of Structure on Refractive Index of Conjugated Polyimines. Chem. Mater. 1994;6:196–203. doi: 10.1021/cm00038a016. [DOI] [Google Scholar]
- 20.Caglar M., Ilican S., Caglar Y., Yakuphanoglu F. Electrical conductivity and optical properties of ZnO nanostructured thin film. Appl. Surf. Sci. 2009;255:4491–4496. doi: 10.1016/j.apsusc.2008.11.055. [DOI] [Google Scholar]
- 21.Soni G., Srivastava S., Soni P., Kalotra P., Vijay Y.K. Optical, mechanical and structural properties of PMMA/SiO2 nanocomposite thin films. Mater. Res. Express. 2017;5:015302. doi: 10.1088/2053-1591/aaa0f7. [DOI] [Google Scholar]
- 22.Heiba Z.K., Mohamed M.B., Mostafa N.Y., El-Naggar A. Structural and Optical Properties of Cd 1 − x Mn x Fe2O4/PMMA Nanocomposites. J. Inorg. Organomet. Polym. Mater. 2019;30:1–9. [Google Scholar]
- 23.Soni G., Gouttam N., Soni P. Optical properties of PMMA/ZnO/SiO2 composite thin film. Mater. Today Proc. 2020;30:35–38. doi: 10.1016/j.matpr.2020.04.027. [DOI] [Google Scholar]
- 24.Kumar M., Arun S., Upadhyaya P., Pugazhenthi G. Properties of PMMA/clay nanocomposites prepared using various compatibilizers. Int. J. Mech. Mater. Eng. 2015;10:205. doi: 10.1186/s40712-015-0035-x. [DOI] [Google Scholar]
- 25.Khaled S.M., Sui R., Charpentier P.A., Rizkalla A.S. Synthesis of TiO2−PMMA Nanocomposite: Using Methacrylic Acid as a Coupling Agent. Langmuir. 2007;23:3988–3995. doi: 10.1021/la062879n. [DOI] [PubMed] [Google Scholar]
- 26.Abdel-Kader M.H., Mohamed M.B. Exploring the direct effect of intermediate band semiconductor materials on the structural, thermal and optical properties of PMMA nanocomposite. Appl. Phys. A. 2020;126:1–11. doi: 10.1007/s00339-019-3244-y. [DOI] [Google Scholar]
- 27.Shih Y.-F., Kotharangannagari V.K., Tsou T.-C. Development of eco-friendly modified cellulose nanofiber reinforced polystyrene nanocomposites: Thermal, mechanical, and optical properties. J. Polym. Res. 2020;27:1–10. doi: 10.1007/s10965-020-02156-8. [DOI] [Google Scholar]
- 28.Okamoto M. Biodegradable polymer/layered silicate nanocomposites: A review. J. Ind. Eng. Chem. 2004;10:1156–1181. [Google Scholar]
- 29.Kargarzadeh H., Huang J., Lin N., Ahmad I., Mariano M., Dufresne A., Thomas S., Gałęski A. Recent developments in nanocellulose-based biodegradable polymers, thermoplastic polymers, and porous nanocomposites. Prog. Polym. Sci. 2018;87:197–227. doi: 10.1016/j.progpolymsci.2018.07.008. [DOI] [Google Scholar]
- 30.Vignaud G., Chebil M.S., Bal J.K., Delorme N., Beuvier T., Grohens Y., Gibaud A. Densification and Depression in Glass Transition Temperature in Polystyrene Thin Films. Langmuir. 2014;30:11599–11608. doi: 10.1021/la501639z. [DOI] [PubMed] [Google Scholar]
- 31.Unni A.B., Vignaud G., Chapel J.-P., Giermanska J., Bal J.K., Delorme N., Beuvier T., Thomas S., Grohens Y., Gibaud A. Probing the Density Variation of Confined Polymer Thin Films via Simple Model-Independent Nanoparticle Adsorption. Macromolecules. 2017;50:1027–1036. doi: 10.1021/acs.macromol.6b02617. [DOI] [Google Scholar]
- 32.Lin S.-S., Huang J.-L. Effect of thickness on the structural and optical properties of ZnO films by r.f. magnetron sputtering. Surf. Coatings Technol. 2004;185:222–227. doi: 10.1016/j.surfcoat.2003.11.014. [DOI] [Google Scholar]
- 33.Hameed S.A., Saadmahdi Z., Jasim A.N., Taha A.F., Habeeb A.A. Effect of Thickness on Structural and Optical Properties of CdO Thin Films Prepared by Chemical Spray Pyrolysis Method. NeuroQuantology. 2020;18:20. doi: 10.14704/nq.2020.18.4.NQ20156. [DOI] [Google Scholar]
- 34.Wu H., Shen S., Li J., Chen X., Zhang Z., Ou-Yang W. Boosted field emission properties and thickness effect of conductive polymers coated silicon carbide matrices for vacuum electronic devices. Vacuum. 2020;180:109594. doi: 10.1016/j.vacuum.2020.109594. [DOI] [Google Scholar]
- 35.Menazea A., Mostafa A.M., Al-Ashkar E.A. Effect of nanostructured metal oxides (CdO, Al2O3, Cu2O) embedded in PVA via Nd:YAG pulsed laser ablation on their optical and structural properties. J. Mol. Struct. 2020;1203:127374. doi: 10.1016/j.molstruc.2019.127374. [DOI] [Google Scholar]
- 36.Cheng Y., Lu C., Yang B. A Review on High Refractive Index Nanocomposites for Optical Applications. Recent Pat. Mater. Sci. 2011;4:15–27. doi: 10.2174/1874465611104010015. [DOI] [Google Scholar]
- 37.Liu J.-G., Ueda M. High refractive index polymers: Fundamental research and practical applications. J. Mater. Chem. 2009;19:8907–8919. doi: 10.1039/b909690f. [DOI] [Google Scholar]
- 38.Tao P., Li Y., Rungta A., Viswanath A., Gao J., Benicewicz B.C., Siegel R.W., Schadler L.S. TiO2 nanocomposites with high refractive index and transparency. J. Mater. Chem. 2011;21:18623–18629. doi: 10.1039/c1jm13093e. [DOI] [Google Scholar]
- 39.İncel A., Güner T., Parlak O., Demir M.M. Null extinction of ceria@ silica hybrid particles: Transparent polystyrene composites. ACS Appl. Mater. Interfaces. 2015;7:27539–27546. doi: 10.1021/acsami.5b09818. [DOI] [PubMed] [Google Scholar]
- 40.Nadeem M., Khan R., Afridi K., Nadhman A., Ullah S., Faisal S., Mabood Z.U., Hano C., Abbasi B.H. Green Synthesis of Cerium Oxide Nanoparticles (CeO2 NPs) and Their Antimicrobial Applications: A Review. Int. J. Nanomed. 2020;15:5951–5961. doi: 10.2147/IJN.S255784. [DOI] [PMC free article] [PubMed] [Google Scholar]
- 41.Das S., Dowding J.M., Klump K.E., McGinnis J.F., Self W., Seal S. Cerium oxide nanoparticles: Applications and prospects in nanomedicine. Nanomedicine. 2013;8:1483–1508. doi: 10.2217/nnm.13.133. [DOI] [PubMed] [Google Scholar]
- 42.Liying H., Yumin S., Lanhong J., Shikao S. Recent advances of cerium oxide nanoparticles in synthesis, luminescence and biomedical studies: A review. J. Rare Earths. 2015;33:791–799. [Google Scholar]
- 43.Chiu F.-C., Lai C.-M. Optical and electrical characterizations of cerium oxide thin films. J. Phys. D Appl. Phys. 2010;43:075104. doi: 10.1088/0022-3727/43/7/075104. [DOI] [Google Scholar]
- 44.Vigneselvan S., Manikandan V., Petrila I., Vanitha A., Chandrasekaran J. Effect of copper substitution on structural, optical and humidity-sensing characteristics of cerium oxide nanoparticles. J. Phys. Chem. Solids. 2020;136:109173. doi: 10.1016/j.jpcs.2019.109173. [DOI] [Google Scholar]
- 45.Albery W.B. Acceleration in other axes affects +Gz tolerance: Dynamic centrifuge simulation of agile flight. Aviat. Space Environ. Med. 2004;75:1–6. [PubMed] [Google Scholar]
- 46.Viezbicke B.D., Patel S., Davis B.E., Birnie D.P. Evaluation of the Tauc method for optical absorption edge determination: ZnO thin films as a model system (Phys. Status Solidi B 8/2015) Phys. Status Solidi B. 2015;252:1700–1710. doi: 10.1002/pssb.201552007. [DOI] [Google Scholar]
- 47.Ahmad A., Alsaad A., Al-Bataineh Q. Optical and structural characterization of dip synthesized Al-B Co-doped ZnO seeded platforms for ZnO nanostructures. Appl. Phys. A. 2017 doi: 10.1007/s00339-018-1875-z. [DOI] [Google Scholar]
- 48.Alsaad A., Ahmad A., Qattan I., Al-Bataineh Q.M., Albataineh Z. Structural, Optoelectrical, Linear, and Nonlinear Optical Characterizations of Dip-Synthesized Undoped ZnO and Group III Elements (B, Al, Ga, and In)-Doped ZnO Thin Films. Crystals. 2020;10:252. doi: 10.3390/cryst10040252. [DOI] [Google Scholar]
- 49.Al-Bataineh Q.M., Alsaad A.M., Ahmad A.A., Al-Sawalmih A. Structural, Electronic and Optical Characterization of ZnO Thin Film-Seeded Platforms for ZnO Nanostructures: Sol–Gel Method Versus Ab Initio Calculations. J. Electron. Mater. 2019;48:5028–5038. doi: 10.1007/s11664-019-07303-6. [DOI] [Google Scholar]
- 50.Al-Bataineh Q.M., Alsaad A., Ahmad A., Telfah A. A novel optical model of the experimental transmission spectra of nanocomposite PVC-PS hybrid thin films doped with silica nanoparticles. Heliyon. 2020;6:e04177. doi: 10.1016/j.heliyon.2020.e04177. [DOI] [PMC free article] [PubMed] [Google Scholar]
- 51.Hassanien A.S., Sharma I. Optical properties of quaternary a-Ge15-x Sbx Se50 Te35 thermally evaporated thin-films: Refractive index dispersion and single oscillator parameters. Optik. 2020;200:163415. doi: 10.1016/j.ijleo.2019.163415. [DOI] [Google Scholar]
- 52.Aziz S.B., Abdullah O.G., Hussein A.M., Ahmed H.M. From Insulating PMMA Polymer to Conjugated Double Bond Behavior: Green Chemistry as a Novel Approach to Fabricate Small Band Gap Polymers. Polymers. 2017;9:626. doi: 10.3390/polym9110626. [DOI] [PMC free article] [PubMed] [Google Scholar]
- 53.Hussen S.A. Structural and optical characterization of pure and SnZrO3 doped PS based polymer nanocomposite. Mater. Res. Express. 2020;7 doi: 10.1088/2053-1591/abbb53. [DOI] [Google Scholar]
- 54.Oriaku C., Osuwa J., Njoku C. Single oscillator parameters and optical energies of laser irradiated Cu doped cds thin films. Non-Oxide Glasses. 2011;3:25–30. [Google Scholar]
- 55.Yakuphanoglu F., Cukurovali A., Yilmaz I. Single-oscillator model and determination of optical constants of some optical thin film materials. Phys. B Condens. Matter. 2004;353:210–216. doi: 10.1016/j.physb.2004.09.097. [DOI] [Google Scholar]
- 56.Hassanien A., Akl A.A. Influence of composition on optical and dispersion parameters of thermally evaporated non-crystalline Cd50S50−xSex thin films. J. Alloys Compd. 2015;648:280–290. doi: 10.1016/j.jallcom.2015.06.231. [DOI] [Google Scholar]
- 57.Güneri E., Kariper A. Optical properties of amorphous CuS thin films deposited chemically at different pH values. J. Alloys Compd. 2012;516:20–26. doi: 10.1016/j.jallcom.2011.11.054. [DOI] [Google Scholar]
- 58.Wemple S.H., DiDomenico M. Optical Dispersion and the Structure of Solids. Phys. Rev. Lett. 1969;23:1156–1160. doi: 10.1103/PhysRevLett.23.1156. [DOI] [Google Scholar]
- 59.Badran H.A., Al-Ahmad A.Y., Hassan Q.M.A., Emshary C.A. Determination of optical constants and nonlinear optical coefficients of Violet 1-doped polyvinyl alcohol thin film. Pramana. 2015;86:135–145. doi: 10.1007/s12043-015-0960-5. [DOI] [Google Scholar]
- 60.Bakr N.A., Jandow N.N., Habubi N.F. Optical and Dispersion Parameters of ZnS Thin Films Prepared by Flash Evaporation Method. Int. Lett. Chem. Phys. Astron. 2014;39:52–63. doi: 10.18052/www.scipress.com/ILCPA.39.52. [DOI] [Google Scholar]
- 61.Badran H.A. Study on Optical Constants and Refractive Index Dispersion of Neutral red Doped Polymer Film. Am. J. Appl. Sci. 2012;9:250–253. doi: 10.3844/ajassp.2012.250.253. [DOI] [Google Scholar]
- 62.Okutan M., San S.E., Köysal O., Yakuphanoglu F. Investigation of refractive index dispersion and electrical properties in carbon nano-balls’ doped nematic liquid crystals. Phys. B Condens. Matter. 2005;362:180–186. doi: 10.1016/j.physb.2005.02.009. [DOI] [Google Scholar]
Associated Data
This section collects any data citations, data availability statements, or supplementary materials included in this article.
Data Availability Statement
Data availability upon request.


