

Abstract
Ultraconserved enhancer sequences show perfect conservation between human and rodent genomes, suggesting that their functions are highly sensitive to mutation. However, current models of enhancer function do not sufficiently explain this extreme evolutionary constraint. We subjected 23 ultraconserved enhancers to different levels of mutagenesis, collectively introducing 1,547 mutations, and examined their activities in transgenic mouse reporter assays. Overall, we find that the regulatory properties of ultraconserved enhancers are robust to mutation. Nearly all (19/23, 83%) still functioned as enhancers upon mutagenesis at one developmental stage, as did a majority tested again later in development (5/9, 56%). Replacement of endogenous enhancers with mutated alleles in mice corroborated results of transgenic assays, including the functional resilience of ultraconserved enhancers to mutation. Our findings show that the currently known activities of ultraconserved enhancers do not necessarily require the perfect conservation observed in evolution and suggest that additional regulatory or other functions contribute to their sequence constraint.
Introduction
Sequence conservation between species over long evolutionary times indicates purifying selection and is widely used to identify functional elements within genomes. Despite ~80 million years separating humans and rodents from their last common ancestor, 481 loci of at least 200 contiguous base pairs in the human genome were found to be perfectly identical to orthologous sequences in mouse and rat1. These ‘ultraconserved’ human-rodent loci also show a high degree of conservation throughout an additional ~100 sequenced vertebrate genomes2 (Fig. 1a). Ultraconserved sequences were initially shown to be depleted of common single-nucleotide polymorphisms in the human population1,3. Subsequent analyses of sequencing data from thousands of individuals confirmed this depletion of common variants from ultraconserved sequences but revealed that the rate of rare polymorphisms is comparable to the genomic average, excluding the possibility that these sites are merely mutational cold spots4–6. Together, these observations suggested that ultraconserved sequences are most likely maintained by purifying selection in mammals.
Fig. 1. Study overview.
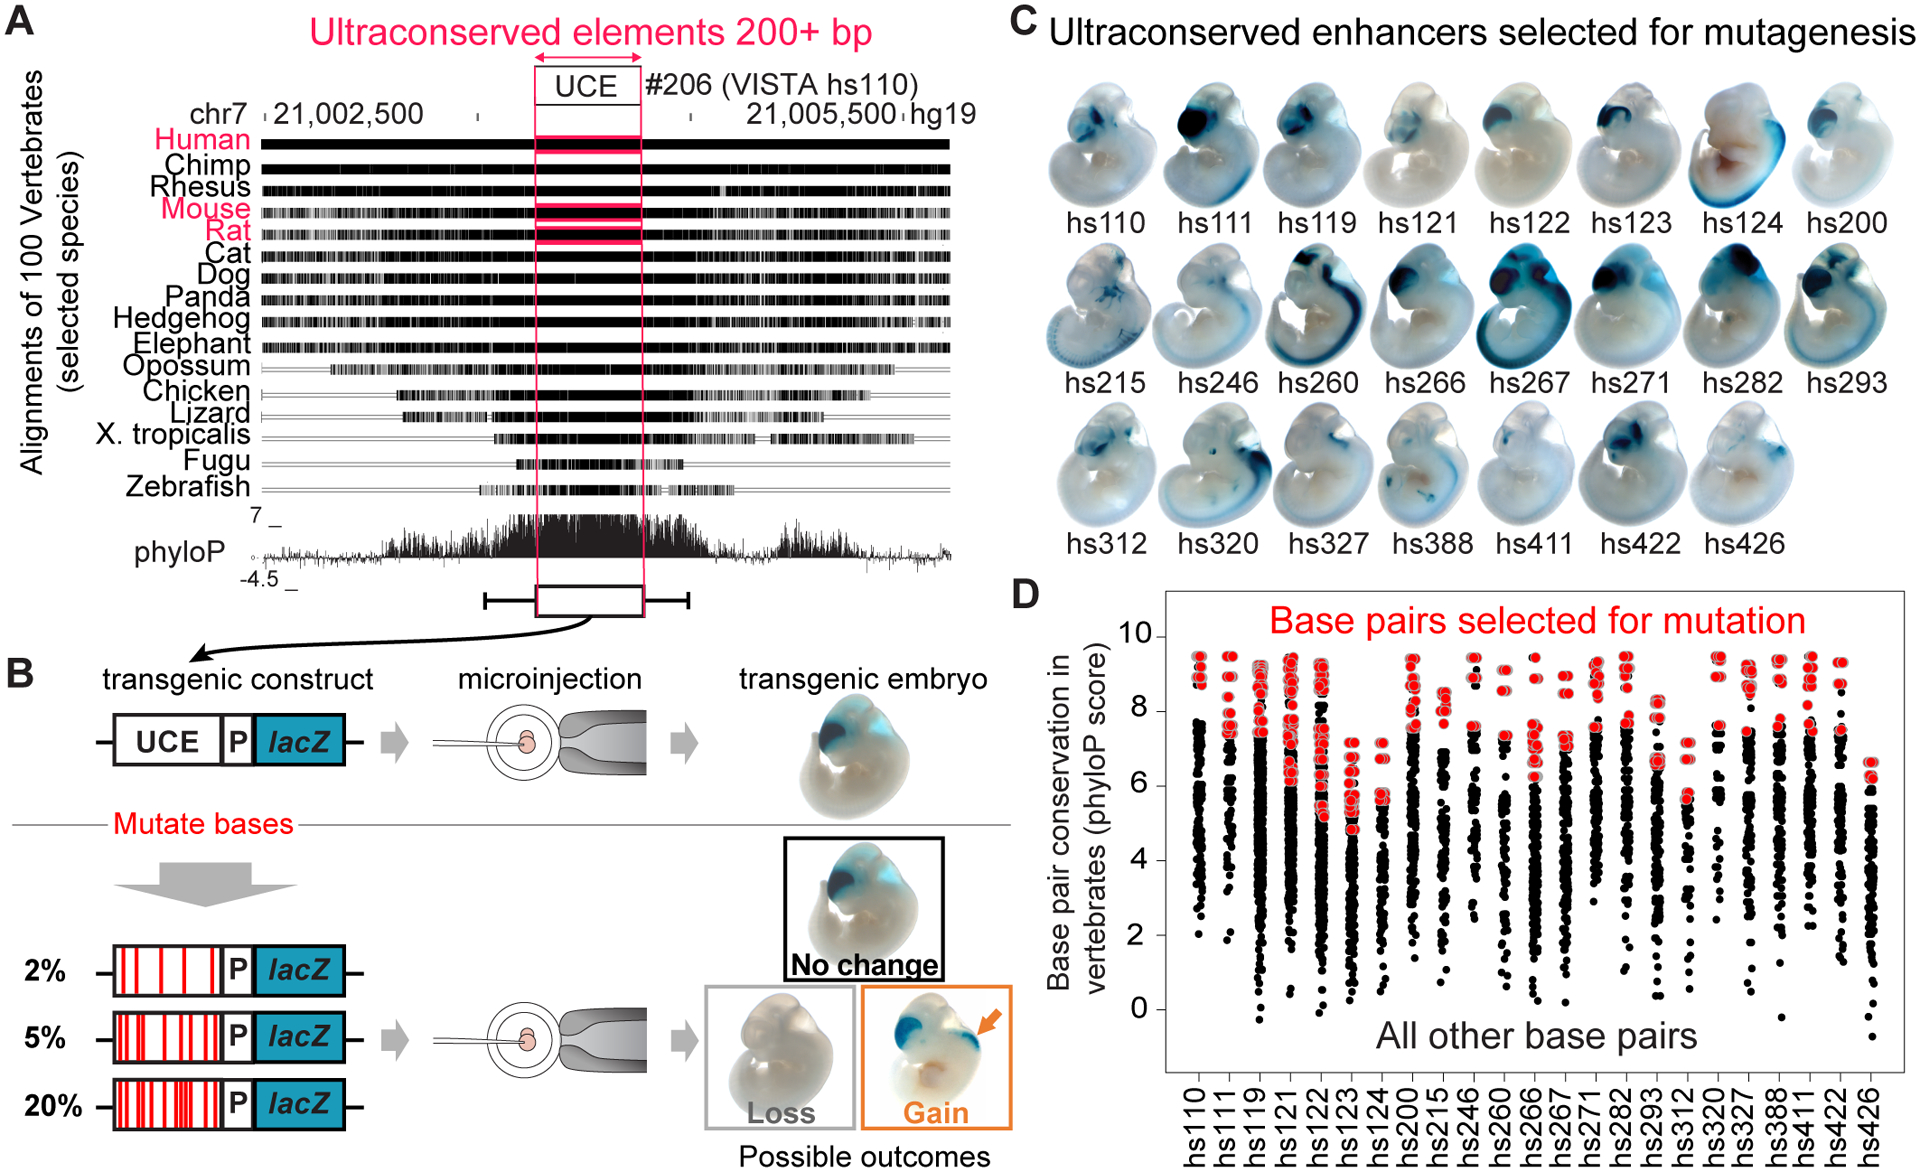
a, Human-rodent ultraconserved elements show a high degree of conservation across other sequenced vertebrate genomes. UCE, ultraconserved element. b, Study design for mouse transgenic reporter assays to reveal whether mutations in ultraconserved enhancers impact their activity. P, promoter. c, Activity of the human reference allele of 23 ultraconserved enhancers selected for mutagenesis. All elements were tested with a CRISPR-assisted site-specific mouse transgenic reporter assay at mouse embryonic day 11.5 (e11.5) except hs124, which was tested at e12.5. d, Conservation of all human-rodent ultraconserved base pairs within the selected 23 ultraconserved enhancers across 100 sequenced vertebrate genomes (phyloP score obtained from UCSC phyloP100way track). Base pairs selected for mutagenesis are highlighted in red. More details on selecting base pairs for mutagenesis can be found in Extended Data Figure 1a and Supplementary Figure 2.
Nearly 70% of ultraconserved sequences are noncoding, and many function as distant-acting transcriptional enhancers in embryonic development, as demonstrated through transgenic reporter assays in vivo7,8. Deletion of ultraconserved enhancers from the mouse genome yielded viable mice and resulted in surprisingly mild but measurable gene expression changes and developmental phenotypes, consistent with their regulatory function9–12. Possible explanations for the relatively subtle nature of the phenotypes include the limited ability of laboratory assays to measure fitness effects relevant in the wild9,13, as well as the substantial selective constraint that can result even from minor fitness effects over many generations14,15. While these hypotheses can help explain why ultraconserved enhancers are generally conserved, they do not account for the extreme degree of sequence conservation of these loci. Although multiple functions have been proposed to explain ultraconservation16,17, the most common function of noncoding ultraconserved sequences directly supported by experimental evidence is embryonic enhancer activity7,8. Mutagenesis experiments performed on a small sampling of less well conserved mammalian enhancers have shown that point mutations tend to individually have little or no effect on enhancer regulatory properties, likely because of the redundancy and/or degeneracy of transcription factor binding sites contained within enhancers18–24. In contrast, the perfect conservation of ultraconserved enhancers suggests that a mutation in any single one of the base pairs should impact the function of the sequence. These combined findings suggest that the function of ultraconserved enhancers may be ‘ultrasensitive’ to mutations, i.e., that even changes of individual base pairs adversely affect their function16,17. To test this hypothesis, we performed systematic mutagenesis of nearly two dozen ultraconserved enhancers and assessed the resulting effects on enhancer activity in vivo.
Results
Enhancer Function of Ultraconserved Elements is Robust to Mutagenesis
To explore the impact of mutations on the function of ultraconserved enhancers, we subjected 23 independent ultraconserved sequences with robust enhancer activity during embryonic development7,8 to varying levels of mutation (Fig. 1b). The 23 enhancers are active in various tissues, most frequently in sub-regions of the developing brain, and contain 201 bp to 770 bp of ultraconserved sequence, usually embedded within larger blocks of moderately conserved sequence (Fig. 1a, c). For mutagenesis, we prioritized base pairs perfectly conserved between the human, mouse, and rat reference genomes that additionally had a high level of evolutionary conservation among ~100 sequenced vertebrate genomes, along with nucleotides within predicted conserved transcription factor binding sites25,26. Otherwise, mutations were evenly distributed across the ultraconserved core of each enhancer, with ~89% of introduced mutations not overlapping a reported human variant (Fig. 1d, Extended Data Fig. 1). In total, we mutagenized 1,547 ultraconserved base pairs within 23 enhancers, generating 74 separate mutant alleles with 2%, 5%, or 20% of ultraconserved base pairs mutated. Each allele was tested for in vivo enhancer activity using a CRISPR-assisted site-specific mouse transgenic reporter assay that substantially improves transgenic efficiency and minimizes ectopic reporter expression associated with random transgene integration24. Transgenic embryos were scored for reporter gene expression by multiple annotators blinded to the type of allele tested (i.e., reference or mutant alleles; see Extended Data Fig. 2 and Methods for details).
We next classified the robustness of ultraconserved enhancers to mutation by comparing the strength and reproducibility of patterns driven by mutant alleles to those observed with the reference enhancer allele (Fig. 2a). The majority of ultraconserved enhancers (19/23, 83%) were robust to mutagenesis, showing normal tissue specificity, strength, and spatial boundaries of enhancer activity for at least one of the mutation alleles tested (Fig. 2b, Extended Data Fig. 3a). For 44% of enhancers (10/23), normal activity was maintained for at least one allele with 5% of ultraconserved base pairs mutated. In one extreme case (hs111), residual enhancer activity in the expected tissue was observed even upon mutation of 20% of base pairs (Fig. 2b). For this enhancer, activity was fully abolished after mutation of all base pairs conserved across ~100 sequenced vertebrate genomes25 (59% of ultraconserved base pairs, Supplementary Fig. 1). Only 4 of 23 (17%) ultraconserved enhancers showed loss of activity with all mutagenesis alleles tested. While assessing only a subset of all possible variants, our combined results indicate that ultraconserved enhancers commonly maintain their regular activity upon mutagenesis, supporting that their perfect conservation is not solely explained by the transcriptional enhancer functions observable in transgenic in vivo assays at the embryonic day 11.5 developmental stage.
Fig. 2. Ultraconserved enhancers are mostly robust to mutagenesis.
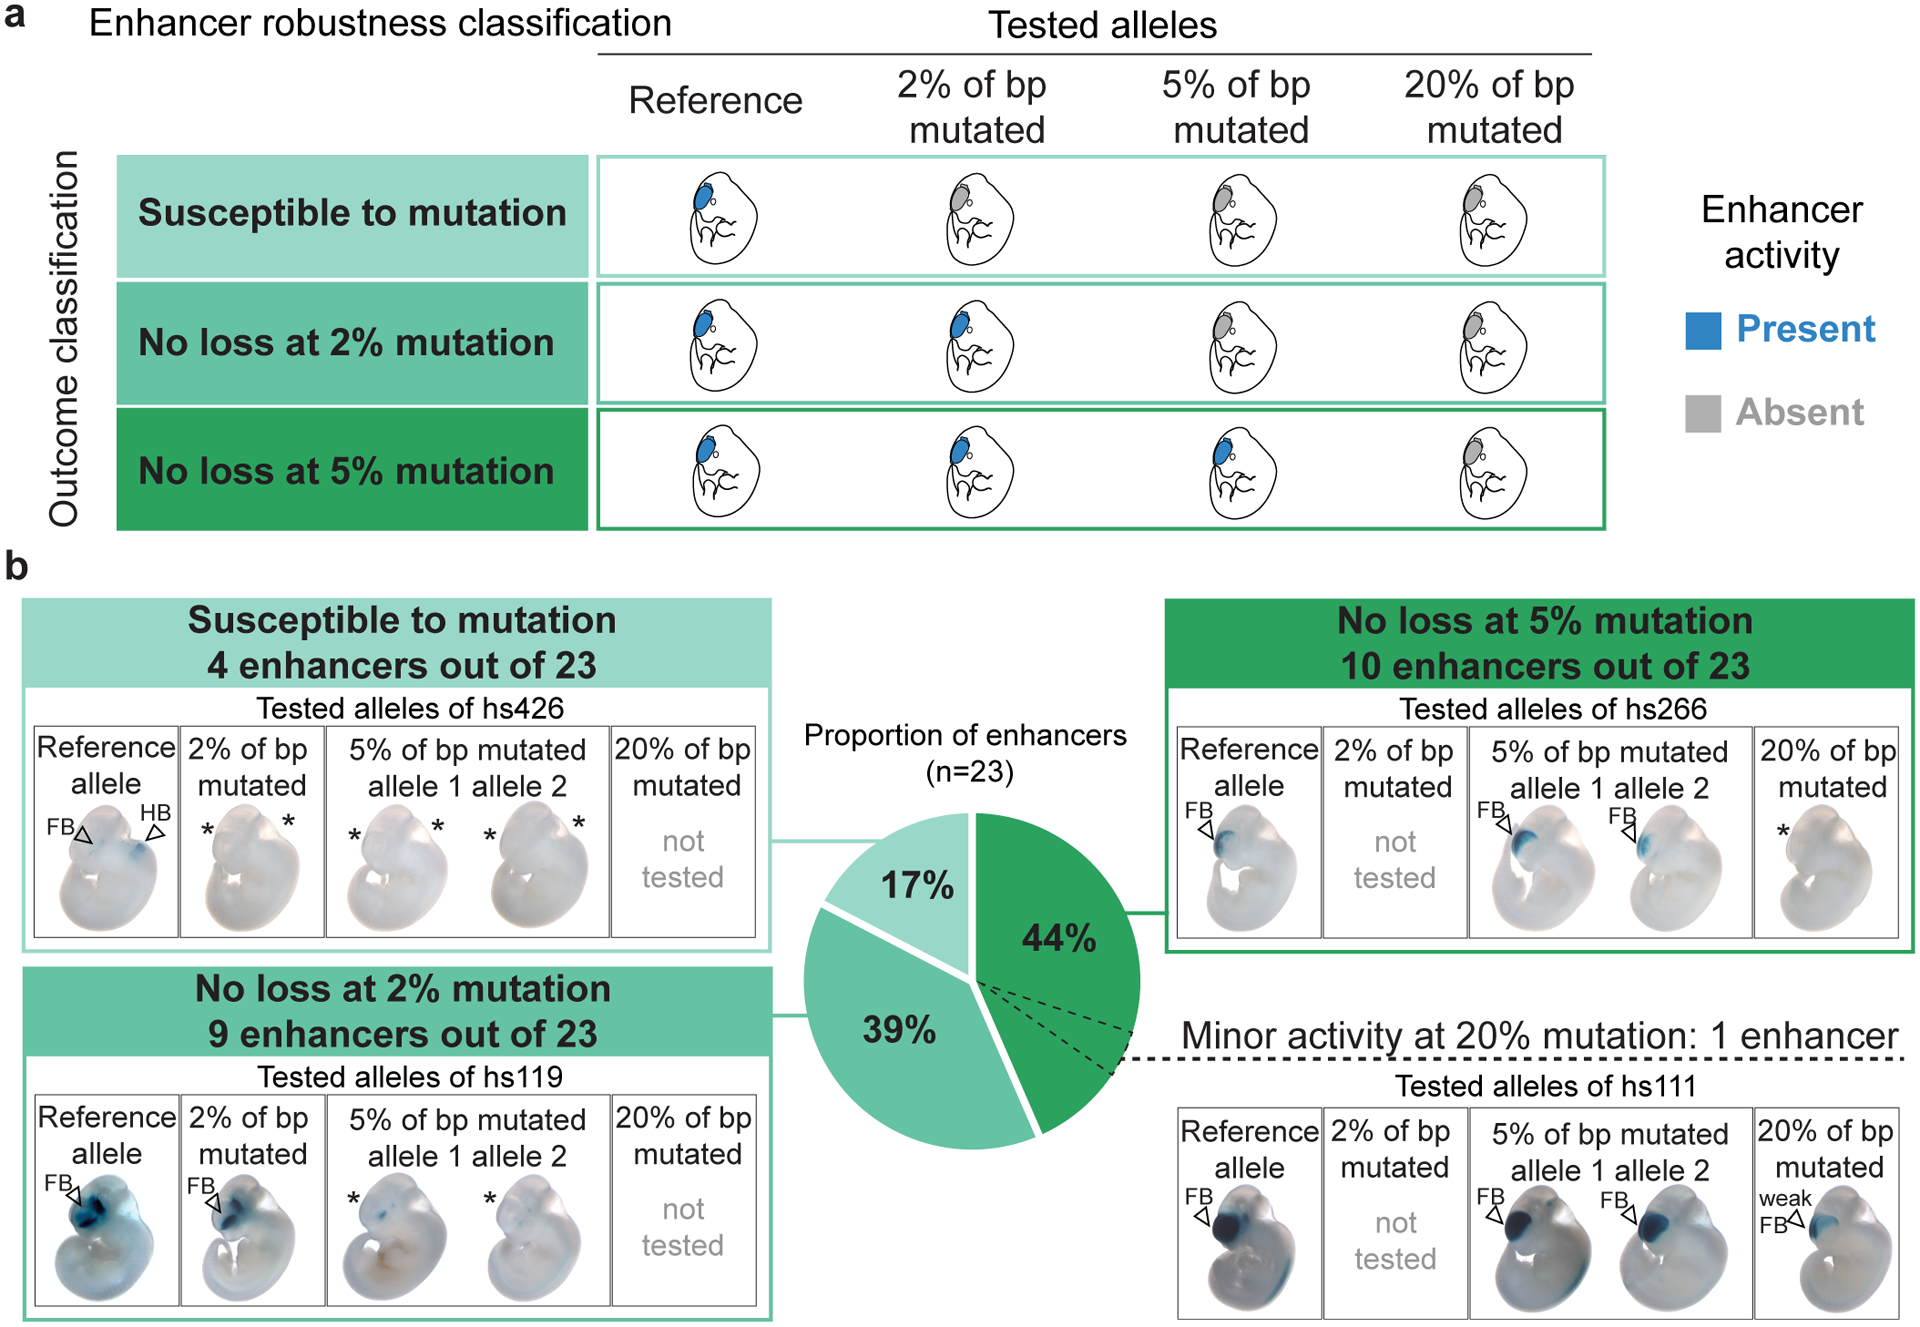
a, Schematic of the possible functional outcomes of enhancer mutagenesis. b, Distribution of 23 ultraconserved enhancers among the three bins of enhancer mutagenesis outcomes. Representative embryo images are shown for each tested allele of three example enhancers (boxes in shades of green). In one case (hs111, bottom right), residual enhancer activity was still observed after mutating 20% of ultraconserved base pairs. Data for all 23 enhancers are provided in Extended Data Figure 3a, with P values in Supplementary Table 1. Examples of scoring guidelines are described in Extended Data Figure 2, with scoring data for all 23 enhancers in Supplementary Figure 1. e11.5 embryos have a crown-rump length of 6 mm on average. * indicates a loss of LacZ staining in the mutant allele, FB – forebrain, HB – hindbrain.
To better understand why some of the tested mutation haplotypes decreased or eliminated enhancer activity while many had no effect, we examined sequence characteristics of tested alleles in more detail. There were no significant differences in the lengths of ultraconserved sequences between enhancers that were either susceptible or robust to mutagenesis (Extended Data Fig. 3b). Consistent with a previous report27, ultraconserved noncoding sequences as a class were enriched for AT-rich motifs of developmental transcription factors from the HOXB, SOX, LHX, DLX, and other families (Extended Data Fig. 4a). In agreement, >80% of the ultraconserved enhancers we selected for mutagenesis are bound by DLX transcription factors in mouse brain at several developmental time points (Extended Data Fig. 5b). We examined whether mutations from loss-of-function alleles could be disproportionately disrupting specific developmental transcription factor motifs. Indeed, motif enrichment analysis of k-mers centered on base pairs selected for mutagenesis showed that mutations from loss-of-function alleles were more likely to fall within binding sites for SOX, LHX, and DLX family members, among other developmental transcription factors (Extended Data Fig. 4b). In contrast, mutations from alleles with no loss in enhancer activity were enriched in different sequence motifs, including binding sites for the transcriptional repressor MSC (Extended Data Fig. 4b). Comparison of multiple 5% mutated alleles of the same enhancer did not reveal any difference in the total number of affected transcription factor motifs between alleles with or without observed changes in enhancer activity (Extended Data Fig. 4c). Finally, we examined whether alleles that retained enhancer activity had an enrichment of mutations in potentially redundant transcription factor motifs, i.e. motifs that appear more than once in the same enhancer. On average, 48% of transcription factor motifs appeared in each enhancer sequence only once, with the remainder appearing multiple times. The percentage of redundant motifs overlapping introduced mutations was not on average higher for alleles that retained enhancer activity, nor were unique motifs disproportionately mutated in alleles that lost enhancer activity (Extended Data Fig. 4d). Collectively, these results suggest that while some developmental transcription factor binding sites within ultraconserved enhancers are critical for enhancer function, many ultraconserved base pairs can be mutated with no apparent loss of enhancer activity.
Mutating Ultraconserved Bases Rarely Leads to Gain of Enhancer Function
An alternative hypothesis to explain the ultraconservation of enhancers is that these sites may be highly susceptible to gains of function, where mutations may result in enhancer activity in additional tissues or cell types11. Considering that many ultraconserved enhancers are enriched near developmentally expressed transcription factors1, which are often regulated by multiple seemingly redundant enhancers28, such misexpression may be more deleterious than loss-of-function mutations. To explore this possibility, we examined the 74 different mutant alleles for the 23 ultraconserved enhancers tested in this study for any enhancer activity that was not observed for the reference allele. Only 4 of the 74 mutation alleles showed gain of transgene activity in vivo (Fig. 3a). These gain-of-function activities fell into two categories: mutations in two ultraconserved enhancers (hs111 and hs260) led to ectopic activity in new tissues, whereas mutations in two other ultraconserved enhancers (hs327 and hs388) resulted in a more reproducible reporter staining in tissues with existing enhancer activity (Fig. 3b). These results indicate that gains of enhancer function due to mutations in ultraconserved sequences are generally possible and may contribute to the selective constraint on individual base pairs but are overall uncommon and, therefore, appear unlikely to be the main driver of ultraconservation.
Fig. 3. Gain-of-function is uncommon among mutated alleles of ultraconserved enhancers.
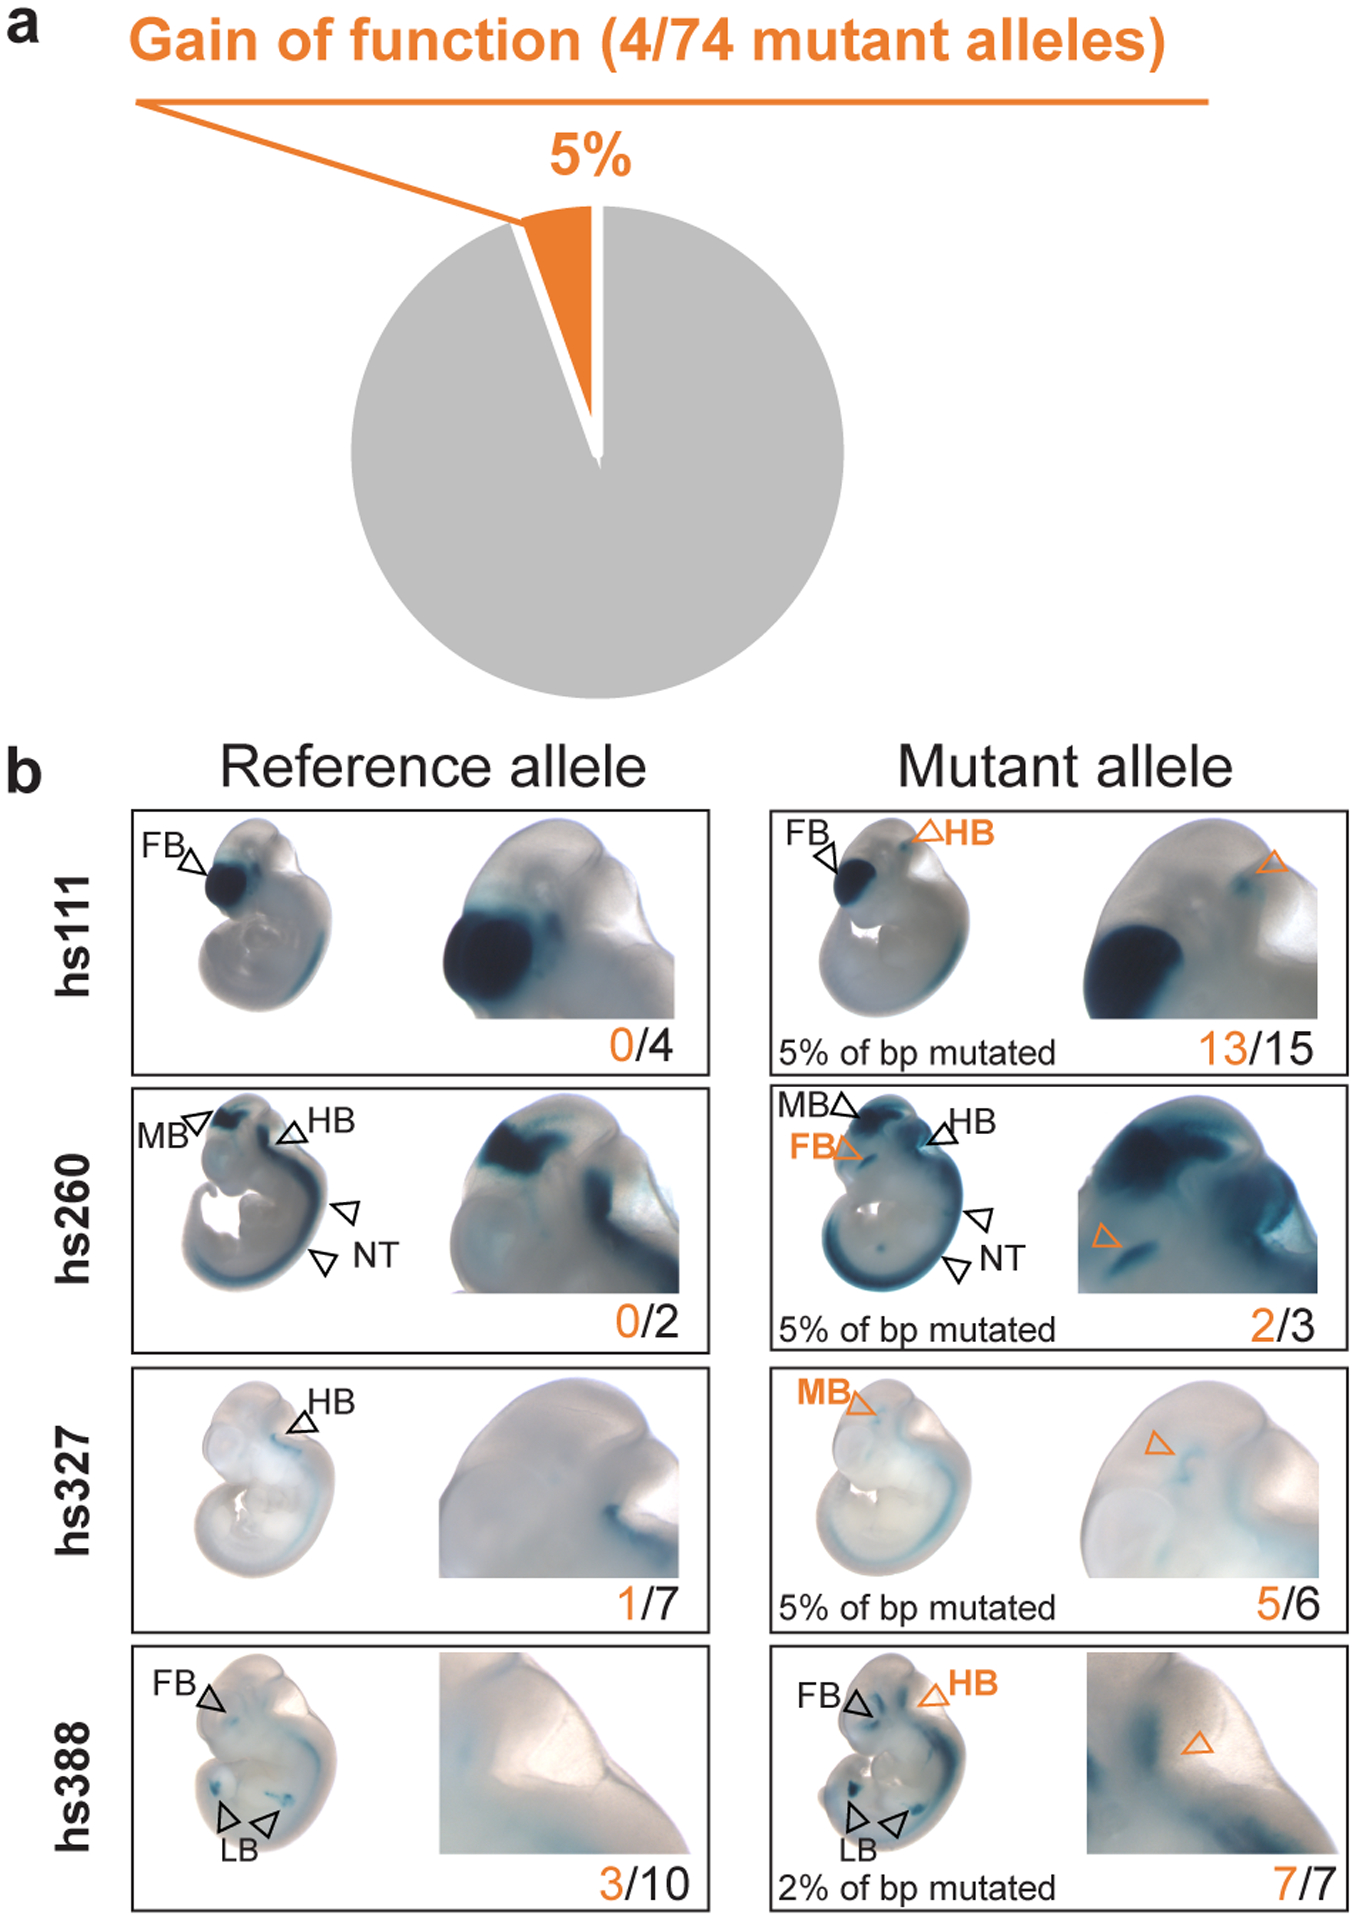
a, Proportion of gain-of-function alleles detected among all different mutant alleles of 23 ultraconserved enhancers. b, Images of representative transgenic embryos from four gain-of-function alleles resulting from ultraconserved enhancer mutagenesis. P values are provided in Supplementary Table 2. e11.5 embryos have a crown-rump length of 6 mm on average. FB – forebrain, MB – midbrain, HB – hindbrain, NT – neural tube.
Differential Impact on Enhancer Activity Across Multiple Development Stages
Many of the ultraconserved enhancers investigated in this study show tissue-specific enrichment in the enhancer activity-associated histone mark, H3K27ac, across multiple stages of mouse development, suggesting extended activity windows beyond e11.5 (Extended Data Fig. 5a). To assess if mutations not affecting the enhancer activity at e11.5 may instead alter activity at other developmental stages, we examined a subset of the reference and mutant alleles in transgenic reporter assays at a later embryonic stage. At e14.5, we re-tested the reference alleles for the ten enhancers in the dark green (no loss at 5%) category in Figure 2b and Extended Data Figure 3a. All 10 reference alleles, indeed, were active enhancers at e14.5 (Fig. 4). We then compared this activity to e14.5 results for the 5% mutated alleles that had retained enhancer activity at e11.5, with the exception of hs111, where the 20% mutated allele was tested (Fig. 4a). Five out of the nine 5% mutant alleles tested showed no loss of enhancer activity at e14.5 (Fig. 4b). Two alleles (hs266 and hs271) showed minor reductions in activity at e14.5 (Fig. 4b). Two alleles (hs200 and hs246) showed complete loss of activity in one structure (neural tube and forebrain, respectively), while retaining activity in other structures (forebrain and hindbrain/neural tube, respectively), indicating a pronounced stage- and tissue-specific difference in the impact of these mutations (Fig. 4b). Gain-of-function activities were restricted to a mutated allele of hs260, which caused gain of enhancer activity in the forebrain at e14.5, just like at e11.5, and showed additional ectopic activities in midbrain, hindbrain, and neural tube at e14.5 (Figs. 3b, 4b). The 20% mutated allele of hs111 recapitulated the reduced but not abolished activity observed at e11.5 (Figs. 2b, 4c). In summary, these results suggest that some mutations have differential effects on enhancer activity at different time points, revealing an additional source of possible sequence constraint. However, considering such changes were mild or absent in more than half (5/9) of the cases examined, despite the relatively high mutation rate of 5%, this effect appears unlikely to be the sole source of the extreme sequence constraint observed at ultraconserved enhancers. Importantly, these findings underscore the need to examine multiple developmental stages or contexts when considering the effects of mutations on the activity of enhancers.
Fig. 4. Mutagenesis of ultraconserved enhancers at a later stage of development recapitulates earlier results for a majority of tested enhancers but exposes susceptibility to mutations for some.
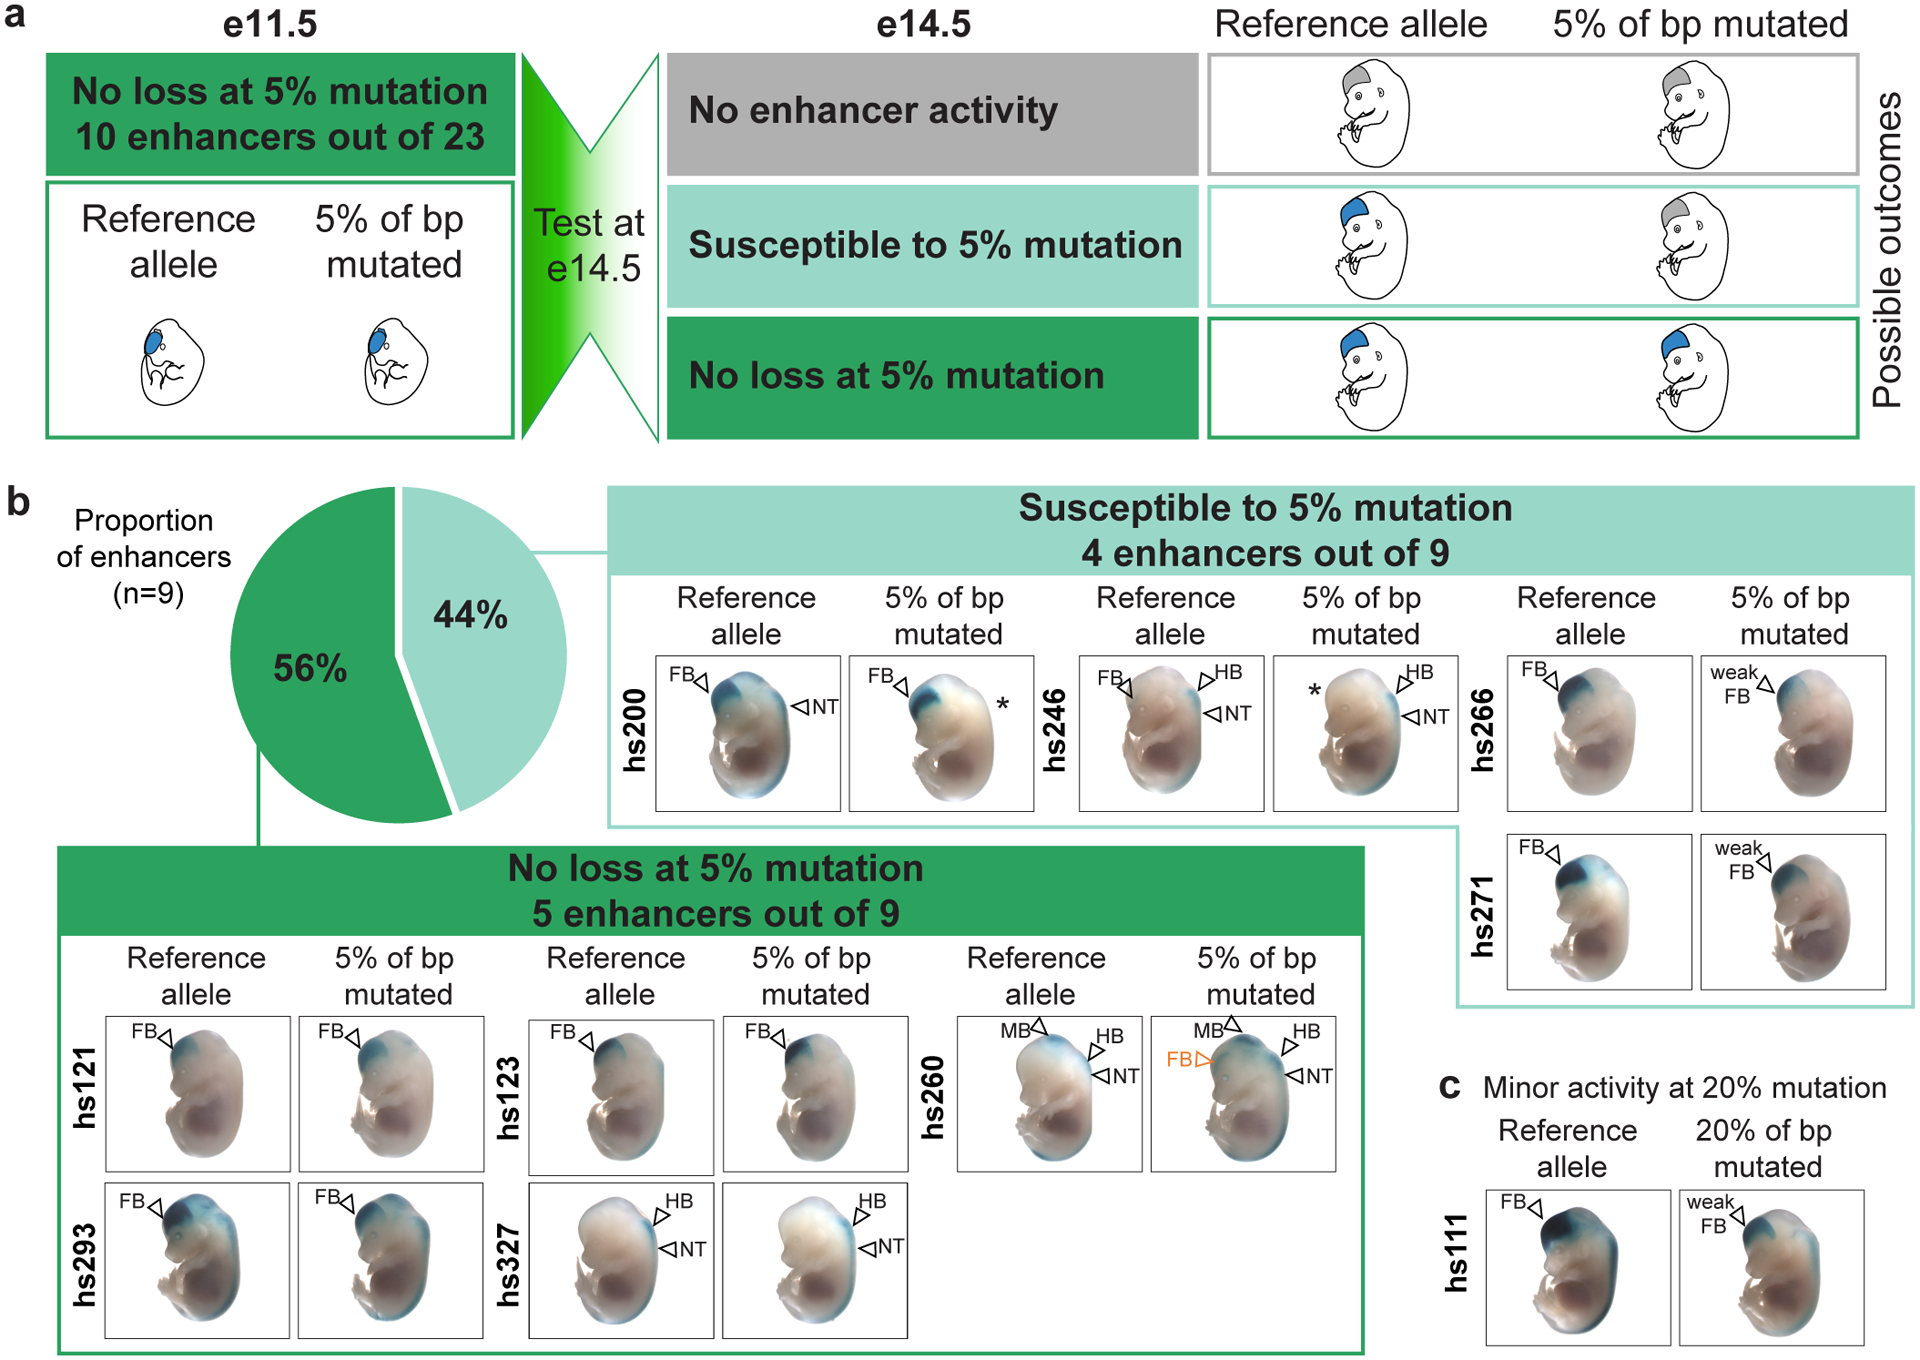
a, Schematic of experimental design to test ultraconserved enhancers shown to be robust to 5% mutagenesis at e11.5, at a later developmental stage of e14.5 and the possible functional outcomes. b, Transgenic assay results for nine ultraconserved enhancers at e14.5. See Supplementary Figure 1 for reproducibility of LacZ staining among individual transgenic embryos from each enhancer allele. * indicates a loss of LacZ staining in the mutant allele. c, Transgenic assays results for hs111 at e14.5. FB – forebrain, MB – midbrain, HB – hindbrain, NT – neural tube.
Robustness of Ultraconserved Enhancer Function in Native Genomic Context
Our results from transgenic reporter assays indicate that ultraconserved enhancers are overall remarkably robust to mutations but also identify multiple cases in which mutations caused a reduction or loss of enhancer activity. However, the transgenic assays were limited to 1–2 specific stages of embryonic development and tested each enhancer’s activity outside of its endogenous context. To assess whether activity changes observed in transgenic reporter assays correctly predict if ultraconserved enhancers are functionally robust or sensitive to mutations within their native genomic environment, we generated stable knock-in mouse lines for three different mutagenesis alleles of two ultraconserved enhancers (Figs. 5a, 6a, Extended Data Fig. 6). Both enhancers are located near and regulate the aristaless related homeobox (Arx) gene on chromosome X, and individual deletions of either of these enhancers were previously shown to cause phenotypic changes in the brain9. First, we replaced the mouse ortholog of enhancer hs122 with a 5% mutagenized allele that inactivated enhancer function in the transgenic reporter assay (Fig. 5b, Extended Data Fig. 7a). Arx RNA in situ hybridization on forebrain tissue sections from hemizygous knock-in male embryos revealed a reduction in Arx expression in the caudal dorsal forebrain compared to wild-type littermate controls (Extended Data Fig. 8a), which is similar to reductions observed for hs122-null embryos9. Also, as expected, brain sections from postnatal hemizygous knock-in males showed the same abnormalities to the hippocampus (in the dentate gyrus and the CA3) observed upon complete deletion of the enhancer, including a 20% length reduction and disorganized structure of the dentate gyrus relative to wild-type littermate controls (P = 0.02109 by two-tailed paired t-test, Fig. 5b, Extended Data Fig. 9).
Fig. 5. Mutagenesis of endogenous ultraconserved enhancer hs122 causes brain phenotypes.
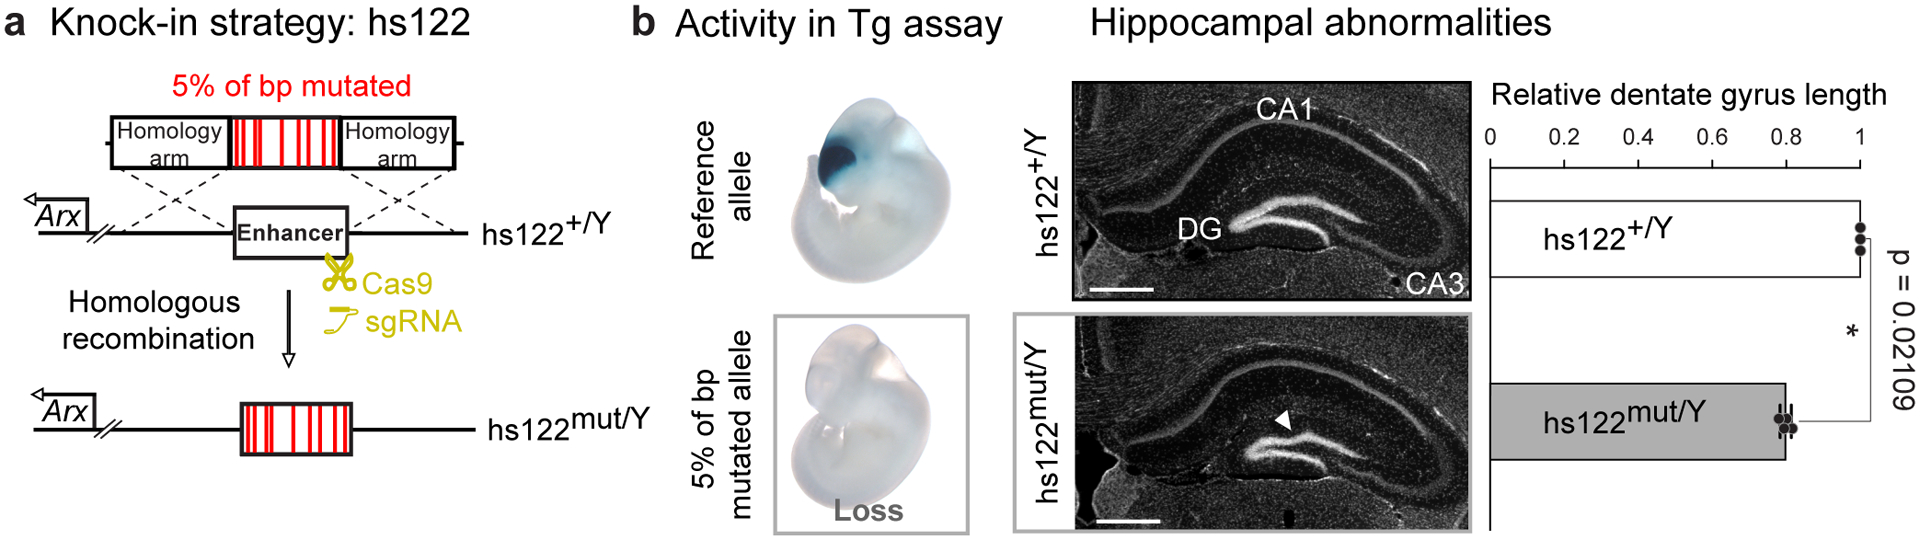
a, Schematic of the knock-in strategy used to replace the endogenous mouse allele of ultraconserved enhancer hs122 with an allele in which 5% of base pairs were mutated. b, Left: Transgenic assay results for hs122 reference and mutated enhancer alleles. Middle: Replacement of the endogenous mouse hs122 allele with a mutagenesis allele that inactivated enhancer activity in the transgenic assay results in a smaller dentate gyrus (DG) with disorganized appearance (white arrowhead). Left: Rostral coronal cross-sections of postnatal hippocampus from a wildtype male control (hs122+/Y) and a hemizygous mutant knock-in littermate (hs122mut/Y). CA1/3: Cornu Ammonis areas 1 and 3. Scale bars, 500 μm. Right: Dentate gyrus length for knock-in allele normalized to wild-type littermate controls. Bars indicate group means, with individual points showing biological replicates (n = 3 for wild-type, n = 4 for knock-in). Error bars, mean ± s.d. Two-tailed paired t-test. Images for all replicates in Extended Data Figure 9, and measurements in Supplementary Table 3.
Fig. 6. Mutagenesis of endogenous ultraconserved enhancer hs121 corroborates transgenic assay results.
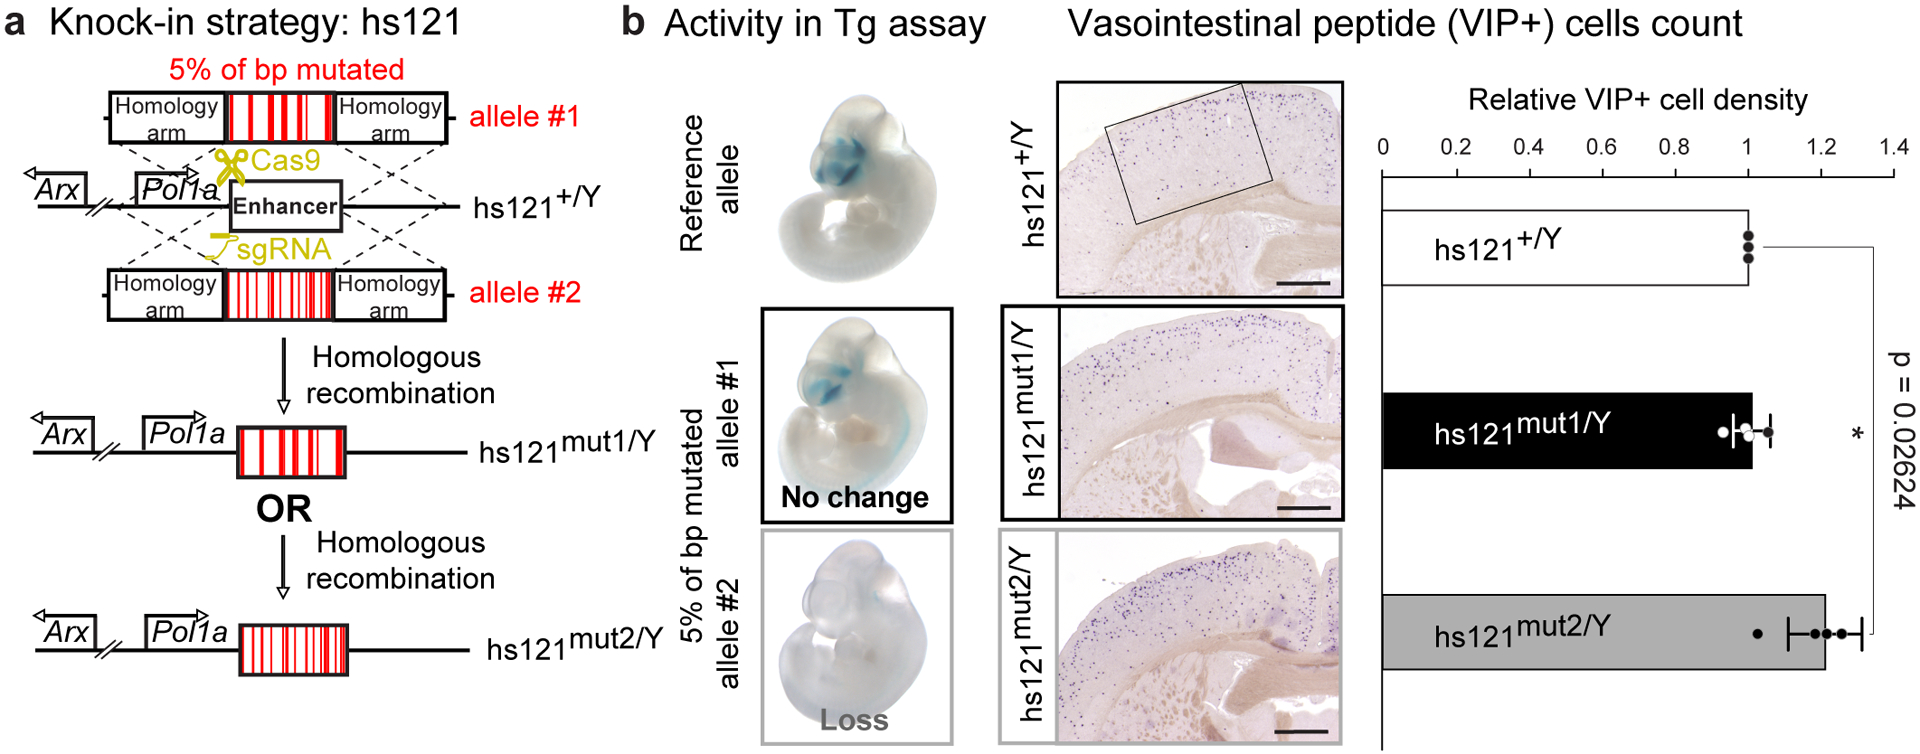
a, Schematic of the knock-in strategy used to replace the endogenous mouse allele of ultraconserved enhancer hs121 with alleles in which 5% of all base pairs were mutated. b, Left: Transgenic assay results for hs121 reference and mutated enhancer alleles. Middle: Mutagenesis of hs121 results in a higher density of vasointestinal peptide (VIP) positive cells in the brain only for mutations that abolished enhancer activity in the transgenic assay. Left: Coronal sections through the cortex of postnatal wild-type control (hs121+/Y) and hemizygous mutant knock-in males (hs121mut1/Y and hs121mut2/Y) labeled for VIP. The rectangle shown in the image of the hs121+/Y brain marks the area used to count the cells. Scale bars, 1 mm. Right: Density of VIP+ neurons (cells/mm2) for the two knock-in alleles normalized to wild-type littermate controls. Bars indicate group means, with individual points showing biological replicates (n = 3 for wild-type, n = 4 for knock-in). Error bars, mean ± s.d. Two-tailed paired t-test. Images for all replicates in Extended Data Figure 10, and measurements in Supplementary Table 4.
Next, we replaced ultraconserved enhancer hs121 with two different 5% mutagenized alleles: hs121mut1, which showed normal enhancer activity in transgenic assays, or hs121mut2, which was inactive (Fig. 6b, Extended Data Fig. 7b). To determine the phenotypic impact of these alleles, we assessed the density of vasointestinal peptide (VIP+) interneurons in the cortex of postnatal mice, since deletion of hs121 is known to cause an increased density of these neurons9. Replacing the endogenous mouse hs121 enhancer with hs121mut1 did not result in any changes to VIP+ neuron density (P = 0.8621 by two-tailed paired t-test, Fig. 6b, Extended Data Fig. 10). In contrast, replacement with hs121mut2 caused increased density of VIP+ interneurons compared to wild-type littermates (21% increase, P = 0.02624 by two-tailed paired t-test, Fig. 6b, Extended Data Fig. 10).
These observations highlight the concordance of enhancer activity in transgenic reporter assays with the phenotypic consequences of mutating ultraconserved enhancers at their endogenous loci. Results for the two inactive alleles confirm that mutations in ultraconserved enhancers can cause deleterious phenotypes. However, the absence of brain phenotypes with one mutant allele (mut1) of hs121 provide further support for the notion that the regulatory activities of some ultraconserved enhancers are surprisingly robust to sequence changes. The absence of a brain phenotype in adult mice with this mutated allele introduced into the endogenous hs121 sequence suggests that this allele remained functional throughout developmental time points that we did not test in our transgenic assays, underscoring that the developmental timing of enhancer activity is not the sole explanation of ultraconservation.
Discussion
We performed a detailed assessment of how mutations in ultraconserved enhancers affect their respective regulatory activities, taking advantage of a targeted transgene knock-in approach24 with high sensitivity for detecting activity changes in vivo. While the perfect sequence conservation of ultraconserved enhancers may suggest that most or all of their base pairs are required for normal enhancer function, we observed that most ultraconserved enhancers we tested (83%) at e11.5 were functionally robust to some level of mutagenesis, and nearly half showed no loss of activity even upon mutation of 5% of ultraconserved base pairs. Likewise, mutations rarely resulted in new enhancer activities in other tissues, suggesting that deleterious gain-of-function effects do not explain the conservation of most ultraconserved base pairs. Additional transgenic assays for 9 ultraconserved enhancers and their mutated alleles at a later developmental stage (e14.5) confirmed robustness to mutagenesis for the majority (56%) of tested elements. These results relied on a CRISPR-assisted site-specific mouse transgenic reporter assay that minimizes ectopic reporter expression and results in far lower variability between independent replicate embryos with the same enhancer-reporter construct24. For example, across all 121 transgenic experiments (distinct allele and developmental stage combinations) reported herein, 64 resulted in all replicate embryos having identical enhancer activity patterns (Supplementary Fig. 1). Additionally, all five expert annotators who carried out blinded and independent scoring of embryos unanimously agreed on annotations for 75% of all 690 embryos scored for this study. This increased consistency allows for the identification of altered enhancer activity with smaller sample sizes than traditional random transgenesis assays (e.g., compare results to refs. 29 and 30)29,30. As the data herein show, the site-directed transgenic assay is a powerful technique to identify both quantitative and spatial changes in in vivo enhancer activity at a scale of a whole organism. However, we cannot exclude that introduced mutations had subtle effects on enhancer activity below the threshold of detection of the assay.
Because of the inherent limitations of transgenic assays, we also used a knock-in approach to investigate whether mutations had similar effects on ultraconserved enhancer activities in their endogenous positions and to examine their phenotypic consequences beyond gene expression. Mutations that eliminate the activity of the ultraconserved brain enhancers in the transgenic reporter assay indeed caused phenotypes recapitulating those produced by deleting the respective enhancers. At the same time, mutations that did not affect an ultraconserved enhancer’s activity in the transgenic assay also failed to elicit an abnormal brain phenotype in stable knock-in animals, thus confirming the robustness of that ultraconserved enhancer to mutagenesis in its native genomic context. Together, these results show that while sequence changes in ultraconserved enhancers can affect their regulatory activities and cause organismal phenotypes, the majority of tested ultraconserved enhancers can still activate gene expression upon mutagenesis.
It has been suggested that the unusually high degree of evolutionary constraint on ultraconserved elements may result from the involvement of nearly all their base pairs in DNA-protein interactions17 or multiple overlapping constraints (e.g., transcription factor binding sites overlapping with RNA structural constraints)16. Supporting this, cell culture experiments indicate that transcription factors and chromatin remodelers densely occupy ultraconserved elements31. The overall robustness of ultraconserved enhancers to mutagenesis in the present study shows that while such interactions may occur, not all are required for normal enhancer function. Therefore, this model alone does not provide a direct explanation for the extreme conservation of noncoding ultraconserved sequences. While it is plausible to assume that molecular functions in addition to the known developmental enhancer activities may be associated with noncoding ultraconserved sequences, their exact nature remains elusive since experimental evidence demonstrating such functions (e.g., in three-dimensional genome organization) is limited to few anecdotal examples17,32. While such a role of ultraconserved sequences is in principle conceivable, the absence of binding by the chromatin architectural protein CTCF in most of the ultraconserved noncoding sequences tested in this study suggests that a role in genome organization is not a likely explanation for their extreme conservation (Extended Data Fig. 5c). Since our study primarily relied on techniques to assess the role of ultraconserved sequences in gene expression activation we cannot exclude effects of mutagenesis on non-enhancer functions. We also cannot exclude that mutations may affect the activities of the tested enhancers at other developmental time points or in tissues and cell types not investigated in our reporter and knock-in assays (Extended Data Fig. 5a). While this is possible, the apparent absence of a phenotype from the knock-in of one mutated allele of hs121, which also did not alter reporter gene expression in transgenic assays at e11.5 and e14.5, suggests that this enhancer’s activity was unaffected at other, unexamined, developmental time points. In summary, our results indicate that the known embryonic enhancer activities of ultraconserved sequences do not show an abnormally high sensitivity to sequence changes. This suggests that either mutations in ultraconserved enhancers result in very subtle but still selectively disadvantageous effects on gene expression or additional yet-to-be-identified regulatory or non-regulatory functions of these sequences contribute to their extreme conservation in evolution.
Methods
Selection of Ultraconserved Enhancers for the Mutagenesis
A list of human-rodent ultraconserved sequences that show in vivo enhancer activity during development was compiled from previous publications7,8. From this list, we selected 23 ultraconserved enhancers that showed highly reproducible activity in mouse transgenic enhancer-reporter assays at the e11.5 or e12.5 developmental time point. Enhancer names (hs numbers) used are the unique identifiers from the VISTA Enhancer Browser (www.enhancer.lbl.gov). The coordinates of ultraconserved enhancers from Visel et al., 20088 were converted from hg17 to the hg19 (human) genome assembly using liftOver26.
Design of Mutations to Introduce into Ultraconserved Enhancers
We mutated ultraconserved enhancers at various levels, changing 2%, 5%, or 20% of their base pairs. To select which base pairs to mutate we first looked beyond human and rodent genome conservation to prioritize the nucleotides with the highest conservation across 100 vertebrates using phyloP scores33 (phyloP100way) from the USCS genome browser25 (http://hgdownload.cse.ucsc.edu/goldenpath/hg19/phyloP100way/). Then we prioritized nucleotides that fall within predicted conserved transcription factor motifs (HMR Conserved Transcription Factor Binding Sites Track on the UCSC Genome Browser)26. Finally, we tried to evenly distribute mutations across the ultraconserved portion of the enhancers. In principle, this prioritization strategy should introduce mutations that have the highest chance of affecting the enhancer function. Extended Data Figure 1 shows the locations of mutated base pairs for selected ultraconserved enhancers. Supplementary Table 1 contains the coordinates of 23 ultraconserved enhancers used in this study and FASTA-formatted sequences for the ultraconserved portions of all generated reference and mutant alleles.
Generation of Transgenic Embryos
All animal work done in this study was reviewed and approved by the Lawrence Berkeley National Laboratory Animal Welfare and Research Committee. Mice were housed in the animal facility, where their conditions were electronically monitored 24 h/7 days with daily visual checks by technicians. Facility was also equipped with automatic alarms. Mice were housed in BioBubble Clean Rooms, soft-walled enclosures powered by 80–100 air changes per hour of HEPA filtration under Light/Dark Cycle of 12:12 starting at 6 am, at 22–24.4°C, and humidity 30–70%.
Human reference and mutant alleles for all 23 ultraconserved enhancers were tested with site-directed transgenic mouse assays using a minimal promoter of Shh and a lacZ reporter gene24. Reference alleles had previously been tested for enhancer activity using random transgenic methods and these results are reported elsewhere7,8. However, to allow for direct allelic comparisons we newly performed site-directed transgenic experiments for all reference and mutant alleles as part of this study. Reference alleles were PCR amplified (primers in Supplementary Table 5) from human genomic DNA. Mutant alleles were assembled from PCR fragments flanking ultraconserved regions and gBlock DNA Fragments (IDT) containing the designed mutations in the ultraconserved sequences. Reference and mutant alleles were cloned into a LacZ reporter vector via Gibson cloning34 (New England Biolabs). In the final transgenic vectors, Enhancer-Promoter-Reporter sequence is flanked by homology arms for the site-specific integration of the transgene into the H11 locus in the mouse genome24. Site-specific integration dramatically improves transgenic efficiency and nearly eliminates ectopic LacZ staining associated with random transgene integration, allowing for better comparisons between enhancer alleles. Sequences of all constructs were confirmed with Sanger sequencing. Transgenic mice were generated using the Mus musculus FVB strain via a CRISPR/Cas9 microinjection protocol, as described previously24. Briefly, Cas9 protein (Integrated DNA Technologies Cat. No. 1081058) at a final concentration of 20 ng/μl was mixed with sgRNA targeting the H11 locus (50 ng/μl) and transgenic vector (25 ng/μl) in microinjection buffer (10 mM Tris, pH 7.5; 0.1 mM EDTA). The mix was injected into the pronuclei of fertilized FVB embryos, obtained from the oviducts of super-ovulated 7–8 weeks old FVB females mated to FVB stud males. The injected embryos were then cultured in M16 medium supplemented with amino acids at 37°C under 5% CO2 for ~2 hours. The embryos were subsequently transferred into the uteri of pseudo-pregnant CD-1 surrogate mothers. F0 embryos were collected for staining at e11.5 (e12.5 for the hs124 enhancer), with 10 enhancers additionally tested at e14.5. LacZ staining was performed as previously described35. Briefly, embryos were washed in cold 1× PBS 3 times for ~5 minutes each, followed by fixation with 4% paraformaldehyde (PFA) while tumbling for 30 minutes at room temperature. The embryos were washed in Embryo Wash Buffer (2 mM magnesium chloride [Ambion AM9530], 0.02% NP-40 substitute [Fluka 74385], 0.01% Deoxycholate [Sigma Aldrich D6750] diluted in 0.1 M Phosphate buffer pH 7.3) 3 times for 30 minutes each at room temperature and transferred into freshly-made X-gal staining solution (4 mM potassium ferricyanide [Sigma Aldrich P3667], 4 mM potassium ferrocyanide [Sigma Aldrich P9387], 20 mM Tris pH 7.5 [Invitrogen 15567027], 1 mg/ml X-gal [Sigma Aldrich B4252]) to incubate overnight while tumbling at room temperature. The next day, embryos were washed with 1× PBS 3 times for at least 30 minutes each and stored in 4% PFA at 4°C. The embryo sample sizes were determined empirically based on our experience performing >4,000 transgenic enhancer assays (VISTA Enhancer Browser: https://enhancer.lbl.gov/). The embryos were genotyped as previously described24, and those negative for transgene integration into the H11 locus were excluded from further analysis, along with embryos that were not at the correct developmental stage. On average, we obtained 5 correctly targeted transgenic embryos per tested allele (range: 2–16). The number of embryos for each allele is reported in Supplementary Table 1, and images of all embryos included in the study are shown in Supplementary Figure 1.
Scoring the Strength of Ultraconserved Enhancer Activity in Transgenic Embryos
We used the spatial pattern and intensity of LacZ staining in an embryo as a proxy for enhancer activity. A schematic of the scoring protocol is shown in Extended Data Figure 2, and the scoring results for all embryos and enhancers are included in Supplementary Figure 1. The embryos were imaged with a Leica MZ16 microscope and a Leica DFC420 digital camera using consistent lighting conditions. Reference and mutant alleles of the same enhancer were imaged on the same day. First, for each of the 23 tested ultraconserved enhancers we selected representative embryo images as examples of enhancer activity levels: strong, weak, or absent. For cases of gain of enhancer function, we classified enhancer activity as present or absent. To score the enhancer activity, we then aggregated embryo images from the reference and all tested mutant alleles for one enhancer together (16–45 embryo images per enhancer locus). Five reviewers, who were blinded to the genotype of the enhancer alleles, were first shown the example images of the different enhancer activity levels. The reviewers were then shown all of the randomized embryo images for that enhancer one-by-one for scoring. The reviewers independently recorded their score for each embryo image as strong, weak or absent; and present or absent in gain of function cases. The strength of enhancer activity in each transgenic embryo was annotated based on majority rule among the five reviewers.
Generation of Enhancer Knock-in Mice
We introduced mutations into the endogenous mouse orthologs of the hs122 and hs121 enhancers, changing 5% of ultraconserved base pairs at a time. The mutant enhancer alleles were knocked-in via homologous recombination to replace the reference allele. sgRNAs targeting the endogenous hs122 enhancer (5’-TAACCACTAAGCTAATAAGT[AGG]-3’, with AGG as the PAM sequence) and the hs121 enhancer (5’-AGGGGACTCGGGTTAAATGC[TGG]-3’, with TGG as the PAM sequence) were designed with CHOPCHOP36 and ordered from IDT as Alt-R CRISPR-Cas9 crRNAs. To generate homologous recombination templates, we synthesized gBlock DNA Fragments (IDT) containing the mutated ultraconserved sequences of either hs122 (one mutant allele with 5% of bp mutated) or hs121 (two mutant alleles with 5% of bp mutated each). Flanking mouse sequences (~2 kb) were amplified from mouse genomic DNA to create homology arms for site-specific integration, cloning primers are listed in Supplementary Table 6. For each enhancer mutant allele, gBlock DNA Fragments and amplified homology arms were cloned together into the pCR4-TOPO backbone (Thermo Fisher Scientific) via Gibson (New England Biolabs) cloning34. The hs122 sgRNA overlaps 7-bp changes in the hs122 mutant allele, avoiding the need to further mutagenize the sgRNA target site in the homologous recombination repair template. The hs121 sgRNA is located 115 bp away from the ultraconserved sequence; we mutated its PAM sequence (TGG>TAG) in the two repair templates carrying the mutated alleles of the hs121 enhancer in order to avoid their cleavage by CRISPR/Cas9. Knock-in mice were generated via the CRISPR/Cas9 microinjection protocol described above. Founder (F0) pups were checked for correctly targeted knock-in alleles with PCR amplification of overlapping fragments spanning the entire homologous recombination region starting from the flanking genomic DNA on the 5’ and 3’ sides, as schematically represented in Extended Data Figure 4. This was followed by Sanger sequencing. Genotyping primers are provided in Supplementary Table 6. F0s were also tested for the absence of the vector backbone. Multiple founders with a precise recombination of the mutated enhancer sequence into the endogenous hs122 and hs121 loci were obtained (Supplementary Table 7). The knock-in lines were expanded and maintained by outcrossing mutation carriers with wild-type FVB animals to minimize the likelihood of a line harboring an off-target mutation.
Sample Selection for Phenotyping of the hs122 Mutated Enhancer Knock-in Line
The hs122 and hs121 enhancers and their target gene, Arx, reside on the X chromosome, so phenotyping was performed exclusively on male mice. Male mice missing the hs122 enhancer entirely display defects to the hippocampus, while male mice hemizygous for the hs121 enhancer deletion show abnormalities in neuronal cell populations9. Therefore, we performed the same neurological phenotyping as was done in that previous study. All mice used for phenotyping were F1 generation, derived from crossing female F0 knock-in founders to wild-type FVB males. Knock-in males were phenotyped using wild-type male littermates as controls. Details on all phenotyped animals are provided in Supplementary Tables 3 and 4.
Brain Sectioning
Mice were anesthetized with intraperitoneal pentobartibal injection (1 μl of 50 μg/μl solution diluted in saline per 1 g of an animal’s weight) and perfused transcardially with 1× PBS, followed by 4% paraformaldehyde (PFA). Whole brains were isolated and further fixed with 4% PFA for 4–5 hours. Brains were cryosectioned in 30% sucrose (diluted in 1× PBS) and cut frozen coronally on a freezing sliding microtome at 40 μm. Brain sections were stained with DAPI for hippocampal measurements.
In Situ Hybridization (ISH)
Section ISH was performed as previously described9 using RNase-free reagents and solutions. Briefly, the brain tissue sections from matching littermate control and knock-in animals were mounted on a single slide and air-dried. The sections were then rinsed in 1× PBS, steamed in 10 mM sodium citrate (pH 6), washed in 1× PBS, and acetylated for 10 minutes (1.3% Triethanolamine, 0.06% hydrogen chloride, 0.38% acetic anhydride). The sections were prehybridized for 1 hour at 65°C (in a solution of 50% formamide, 50 μg/ml heparin, 50 μg/ml yeast tRNA, 5× SSC and 1% SDS), followed by hybridization with DIG-labeled riboprobe overnight at 65°C. The vasointestinal peptide (VIP) probe was designed against exons 2–6, linearized with HindIII and transcribed with a DIG labeling mix using the T7 polymerase (Roche). The Arx probe was designed against exon 5 and 6 (chrX:9054137–90543401 in mm9), linearized with PstI, and transcribed with a DIG labeling mix using the T3 polymerase (Roche). Probes were purified using an RNA clean and concentrator kit (Zymo Research). The next day, sections were first washed in 5× SSC (pH 4.5) for 5 minutes at room temperature, and then twice in 0.2× SSC at 72°C for 30 minutes. After a 5 minute-wash in NTT (0.15 M sodium chloride, 0.1 M Tris pH 8, 0.1% Tween), the sections were blocked in 5% heat-inactivated sheep serum in 2% blocking reagent in NTT for 1 hour at room temperature. Sections were then incubated overnight in anti-Digoxigenin-AP antibody. The next day, following three washes in NTTML (0.15 M sodium chloride, 0.1 M Tris pH 9.5, 0.1% Tween, 50 mM MgCl2, 2 mM Levamisole), the signal was revealed using BM purple at 37°C overnight. Finally, the sections were coverslipped and imaged.
Brain Section Image Acquisition and Analysis
Brightfield images were acquired with a Coolsnap camera (Photometrics) mounted on a microscope (Nikon Eclipse 80i) using Nikon NIS Elements acquisition software, version 3.22.15 (Build 738). Image brightness and contrast were adjusted, and images were merged using Adobe Photoshop.
Hippocampal Measurements
Dentate gyrus length was measured using ImageJ software37 by tracing the total lengths of the superior and inferior blades of the gyrus on serial sections of the left and right hippocampi following the appearance of the superior limb of the dentate gyrus. Measurements were taken blinded to each animal’s genotype. Dentate gyrus lengths obtained from hs122 enhancer knock-in mice were normalized to wild-type littermate controls for reporting in Figure 4. Raw measurements are reported in Supplementary Table 3 and plotted in Extended Data Figure 9.
Cell counting
To assess vasointestinal peptide (VIP+) cell density in the postnatal neocortex on brain sections, 8× brightfield images were taken of the somatosensory cortex at the level of the fornix. Images were opened in Adobe Photoshop and boxes of proportional dimensions encompassing all layers of the cortex were drawn for three serial sections from each animal. Images were then opened with ImageJ, and Cell Counter was used to count all cells within the determined box. Cells counts were divided by the ROI area to determine cell density. Measurements were performed blinded to each animal’s genotype. Cell density counts obtained for hs121 enhancer knock-in mice were normalized to wild-type littermates for reporting in Figure 5. Raw measurements are reported in Supplementary Table 4 and plotted in Extended Data Figure 10.
Motif enrichment analysis
First, the coordinates of 370 nonexonic ultraconserved sequences (type ‘p’ and ‘n’)1 were lifted over26 to hg19. HOMER38 findMotifsGenome.pl script was used to find transcription factor motifs enriched in these sequences with the parameter: -size given (Extended Data Fig. 4a). Next, the coordinates of 16-bp windows centered around the coordinates of mutations introduced into 23 ultraconserved enhancers in this study were used in HOMER findMotifsGenome.pl script to determine the motifs enriched in sequences overlapping mutations (Extended Data Fig. 4b). Mutations were split into those that led to decrease/loss of enhancer activity and those that did not. Finally, to directly compare the mutations introduced into the same enhancer with different outcomes to enhancer activity, bedtools (v2.27.1) intersect was used to overlap JASPAR39 transcription factor motifs (score ≥400) with mutations in 8 enhancers that had mutant alleles with 5% of base pairs changed for which one allele led to decrease/loss of this enhancer activity, while the other did not (Extended Data Fig. 4c).
Statistics and Data Processing
Statistical analyses and plot generation were done with R version 3.5.0 (www.r-project.org). For transgenic assay results to classify an enhancer allele as impacted by mutation, we determined if differences in enhancer activity levels between reference and mutant alleles were statistically significant (two-tailed Fisher’s exact test, P value < 0.05). The test compared the number of embryos classified as strong, weak or absent for each allele. Number of embryos tested and P values from Fisher’s exact tests are reported in Supplementary Tables 1 and 2. To determine statistical differences in hippocampal measurement for hs122 and cell counts for hs121 enhancer knock-in mouse lines two-tailed t-tests were performed between littermate controls paired by age/processing batch to account for potential differences in ISH. Characteristics of phenotyped mice and raw measurements are reported in Supplementary Table 3 and 4 and plotted in Extended Data Figures 9 and 10. Number of animals and P values are reported in legends of Figures 5b and 6b.
Materials availability
The cloning vector for the transgenic assay (PCR4-Shh::lacZ-H11) is available from Addgene (#139098). All other vectors described here are available from the authors upon request. Transgenic embryos and stable knock-in lines can also be made available upon request.
Data Availability
Images of all transgenic whole-mount-stained embryos are included in Supplementary Figure 1. Images of brains sections from knock-in animals and wild-type littermates are in Extended Data Figures 8, 9, and 10. Human SNVs were obtained from TOPMed, https://bravo.sph.umich.edu/freeze5/hg38/ in June 2020. JASPAR transcription factor motif data were downloaded from http://expdata.cmmt.ubc.ca/JASPAR/downloads/UCSC_tracks/2018/hg19/. Public ChIP-seq data were obtained from https://www.encodeproject.org (mouse embryonic H3K27ac and H3K27me3, mouse and human CTCF) and https://www.ncbi.nlm.nih.gov/geo/query/acc.cgi?acc=GSE124936 (DLX transcription factors).
Extended Data
Extended Data Fig. 1. Characterization of base pairs selected for mutagenesis.
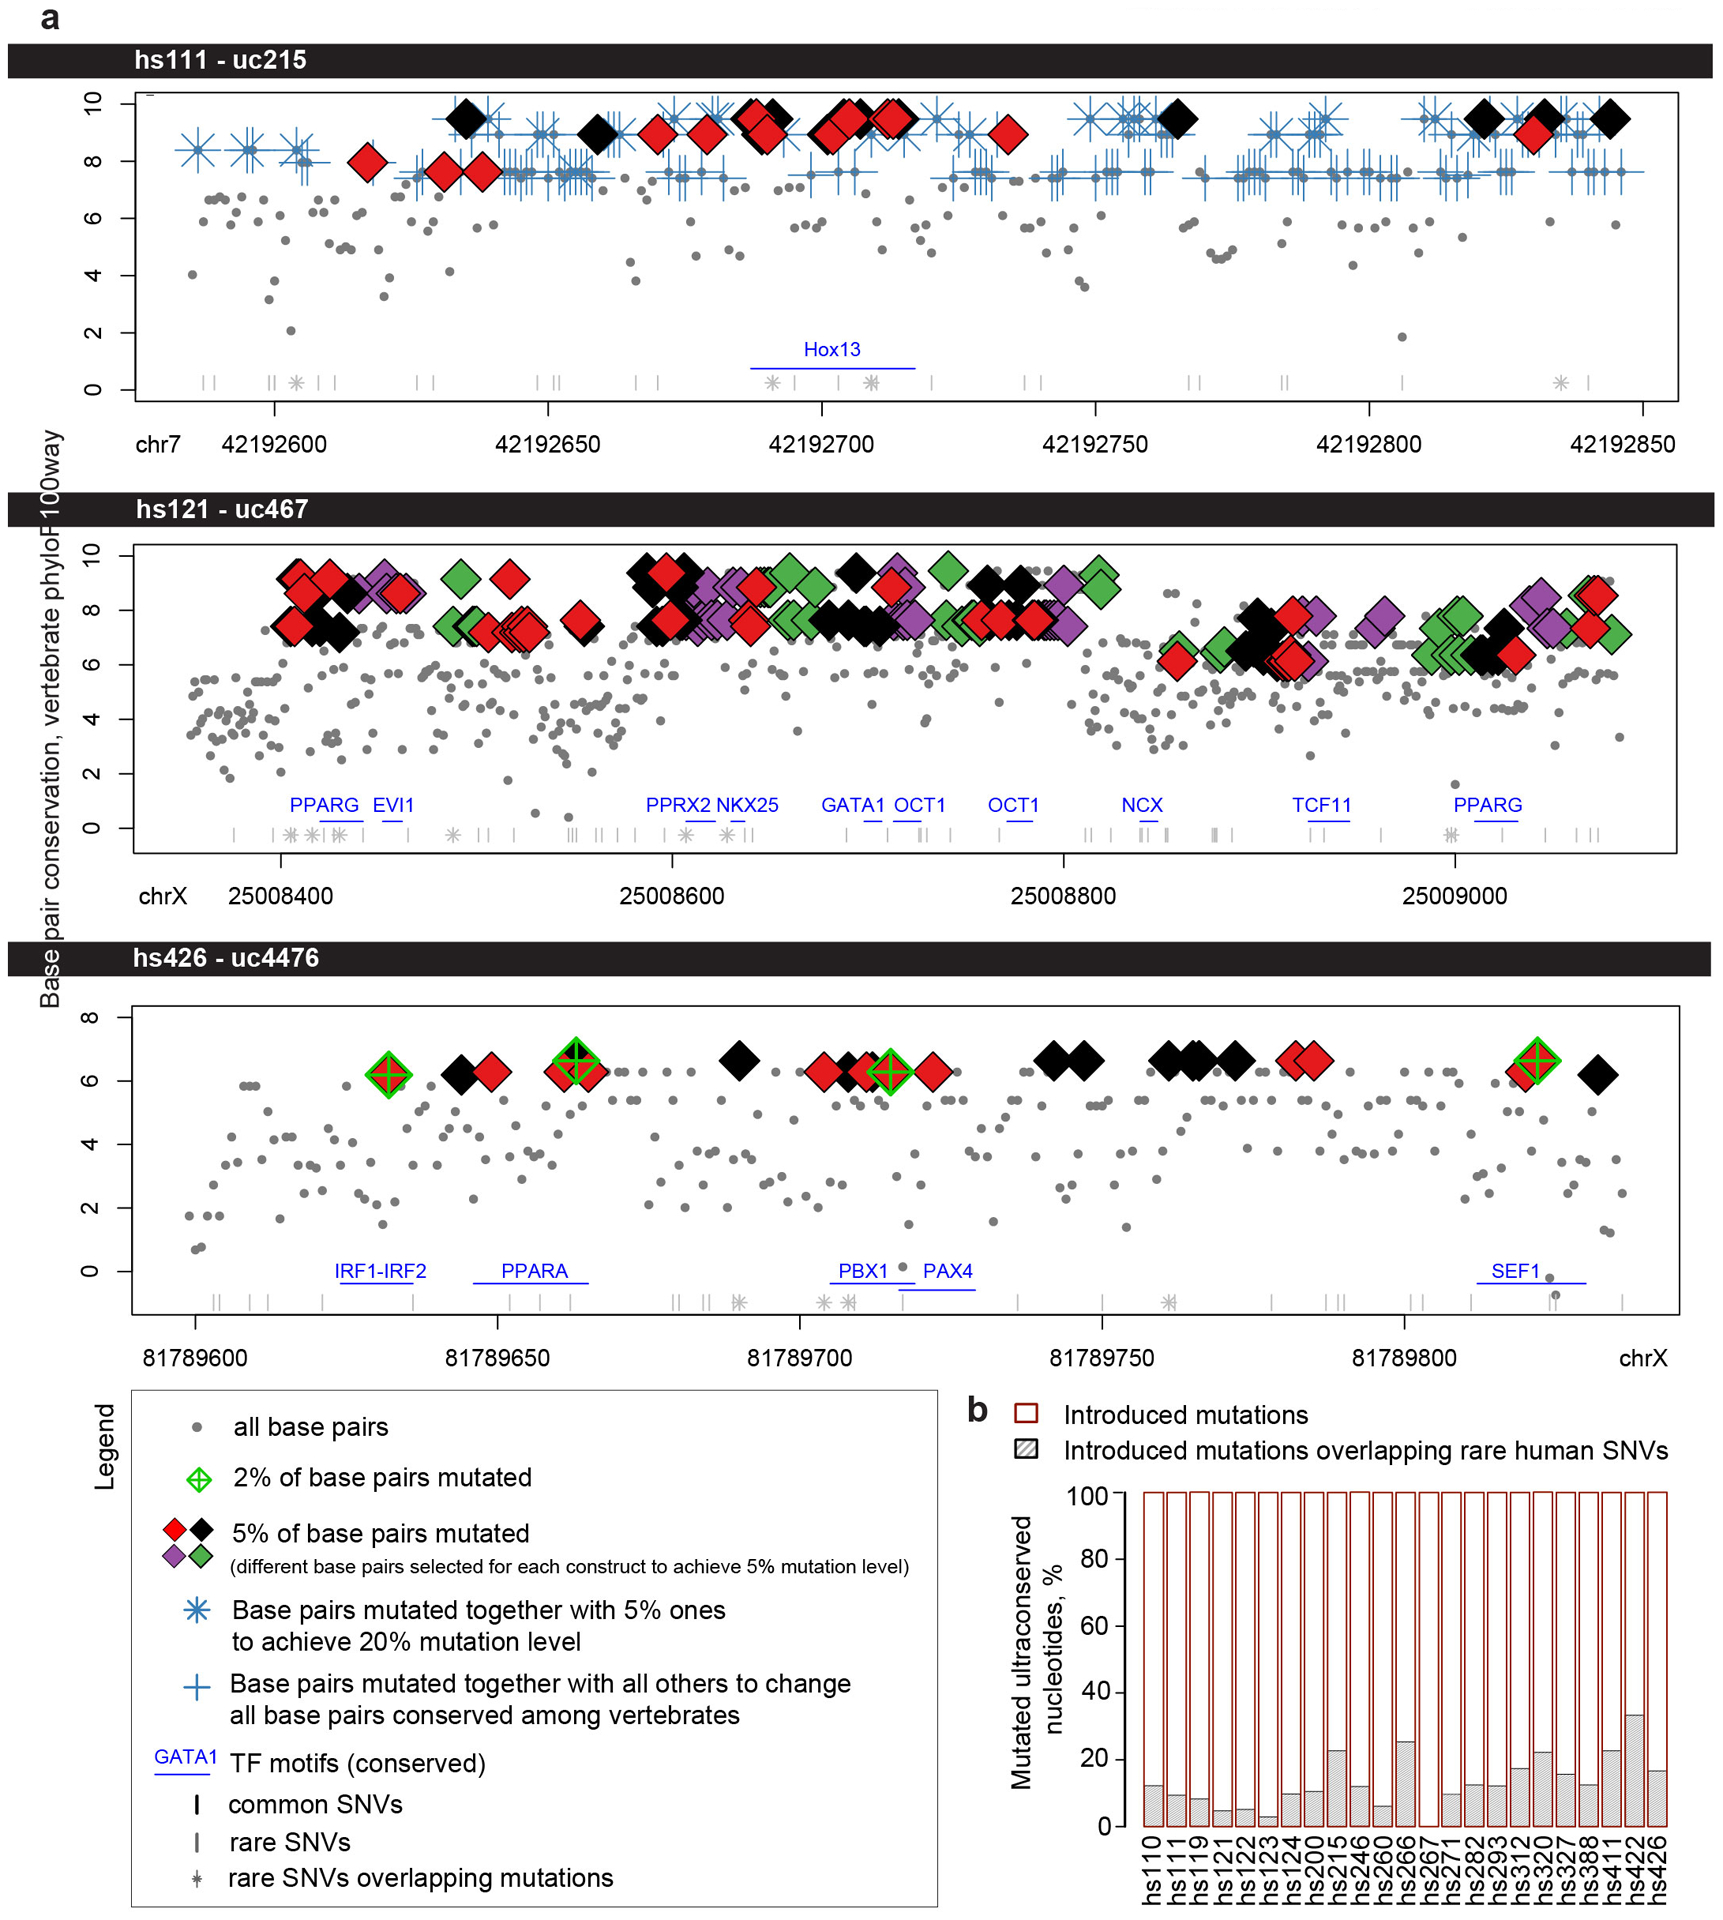
a, Detailed breakdown of conservation (phylop100way score) and position of base pair mutations for selected examples of ultraconserved enhancers mutated in this study. Base pairs selected to achieve various levels of mutagenesis: 2%, 5%, 20%, or all base pairs conserved among ~100 vertebrates are marked according to the legend. All coordinates are in hg19. Locations of conserved transcription factor motifs26 and human SNVs (TOPMed, https://bravo.sph.umich.edu/freeze5/hg38/) are also included (see legend). See Supplementary Information for similar plots of all 23 ultraconserved enhancers selected for mutagenesis. b, Percentage of mutations introduced into ultraconserved sequences that also overlapped human SNVs (all overlap rare human variants, i.e. found in <1% of human population. No introduced mutations overlap a SNV common in the human population).
Extended Data Fig. 2. Example of enhancer scoring.
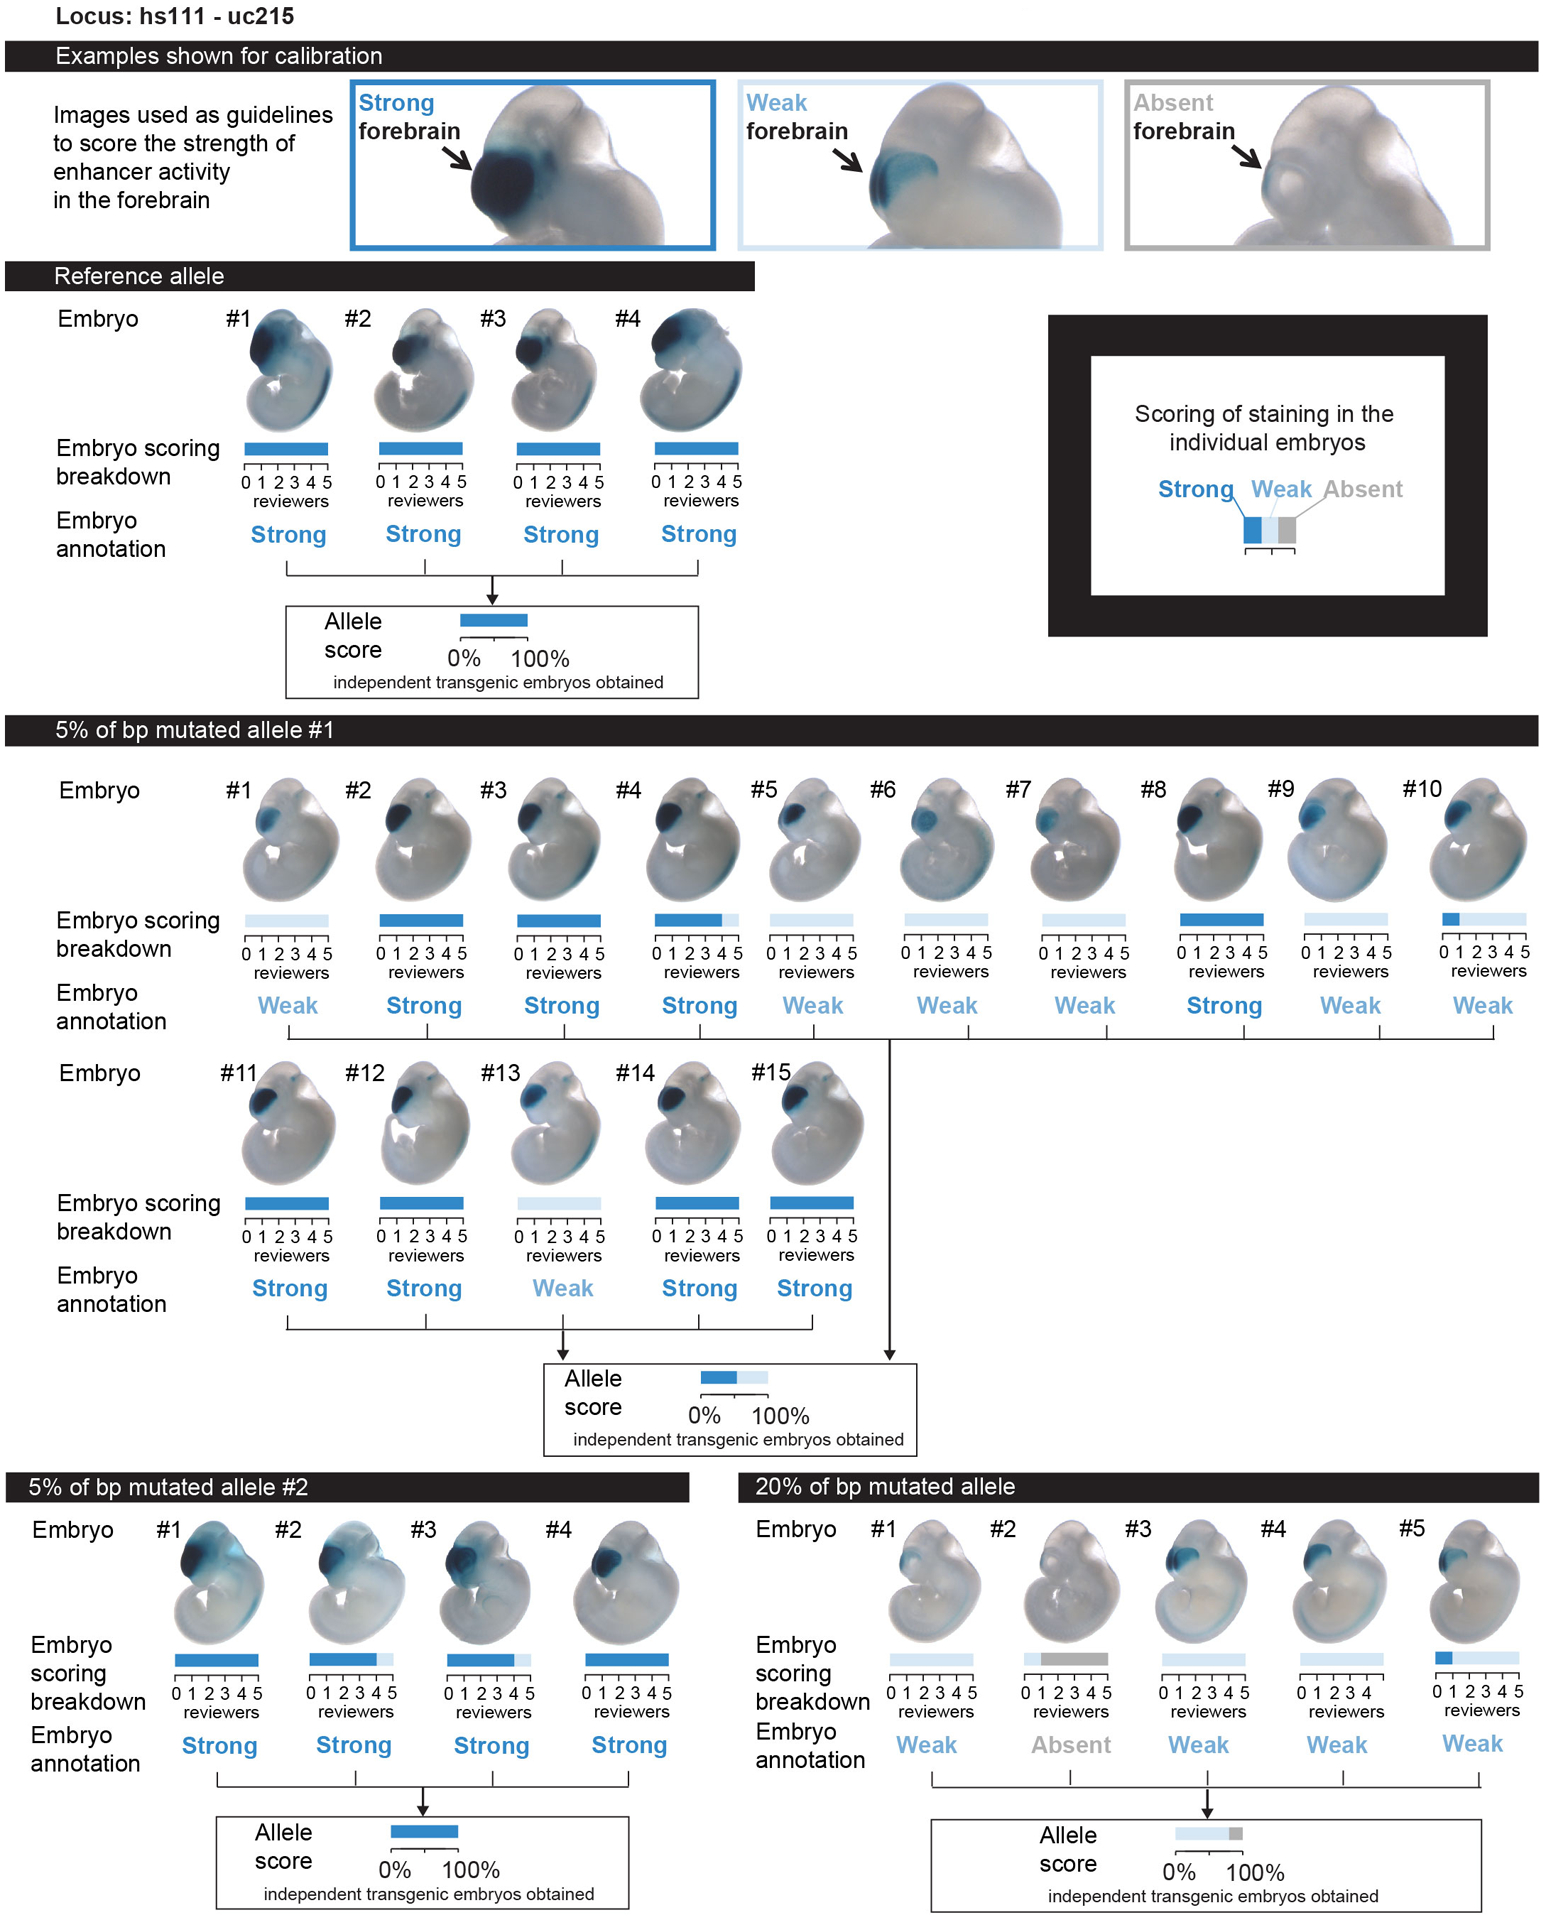
Top: calibration images given for one ultraconserved enhancer (hs111) to show different categories of enhancer activity. Randomized embryo images were shown to five reviewers alongside the calibration images displayed at the top. The reviewers scored the strength of enhancer activity independently and blind to the identity of the enhancer allele. Bottom: breakdown of enhancer activity scoring results per embryo for four different alleles tested for the hs111 enhancer: reference allele, allele with 5% of bp mutated #1, allele with 5% of bp mutated #2, and allele with 20% of bp mutated. See Supplementary Information for a similar scoring breakdown of all 23 ultraconserved enhancers selected for mutagenesis.
Extended Data Fig. 3. Distribution of 23 ultraconserved enhancers among the three groups of enhancer mutagenesis outcomes.
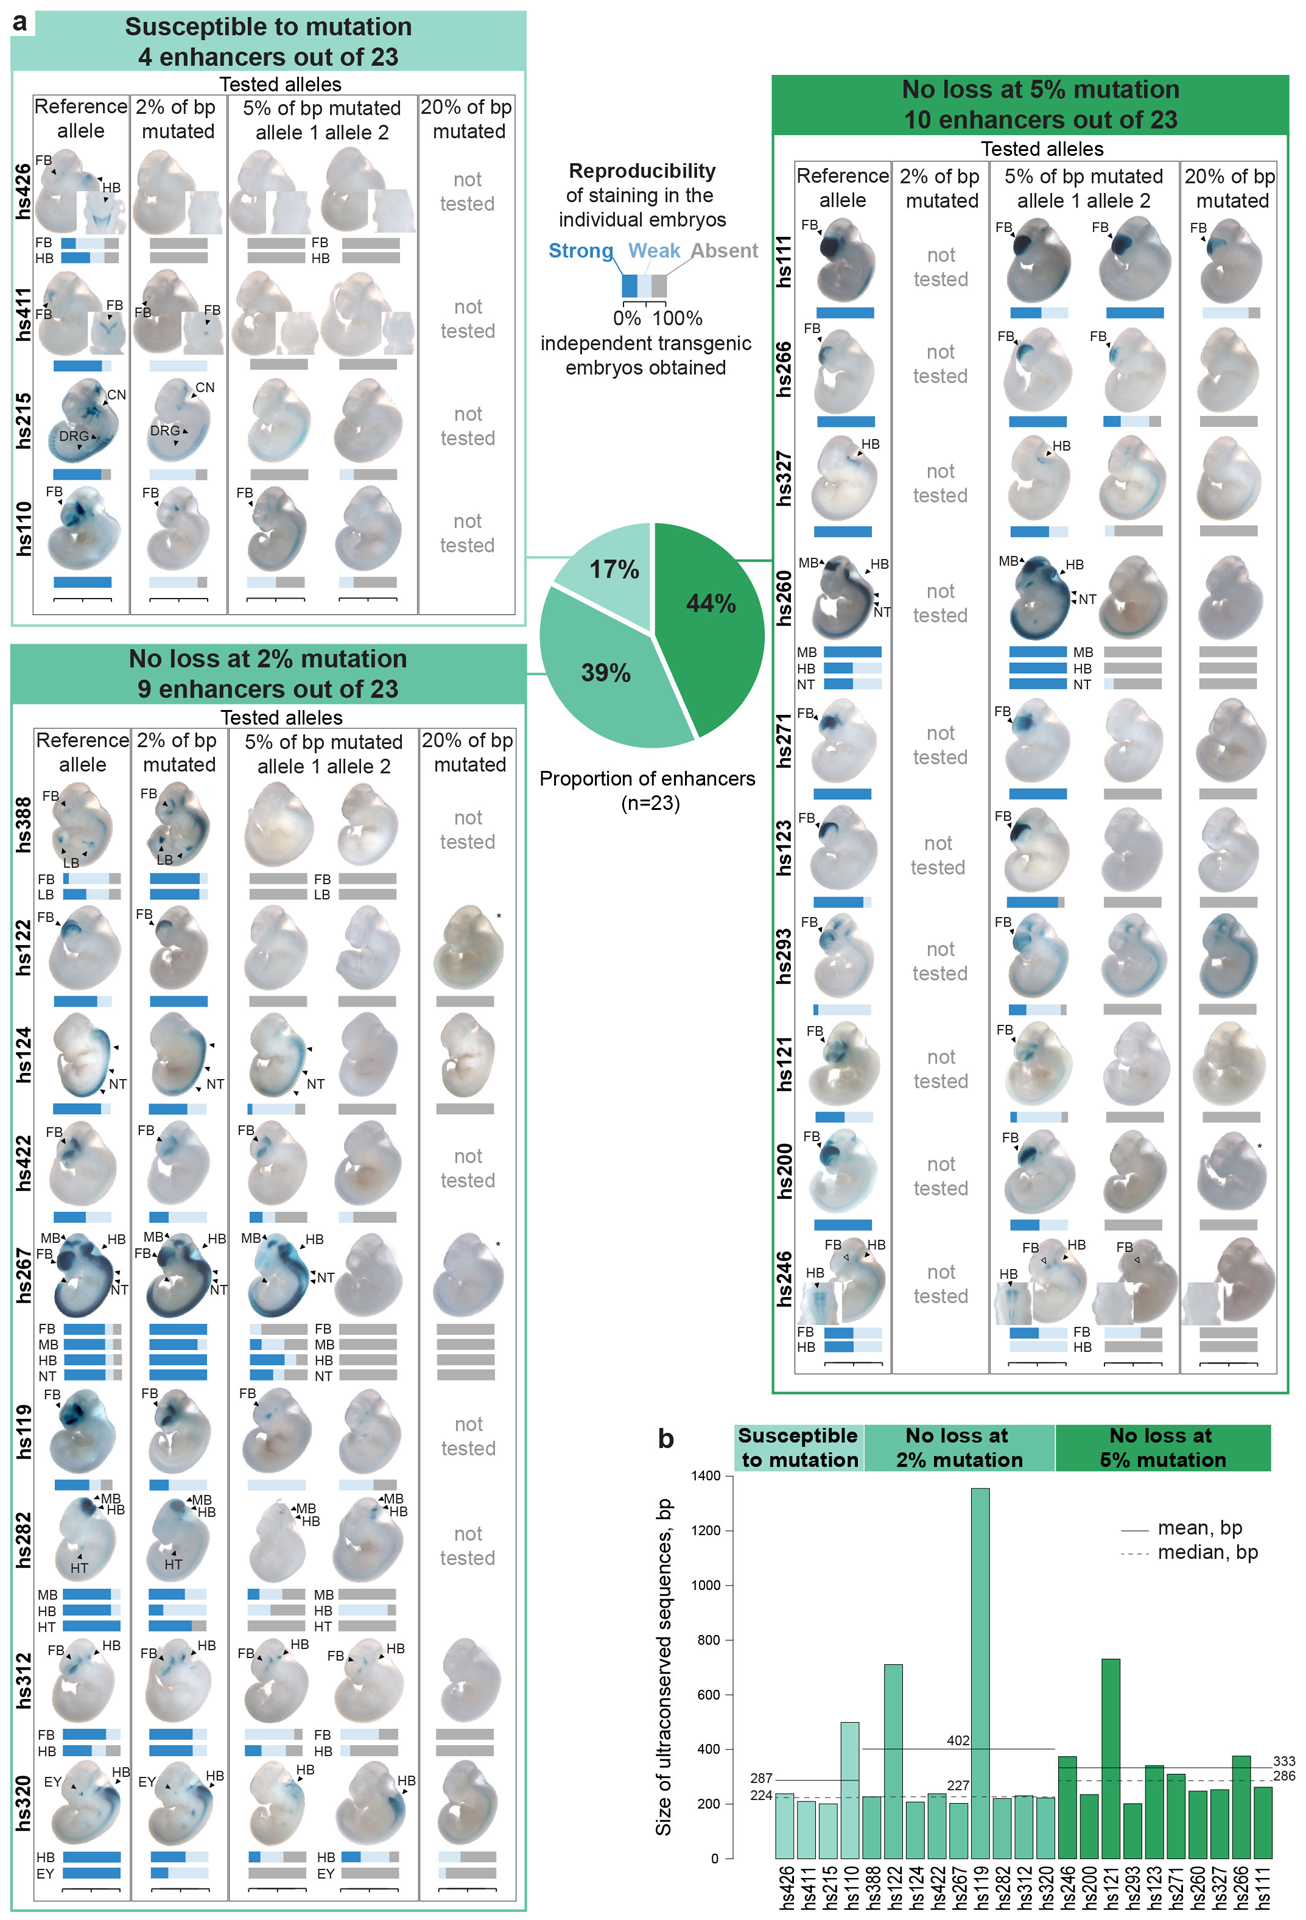
a, Images of embryos and enhancer activity results for all 23 enhancers. Bar plots under the embryo images show the strength and reproducibility of LacZ staining (serving as a proxy for enhancer activity) among individual transgenic embryos from each enhancer allele. Enhancer activity was scored by five independent reviewers blind to the embryo genotype after the images were randomized (see Methods, Extended Data Fig. 2 and Supplementary Information for details). Embryo images for CRISPR-assisted transgenic experiments for the reference alleles of enhancers hs200 and hs215 were published previously24. All other transgenic assays were newly performed for this study. All of the mutation alleles tested harbored sequence changes at 2, 5, or 20% of ultraconserved bases, as indicated above, with the exception of three of the alleles grouped with the 20% variants (marked with an asterisk [*] for hs122, hs200, and hs267). For the hs122 allele, 25% of bp were actually mutated. For hs200 (16% mutation) and hs267 (12% mutation), fewer than 20% of base pairs are well-conserved among ~100 vertebrates, so lower levels of mutagenesis were used. b, Length of ultraconserved sequences for all 23 enhancers arranged by enhancer mutagenesis outcomes with mean and median shown per group as solid and dashed lines, respectively. No statistically significant differences detected between groups (two-tailed t-tests).
Extended Data Fig. 4. Motif enrichment analysis.
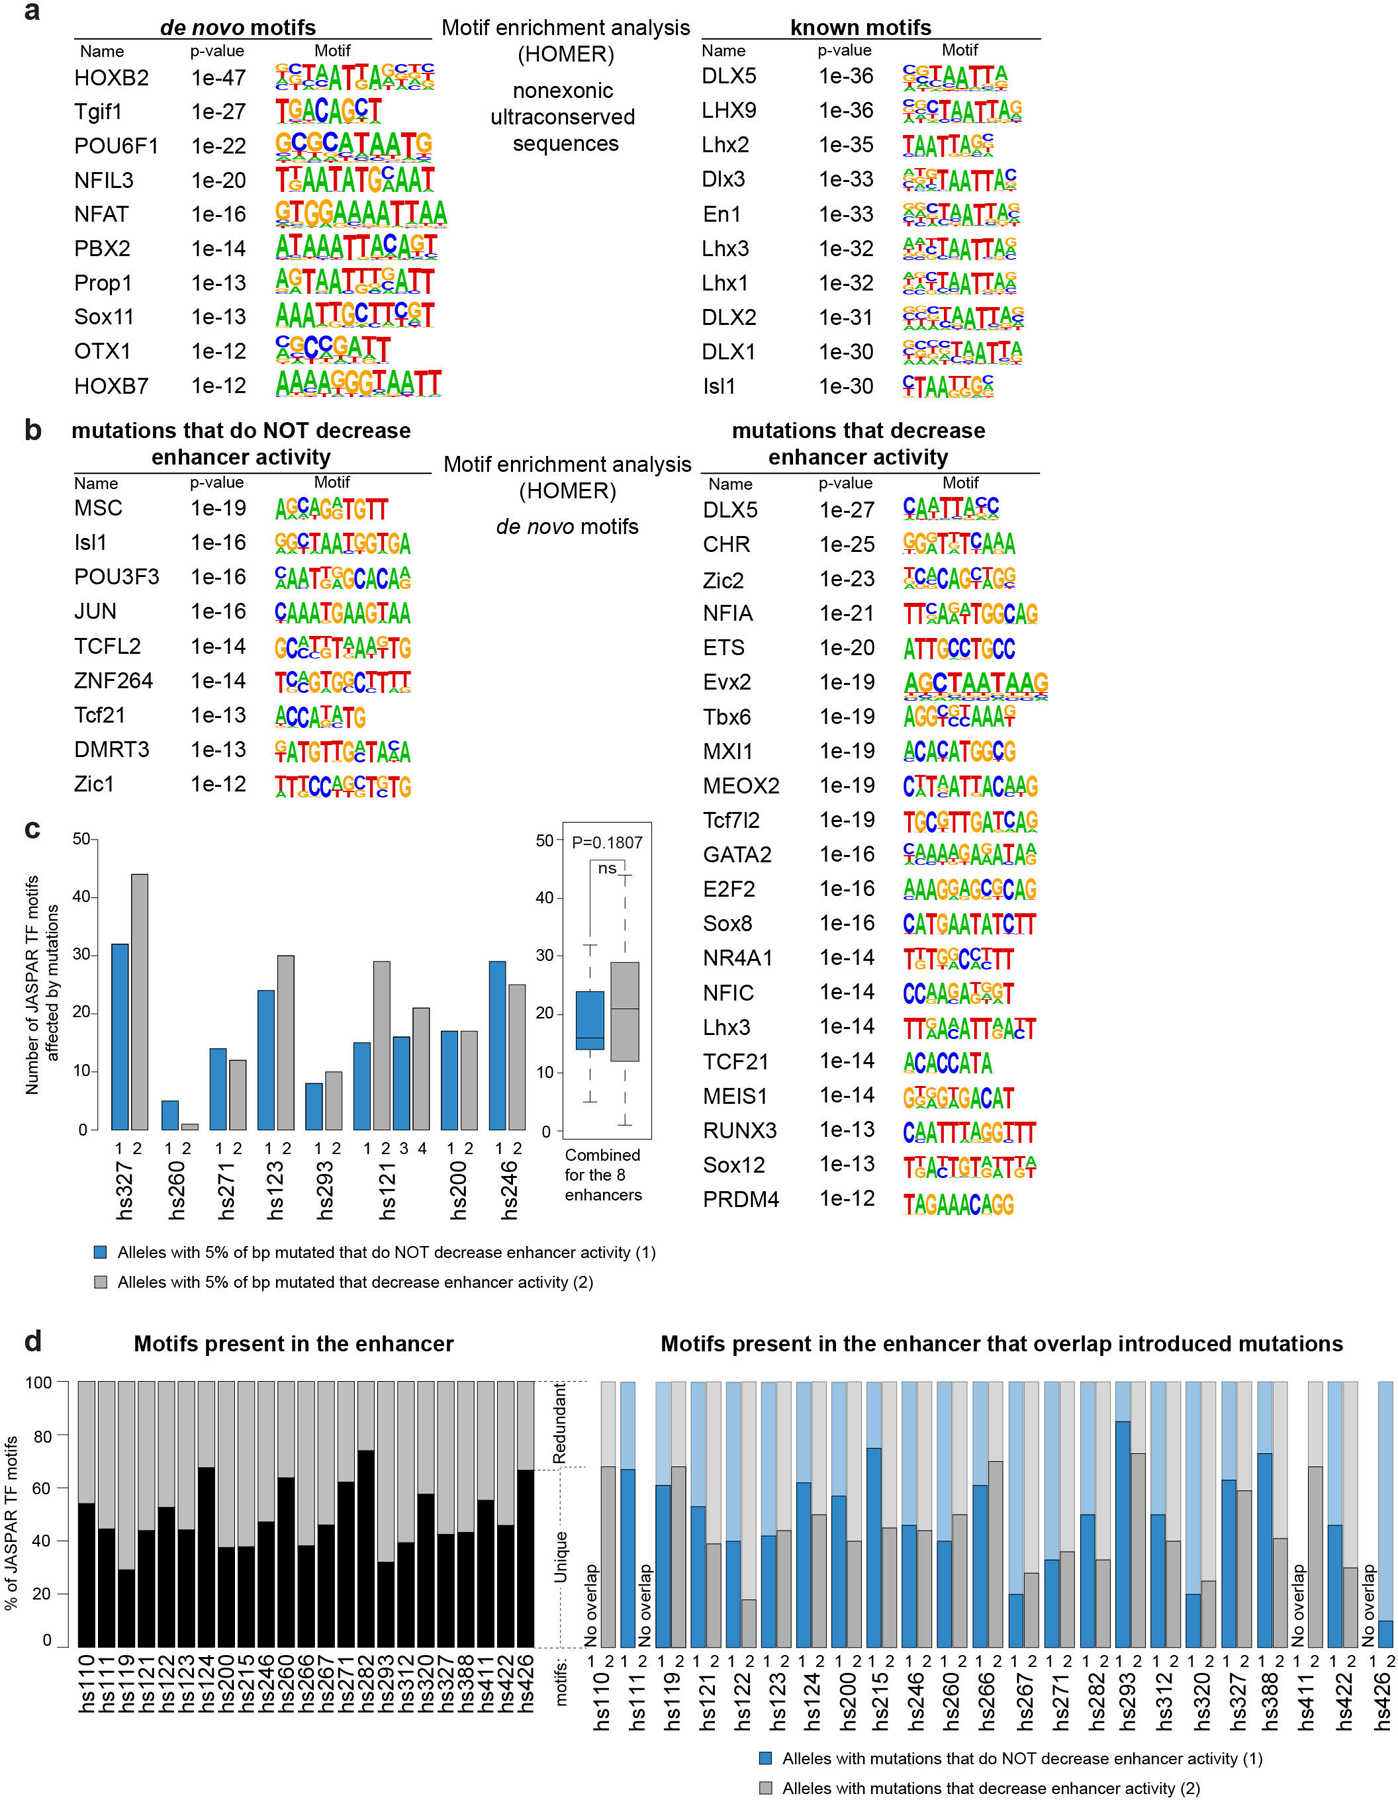
a, Motifs that are significantly enriched in 370 noncoding ultraconserved sequences compared to the whole human genome. b, Motifs that are significantly enriched in 15 base pair k-mers centered on introduced mutations compared to the whole human genome. c, Left: Bar plot comparing the number of transcription factor motifs in the JASPAR database that overlap introduced mutations in alleles of the same enhancer that either decreased enhancer activity (grey bars) or not (blue bars). Each allele has 5% of ultraconserved base pairs mutated. Right: Boxplot summarizing data from all eight enhancers shown in the bar plot. Data is presented as median in the center, first (25th percentile) and third (75th percentile) quartile as bounds of the boxes, and ± 1.5 × ICR (interquartile range = third − first quartile) from bounds of the boxes as whiskers. d, Left: Bar plot showing the percentage of JASPAR transcription factor motifs overlapping 23 enhancers mutated in this study that occur in the ultraconserved sequence of an enhancer only once (unique, black) or multiple times (redundant, grey). On average, 48% of motifs were unique. Right: Bar plot comparing distribution of unique vs. redundant transcription factor motifs that overlap introduced mutations between mutant alleles that saw decrease in enhancer activity (grey bars) and those that did not (blue bars). On average, ~52% of motifs that overlapped introduced mutations that did not decrease enhancer activity were unique, while the average for unique motifs that overlapped introduced mutations that decreased enhancer activity was ~44%.
Extended Data Fig. 5. Chromatin signatures of 23 ultraconserved enhancers mutated in this study in multiple tissues and developmental times points in mouse and human.
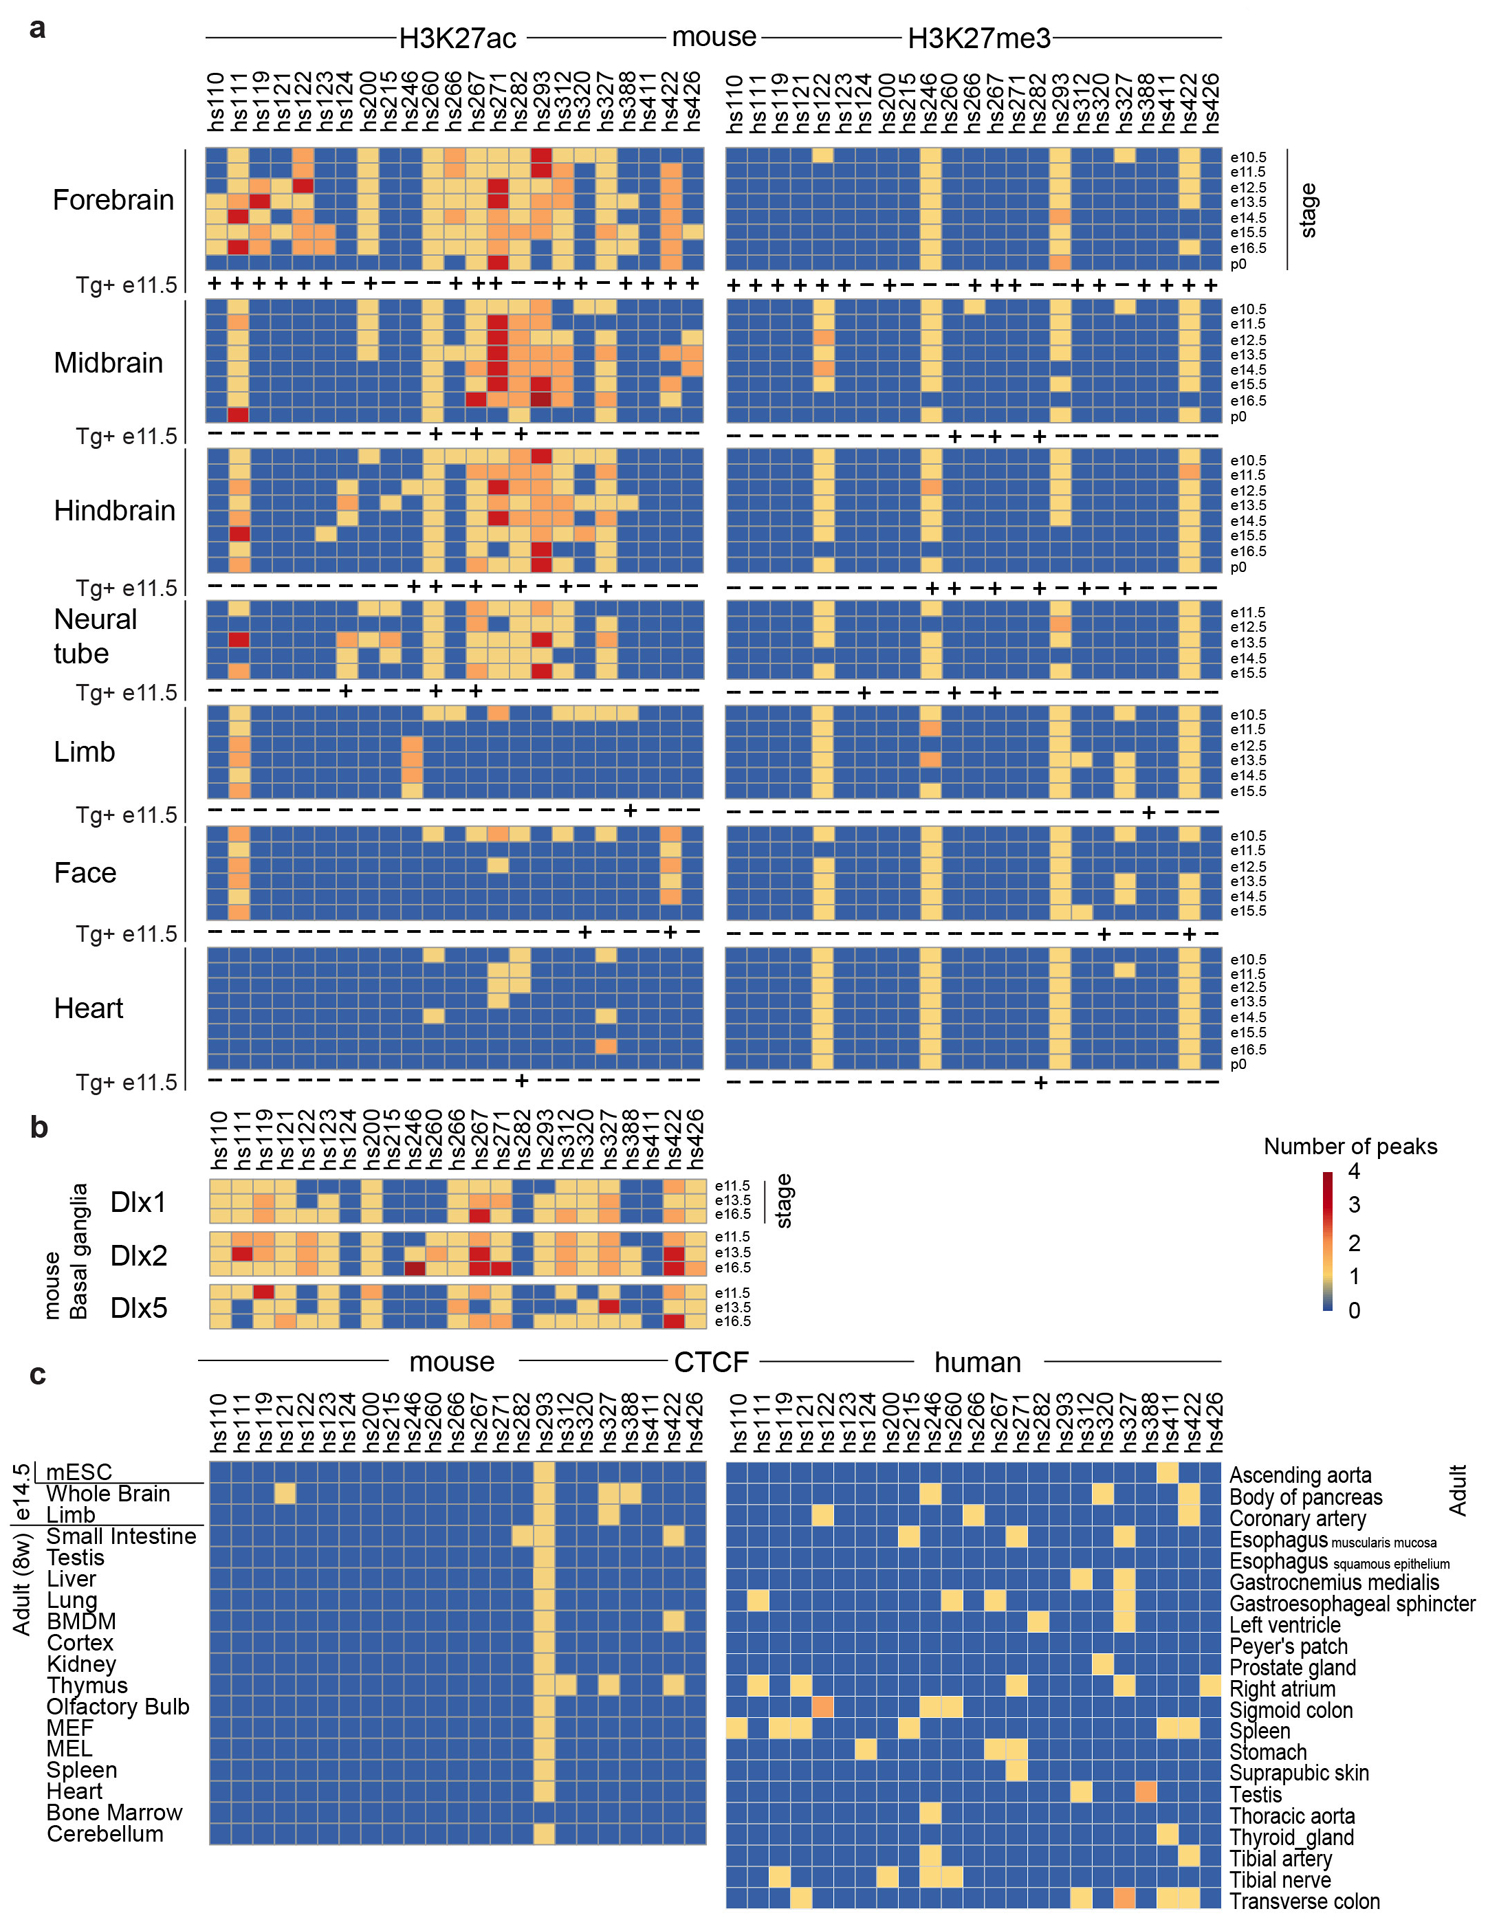
a, Histone modifications associated with active enhancers (H3K27ac) and inactive sequences (H3K27me3) sampled from multiple tissues throughout mouse development. ‘+’ and ‘-’ for ‘Tg+ e11.5’ indicate the presence or absence, respectively, of the activity by the reference enhancer allele in e11.5 (e12.5 for hs124) transgenic mouse embryos reported in this study. ChIP-seq data was obtained from Gorkin et al., 202040. b, Binding of Dlx transcription factors during embryonic development of mouse basal ganglia. ChIP-seq data was obtained from Lindtner et al., 201941. c, Binding of CTCF in embryonic and adult mouse tissues and adult human tissues. ChIP-seq data was obtained from Yue et al., 201442 for mouse samples and from Dunham et al., 201243 for human samples.
Extended Data Fig. 6. Knock-in strategy to introduce the mutations into the endogenous mouse alleles of hs122 (uc468+uc469) and hs121 (uc467).
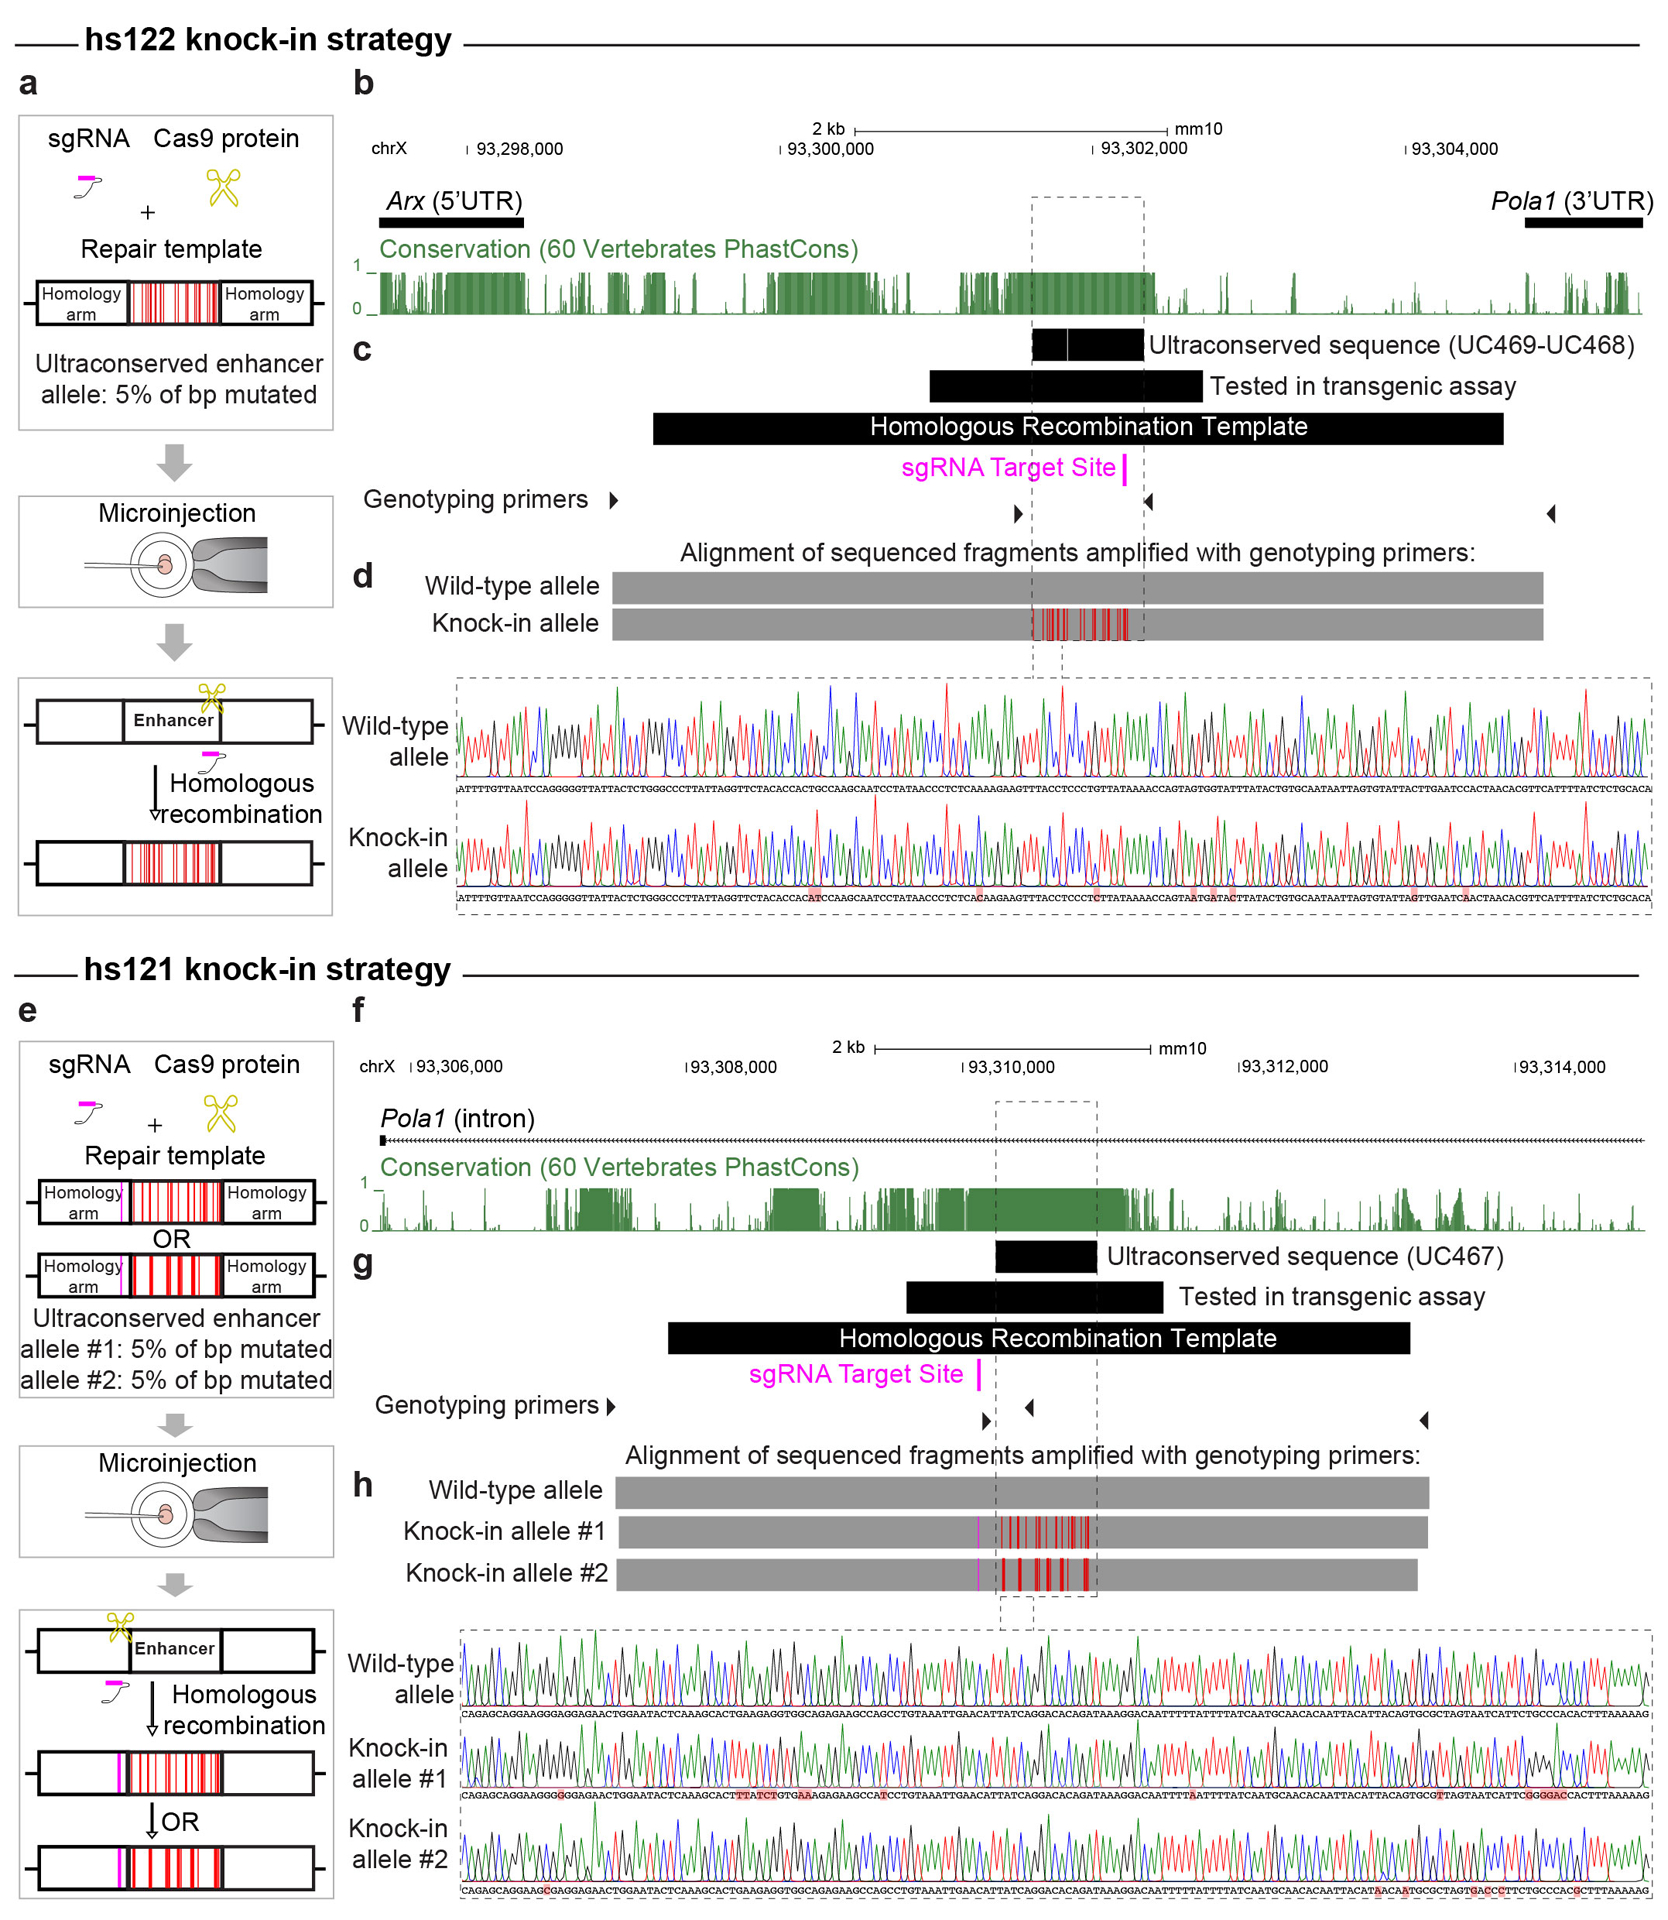
a, e, The mutant enhancer alleles were knocked-in via homologous recombination of the reference allele via a CRISPR/Cas9 microinjection protocol. A sgRNA for hs122 was designed to target the reference allele sequence that overlaps mutations introduced into the mutant allele. The target sequence of a sgRNA for hs121 was 115bp upstream of the ultraconserved sequence, thus hs121 repair templates carried a point mutation altering the PAM sequence for the sgRNA (schematically indicated by the pink lines) to prevent their cleavage by the CRISPR/Cas9 complex. b, f, The genomic region between the Arx and Pola1 genes contains hs122, and hs121 is located in the first intron of the Pola1 gene. Conservation tracks (green) show phastCons scores between mouse and other vertebrate genomes. c, g, Positions of the ultraconserved sequences within enhancers (uc468+uc469 OR uc467), the sequences tested in the transgenic assay, the homologous recombination templates, and genotyping primers are shown schematically in black. Position of the sgRNA target sites shown in pink. d, h, Males hemizygous for the mutant alleles of the hs122 and hs121 enhancers were genotyped with PCR amplification (positions of genotyping primers shown as black triangles in c and g) and Sanger sequencing. Top: alignment of reads from the knock-in alleles and wild-type alleles to the reference mouse genome (mm10) is shown in grey, with mismatches indicating the location of the introduced mutations represented by red lines. Bottom: Sanger sequencing traces for mutant knock-in and wild-type alleles are shown for the region within the dotted lines. Introduced mutations are highlighted in red. See Tables S4, S5 for more information on coordinates and sequences.
Extended Data Fig. 7. Transgenic reporter assays with either human or mouse sequences surrounding the ultraconserved core show the same effect on the enhancer activity.
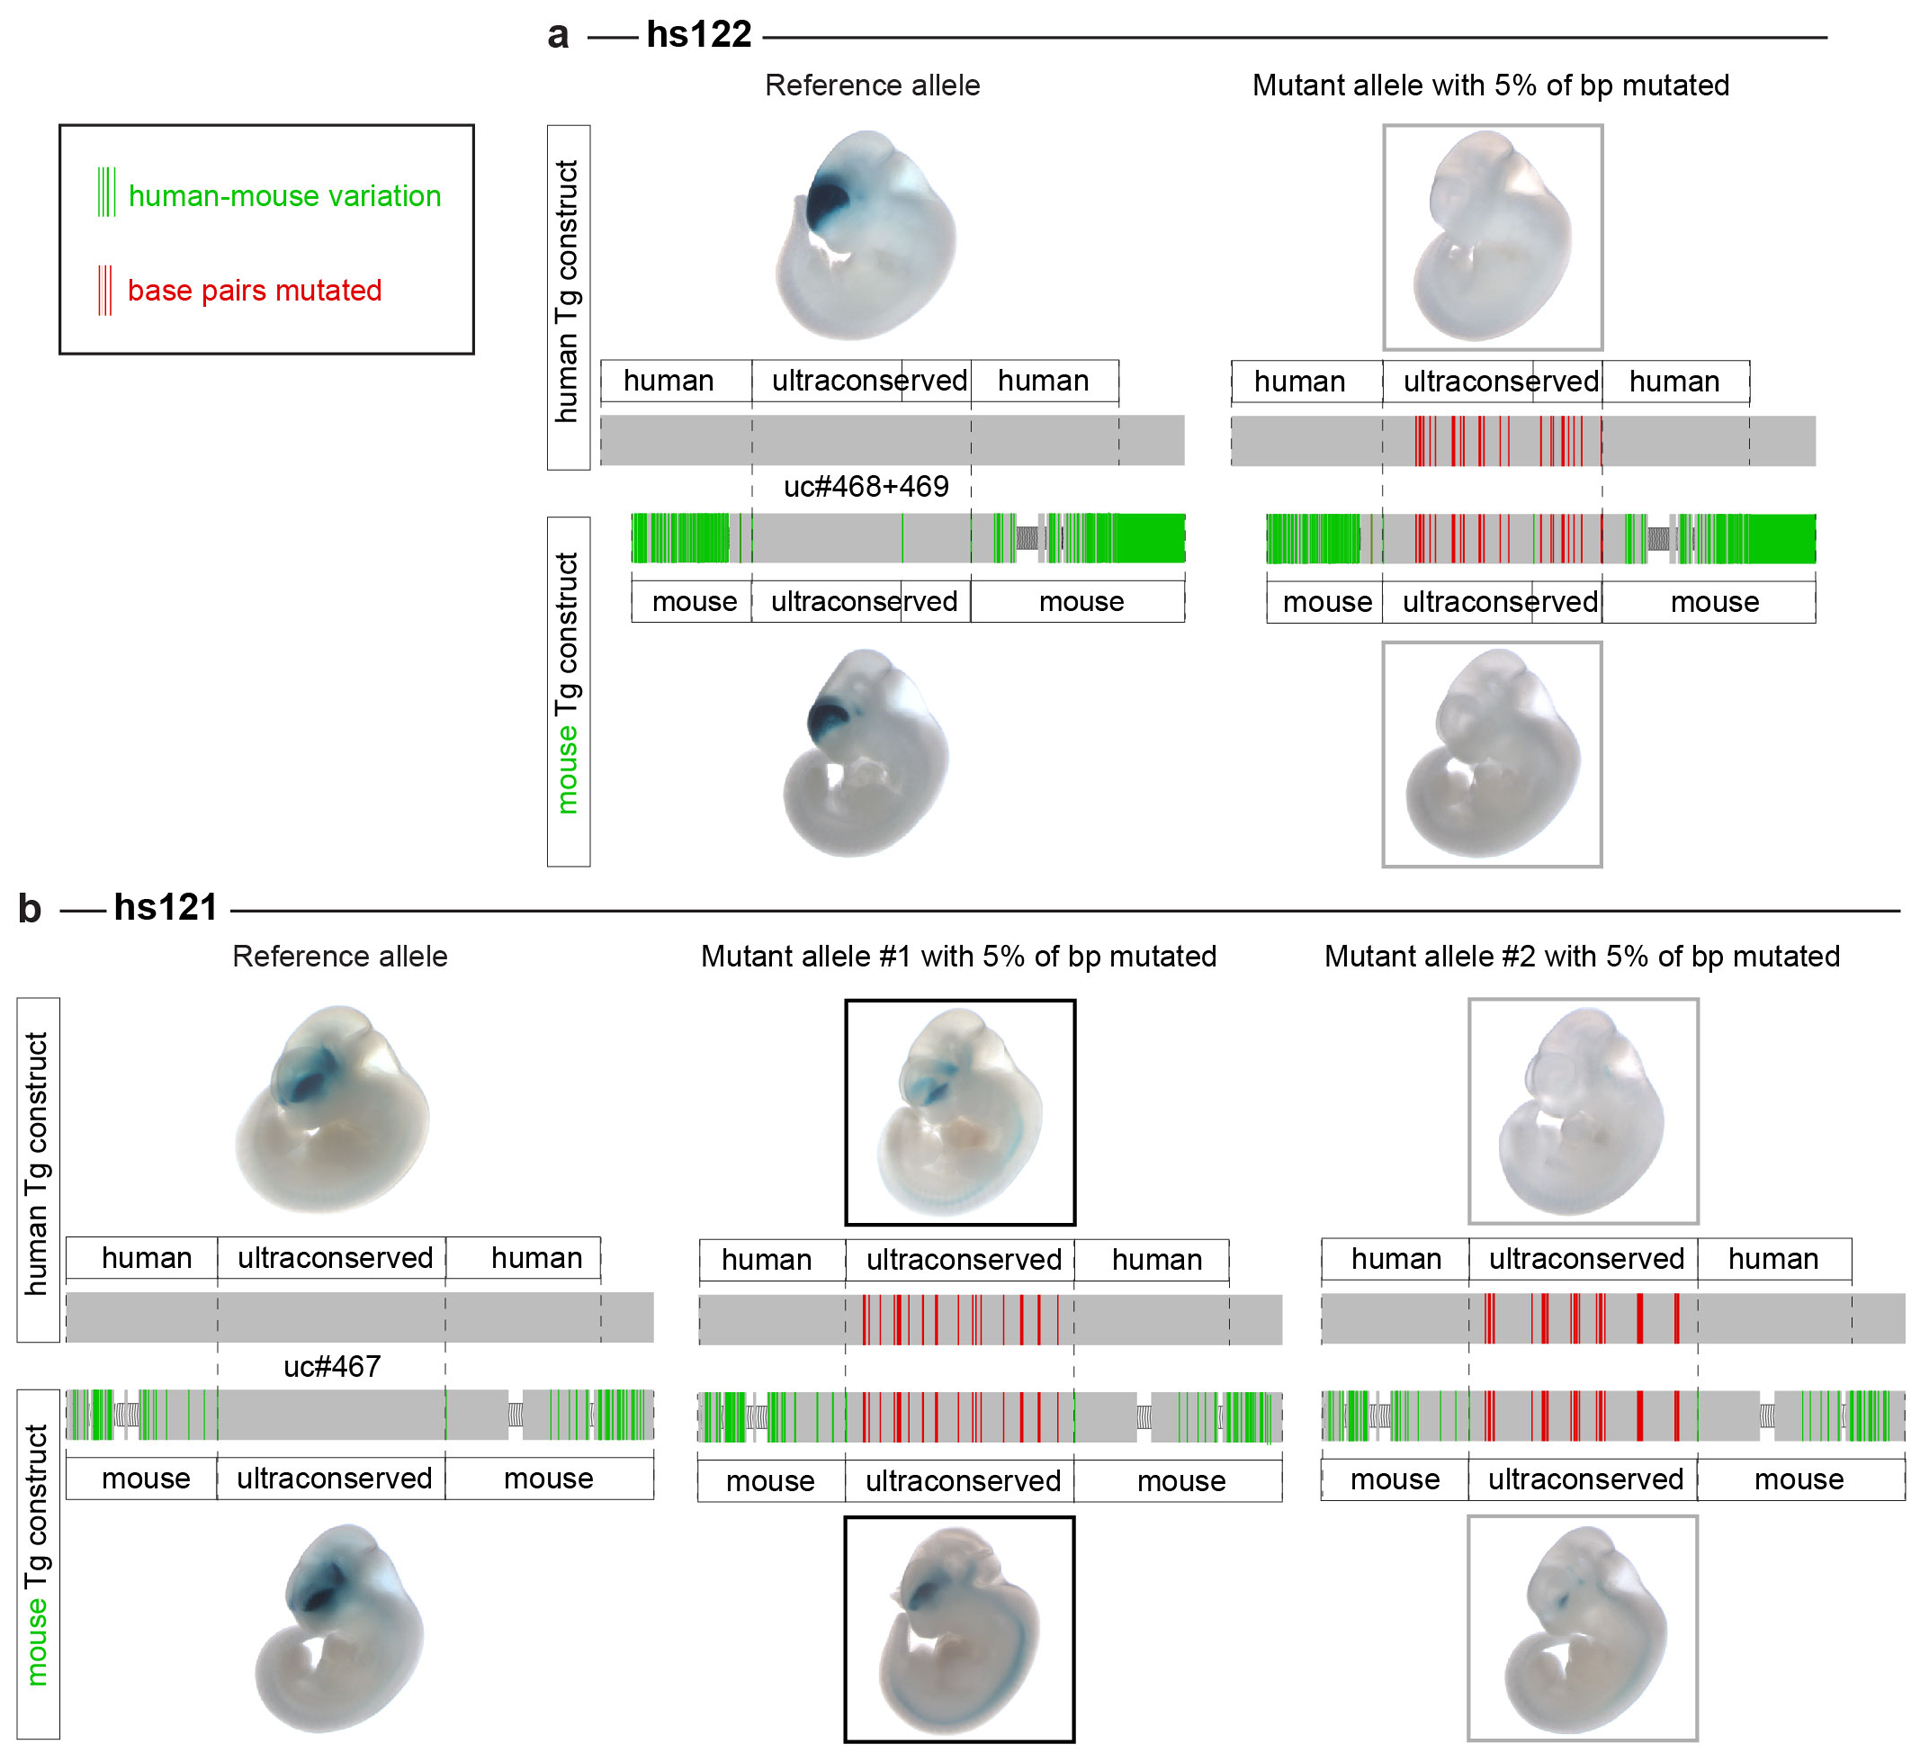
The sequences surrounding the ultraconserved parts of the (a) hs122 (uc468+uc469) and (b) hs121 (uc467) enhancers tested in transgenic assays differ between the human and mouse genomes (mismatches shown in green). To make sure that mouse regions flanking the ultraconserved sequences (shown in red) will not compensate for mutations introduced into the endogenous mouse alleles of the enhancers, we tested the activity of the mouse sequence in transgenic assays for both the reference alleles and the alleles with 5% of base pairs mutated. Regions to test were selected to span the hs122 and hs121 sequences deleted from the mouse genome previously9.
Extended Data Fig. 8. Arx expression in mice with mutated endogenous hs121 and hs122 enhancers.

In situ hybridization for Arx expression (purple staining) performed on coronal cross-sections of e12.5 forebrains from hemizygous knock-in males shown alongside wild-type littermate controls from three knock-in lines: (a) hs122mut (allele with 5% of base pairs mutated that eliminated enhancer activity in mouse transgenic assay), (b) hs121mut1 (allele with 5% of base pairs mutated that did not affect enhancer activity in mouse transgenic assay), and (c) hs121mut2 (allele with 5% of base pairs mutated that eliminated enhancer activity in mouse transgenic assay). Arrows point to a loss of Arx signal in the caudal cortical regions of hs122mut/Y sections. We did not detect changes in Arx expression in hemizygous knock-in male embryos for either of the hs121 enhancer mutant alleles (hs121mut1/Y and hs121mut2/Y). However, this is consistent with the data from hs121-null embryos9, and is likely due to tissue heterogeneity and the presence of another Arx enhancer (hs119) with a similar activity domain. Scale bars, 200 μm.
Extended Data Fig. 9. Mutagenesis of the endogenous hs122 enhancer results in dentate gyrus abnormalities (a smaller dentate gyrus with disorganized appearance).

Rostral (a) and caudal (b) coronal cross-sections of postnatal hippocampus from all phenotyped animals: three wild-type littermate male controls and four hemizygous knock-in males shown side-by-side for comparison. Numbers represent unique identifiers for each mouse examined (details in Table S6). Scale bars, 500 μm. c, Bar graph showing quantification of dentate gyrus length for wild-type mice in (a) (n=3) and knock-in mice in (b) (n=4). Bars indicate mean densities, with individual biological replicates represented by dots. Error bars, mean ± s.d. Difference in length between wild-type and knock-in mice assessed by a two-tailed paired t-test.
Extended Data Fig. 10. Mutagenesis of the endogenous hs121 enhancer results in abnormalities in the number of vasointestinal peptide (VIP+) interneurons in adult mice brains only for the allele that abolished hs121 enhancer activity in transgenic reporter assay.
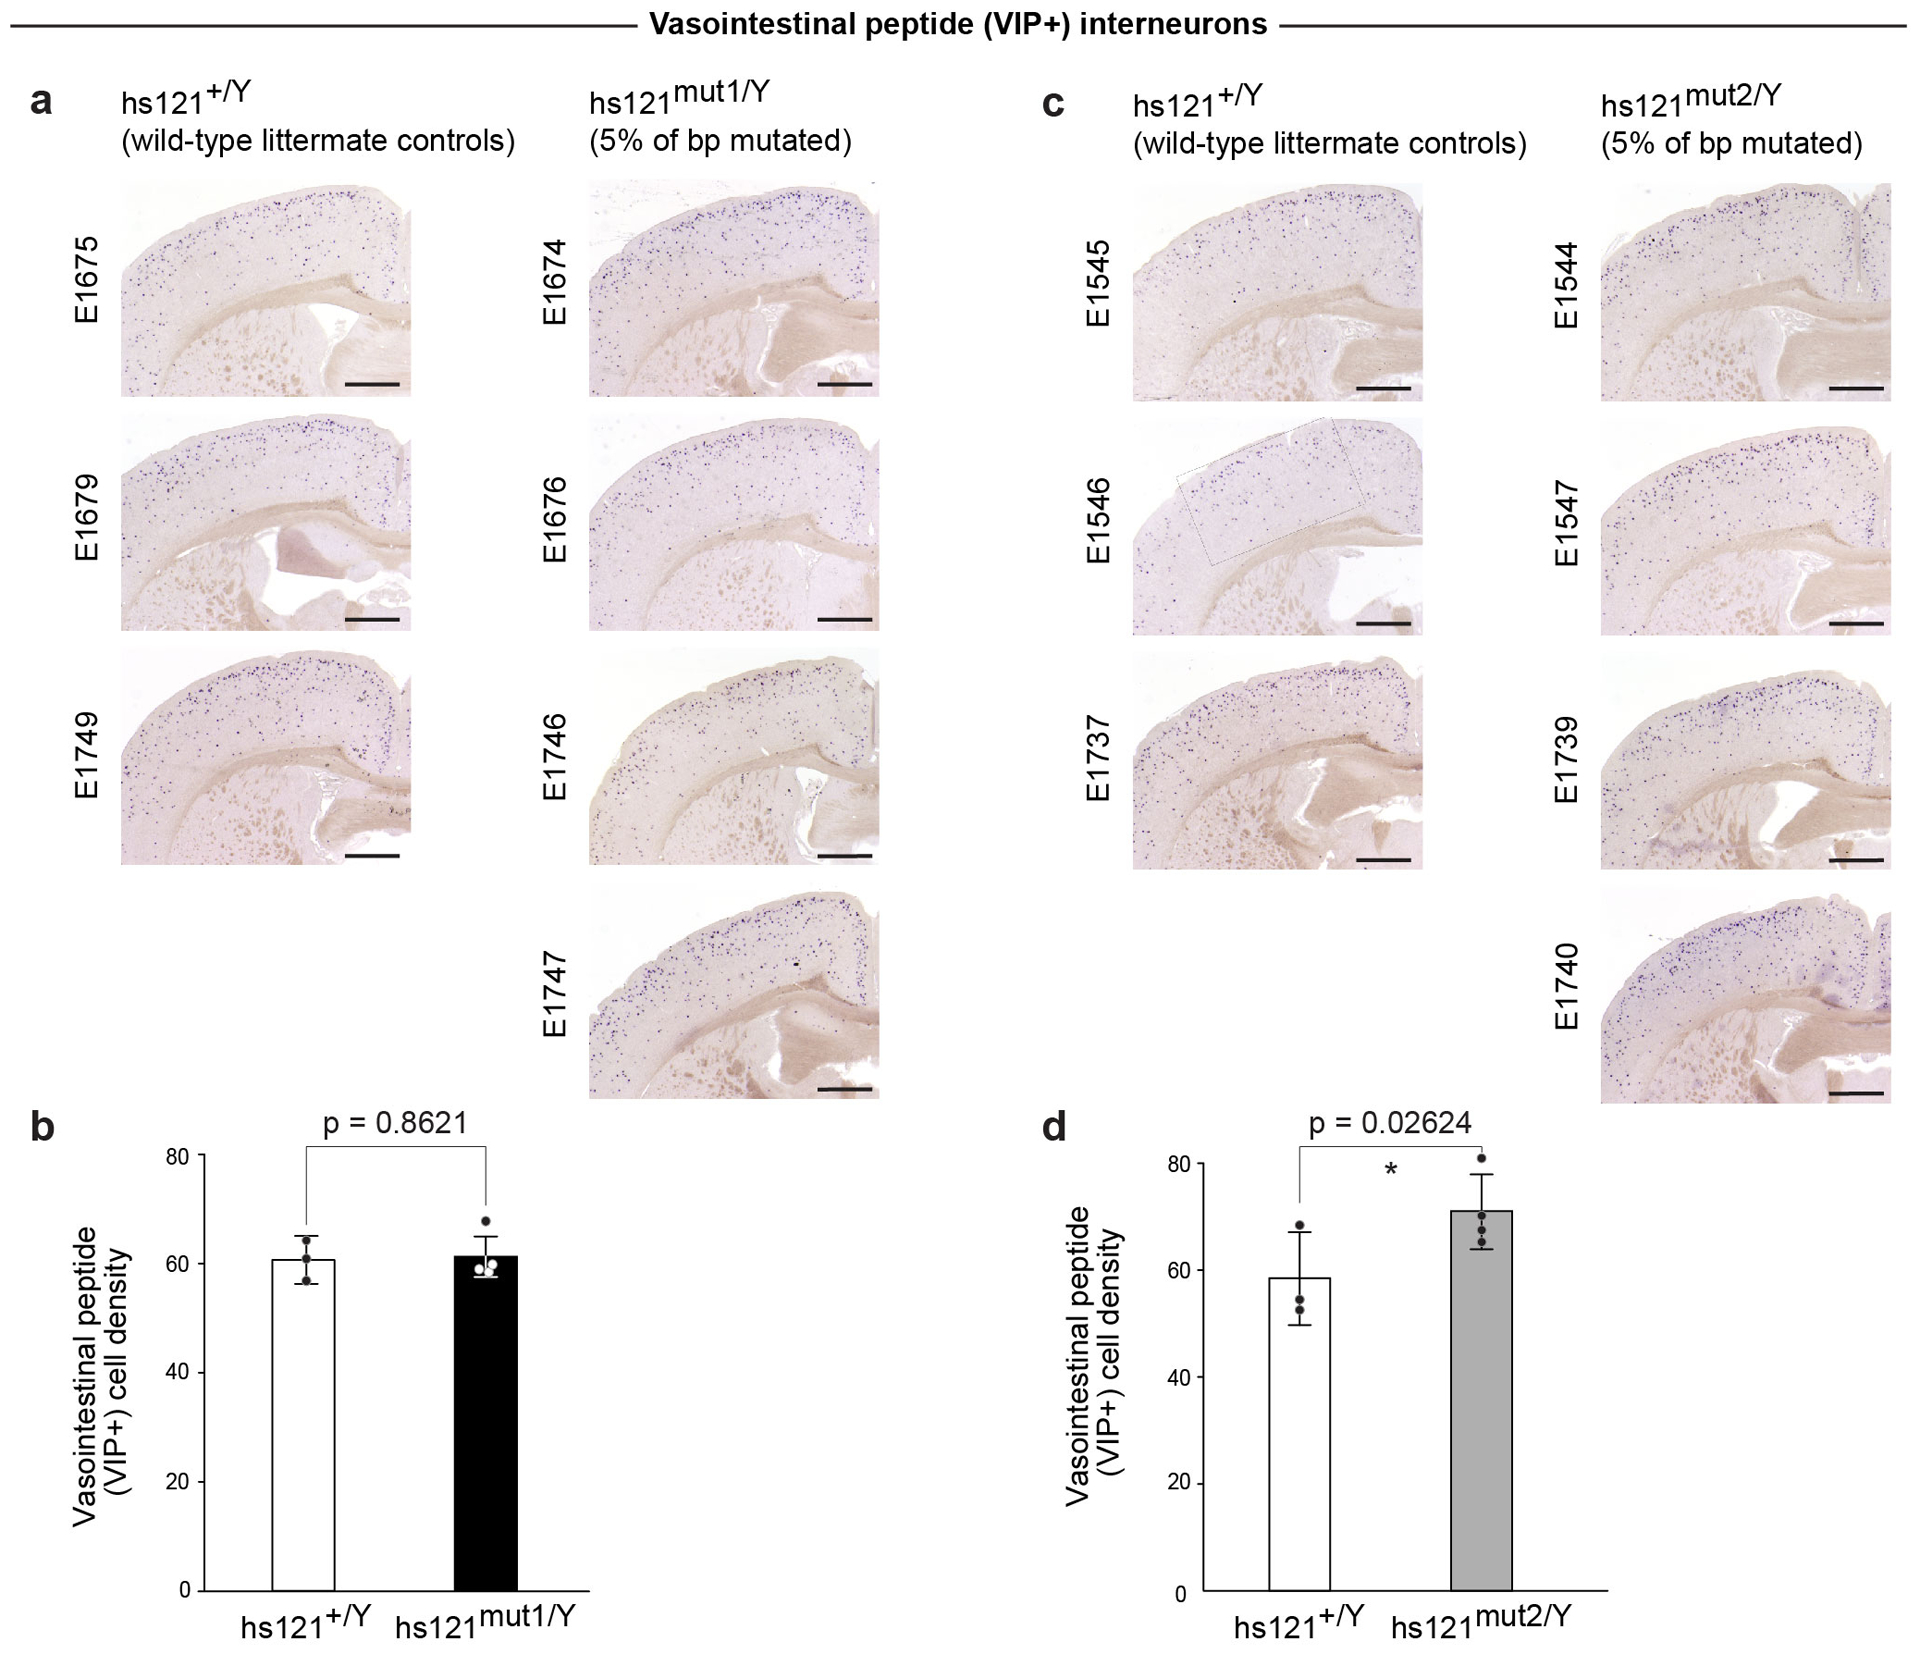
Coronal cross-sections through cortex from two knock-in lines generated for mutant alleles of the hs121 enhancer: one that was active (a) in the transgenic reporter assay and one that was inactive (c). Representative images shown from all phenotyped animals: three wild-type littermate male controls and four hemizygous knock-in males for each allele, displayed side-by-side for comparison. Numbers represent unique identifiers for each mouse examined (details in Table S7). Scale bars, 1 mm. b, d, Bar graphs showing quantification of VIP+ interneuron densities (cells/mm2) between wild-type (n=3) and knock-in (n=4) mice. Bars indicate mean densities, with individual biological replicates represented by dots. Error bars, mean ± s.d. Differences between wild-type and knock-in mice assessed by two-tailed paired t-tests.
Supplementary Material
Table S1: Loss of function results from ultraconserved enhancer mutagenesis. P-values and FASTA sequences of reference and mutated alleles (provided separately).
Table S2: Gain of function results from ultraconserved enhancer mutagenesis. P-values and FASTA sequences of reference and mutated alleles (provided separately).
Table S5: Primers used to amplify enhancers to make transgenic enhancer-reporter mice (provided separately).
Table S6: Primers used to generate and characterize hs122 and hs121 enhancer knock-in mice (provided separately).
Acknowledgments
This work was supported by U.S. National Institutes of Health grants to L.A.P. (R01HG003988) and to J.L.R.R. (NINDS R01NS34661 and NIMH R01 MH049428). A.R.Y. was supported by a grant from Fondation Fyssen. Research was conducted at the E.O. Lawrence Berkeley National Laboratory and performed under U.S. Department of Energy Contract DE-AC02-05CH11231, University of California. We would like to thank F. Darbellay and S. Rajderkar for their help with embryo scoring. We would also like to thank J. Hu (UCSF) for kindly providing the vasointestinal peptide riboprobe.
Footnotes
Competing Interest Statements
J.L.R.R. is cofounder, stockholder, and currently on the scientific board of Neurona, a company studying the potential therapeutic use of interneuron transplantation. The authors declare no other competing interests.
References
- 1.Bejerano G et al. Ultraconserved elements in the human genome. Science 304, 1321–5 (2004). [DOI] [PubMed] [Google Scholar]
- 2.Hecker N & Hiller M A genome alignment of 120 mammals highlights ultraconserved element variability and placenta-associated enhancers. Gigascience 9(2020). [DOI] [PMC free article] [PubMed] [Google Scholar]
- 3.Katzman S et al. Human genome ultraconserved elements are ultraselected. Science 317, 915 (2007). [DOI] [PubMed] [Google Scholar]
- 4.Drake JA et al. Conserved noncoding sequences are selectively constrained and not mutation cold spots. Nat Genet 38, 223–7 (2006). [DOI] [PubMed] [Google Scholar]
- 5.Ovcharenko I Widespread ultraconservation divergence in primates. Mol Biol Evol 25, 1668–76 (2008). [DOI] [PMC free article] [PubMed] [Google Scholar]
- 6.Habic A et al. Genetic Variations of Ultraconserved Elements in the Human Genome. OMICS 23, 549–559 (2019). [DOI] [PMC free article] [PubMed] [Google Scholar]
- 7.Pennacchio LA et al. In vivo enhancer analysis of human conserved non-coding sequences. Nature 444, 499–502 (2006). [DOI] [PubMed] [Google Scholar]
- 8.Visel A et al. Ultraconservation identifies a small subset of extremely constrained developmental enhancers. Nat Genet 40, 158–60 (2008). [DOI] [PMC free article] [PubMed] [Google Scholar]
- 9.Dickel DE et al. Ultraconserved Enhancers Are Required for Normal Development. Cell 172, 491–499 e15 (2018). [DOI] [PMC free article] [PubMed] [Google Scholar]
- 10.Nolte MJ et al. Functional analysis of limb transcriptional enhancers in the mouse. Evol Dev 16, 207–23 (2014). [DOI] [PMC free article] [PubMed] [Google Scholar]
- 11.Ahituv N et al. Deletion of ultraconserved elements yields viable mice. PLoS Biol 5, e234 (2007). [DOI] [PMC free article] [PubMed] [Google Scholar]
- 12.Gaynor KU et al. Studies of mice deleted for Sox3 and uc482: relevance to X-linked hypoparathyroidism. Endocr Connect (2020). [DOI] [PMC free article] [PubMed] [Google Scholar]
- 13.Chen CT, Wang JC & Cohen BA The strength of selection on ultraconserved elements in the human genome. Am J Hum Genet 80, 692–704 (2007). [DOI] [PMC free article] [PubMed] [Google Scholar]
- 14.Kryukov GV, Schmidt S & Sunyaev S Small fitness effect of mutations in highly conserved non-coding regions. Hum Mol Genet 14, 2221–9 (2005). [DOI] [PubMed] [Google Scholar]
- 15.Keightley PD, Kryukov GV, Sunyaev S, Halligan DL & Gaffney DJ Evolutionary constraints in conserved nongenic sequences of mammals. Genome Res 15, 1373–8 (2005). [DOI] [PMC free article] [PubMed] [Google Scholar]
- 16.Siepel A et al. Evolutionarily conserved elements in vertebrate, insect, worm, and yeast genomes. Genome Res 15, 1034–50 (2005). [DOI] [PMC free article] [PubMed] [Google Scholar]
- 17.Harmston N, Baresic A & Lenhard B The mystery of extreme non-coding conservation. Philos Trans R Soc Lond B Biol Sci 368, 20130021 (2013). [DOI] [PMC free article] [PubMed] [Google Scholar]
- 18.Patwardhan RP et al. Massively parallel functional dissection of mammalian enhancers in vivo. Nat Biotechnol 30, 265–70 (2012). [DOI] [PMC free article] [PubMed] [Google Scholar]
- 19.Melnikov A et al. Systematic dissection and optimization of inducible enhancers in human cells using a massively parallel reporter assay. Nat Biotechnol 30, 271–7 (2012). [DOI] [PMC free article] [PubMed] [Google Scholar]
- 20.Dickel DE, Visel A & Pennacchio LA Functional anatomy of distant-acting mammalian enhancers. Philos Trans R Soc Lond B Biol Sci 368, 20120359 (2013). [DOI] [PMC free article] [PubMed] [Google Scholar]
- 21.Kircher M et al. Saturation mutagenesis of twenty disease-associated regulatory elements at single base-pair resolution. Nat Commun 10, 3583 (2019). [DOI] [PMC free article] [PubMed] [Google Scholar]
- 22.Lettice LA, Devenney P, De Angelis C & Hill RE The Conserved Sonic Hedgehog Limb Enhancer Consists of Discrete Functional Elements that Regulate Precise Spatial Expression. Cell Rep 20, 1396–1408 (2017). [DOI] [PMC free article] [PubMed] [Google Scholar]
- 23.Canver MC et al. BCL11A enhancer dissection by Cas9-mediated in situ saturating mutagenesis. Nature 527, 192–7 (2015). [DOI] [PMC free article] [PubMed] [Google Scholar]
- 24.Kvon EZ et al. Comprehensive In Vivo Interrogation Reveals Phenotypic Impact of Human Enhancer Variants. Cell 180, 1262–1271 (2020). [DOI] [PMC free article] [PubMed] [Google Scholar]
- 25.Karolchik D et al. The UCSC Table Browser data retrieval tool. Nucleic Acids Res 32, D493–6 (2004). [DOI] [PMC free article] [PubMed] [Google Scholar]
- 26.Hinrichs AS et al. The UCSC Genome Browser Database: update 2006. Nucleic Acids Res 34, D590–8 (2006). [DOI] [PMC free article] [PubMed] [Google Scholar]
- 27.Chiang CW et al. Ultraconserved elements: analyses of dosage sensitivity, motifs and boundaries. Genetics 180, 2277–93 (2008). [DOI] [PMC free article] [PubMed] [Google Scholar]
- 28.Osterwalder M et al. Enhancer redundancy provides phenotypic robustness in mammalian development. Nature 554, 239–243 (2018). [DOI] [PMC free article] [PubMed] [Google Scholar]
- 29.Turner TN et al. Genomic Patterns of De Novo Mutation in Simplex Autism. Cell 171, 710–722 e12 (2017). [DOI] [PMC free article] [PubMed] [Google Scholar]
- 30.Fakhouri WD et al. An etiologic regulatory mutation in IRF6 with loss- and gain-of-function effects. Hum Mol Genet 23, 2711–20 (2014). [DOI] [PMC free article] [PubMed] [Google Scholar]
- 31.Viturawong T, Meissner F, Butter F & Mann M A DNA-centric protein interaction map of ultraconserved elements reveals contribution of transcription factor binding hubs to conservation. Cell Rep 5, 531–45 (2013). [DOI] [PubMed] [Google Scholar]
- 32.McCole RB, Erceg J, Saylor W & Wu CT Ultraconserved Elements Occupy Specific Arenas of Three-Dimensional Mammalian Genome Organization. Cell Rep 24, 479–488 (2018). [DOI] [PMC free article] [PubMed] [Google Scholar]
- 33.Pollard KS, Hubisz MJ, Rosenbloom KR & Siepel A Detection of nonneutral substitution rates on mammalian phylogenies. Genome Res 20, 110–21 (2010). [DOI] [PMC free article] [PubMed] [Google Scholar]
- 34.Gibson DG et al. Enzymatic assembly of DNA molecules up to several hundred kilobases. Nat Methods 6, 343–5 (2009). [DOI] [PubMed] [Google Scholar]
- 35.Kvon EZ et al. Progressive Loss of Function in a Limb Enhancer during Snake Evolution. Cell 167, 633–642 e11 (2016). [DOI] [PMC free article] [PubMed] [Google Scholar]
- 36.Montague TG, Cruz JM, Gagnon JA, Church GM & Valen E CHOPCHOP: a CRISPR/Cas9 and TALEN web tool for genome editing. Nucleic Acids Res 42, W401–7 (2014). [DOI] [PMC free article] [PubMed] [Google Scholar]
- 37.Schneider CA, Rasband WS & Eliceiri KW NIH Image to ImageJ: 25 years of image analysis. Nat Methods 9, 671–5 (2012). [DOI] [PMC free article] [PubMed] [Google Scholar]
- 38.Heinz S et al. Simple combinations of lineage-determining transcription factors prime cis-regulatory elements required for macrophage and B cell identities. Mol Cell 38, 576–89 (2010). [DOI] [PMC free article] [PubMed] [Google Scholar]
- 39.Khan A et al. JASPAR 2018: update of the open-access database of transcription factor binding profiles and its web framework. Nucleic Acids Res 46, D1284 (2018). [DOI] [PMC free article] [PubMed] [Google Scholar]
Associated Data
This section collects any data citations, data availability statements, or supplementary materials included in this article.
Supplementary Materials
Table S1: Loss of function results from ultraconserved enhancer mutagenesis. P-values and FASTA sequences of reference and mutated alleles (provided separately).
Table S2: Gain of function results from ultraconserved enhancer mutagenesis. P-values and FASTA sequences of reference and mutated alleles (provided separately).
Table S5: Primers used to amplify enhancers to make transgenic enhancer-reporter mice (provided separately).
Table S6: Primers used to generate and characterize hs122 and hs121 enhancer knock-in mice (provided separately).
Data Availability Statement
Images of all transgenic whole-mount-stained embryos are included in Supplementary Figure 1. Images of brains sections from knock-in animals and wild-type littermates are in Extended Data Figures 8, 9, and 10. Human SNVs were obtained from TOPMed, https://bravo.sph.umich.edu/freeze5/hg38/ in June 2020. JASPAR transcription factor motif data were downloaded from http://expdata.cmmt.ubc.ca/JASPAR/downloads/UCSC_tracks/2018/hg19/. Public ChIP-seq data were obtained from https://www.encodeproject.org (mouse embryonic H3K27ac and H3K27me3, mouse and human CTCF) and https://www.ncbi.nlm.nih.gov/geo/query/acc.cgi?acc=GSE124936 (DLX transcription factors).