

Abstract
Quantitative genetic analyses can indicate how complex traits respond to natural selection by demonstrating the genetic relationships between features that constrain their evolution. Genetic correlations between dental measurements have been estimated previously in baboons, humans, and tamarins, and indicate variable patterns of modularity by tooth type across these taxa. Here, heritabilities of, and genetic correlations between, linear dental measurements were estimated from the Cayo Santiago rhesus macaques (Macaca mulatta). Relationships between the genetic correlation matrix and matrices designed to test hypotheses of modularity by tooth type, region, function, and development were assessed using a random skewers approach. Dental measurements were found to be moderately to highly heritable, with 24 of 28 heritability estimates differing significantly (p < 0.05) from zero. Almost all genetic correlations between dental dimensions were positive. The genetic correlation matrix was most similar to a regionally modular matrix, with distinct anterior and postcanine tooth modules. This pattern is consistent with previous quantitative genetic analyses of baboons and previous phenotypic analyses of cercopithecoid primates. The existence of a genetic module for the canines and honing premolar was not supported. Ongoing selection pressures, rather than strong genetic constraints, are likely necessary to preserve functional relationships between the canines and honing premolar based on these findings. The genetic correlation matrix of the Cayo Santiago rhesus macaques mirrors patterns of phenotypic correlations observed for cercopithecoid primates broadly, and demonstrates that genetic contributions to these patterns may be fairly stable over the course of cercopithecoid evolution. Quantitative genetic study of additional taxa will be necessary to determine whether the regional modularity of baboons and macaques, or the integrated pattern of humans and tamarins, is shared more broadly across primates.
Keywords: Quantitative genetics, genetic integration, dental morphology, constraint, modularity, monkey
1. Introduction
Complex traits evolve, in part, through multivariate selection pressures acting upon multiple covarying phenotypes. One way of understanding these selection pressures and how they result in evolutionary change is to investigate patterns of integration among phenotypes in living organisms. Genetic pleiotropy, or shared genetic contributions to multiple phenotypes, is a primary means by which parts of living organisms are integrated to form a functioning and evolvable whole (Olson and Miller, 1958; Lande and Arnold, 1983; Klingenberg, 2008). The primate dentition is especially useful for understanding patterns of genetic integration because it consists of discrete parts, i.e., individual teeth, that have evolved specialized morphologies yet function in combination with other structures during such crucial activities as mastication and communication, among others. In other words, the interrelationships of individual teeth, tooth types, and functional sets of teeth present an opportunity to study the impacts of genetic integration on the evolution of complex traits. Additionally, dental remains are well represented in the primate fossil record so that studies of genetic integration in primate teeth can inform, and be informed by, paleoanthropological analyses of primate evolution (Grieco et al., 2013; Hlusko, 2016; Cramon-Taubadel, 2019).
Evolutionary and developmental study of dental morphology has generated several theories of dental patterning, including the morphogenetic field model (Butler, 1939), the clone model (Osborn, 1978), the odontogenic homeobox code (Thesleff and Sharpe, 1997), and the inhibitory cascade model (Kavanagh et al., 2007). The morphogenetic field model has been applied to human dental variation (Dahlberg, 1945) and the combined field, clone, and homeobox code models have been clinically useful in humans (Mitsiadis and Smith, 2006; Townsend et al., 2009). The inhibitory cascade model also describes patterns of variation and covariation among primate species (Schroer and Wood, 2015; Evans et al., 2016; Hlusko, 2016). Divergence from the patterns predicted by the inhibitory cascade model also indicates considerable population-level variation in the genetic and developmental structures that maintain relationships between teeth and between tooth types (Bernal et al., 2013; Halliday and Goswami, 2013; Carter and Worthington, 2016; Roseman and Delezene, 2019).
Patterns of genetic integration and modularity can be expected to impact the evolution of the dentition since interactions between multivariate selection pressures and genetically correlated traits will produce different phenotypic responses to selection than would be predicted in a univariate model (Lande, 1979; Lande and Arnold, 1983; Hansen, 2003). Greater integration is expected to constrain the response to selection of a single trait, while modular structures would have greater potential to evolve independently by maintaining covariation between functionally dependent parts and reducing covariation between modules with different functions (Wagner et al., 2007; Klingenberg, 2008; Griswold, 2006; Hansen, 2006).
Among primates, heritabilities and genetic correlations of tooth dimensions have been assessed in baboons, humans, and brown-mantled tamarins with varying results. Incisor and postcanine genetic modules have been inferred in baboons based on negative and near-zero genetic correlations between incisor and postcanine tooth dimensions, and moderate to high genetic correlations between postcanine tooth dimensions (Hlusko and Mahaney, 2009; Hlusko et al., 2011). Genetic correlations estimated from baboons reflect evolutionary trends observed across cercopithecoid taxa (Grieco et al., 2013), suggesting that cercopithecoids broadly share a genetic structure comprising anterior and postcanine modules with premolar and molar submodules. In contrast, humans (Stojanowski et al., 2017) and brown-mantled tamarins (Hardin, 2019a) have shown moderate to high genetic correlations across tooth types as well as between anterior and postcanine tooth dimensions. That humans and tamarins do not exhibit the same pattern as baboons indicates a need to test for population- and species-level variation in the structure of the genetic correlation matrix. Matrices representing hypotheses of complete integration, modularity by tooth type and region, and developmental and functional modularity can be compared to the genetic correlation matrix to determine whether the genetic correlation matrices of different populations and species exhibit distinct structures.
Selection on canine size is primarily associated with the use of canines in threat displays and agonistic encounters in extant primates (Plavcan et al., 1995; Plavcan and Kelley, 1996; Plavcan, 1998), raising the possibility of some evolutionary independence of the canines from other tooth types which are primarily involved in mastication, yet there are currently no estimates of genetic correlations in the canine teeth of any cercopithecoid primate. Maxillary canine lengths are significantly genetically correlated with maxillary incisor, premolar and molar lengths in humans; fewer correlations in the mandibular dentition are significant (Stojanowski et al., 2017). Similarly, brown-mantled tamarin canine dimensions are significantly genetically correlated with dimensions of every tooth type (Hardin, 2019a). Studies of human canine reduction have hypothesized several possible genetic constraints on canine size, including pleiotropic effects between canines and incisors (Jolly, 1970) and between the mandibular canine and the honing premolar (Greenfield, 1993). Because humans and tamarins exhibit greater genetic correlations between tooth types than baboons, the pattern of genetic correlations observed in human and tamarin canines seems unlikely to represent the pattern exhibited by cercopithecoids. Furthermore, the canine-premolar honing complex, formed by the canines and mesial-most mandibular premolar of most anthropoid primates, is highly sexually dimorphic in most cercopithecoid primates compared to other primate taxa (Zingeser, 1969; Plavcan, 2001; Swindler, 2002). The cercopithecoid honing premolar is also morphologically distinct from the other mandibular premolars in having an elongated honing facet (Zingeser, 1969). Given the functional relationships among the teeth of the honing complex and the degree to which they are functionally independent from other teeth, patterns of genetic or developmental integration and modularity may contribute to the maintenance of the honing complex (Wagner et al., 2007; Delezene, 2015), particularly in taxa for which the canine and honing complex are most socioecologically significant such as cercopithecoid primates.
The present study estimates genetic correlations between dental dimensions of the Cayo Santiago rhesus macaques to assess the structure of the genetic correlation matrix compared to other primate taxa and compared to several hypothetical matrices to test for patterns modularity by tooth type, region, function, and development. Estimation of genetic correlations requires large phenotypic datasets from populations with known pedigrees, and samples with the necessary data to estimate genetic correlations in primate dental traits are rare. Due to these limitations, the phenotypic correlation matrix is often substituted for the genetic correlation matrix in primates (Cheverud, 1988; Roseman et al., 2009; Grabowski, 2016). To assess this substitution, the relationship between the genetic and phenotypic correlation matrices is also assessed in this rhesus macaque population. This study builds upon previous quantitative genetic analyses of cercopithecoid dental traits to examine patterns and magnitudes of genetic correlations of dental dimensions in rhesus macaques, and to assess whether the canines and honing premolar are genetically related to the surrounding teeth and how patterns of genetic modularity vary across the cercopithecoid and primate dentitions.
2. Materials and methods
2.1. Population and pedigree
Approximately 400 rhesus macaques from northern India were introduced to Cayo Santiago in 1938 as a free-ranging population for biomedical and behavioral research (Dunbar, 2012). Records of maternal parentage have been collected since the early 1950s and skeletal materials have been collected and maintained since 1971 (Rawlins and Kessler, 1986). The rhesus macaque population has been systematically maintained since 1969, and the population contains approximately 1,000 individuals (Dunbar, 2012).
Although many paternal identities in the Cayo Santiago macaque population have been determined through genetic testing (Widdig et al., 2016), paternities, hereafter referred to as sires, are not known for most individuals in the skeletal collection. To maximize the use of individuals from this population, those with known mothers, hereafter referred to as dams, were assigned a distinct ‘dummy sire’ assuming that all individuals with the same dam are half-siblings (following Konigsberg and Cheverud, 1992; Joganic et al., 2012). The impact of assuming half-siblings compared to full-siblings has been assessed for this population, and different dummy sire configurations did not alter the significance or interpretation of the results, although full-sibling heritability estimates were smaller than those from half-sibling analyses (Hardin, 2019b). The pedigree data used in this study consisted of a total of 105 separate pedigrees representing 773 individuals, including 17 individuals unrelated to any others. The pedigrees overall contain 105 founders (104 females, 1 male), 334 individuals with known dams (155 females, 179 males), and 334 dummy sires. The exact relationships present in each analysis varied by trait, and a summary of these relationships is provided (Table 1).
Table 1.
Minimum, median and maximum numbers of relationships represented in the pedigrees across all traits.
| Minimum | Median | Maximum | |
|---|---|---|---|
| Self | 213 | 282.5 | 341 |
| Parent-Offspring | 42 | 113.5 | 167 |
| Grandparent-Grandchild | 14 | 49.0 | 79 |
| Half-Sibling | 121 | 234.0 | 341 |
| Third degree | 149 | 256.5 | 405 |
| Fourth degree | 79 | 146.0 | 216 |
| Fifth degree | 31 | 52.0 | 79 |
| Sixth degree | 16 | 26.5 | 40 |
| Seventh degree | 4 | 8.0 | 12 |
2.2. Dental measurements
Maxillary and mandibular permanent tooth mesiodistal crown lengths and buccolingual crown breadths were measured in 365 skeletonized rhesus macaque (Macaca mulatta) skulls at the Caribbean Primate Research Center at the University of Puerto Rico. All specimens were measured using Mitutoyo nib-style digital calipers (accurate to the nearest 0.01 mm) with a digital input tool to minimize error during data transcription. For incisors, premolars, and molars, mesiodistal crown length was measured as the maximum length parallel to the lingual edge of the tooth crown (Swindler, 2002; Fig. 1). Buccolingual crown breadth was measured as the maximum width perpendicular to the lingual edge of the tooth crown. For canines, mesiodistal lengths were measured as the maximum mesiodistal length, and the buccolingual breadth was measured perpendicular to the length measurement. Measurements were not collected from teeth exhibiting noticeable wear or enamel breakage that was thought to alter the length or breadth measurement.
Figure 1.

Measurements (in blue) taken from the maxillary (left) and mandibular (right) dentition of Macaca mulatta (figure modified from Swindler, 2002).
Previous studies have consistently shown that antimeres are highly genetically correlated, with genetic correlation estimates ranging from 0.89 to 1.00 in baboons (Hlusko et al., 2011) and from 0.96 to 1.00 in humans (Stojanowski et al., 2017), so the left and right sides of the toothrow were considered interchangeable. Only one side of the toothrow, that with the least damage or fewest missing teeth, was measured for each individual. There were no statistically significant differences (p > 0.05) between dimensions from the left and right sides of the toothrow based on unpaired t-tests performed in R (version 3.6.2). Intraobserver measurement reliabilities for these data have been previously assessed (Hardin, 2019a) and are provided in Table 2.
Table 2.
| Maxillary | Mandibular | |||
|---|---|---|---|---|
| MD | BL | MD | BL | |
| I1 | 0.96 | --- | 0.69 | --- |
| I2 | 0.99 | --- | 0.99 | --- |
| C | 0.97 | 0.99 | 0.97 | 0.99 |
| P3 | 0.83 | 0.97 | 0.93 | 0.95 |
| P4 | 0.85 | 0.95 | 0.69 | 0.91 |
| M1 | 0.93 | 0.88 | 0.95 | 0.93 |
| M2 | 0.95 | 0.91 | 0.96 | 0.91 |
| M3 | 0.97 | 0.97 | 0.98 | 0.94 |
MD = mesiodistal length, BL = buccolingual breadth. Low reliabilities (< 0.80) are bolded.
Incisor buccolingual breadths were not collected due to the effects of tooth wear.
2.3. Quantitative genetic analyses
Narrow-sense heritabilities (h2) were estimated in the software package SOLAR (version 8.1.1) using maximum likelihood-based variance decomposition (Almasy and Blangero, 1998). The narrow-sense heritability is the proportion of the total phenotypic variance in a trait resulting from additive genetic variance (Lynch and Walsh, 1998). Kurtosis was calculated for each trait in SOLAR and was greater than 1.0 in five traits and greater than 2.0 in two traits. Although inverse normalization is recommended in SOLAR for trait distributions with kurtosis greater than 0.8 (Almasy and Blangero, 1998), relative kurtosis is considered acceptable between −2 and 2 (George and Mallery, 2010) and even between −7 and 7 (Byrne, 2016). Inverse-normalization was therefore not performed to ensure that all quantitative genetic analyses were performed on traits with distributions of similar structure. Covariate screening was performed in SOLAR for sex, estimated age at death, and age-by-sex interaction. Likelihood ratio tests were used to assess the difference in likelihood between models in which covariate effects were or were not included and significant covariate effects (p < 0.10) were included in h2 estimation (following Hlusko et al., 2002; Sherwood et al., 2008; Stojanowski et al., 2017). The alpha for covariate testing is 0.10 by default in SOLAR to ensure inclusion of all potential covariates (Almasy and Blangero, 1998). Residual heritability estimates (h2r), with effects of significant covariates removed, and total heritability estimates (h2t) are reported. Likelihood ratio tests were used to assess the statistical significance of h2r, and h2r was considered significantly different from zero at p < 0.05 (following Hlusko et al., 2002; Stojanowski et al., 2017).
Genetic correlations (ρG) and environmental correlations (ρE) were estimated for every pair of traits through bivariate maximum likelihood-based variance decomposition in SOLAR. Only bivariate analyses of traits with h2r significantly different from zero (p < 0.05) are discussed. To estimate ρG and ρE, the phenotypic covariance is modeled as the sum of the additive genetic covariance and environmental covariance in a population, so that the phenotypic correlation (ρP) is equal to:
where h is the square root of h2 (for traits x and y), ρG is the additive genetic correlation between traits x and y, e is the square root of e2 where e2 is equal to 1-h2 (for traits x and y), and ρE is the environmental correlation between traits x and y (Falconer and Mackay, 1996). Covariates that were statistically significant in h2r estimation were included in bivariate models. Likelihood ratio tests were used to assess whether ρG was significantly different from zero and from one (p < 0.05).
Phenotypic correlations were also estimated in SOLAR so that the same proportion of variance associated with covariates is removed for phenotypic and genetic correlation estimates. The phenotypic correlation matrix was compared to the genetic correlation matrix using the random skewers approach (Cheverud, 1996; Cheverud and Marroig, 2007) in R with the phytools package ‘unifcorrmat’ method, which is intended to reduce type I error (Revell, 2012).
Additional random skewers analyses were applied to evaluate the structure of the genetic correlation matrix. The genetic correlation matrix was first compared to a matrix in which all dimensions were assumed to be completely genetically independent (a null matrix with ones on the diagonal; Supplementary Online Material [SOM] Table S1) and to a matrix in which all dimensions were assumed to be completely genetically integrated (a matrix of ones; SOM Table S2). To assess modularity by tooth type and region, the genetic correlation matrix was compared to four versions of a modular correlation matrix: i) modular by tooth type, with ones within tooth types (incisors, canines, premolars, molars) and zeros between tooth types (SOM Table S3), ii) modular by tooth type, with the canines and honing premolar forming a module (SOM Table S4), iii) modules for incisors, canines, and postcanine teeth, where the honing premolar is part of the postcanine module (SOM Table S5), and iv) modules for anterior (incisors and canines) and postcanine (premolars and molars) teeth (SOM Table S6). Functional modularity was assessed by comparing the genetic correlation matrix to a matrix in which correlations were equal to one between teeth that either occlude or are adjacent, and correlations are otherwise equal to zero (SOM Table S7). Developmental modularity was assessed by comparing the genetic correlation matrix to a matrix in which correlations were equal to one between teeth that erupt simultaneously or directly before or after each other, and are otherwise equal to zero, based on the established eruption sequence in this population (Wang et al., 2016; SOM Table S8). In each case, the same rule was applied to correlations within and between the maxillary and mandibular teeth. Matrices were considered significantly related at p < 0.05, and mean random skewers correlation values are provided and discussed.
3. Results
3.1. Pedigree structure
The pedigree includes 17 individuals unrelated to any others. The remaining 756 individuals are divided among 88 families. Assigning dummy sires under the assumption that individuals are half-siblings likely increases the number of separate families represented by the pedigree, so this is a conservative representation of the Cayo Santiago rhesus macaque population’s pedigree.
3.2. Heritabilities
Twenty-four of the 28 h2r estimates were significantly greater than zero (Table 3), and h2r estimates ranged from 0.05 (C1 breadth) to 1.00 (M3 length). Estimates of h2r for four measurements (M1 breadth, C1 breadth, P3 length, M1 breadth) were not significantly (p > 0.05) different from zero. Sex was a significant (p < 0.10) covariate for all 28 traits. Age was a significant (p < 0.10) covariate for thirteen traits, and age-by-sex interaction was a significant (p < 0.10) covariate for eight traits. Covariates accounted for 9.0%–93.3% of the phenotypic variance in a trait.
Table 3.
| Tooth | Trait | N | Male mean | Female mean | h2r | p-value | SE | Sex | Age | Sex by Age | σ2C | Kurtosis | h2t |
|---|---|---|---|---|---|---|---|---|---|---|---|---|---|
| I 1 | MD | 258 | 6.38 | 6.10 | 0.89 | <0.001 | 0.24 | • | 0.14 | 0.05 | 0.76 | ||
| I 2 | MD | 266 | 5.10 | 4.67 | 0.40 | 0.016 | 0.22 | • | 0.38 | 0.41 | 0.25 | ||
| C 1 | MD | 246 | 9.16 | 5.98 | 0.89 | <0.001 | 0.18 | • | 0.86 | 2.04 | 0.12 | ||
| BL | 251 | 7.38 | 5.18 | 0.89 | <0.001 | 0.19 | • | • | • | 0.86 | 0.64 | 0.13 | |
| P 3 | MD | 332 | 5.40 | 5.07 | 0.55 | <0.001 | 0.16 | • | • | 0.26 | 0.89 | 0.40 | |
| BL | 337 | 6.54 | 6.27 | 0.71 | <0.001 | 0.15 | • | 0.16 | 0.01 | 0.60 | |||
| P 4 | MD | 336 | 5.38 | 5.23 | 0.55 | <0.001 | 0.15 | • | • | 0.09 | 0.09 | 0.50 | |
| BL | 332 | 7.06 | 6.75 | 0.57 | <0.001 | 0.14 | • | • | 0.21 | 0.08 | 0.45 | ||
| M 1 | MD | 335 | 7.74 | 7.52 | 0.70 | <0.001 | 0.19 | • | • | 0.16 | 0.03 | 0.58 | |
| BL | 263 | 7.36 | 7.06 | 0.22 | 0.111 | 0.19 | • | 0.19 | 0.84 | 0.18 | |||
| M 2 | MD | 341 | 8.98 | 8.62 | 0.46 | <0.001 | 0.15 | • | 0.18 | 0.49 | 0.38 | ||
| BL | 306 | 8.71 | 8.21 | 0.72 | <0.001 | 0.16 | • | • | 0.31 | 0.24 | 0.49 | ||
| M 3 | MD | 259 | 9.16 | 8.57 | 0.41 | 0.003 | 0.17 | • | • | • | 0.42 | 0.18 | 0.23 |
| BL | 251 | 8.70 | 8.13 | 0.63 | <0.001 | 0.16 | • | • | • | 0.38 | 0.07 | 0.39 | |
| I 1 | MD | 254 | 4.27 | 4.11 | 0.54 | 0.002 | 0.20 | • | 0.10 | 0.32 | 0.48 | ||
| I 2 | MD | 241 | 4.06 | 3.89 | 0.45 | 0.001 | 0.17 | • | 0.11 | 0.12 | 0.40 | ||
| C 1 | MD | 235 | 5.53 | 3.79 | 0.54 | 0.015 | 0.25 | • | • | • | 0.86 | 1.18 | 0.07 |
| BL | 213 | 9.11 | 5.54 | 0.05 | 0.398 | 0.20 | • | • | 0.93 | 1.09 | 0.00 | ||
| P 3 | MD | 310 | 10.68 | 6.99 | 0.21 | 0.086 | 0.18 | • | • | • | 0.81 | 0.75 | 0.04 |
| BL | 303 | 4.83 | 4.21 | 0.54 | 0.003 | 0.23 | • | 0.50 | 0.03 | 0.27 | |||
| P 4 | MD | 322 | 5.93 | 5.73 | 0.64 | <0.001 | 0.14 | • | • | • | 0.11 | 0.35 | 0.57 |
| BL | 317 | 5.19 | 5.03 | 0.49 | <0.001 | 0.16 | • | 0.09 | 0.73 | 0.44 | |||
| M 1 | MD | 299 | 7.58 | 7.34 | 0.58 | 0.007 | 0.24 | • | • | 0.19 | 1.11 | 0.47 | |
| BL | 236 | 5.98 | 5.76 | 0.50 | 0.092 | 0.43 | • | 0.19 | 0.19 | 0.41 | |||
| M 2 | MD | 332 | 8.73 | 8.43 | 0.55 | 0.001 | 0.19 | • | 0.14 | 0.97 | 0.48 | ||
| BL | 305 | 7.30 | 7.01 | 0.41 | 0.003 | 0.17 | • | • | 0.20 | 2.08 | 0.33 | ||
| M 3 | MD | 256 | 10.92 | 10.58 | 1.00 | <0.001 | --- | • | 0.09 | 0.64 | 0.91 | ||
| BL | 253 | 7.69 | 7.29 | 0.59 | <0.001 | 0.15 | • | • | 0.28 | 0.34 | 0.43 |
h2r = residual heritability estimate with bolded values significantly different from zero (p < 0.050); σ2C = proportion of phenotypic variance removed by statistically significant covariation (p < 0.100) with sex, age, and sex by age ; h2t = total heritability estimate.
Traits for which sex, age, and/or sex by age were significant covariates (p < 0.100) are marked with dots.
Traits with low measurement reliability are highlighted in grey.
SE could not be estimated for heritabilities equal to 1.00
3.3. Bivariate analyses
Estimates of ρG ranged from −0.04 to 1.00 between traits with h2r significantly (p < 0.05) different from zero (Table 4). Of 78 ρG estimates within the maxilla, 37 were significantly (p < 0.05) different from zero. Within the mandible, 33 of 55 ρG estimates were significantly different from zero (p < 0.05). Between maxillary and mandibular traits, 78 of 143 ρG were significantly (p < 0.05) different from zero. Details of all bivariate analyses, including those of traits with nonsignificant h2r, are provided in SOM Table S9.
Table 4.
Results of genetic correlation estimation. Left of diagonal cells contain genetic correlation estimates, right of diagonal cells contain corresponding standard error estimates.a–b
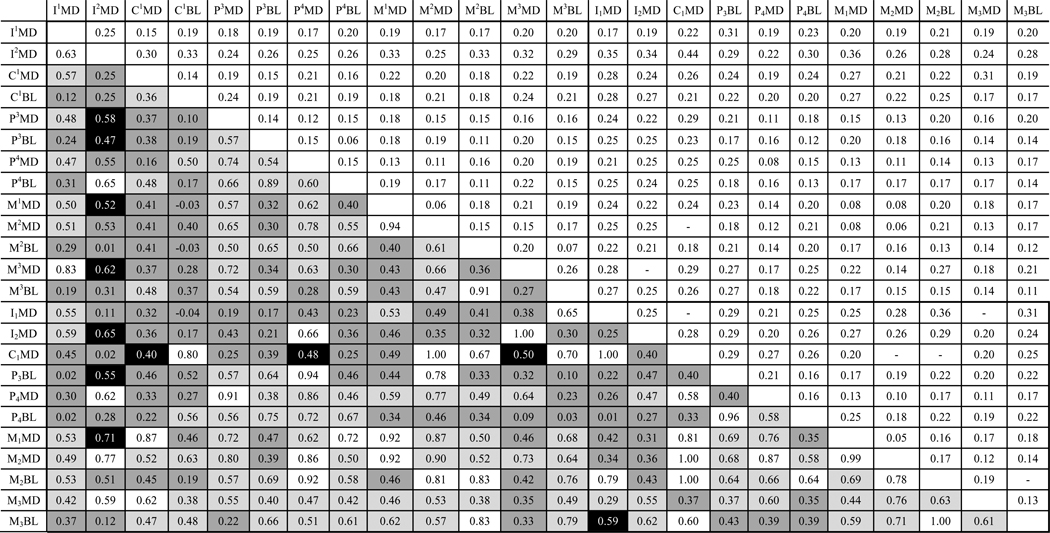
|
White, significantly different (p < 0.05) from zero but not from one; pale grey, significantly different from zero and from one (p < 0.05); dark grey, not significantly different from zero (p > 0.05); black, not significantly different from zero or one (p > 0.05).
SE could not be estimated for genetic correlations equal to 1.00.
Estimates of ρG between the four measures of the canines and honing premolar included in bivariate analyses ranged from 0.36–0.80, with two of the six estimates differing significantly (p < 0.05) from zero (Table 4). By comparison, ρG estimates between canine-honing premolar traits and traits outside the honing complex ranged from −0.04 (C1BL and I1MD) to 1.00 (C1MD and M2MD, M2MD and M2BL). Maxillary and mandibular canine dimensions exhibited more significant genetic correlations with mandibular molar dimensions than with maxillary molar dimensions.
Estimates of ρG tended to be lower in the anterior teeth (incisors, canines) and greater in the postcanine teeth (premolars, molars). This trend was apparent both within the maxilla and mandible and between them. Mandibular molar dimensions were closely genetically correlated with dimensions of almost all maxillary teeth, ranging from 0.12–0.92 with 50 of 65 ρG estimates being significantly different (p < 0.05) from zero. Maxillary molar dimensions were also closely genetically correlated with dimensions of mandibular teeth, ranging from 0.03–1.00, with 31 of 55 ρG estimates significantly different (p < 0.05) from zero. Phenotypic correlations (ρP) ranged from 0.07–0.82 (Table 5), and were generally greatest between postcanine tooth dimensions both within and between the maxilla and mandible. Based on random skewers, the genetic correlation matrix was significantly (p < 0.01) related to the phenotypic correlation matrix (r = 0.87; Table 6).
Table 5.
Phenotypic correlations in maxillary and mandibular tooth dimensions.a

|
White, > 0.50; pale grey, > 0.25 and ≤ 0.50; dark grey, ≤ 0.25.
Table 6.
Results of random skewers analyses testing correlations between the genetic correlation matrix and test matrices.a
| Test matrix | r | p-value |
|---|---|---|
| Phenotypic correlation matrix | 0.87 | <0.01 |
| All dimensions are independent | 0.41 | 1.00 |
| All dimensions are completely integrated | 0.70 | <0.01 |
| Modular by tooth type (I, C, P, M) | 0.59 | 0.03 |
| Modular by tooth type with separate canine-honing premolar module (I, CPHC, P, M) | 0.58 | 0.17 |
| Modular by region (I, C, postcanine teeth) | 0.60 | <0.01 |
| Modular by region (anterior, postcanine) | 0.64 | 0.01 |
| Functional modularity | 0.57 | 0.09 |
| Developmental modularity | 0.55 | 0.38 |
r = mean skewers correlation; bolded values are significant (p < 0.05).
The genetic correlation matrix was also significantly related to the fully integrated test matrix (r = 0.70, p < 0.01) and was not significantly related to the fully independent test matrix (r = 0.41, p = 1.00; Table 6). Compared to four different test matrices representing different forms of modularity by tooth type and region, the genetic correlation matrix was most closely related to a matrix with an anterior (incisor-canine) module and a postcanine (premolar-molar) module (r = 0.64, p = 0.01). The genetic correlation matrix was, however, significantly related to all the modular matrices excepting the matrix that is modular by tooth type, with the canines and honing premolar treated as a separate module (Table 6). The genetic correlation matrix was not significantly (p > 0.05) related to test matrices representing functional or developmental modularity.
4. Discussion
4.1. Heritability
The dental measurements analyzed here are moderately to highly heritable, consistent with h2 estimates from dental traits of other primate species (Townsend and Brown, 1978; Hlusko et al., 2002, 2004, 2011; Hlusko and Mahaney, 2009; Townsend et al., 2009; Koh et al., 2010; Stojanowski et al., 2017). Interpreting variation in h2 can, however, be challenging. The degree to which the environment impacts dental phenotypic variation is expected to vary according to tooth position and the timing of tooth development, yet h2 estimates for the length and breadth of a single tooth can differ considerably.
First molar breadth is the only trait in rhesus macaques with low h2 estimates in both the maxilla and mandible, but this was not the case in previous studies of baboons (Hlusko and Mahaney, 2009; Hlusko et al., 2011) or tamarins (Hardin, 2019b). Because similar methodologies were applied across these three populations, this may indicate a species- or population-level effect on the heritability of first molar breadth. Measurement error and unobserved impacts of wear could also reduce h2 estimates for dental measurements. There is no clear relationship between measurement reliability and h2; measurement reliability was reduced for M1 breadth but high for C1 breadth, P3 length, and M1 breadth, and measurements with especially low measurement reliability (I1 length and P4 length) had significant h2r estimates.
Wear, and its impact on the sample size, are more likely explanations for these low heritability estimates. First molars are in functional occlusion longer than other permanent molars (Wang et al., 2016) and are generally more worn in rhesus macaques, especially along the lingual cusps in the maxillary molars and the buccal cusps in the mandibular molars. As a result, more first molars were excluded from breadth measurement due to wear or enamel breakage and those first molar breadths that were included may have exhibited more wear than other tooth dimensions. The smaller first molar sample (n = 236–263) may not have been adequate for h2r estimation. Likewise, low h2r estimates for C1 breadth and P3 length may result from the effect of wear both on the sample size and its introduction of environmental variance. The buccal surfaces of C1 and P3 are expected to wear considerably in occlusion with C1 (Zingeser, 1969), and C1 breadth has the smallest sample in the dataset, which may interfere with adequate h2 estimation. Variation in tooth crown dimensions introduced by the effects of wear is accounted for to some extent by the correction for age, sex, and their interaction, but wear is still a possible explanation for the nonsignificant h2r estimates of first molar breadths, C1 breadth, and P3 length.
Common environmental effects on related individuals could explain some of the variation in h2 and should be examined closely in studies of wild and free-ranging populations (Pemberton, 2010). Rank and birth order may have significant impacts on dental development and tooth size (Galbany et al., 2015). Since female rhesus macaques inherit rank through their matriline, closely related females may have access to similar foods and experience similar social and environmental stresses during odontogenesis. These common environmental effects could elevate h2 for some dental traits, producing differences in h2 that reflect environmental differences between matrilines or between individuals rather than differences in genetic variance or evolvability. Provisioning of the rhesus macaques at Cayo Santiago may moderate the impact of rank or matriline on differences in dental development (Galbany et al., 2015), but this should nevertheless be taken into account in future analyses and discussion. Further study of the impact of common environmental effects on dental development will help to address the possible impacts of shared environment on the heritability of dental features.
4.2. Genetic correlations
Genetic correlation estimates from the Cayo Santiago rhesus macaques are generally positive, and demonstrate a strong genetic contribution to morphological patterning in the maxillary and mandibular teeth. Within the maxilla, high genetic correlations between postcanine tooth dimensions and weak genetic correlations between anterior and postcanine tooth dimensions indicate genetic contributions to incisor and canine dimensions are somewhat independent from genetic contributions to premolar and molar dimensions. Within the mandible, canine length and postcanine dimensions are significantly genetically correlated, and incisor dimensions are significantly genetically correlated with few measurements of other tooth types. Genetic correlations between maxillary and mandibular tooth dimensions are especially weak for incisor measurements, but are moderate to high between premolar and molar dimensions.
Based on random skewers analyses, the genetic correlation matrix is most closely related to a matrix in which all dental dimensions are fully correlated (Table 6). Of the modular matrices to which the genetic correlation matrix was compared, it is most similar to a matrix in which the anterior (incisors, canines) and postcanine (premolars, molars) teeth represent two distinct modules. These findings are broadly similar to patterns of genetic modularity identified in baboons, in which incisors were found to be genetically independent of, or negatively correlated with, premolars and molars, and premolar dimensions were weakly positively correlated with molar dimensions (Hlusko and Mahaney, 2009; Hlusko et al., 2011).
The genetic correlation matrix was not significantly correlated with either the functional or the developmental modularity test matrix. The former indicates that the pattern of modularity observed in the dentition is more strongly associated with tooth type or region, than with the proximity or occlusal relationships of teeth. The latter also indicates that tooth type or region is more strongly associated with the pattern of genetic correlation than is developmental timing. Altogether, these results provide evidence that the genetic factors that contribute to tooth size and morphology are regional, and are shared weakly between regions — even between teeth that erupt at the same time — in a manner consistent with the odontogenic homeobox code (Sharpe, 1995; Mitsiadis and Smith, 2006) and morphogenetic gradient (Kangas et al., 2004) concepts of dental morphogenesis.
4.3. Comparing phenotypic and genetic correlations
The dental dimensions of the Cayo Santiago macaques are all positively phenotypically correlated with each other and most of these phenotypic correlations are significantly different from zero. Although a larger proportion of phenotypic than genetic correlations are significantly different from zero, there is a similar tendency in both matrices for correlations to be weakest in the anterior teeth and strongest in the premolars and molars. Because most of the h2r estimates for the traits included in bivariate analyses are moderate to high, the two correlation matrices are expected to be similar (Falconer and Mackay, 1996). This is supported by the statistically significant (p < 0.01) relationship between the genetic and phenotypic correlation matrices (Table 6).
The comparison of ρG and ρP provided here supports the conjecture that well-estimated genetic correlations may not differ substantially from phenotypic correlations for highly heritable traits like dental dimensions (Cheverud, 1988). However, similarity between ρP and ρG also depends upon the sign and magnitude of ρE. The Cayo Santiago rhesus macaques are provisioned and experience less variation in food quality than might be typical in the environment of a wild rhesus macaque population, and it is possible that ρE values in this population are not typical of a natural population. In addition, low h2 estimates for a few dental traits demonstrate that not all dental traits are necessarily highly heritable in every population. Even in the provisioned Cayo Santiago rhesus macaque population, the correlation between the phenotypic and genetic correlation matrices is less than 1.00 (r = 0.87). Since ρG and ρP may differ more when heritabilities are low and heritabilities may be lower in populations without provisioning, there is some need to consider these factors when using phenotypic correlations as proxies for genetic correlations in wild populations, even in traits that are generally highly heritable.
4.4. Sexual dimorphism
Sex differences in rhesus macaque tooth dimensions are expected to impact the heritability of tooth size. Variance associated with sex differences was removed prior to quantitative genetic analyses, but this method does not account for the possibility that h2 and ρG estimates could differ between males and females. Estimation of intersexual genetic correlations and separate male and female heritabilities would best indicate the influence of sex on these quantitative genetic parameters (Wolak et al., 2015). At present, the phenotypic and pedigree data are inadequate to reliably estimate sex-specific h2 in the Cayo Santiago rhesus macaques using maximum likelihood-based variance decomposition, but it may be possible to estimate these parameters with different analytical approaches, a larger sample, or more complete pedigree information.
4.5. Body size
Dental, especially postcanine, dimensions have been shown to be strongly correlated with body size, within and between mammalian species (Gould, 1975; Gingerich, 1977; Gingerich et al., 1982; Leamy, 1985; Copes and Schwartz, 2010; Ungar, 2014). Hlusko et al. (2006) identified significant genetic correlations between trunk length and molar buccolingual breadths, but not molar mesiodistal lengths in baboons. Despite these correlations with trunk length, genetic correlations between body mass and dental dimensionswere not significant (Hlusko et al., 2006). An overall body size effect on all or most dental dimensions could contribute to the generally positive genetic correlations observed here, yet it may be unreasonable to expect that body size will be equally genetically correlated across tooth types and dimensions, given the greater correlations with tooth breadths than lengths observed in baboons. Instead, accounting for body size could have unpredictable effects on the dental genetic correlation matrix and could alter the patterns of dental modularity and integration observed in rhesus macaques, baboons, humans, and tamarins.
4.6. Variation in the dental genetic correlation matrix among primates
Interpretations of genetic correlations should account for the changeability of genetic correlation matrices over generations. Selection pressures and other evolutionary mechanisms impact the genetic structures underlying genetic correlations, primarily pleiotropic genes, just as they impact the heritability of traits. Consistent patterns of genetic correlations across species can, however, indicate stability in the genetic covariance matrix over evolutionary time periods (Lynch and Walsh, 1998).
Previous studies have estimated genetic correlations between dental measurements in baboons (Hlusko and Mahaney, 2009; Hlusko et al., 2011), brown-mantled tamarins (Hardin, 2019a), and humans (Stojanowski et al., 2017). When combined with the results from the Cayo Santiago rhesus macaques, two general genetic correlation matrix structures are apparent (Fig. 2). The two cercopithecoid species exhibit a more modular pattern, with weak correlations between anterior and postcanine teeth and stronger correlations within the anterior and postcanine teeth. This pattern is more exaggerated in baboons than rhesus macaques. Humans and tamarins exhibit greater genetic correlations across tooth types and regions of the tooth row than baboons and rhesus macaques, although patterns may be unclear due to missing information about molars in humans and incisors in tamarins. The addition of rhesus macaques to this literature demonstrates that the modular pattern observed in baboons is likely a more widely shared cercopithecoid pattern, as phenotypic analyses have indicated (Grieco et al., 2013). Analyses of additional hominoid and platyrrhine primates are needed to determine whether the observed human-tamarin pattern of integration is shared with other primate taxa.
Figure 2.

Heatmaps of genetic correlations between mesiodistal tooth lengths from rhesus macaques, baboons (from Hlusko et al., 2011), humans (from Stojanowski et al., 2017), and brown-mantled tamarins (from Hardin, 2019a). Correlation estimates are colored from red (low) to yellow (moderate) to green (high). Cells containing measurements that were either not collected or not analyzed are left empty.
In the four taxa included in quantitative genetic studies of dental dimensions, there is a weak positive relationship between facial prognathism and genetic modularity in the teeth. Relationships between facial and dental morphology have been recorded previously; in humans, for example, a protrusive mandible is significantly associated with mesiodistally elongated mandibular first molars (Polychronis and Halazonetis, 2014). This association does not test, however, the degree to which the overall patterning of the dentition is associated with different craniofacial morphologies. Quantitative genetic analyses and phenotypic analyses including both craniofacial and dental features could help to resolve the strength of this relationship. The loss of the mesial-most premolar in catarrhine primates could also have unknown effects on the genetic correlations between anterior and postcanine teeth. These effects could be expected to depend on the patterning of morphogenetic fields, specifically in the premolar region. If there is no premolar field, as described by Butler (1939), premolar loss would bring the canine and molar fields closer together, possibly creating greater overlap of these fields in the premolar region which might be expected to increase integration across tooth types. Alternatively, Dahlberg (1945) described a premolar field in humans, reduction of which could potentially weaken the effect size of the premolar field thereby decreasing integration between morphogenetic fields. Quantitative genetic study of additional platyrrhine or strepsirrhine primates would be necessary to test these hypotheses.
4.7. Genetic correlations in the canines and honing premolar
The present study also sheds light on genetic relationships between canines and other tooth types in a cercopithecoid primate. The cercopithecoid canine-premolar honing complex has numerous compelling properties for those interested in the evolution of functional modules. The canines and honing premolar are formed through the same genetic and developmental processes that form all teeth, and are therefore expected to be genetically correlated to some degree with other teeth despite their non-masticatory function. Reduction of the honing complex in the hominin lineage has been particularly well studied, and has motivated hypotheses of canine genetic patterning. Jolly (1970) hypothesized that canine reduction in the hominin lineage could have resulted from incisal reduction through pleiotropic effects, and Greenfield (1993) hypothesized that close morphological relationships between the mandibular canine and honing premolar result from pleiotropic effects of their overlapping morphogenetic fields. Low-to-moderate genetic correlations between incisor and canine dimensions in rhesus macaques fail to support Jolly’s hypothesis (1970), although the incisors and canines may be more closely genetically correlated with each other than either is with premolars or molars. Contrary to Greenfield’s hypothesis (1993), genetic correlations between the canines and the honing premolar are found to be weak and the genetic correlation matrix is not significantly correlated with the test matrix in which the canines and honing premolar are treated as a module. The hypotheses of both Jolly (1970) and Greenfield (1993) are supported insofar as dimensions of the canines and honing premolar are genetically correlated with other tooth types and should not be expected to evolve independently of the rest of the dentition.
The pattern of phenotypic covariation in the anthropoid honing complex is broadly consistent with the genetic correlations estimated in macaques. Both phenotypic and quantitative genetic methods identify incomplete pleiotropy among canine and honing premolar dimensions and among incisor, canine, and postcanine dimensions (Delezene, 2015). In the Cayo Santiago rhesus macaques, honing premolar breadth is closely genetically correlated with postcanine tooth dimensions and weakly genetically correlated with canine dimensions. The overall size of the honing premolar may therefore be affected and constrained by selection acting upon premolar and molar dimensions. These genetic relationships among the canines, honing premolar, and postcanine teeth are consistent with phenotypic observations across primate species and with the mosaic pattern of honing complex reduction observed in the hominin lineage (Delezene, 2015). Based on the genetic correlation matrix, the canines and honing premolar do not comprise a strong genetic module, and honing premolar breadth is as closely correlated with other premolar dimensions as with canine dimensions. These findings indicate that ongoing selection pressures, rather than strong genetic constraints, are necessary to preserve functional relationships between the canines and honing premolar.
The degree to which genetic integration throughout the toothrow varies across additional primate and mammal populations should be examined further to determine how the patterns identified here and in baboon, human, and tamarin populations relate to the evolution of the dentition more broadly. The Cayo Santiago rhesus macaques provide a rare opportunity to estimate quantitative genetic parameters of skeletal and dental morphology. Continued collection of behavioral data, genetic material, and skeletal remains from the Cayo Santiago rhesus macaques will increase the power with which quantitative genetic parameters can be estimated, which will be necessary to understand the roles of genes, sex, and environment in primate dental patterning and its evolution.
Conclusions
The dental dimensions of the Cayo Santiago rhesus macaques are highly heritable, with predominantly positive and significant genetic correlations across maxillary and mandibular teeth. The macaque dental genetic correlation matrix is significantly associated with the phenotypic correlation matrix and several modular test matrices. The most strongly correlated modular test matrix indicates two regional modules, one in the anterior and one in the postcanine dentition. The macaque genetic correlation matrix is not significantly associated with functionally or developmentally modular test matrices. This pattern of modularity is similar to that expressed in the genetic correlation matrix of baboon dental measurements based on previous studies (Hlusko and Mahaney, 2009; Hlusko et al., 2011), indicating that this genetic correlation matrix structure may be stable and evolutionarily conserved across cercopithecoid primates. Finally, this study extends our understanding of dental genetic correlations to the cercopithecoid canine teeth and provides novel information about genetic relationships between teeth in primates more broadly.
Supplementary Material
Acknowledgments
Acknowledgements
I thank Terry Kensler for curating the skeletal collection in the Laboratory of Primate Morphology at the Caribbean Primate Research Center. Thank you also to Karla Eyeri for additional assistance during data collection. I am grateful to the Cayo Santiago research team and Caribbean Primate Research Center for establishing the rhesus macaque skeletal collection and pedigree. The Laboratory of Primate Morphology and Genetics at the Caribbean Primate Research Center is supported by the Office of Research Infrastructure Programs (ORIP) of the National Institutes of Health (NIH) through grant no. 5P40OD012217.
These data and analyses were included in my doctoral dissertation and I thank my Ph.D. advisor, Kieran McNulty, and committee, Ruth Shaw, Martha Tappen, and Michael Wilson, for their support and comments. I also give my thanks to the reviewers, associate editor, and editor Dr. Andrea Taylor, whose comments greatly improved the manuscript. Data collection was supported by NSF Graduate Research Fellowship no. 00039202, and analyses and writing were supported by NSF Dissertation Improvement grant no. 1650802 and NIH NIDCR F32 DE029104.
Funding Sources: National Institutes of Health, Grant/Award Numbers: Office of Research Infrastructure Program Grant No, 5P40OD012217; National Institute of Dental and Craniofacial Research Grant No, F32DE029104. National Science Foundation, Grant/Award Numbers: Dissertation Improvement Grant No. 1650802; Graduate Research Fellowship Grant No. 00039202.
Footnotes
Publisher's Disclaimer: This is a PDF file of an unedited manuscript that has been accepted for publication. As a service to our customers we are providing this early version of the manuscript. The manuscript will undergo copyediting, typesetting, and review of the resulting proof before it is published in its final form. Please note that during the production process errors may be discovered which could affect the content, and all legal disclaimers that apply to the journal pertain.
Competing Interests: The author has no competing interests to declare.
References
- Almasy L, Blangero J, 1998. Multipoint quantitative-trait linkage analysis in general pedigrees. The American Journal of Human Genetics 62, 1198–1211. [DOI] [PMC free article] [PubMed] [Google Scholar]
- Bernal V, Gonzalez PN, Perez SI, 2013. Developmental processes, evolvability, and dental diversification of New World Monkeys. Evolutionary Biology 40, 532–541. [Google Scholar]
- Butler PM, 1939. Studies of the mammalian dentition. Differentiation of the post-canine dentition. Proceedings of the Zoological Society of London B109, 1–36. [Google Scholar]
- Byrne BM, 2016. Structural Equation Modelling with AMOS: Basic Concepts, Applications, and Programming, 3rd ed. Routledge: New York. [Google Scholar]
- Carter KE, Worthington S, 2016. The evolution of anthropoid molar proportions. BMC Evolutionary Biology 16, 110. [DOI] [PMC free article] [PubMed] [Google Scholar]
- Cheverud JM, 1988. A comparison of genetic and phenotypic correlations. Evolution 42, 958–968. [DOI] [PubMed] [Google Scholar]
- Cheverud JM, 1996. Quantitative genetic analysis of cranial morphology in the cotton-top (Saguinus oedipus) and saddle-back (S. fuscicollis) tamarins. Journal of Evolutionary Biology 9, 5–42. [Google Scholar]
- Cheverud JM, Marroig G, 2007. Comparing covariance matrices: random skewers method compared to the common principal components model. Genetics and Molecular Biology 30, 461–469. [Google Scholar]
- Copes LE, Schwartz GT, 2010. The scale of it all: postcanine tooth size, the taxon-level effect, and the universality of Gould’s scaling law. Paleobiology 36, 188–203. [Google Scholar]
- von Cramon-Taubadel N, 2019. Multivariate morphometrics, quantitative genetics, and neutral theory: developing a “modern synthesis” for primate evolutionary morphology. Evolutionary Anthropology 28, 21–33. [DOI] [PubMed] [Google Scholar]
- Dahlberg AA, 1945. The changing dentition of man. Journal of the American Dental Association 32, 676–690. [Google Scholar]
- Delezene LK, 2015. Modularity of the anthropoid dentition: implications for the evolution of the hominin canine honing complex. Journal of Human Evolution 86, 1–12. [DOI] [PubMed] [Google Scholar]
- Dunbar DC, 2012. Physical anthropology at the Caribbean Primate Research Center: past, present, and future. In: Wang Q (Ed.), Bones, Genetics, and Behavior of Rhesus Macaques: Macaca mulatta of Cayo Santiago and Beyond. Springer Science: New York, pp. 1–35. [Google Scholar]
- Evans AR, Daly ES, Catlett KK, Paul KS, King SJ, Skinner MM, Nesse HP, Hublin J-J, Townsend GC, Schwartz GT, Jernvall J, 2016. A simple rule governs the evolution and development of hominin tooth size. Nature 530, 477–480. [DOI] [PubMed] [Google Scholar]
- Falconer DS, Mackay TFC, 1996. Introduction to Quantitative Genetics, 4th ed. Pearson Education Limited: Harlow. [Google Scholar]
- Galbany J, Tung J, Altmann J, Alberts SC, 2015. Canine length in wild male baboons: maturation, aging and social dominance rank. PLoS ONE 10, e0126415. [DOI] [PMC free article] [PubMed] [Google Scholar]
- George D, Mallery P 2010. SPSS for Windows Step by Step: A Simple Guide and References, 17.0 update, 10th ed. Pearson: Boston. [Google Scholar]
- Gingerich PD, 1977. Correlation of tooth size and body size in living hominoid primates, with a note on relative brain size in Aegyptopithecus and Proconsul. American Journal of Physical Anthropology 47, 395–398. [DOI] [PubMed] [Google Scholar]
- Gingerich PD, Smith BH, Rosenberg K, 1982. Allometric scaling in the dentition of primates and prediction of body weight from tooth size in fossils. American Journal of Physical Anthropology 58, 81–100. [DOI] [PubMed] [Google Scholar]
- Gould SJ, 1975. On the scaling of tooth size in mammals. Integrative and Comparative Biology 15, 353–362. [Google Scholar]
- Grabowski M, 2016. Bigger brains led to bigger bodies? The correlated evolution of human brain and body size. Current Anthropology 57, 174–196. [Google Scholar]
- Greenfield LO, 1993. A tooth at the border of two morphogenetic fields. Human Evolution 8, 187. [Google Scholar]
- Grieco TM, Rizk OT, Hlusko LJ, 2013. A modular framework characterizes micro- and macroevolution of Old World Monkey dentitions. Evolution 67, 241–259. [DOI] [PubMed] [Google Scholar]
- Griswold CK, 2006. Pleiotropic mutation, modularity and evolvability. Evolution & Development 8, 81–93. [DOI] [PubMed] [Google Scholar]
- Halliday TJ, Goswami A, 2013. Testing the inhibitory cascade model in Mesozoic and Cenozoic mammaliaforms. BMC Evolutionary Biology 13, 79. [DOI] [PMC free article] [PubMed] [Google Scholar]
- Hansen TF, 2003. Is modularity necessary for evolvability? Remarks on the relationship between pleiotropy and evolvability. BioSystems 69, 83–94. [DOI] [PubMed] [Google Scholar]
- Hansen TF, 2006. The evolution of genetic architecture. Annual Review of Ecology, Evolution, and Systematics 37, 123–157. [Google Scholar]
- Hardin AM, 2019a. Genetic correlations in the dental dimensions of Saguinus fuscicollis. American Journal of Physical Anthropology 169, 557–566. [DOI] [PubMed] [Google Scholar]
- Hardin AM, 2019b. Genetic contributions to dental dimensions in brown-mantled tamarins (Saguinus fuscicollis) and rhesus macaques (Macaca mulatta). American Journal of Physical Anthropology 168, 292–302. [DOI] [PMC free article] [PubMed] [Google Scholar]
- Hlusko LJ, 2016. Elucidating the evolution of hominid dentition in the age of phenomics, modularity, and quantitative genetics. Annals of Anatomy 203, 3–11. [DOI] [PubMed] [Google Scholar]
- Hlusko LJ, Mahaney MC, 2009. Quantitative genetics, pleiotropy, and morphological integration in the dentition of Papio hamadryas. Evolutionary Biology 36, 5–18. [DOI] [PMC free article] [PubMed] [Google Scholar]
- Hlusko LJ, Lease LR, Mahaney MC, 2006. Evolution of genetically correlated traits: tooth size and body size in baboons. American Journal of Physical Anthropology 131, 420–427. [DOI] [PubMed] [Google Scholar]
- Hlusko LJ, Sage RD, Mahaney MC, 2011. Modularity in the mammalian dentition: mice and monkeys share a common dental genetic architecture. Journal of Experimental Zoology 316, 21–49. [DOI] [PMC free article] [PubMed] [Google Scholar]
- Hlusko LJ, Suwa G, Kono RT, Mahaney MC, 2004. Genetics and the evolution of primate enamel thickness: a baboon model. American Journal of Physical Anthropology 124, 223–233. [DOI] [PubMed] [Google Scholar]
- Hlusko LJ, Weiss KM, Mahaney MC, 2002. Statistical genetic comparison of two techniques for assessing molar crown size in pedigreed baboons. American Journal of Physical Anthropology 117, 182–189. [DOI] [PubMed] [Google Scholar]
- Joganic JL, Willmore KE, Roseman CC, Richtsmeier JT, Rogers J, Cheverud JM, 2012. Comparative quantitative genetic analysis of cranial capacity and craniofacial morphology in two closely related primate species. In: Wang Q (Ed.), Bones, Genetics, and Behavior of Rhesus Macaques. Springer Science: New York, pp. 37–59. [Google Scholar]
- Jolly CJ, 1970. The seed-eaters: a new model of hominid differentiation based on a baboon analogy. Man 5, 5–26. [Google Scholar]
- Kangas AT, Evans AR, Thesleff I, Jernvall J, 2004. Nonindependence of mammalian dental characters. Nature 432, 211–214. [DOI] [PubMed] [Google Scholar]
- Kavanagh KD, Evans AR, Jernvall J, 2007. Predicting evolutionary patterns of mammalian teeth from development. Nature 449, 427–432. [DOI] [PubMed] [Google Scholar]
- Klingenberg CP, 2008. Morphological integration and developmental modularity. Annual Review of Ecology, Evolution, and Systematics 39, 115–132. [Google Scholar]
- Koh C, Bates E, Broughton E, Do NT, Fletcher Z, Mahaney MC, Hlusko LJ, 2010. Genetic integration of molar cusp size variation in baboons. American Journal of Physical Anthropology 260, 246–260. [DOI] [PMC free article] [PubMed] [Google Scholar]
- Konigsberg LW, Cheverud JM, 1992. Uncertain paternity in primate quantitative genetic studies. American Journal of Primatology 27, 133–143. [DOI] [PubMed] [Google Scholar]
- Lande R, 1979. Quantitative genetic analysis of multivariate evolution, applied to brain:body size allometry. Evolution 33, 402–416. [DOI] [PubMed] [Google Scholar]
- Lande R, Arnold SJ, 1983. The measurement of selection on correlated characters. Evolution 37, 1210–1226. [DOI] [PubMed] [Google Scholar]
- Leamy L, 1985. Static genetic and phenotypic allometry of dental traits in inbred and hybrid house mice. Growth 49, 490–499. [PubMed] [Google Scholar]
- Lynch M, Walsh B, 1998. Genetics and Analysis of Quantitative Traits. Sinauer Associates, Inc.: Sunderland, MA. [Google Scholar]
- Mitsiadis TA, Smith MM, 2006. How do genes make teeth to order through development? Journal of Experimental Zoology 306B, 177–182. [DOI] [PubMed] [Google Scholar]
- Olson EC, Miller RL, 1958. Morphological Integration. University of Chicago Press: Chicago. [Google Scholar]
- Osborn J, 1978. Morphogenetic gradients: fields versus clones. In: Butler P, Joysey K (Eds.), Development, Function and Evolution of Teeth. Academic Press: London, pp. 171–201. [Google Scholar]
- Pemberton JM, 2010. Evolution of quantitative traits in the wild: mind the ecology. Philosophical Transactions of the Royal Society B 365, 2431–2438. [DOI] [PMC free article] [PubMed] [Google Scholar]
- Plavcan JM, 1998. Correlated response, competition, and female canine size in primates. American Journal of Physical Anthropology 416, 401–416. [DOI] [PubMed] [Google Scholar]
- Plavcan JM, 2001. Sexual dimorphism in primate evolution. American Journal of Physical Anthropology 116, 25–53. [DOI] [PubMed] [Google Scholar]
- Plavcan JM, Kelley J, 1996. Evaluating the “dual selection” hypothesis of canine reduction. American Journal of Physical Anthropology 99, 379–387. [DOI] [PubMed] [Google Scholar]
- Plavcan JM, van Schaik CP, Kappeler PM, 1995. Competition, coalitions and canine size in primates. Journal of Human Evolution 28, 245–276. [Google Scholar]
- Polychronis G, Halazonetis DJ, 2014. Shape covariation between the craniofacial complex and first molars in humans. Journal of Anatomy 225, 220–231. [DOI] [PMC free article] [PubMed] [Google Scholar]
- Rawlins RG, Kessler MJ, 1986. The Cayo Santiago Macaques: History, Behavior, Biology. State University of New York Press: New York. [Google Scholar]
- Revell LJ, 2012. phytools: an R package for phylogenetic comparative biology (and other things). Methods in Ecology and Evolution 3, 217–223. [Google Scholar]
- Roseman CC, Delezene LK, 2019. The inhibitory cascade model is not a good predictor of molar size covariation. Evolutionary Biology 46, 229–238. [Google Scholar]
- Roseman CC, Kenny-Hunt JP, Cheverud JM, 2009. Phenotypic integration without modularity: testing hypotheses about the distribution of pleiotropic quantitative trait loci in a continuous space. Evolutionary Biology 36, 282–291. [Google Scholar]
- Schroer K, Wood B, 2015. Modeling the dental development of fossil hominins through the inhibitory cascade. Journal of Anatomy 226, 150–162. [DOI] [PMC free article] [PubMed] [Google Scholar]
- Sharpe PT, 1995. Homeobox genes and orofacial development. Connective Tissue Research 32, 17–25. [DOI] [PubMed] [Google Scholar]
- Sherwood RJ, Duren DL, Demerath EW, Czerwinski SA, Siervogel RM, Towne B, 2008. Quantitative genetics of modern human cranial variation. Journal of Human Evolution 54, 909–914. [DOI] [PMC free article] [PubMed] [Google Scholar]
- Swindler DR, 2002. Primate Dentition: An Introduction to the Teeth of Non-human Primates. Cambridge University Press, Cambridge. [Google Scholar]
- Thesleff I, Sharpe P, 1997. Signaling networks regulating dental development. Mechanisms of Development 67, 111–123. [DOI] [PubMed] [Google Scholar]
- Stojanowski CM, Paul KS, Seidel AC, Guatelli-Steinberg D, Duncan WN, 2017. Heritability and genetic integration of tooth size in the South Carolina Gullah. American Journal of Physical Anthropology 164, 505–521. [DOI] [PubMed] [Google Scholar]
- Townsend G, Hughes T, Luciano M, Bockmann M, Brook A, 2009. Genetic and environmental influences on human dental variation: a critical evaluation of studies involving twins. Archives of Oral Biology 54S, S45–S51. [DOI] [PMC free article] [PubMed] [Google Scholar]
- Townsend GC, Brown T, 1978. Heritability of permanent tooth size. American Journal of Physical Anthropology 49, 497–504. [DOI] [PubMed] [Google Scholar]
- Ungar PS, 2014. Dental allometry in mammals: a retrospective. Annales Zoologici Fennici 51, 177–187. [Google Scholar]
- Wagner GP, Pavlicev M, Cheverud JM, 2007. The road to modularity. Nature Reviews Genetics 8, 921–931. [DOI] [PubMed] [Google Scholar]
- Wang Q, Turnquist JE, Kessler MJ, 2016. Free-ranging Cayo Santiago rhesus monkeys (Macaca mulatta): III. dental eruption patterns and dental pathology. American Journal of Primatology 78, 127–142. [DOI] [PubMed] [Google Scholar]
- Widdig A, Kessler MJ, Bercovitch FB, Berard JD, Duggleby C, Nürnberg P, Rawlins RG, Sauermann U, Wang Q, Krawczak M, Schmidtke J, 2016. Genetic studies on the Cayo Santiago rhesus macaques: a review of 40 years of research. American Journal of Primatology 78, 44–62. [DOI] [PubMed] [Google Scholar]
- Wolak ME, Roff DA, Fairbairn DJ, 2015. Are we underestimating the genetic variances of dimorphic traits? Ecology and Evolution 5, 590–597. [DOI] [PMC free article] [PubMed] [Google Scholar]
- Zingeser MR, 1969. Cercopithecoid canine tooth honing mechanisms. American Journal of Physical Anthropology 31, 205–213. [DOI] [PubMed] [Google Scholar]
Associated Data
This section collects any data citations, data availability statements, or supplementary materials included in this article.