

Abstract
Current clinical assessment of functional tricuspid valve regurgitation relies on metrics quantified from medical imaging modalities. Although these clinical methodologies are generally successful, the lack of detailed information about the mechanical environment of the valve presents inherent challenges for assessing tricuspid valve regurgitation. In the present study, we have developed a finite element-based in-silico model of one porcine tricuspid valve (TV) geometry to investigate how various pathological conditions affect the overall biomechanical function of the TV. There were three primary observations from our results. Firstly, the results of the papillary muscle displacement study scenario indicated more pronounced changes in the TV biomechanical function. Secondly, compared to uniform annulus dilation, non-uniform dilation scenario induced more evident changes in the von Mises stresses (83.8–125.3 kPa vs. 65.1–84.0 kPa) and the Green-Lagrange strains (0.52–0.58 vs. 0.47–0.53) for the three TV leaflets. Finally, results from the pulmonary hypertension study scenario showed opposite trends compared to the papillary muscle displacement and annulus dilation scenarios. Furthermore, various chordae rupture scenarios were simulated, and the results showed that the chordae tendineae attached to the TV anterior and septal leaflets may be more critical to proper TV function. This in-silico modeling-based study has provided a deeper insight into the tricuspid valve pathologies that may be useful, with moderate extensions, for guiding clinical decisions.
Keywords: functional tricuspid regurgitation, chordae tendineae, tenting area, tenting height, coaptation height, finite element simulations
1. Introduction
The tricuspid valve (TV) is located in between the right atrium and the right ventricle of the heart. On the organ level, the TV is composed of four sub-valvular components: the three TV leaflets—the anterior leaflet (TVAL), the posterior leaflet (TVPL), and the septal leaflet (TVSL), the ring-like TV annulus, the chordae tendineae, and the papillary muscles (PMs) located on the right ventricular wall. Anatomically, the TV annulus acts as a transition from the right atrium to the TV leaflets, whereas the chordae tendineae insert near the free edge of the leaflets to make a connection to the papillary muscles (Fig. 1a). The combined function of these sub-valvular components facilitates unidirectional blood flow within the right side of the heart. During diastole, the TV leaflets are relaxed and allow deoxygenated blood flow from the right atrium into the right ventricle; during systole, the pressure gradient developed in the right ventricle causes the TV leaflets to coapt, preventing blood backflow to the right atrium. Alterations in the anatomy or function of these sub-valvular components can result in functional tricuspid regurgitation.
Figure 1 –
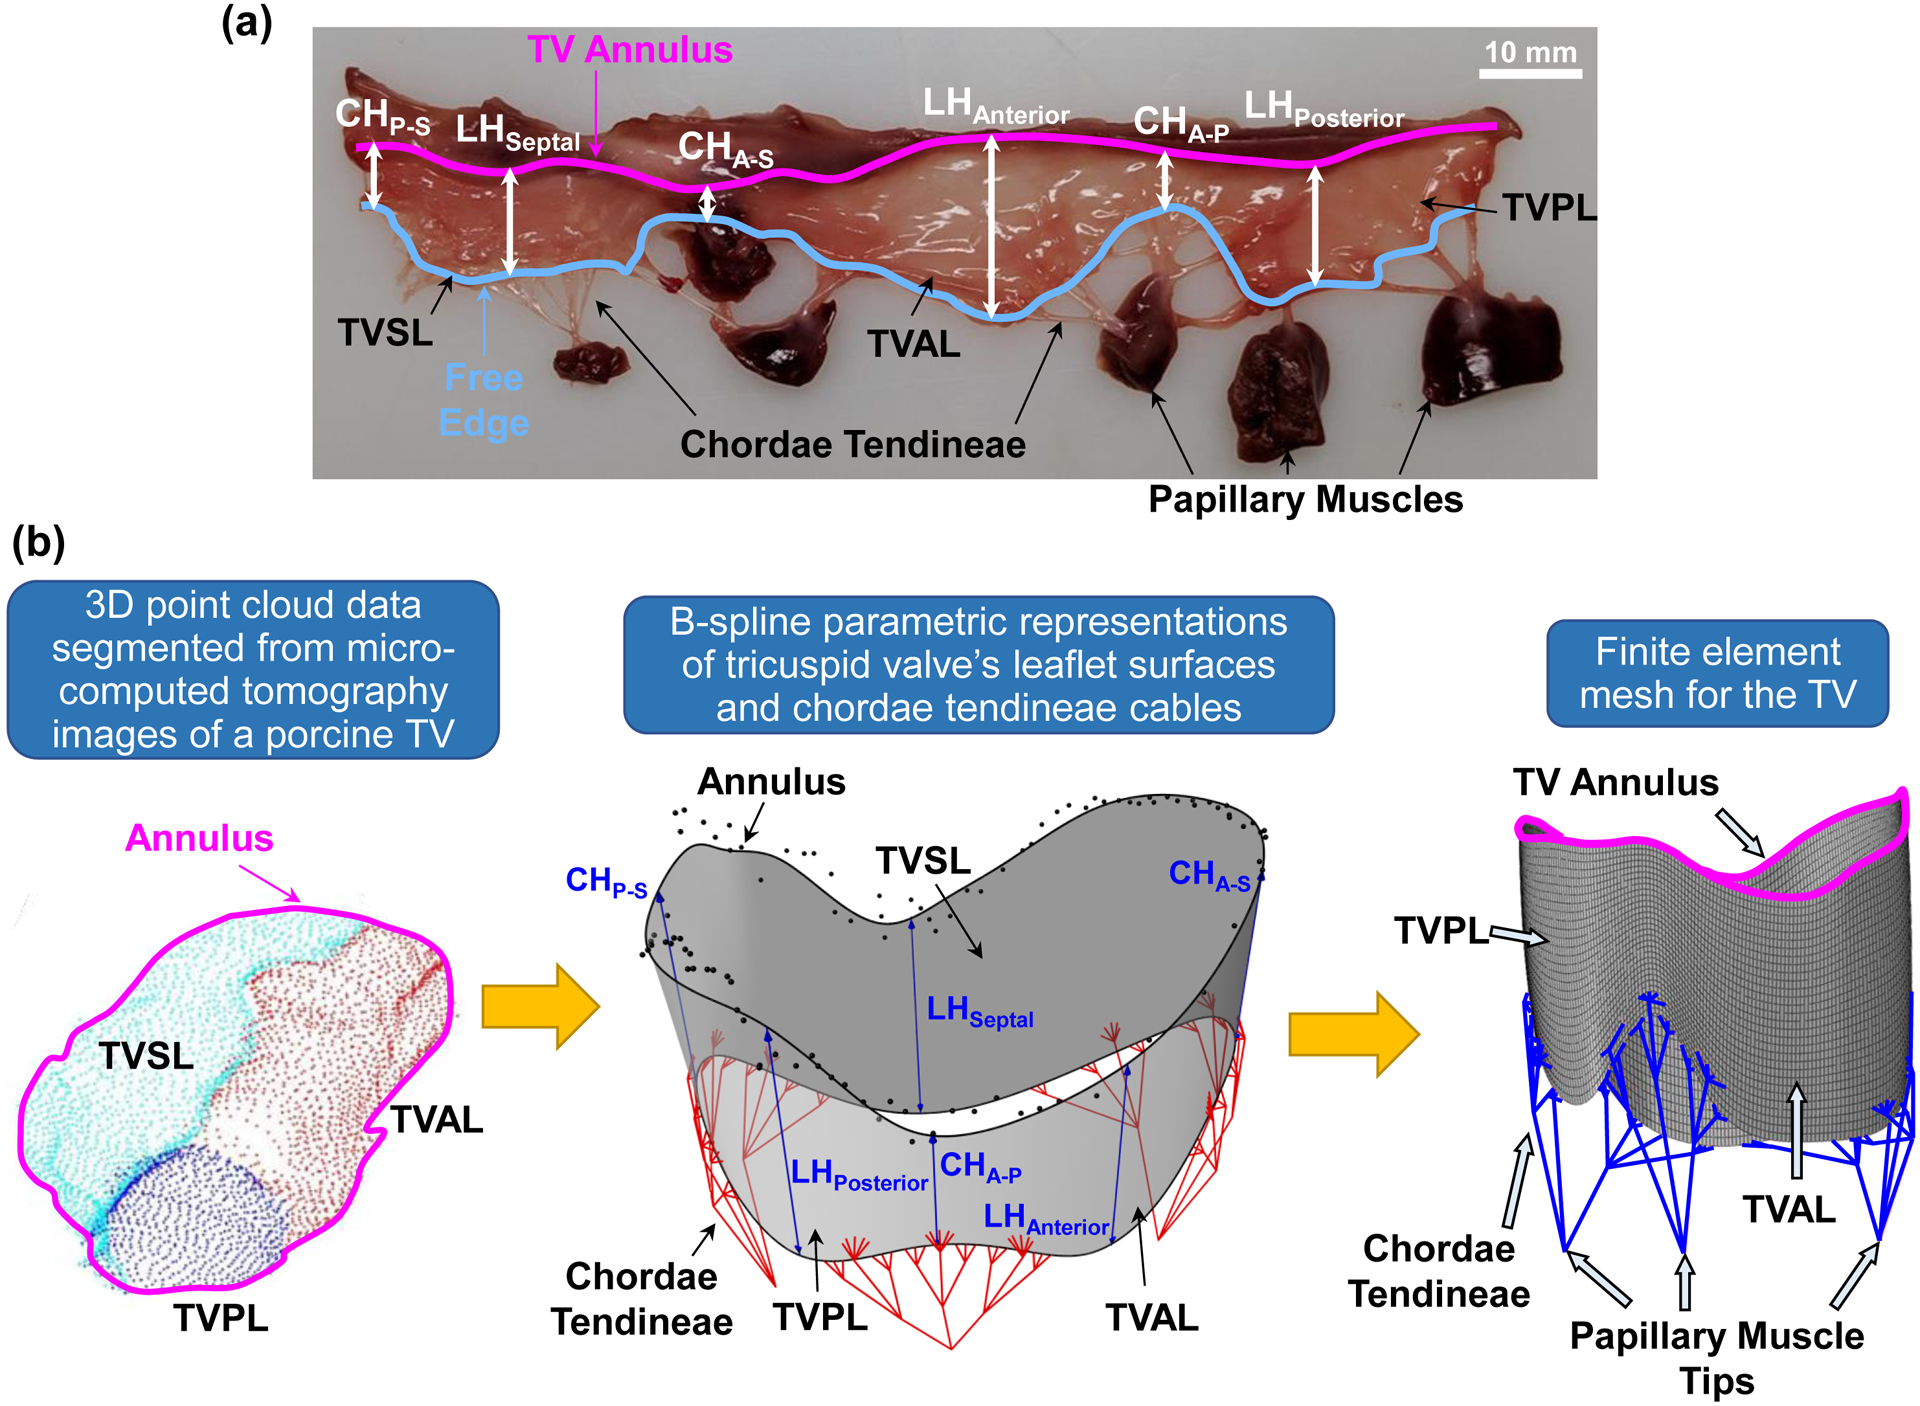
(a) Excised porcine tricuspid valve showing the anterior leaflet (TVAL), posterior leaflet (TVPL), and septal leaflet (TVSL), the leaflet heights (LH), the commissure heights for each leaflet conjunction (e.g., CHA-S between the TVAL and TVSL), the annulus, the TV leaflet free edge, the chordae tendineae, and the papillary muscles. Image adapted from Lee et al. (2019) [15]. (b) Geometrical modeling pipeline showing point cloud data (left), which were segmented from micro-CT image data, transformed using B-spline geometry representations (middle, see more details in Kamensky et al. (2018) [12]) to create the finite element mesh (right).
Functional tricuspid regurgitation (FTR) stems from a combination of three interlinked pathologies that arise from a pressure or volume overload in the right ventricle [1–3]. These types of overload will lead to the enlargement of the right ventricle beyond its physiological configuration [1,3]. As a consequence, the TV annulus dilates primarily away from the septum, and deforms from an elliptical, saddle-shaped configuration (healthy) to a circular, flattened configuration (diseased) [4,5]. These changes in the right ventricle-TV anatomy will progress and eventually lead to PM displacement, reduced coaptation of the TV leaflets, and the formation of FTR [1,2,4–6]. It has long been expected that FTR would naturally regress after the correction of left-sided cardiac lesions [7]. However, recent clinical studies have demonstrated that this practice may be invalid, and that untreated FTR will often progress and worsen the long-term prognosis [8,9]. Thus, in the last decade, FTR has gained more research attention, but much remains unknown about therapeutic options, the optimal timing for such treatments, and the suitable strategies to mitigate TR recurrence after surgical intervention. Clinical and experimental studies [2,10], such as investigations of the FTR progression and determination of relevant quantitative metrics based on patient’s image data, have aimed to address some of these limitations. Despite these recent research efforts, the underlying mechanical environment of the TV, which is a critical understanding for restoring leaflet tissue homeostasis, has not yet been comprehensively investigated. On the other hand, in-silico modeling allows an alternative research avenue for understanding FTR that provides predictive information about the mechanical environment and the closed 3D geometry of the TV on a patient-specific basis. Nevertheless, the application of in-silico modeling to the tricuspid valve, especially considering the diseased scenarios such as FTR, has remained limited.
To date, there are four prominent computational modeling studies for the tricuspid valve: Stevanella et al. (2010) [11] aimed to establish an image-based TV modeling framework; Kamensky et al. (2018) [12] presented an isogeometric analysis model for simulating TV chordae rupture; Kong et al. (2018) [13] developed a patient-specific TV finite element (FE) model using three patients’ medical imaging data; and recently Singh-Gryzbon et al. (2019) [14] utilized fluid-structure interaction simulations to study the healthy and regurgitant TVs. Interested readers are referred to recent reviews [15–17] discussing these studies. These computational studies have laid the groundwork for TV biomechanical modeling, but an extensive investigation of how FTR pathologies alter the biomechanical function of the tricuspid valve has yet been conducted. Although the FTR pathologies appear to be clinically understood, accessible quantitative information about how different pathologies influence valvular function could shed new light on individualized assessment and treatment of FTR.
Thus, one objective of this work is to examine via in-silico modeling how FTR pathologies modify the TV biomechanical function. This is accomplished through developing a FE modeling framework to simulate healthy and pathological TVs. Five pathological scenarios are simulated, key engineering mechanics and clinically-relevant geometry metrics are determined, and numerical predictions are evaluated to connect TV disease with both the tissue-level biomechanics and the organ-level function.
2. Materials and Methods
2.1. Finite Element Model
ABAQUS (Dassault Systèmes Simulia Corp., Johnson, RI) software was used to perform FE simulations of the tricuspid valve, considering healthy and pathological conditions. Specific details of the TV geometry, FE mesh, material model, and boundary/loading conditions are provided in the subsequent subsections.
2.1.1. Model Geometry and FE Mesh
The geometry and mesh used to represent the TV were considered in two parts: the leaflets and the chordae tendineae. The geometry of the TV leaflets was generated using a similar procedure to that in our previous study within an isogeometric analysis framework [12]. The primary difference is the creation of the TV FE mesh from the CAD geometry. In brief, the TV leaflets were initially represented by cubic B-splines surfaces and the parameters describing the three leaflet heights (LHs) and three commissure heights (CHs) were taken from one representative porcine heart (Fig. 1b): LHSeptal=13 mm, LHAnterior=14 mm, LHPosterior=14 mm, CHP-S=9 mm, CHA-S=9 mm, and CHA-P=9 mm. The shape of the TV annulus was extracted from micro-computed tomography data for a porcine TV fixed in the closed position. The annulus shape and the parametric representation for the TV leaflets were combined to create the final TV leaflet geometry, which was then discretized into 8,850 four-node shell elements (S4) using ABAQUS/CAE (Fig. 1b). The thickness for each element was taken from Jett et al. (2018) [18]. Specifically, the TVAL was 0.52 mm, the TVPL was 0.46 mm, and the TVSL was 0.37 mm. The idealized representation of the chordae tendineae was used, including 11 groups originating from three PM tips. The TV chordae tendineae were discretized using 3D truss elements (T3D2) with a cross-sectional area of 0.17 mm2. The FE meshes for the TV leaflets and chordae tendineae were combined using ABAQUS/CAE, ensuring that both meshes shared the same node where the chordae inserted into the TV leaflet surface (Fig. 1b). In addition to the saddle-shaped annulus configuration, a flattened TV annulus was also considered for all the FE study scenarios (Fig. 2d).
Figure 2 –
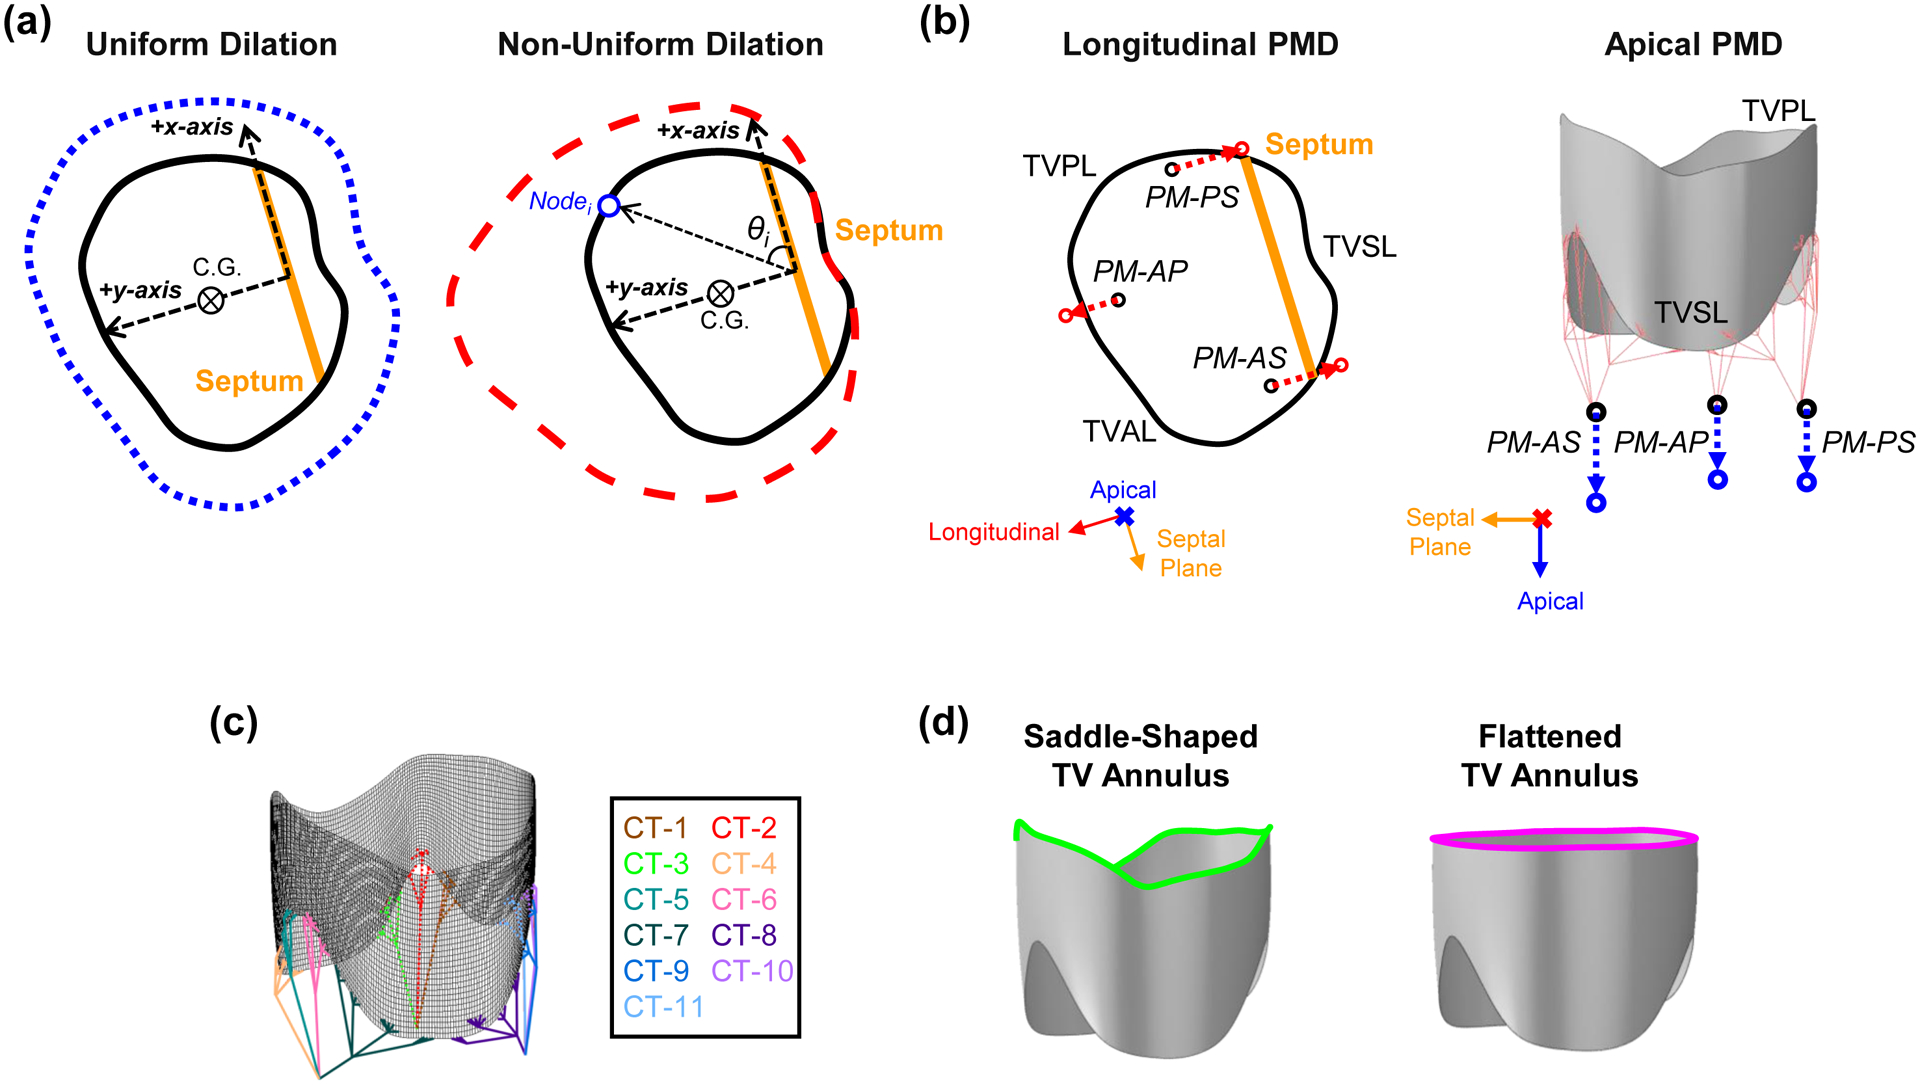
Illustrations of the FE numerical study scenarios: (a) uniform and non-uniform dilations of the TV annulus, (b) longitudinal and apical displacements of the papillary muscles, (c) 11 groups associated with chordae rupture, and (d) saddle-shaped and flattened configurations of the TV annulus.
2.1.2. Material Model
To describe the mechanical behaviors of the TV leaflets, we adopted the strain energy density function from Demiray [19] with an additional neo-Hookean term for the contribution of the non-fibrous extracellular matrix
| (1) |
where c0, c1, and c2 are the material parameters, I1 is the first invariant of the right Cauchy-Green tensor C=FTF, F is the deformation gradient tensor, and p is the penalty parameter to enforce the incompressibility condition, i.e., J=detF=1. The material constants c0=10 kPa, c1=0.209 kPa, and c2=9.046 were adopted from the literature [11,12], and time-dependent effects were not considered in the present numerical study. On the other hand, the chordae tendineae were modeled as a linearly-elastic, isotropic solid with an elastic modulus of 40 MPa and a Poisson’s ratio of 0.30 [12]. The material models were implemented into the ABAQUS VUMAT subroutine (see more details about the user subroutine verification in Appendix A).
2.1.3. Boundary and Loading Conditions
Three simplifications were made for the applied boundary and loading conditions: the TV annulus nodes were fixed, the PM tips were pinned, and a smooth-stepped transvalvular pressure gradient of 25 mmHg was applied to the ventricular side of the TV leaflets over a simulation time of 0.4 second. The ABAQUS general contact algorithm was used with a contact penalty stiffness of 0.5 to model the contact between any two TV leaflets during the systolic closure. This subsection describes the boundary and loading conditions that were applied to simulate the TV systolic closure, whereas Section 2.2 outlines additional simulation steps required to modify the TV geometry for each considered pathological state.
2.2. Numerical Study Scenarios Considering Pathological Conditions
Five pathological study scenarios were simulated: pulmonary hypertension (PH), uniform annulus dilation (UAD), non-uniform annulus dilation (NAD), PM displacement, and chordae rupture (Fig. 2a–c).
2.2.1. Pulmonary Hypertension
Pulmonary hypertension is defined as an increase in the mean pulmonary arterial pressure above 25 mmHg [20]. To simulate this pathology scenario, the loading condition was adjusted to a 45 mmHg transvalvular pressure gradient (i.e., moderate-to-severe pulmonary hypertension [21]) and the boundary conditions described in Section 2.1.3 were kept the same.
2.2.2. Annulus Dilation
Two scenarios were considered for TV annulus dilation (Fig. 2a): non-uniform dilation, where the annulus primarily dilates away from the septum, and uniform dilation, where the annulus dilates uniformly in all directions.
The corresponding nodal displacements associated with the uniform annulus dilation (UAD) were determined by
| (2) |
and non-uniform annulus dilation (NAD) were determined by
| (3) |
Herein, xi, yi, and zi denote the x-, y-, and z-coordinates of node i, the resulting ui, vi, and wi denote the displacements of node i, the subscript c denotes the center of geometry of the TV annulus, θi is the angle between the x-axis and the line connecting the origin to node i, αx and αy are the scaling factors in the x- and y-directions, respectively, for the non-uniform dilation, and is the scaling factor for the uniform dilation. For the non-uniform dilation, the nodes located in the negative y-direction were fixed in the y-direction, in accordance with clinical observations [4,5], but those annulus nodes were still allowed to displace in the x-direction.
Numerical values for αx, αy, and are given in Table 1, and Appendix B describes the algorithmic procedure of determining αx and αy. The annulus dilation with the prescribed nodal displacements was first simulated prior to the simulations of the valvular closure.
Table 1 –
Parameters used for the pathological study scenarios of both the annulus dilation (Fig. 2a) and the papillary muscle displacement (Fig. 2b). The magnitudes of the papillary muscle displacements were adopted from Spinner et al. (2011) [22].
| Study Scenario | Disease-Related Modification | Parameter | |
|---|---|---|---|
| Non-Uniform Annulus Dilation | Direction | Annulus Node Scaling Value | |
| x-direction αx | 0.27 | ||
| y-direction αy | 0.58 | ||
| Uniform Annulus Dilation | All directions | 0.40 | |
| Papillary Muscle Displacement | Papillary Muscle | Apical Displacement | Longitudinal Displacement |
| Anterior-Posterior (AP) | 7.16 mm | 5.37 mm | |
| Anterior-Septal (AS) | 7.16 mm | 7.16 mm | |
| Posterior-Septal (PS) | 8.95 mm | 7.16 mm | |
2.2.3. Papillary Muscle (PM) Displacement
Spinner et al. (2011) [22] quantified different anatomical dimensions of the right ventricle and the TV using 3D echocardiography for healthy and diseased (tricuspid regurgitation) patients. They found that the PMs mostly displace laterally away from the septum and apically towards the right ventricle’s apex for patients with tricuspid regurgitation. Thus, we considered three sub-scenarios for the PM displacement study case: longitudinal displacement only, apical displacement only, and combined apical and longitudinal PM displacements (Fig. 2b and Table 1).
2.2.4. Chordae Tendineae (CT) Rupture
Clinical studies [23–25] have observed that incidental rupture of the chordae tendineae may allow unrestricted motion of the TV leaflet free edge into the right atrium (i.e., tricuspid leaflet flail – a sub-category of TV prolapse) and result in TR. Two scenarios of chordae rupture were considered: (i) rupture of individual chordae groups (11 total simulation studies), and (ii) rupture of any two combined chordae groups (55 total simulation studies). The chordae rupture was achieved by removing the elements associated with a given chordae group (Fig. 2c), while the loading and boundary conditions described in Section 2.1.3 were kept the same.
2.3. Analyses of the FE Results
2.3.1. Engineering Mechanics Metrics
Engineering mechanics metrics, such as the von Mises stresses and the Green-Lagrange strains, were extracted from each FE simulation and averaged over each of the three TV leaflets at three time points of the simulation, simulated pathology condition, leaflet coaptation, and TV closure at the applied transvalvular pressure (Fig. 3a). Those engineering mechanics-related results were calculated for the central region of the three TV leaflets as shown in Fig. 3b, and the resultant reaction force acting on each papillary muscle tip was determined from the FE simulations.
Figure 3 –
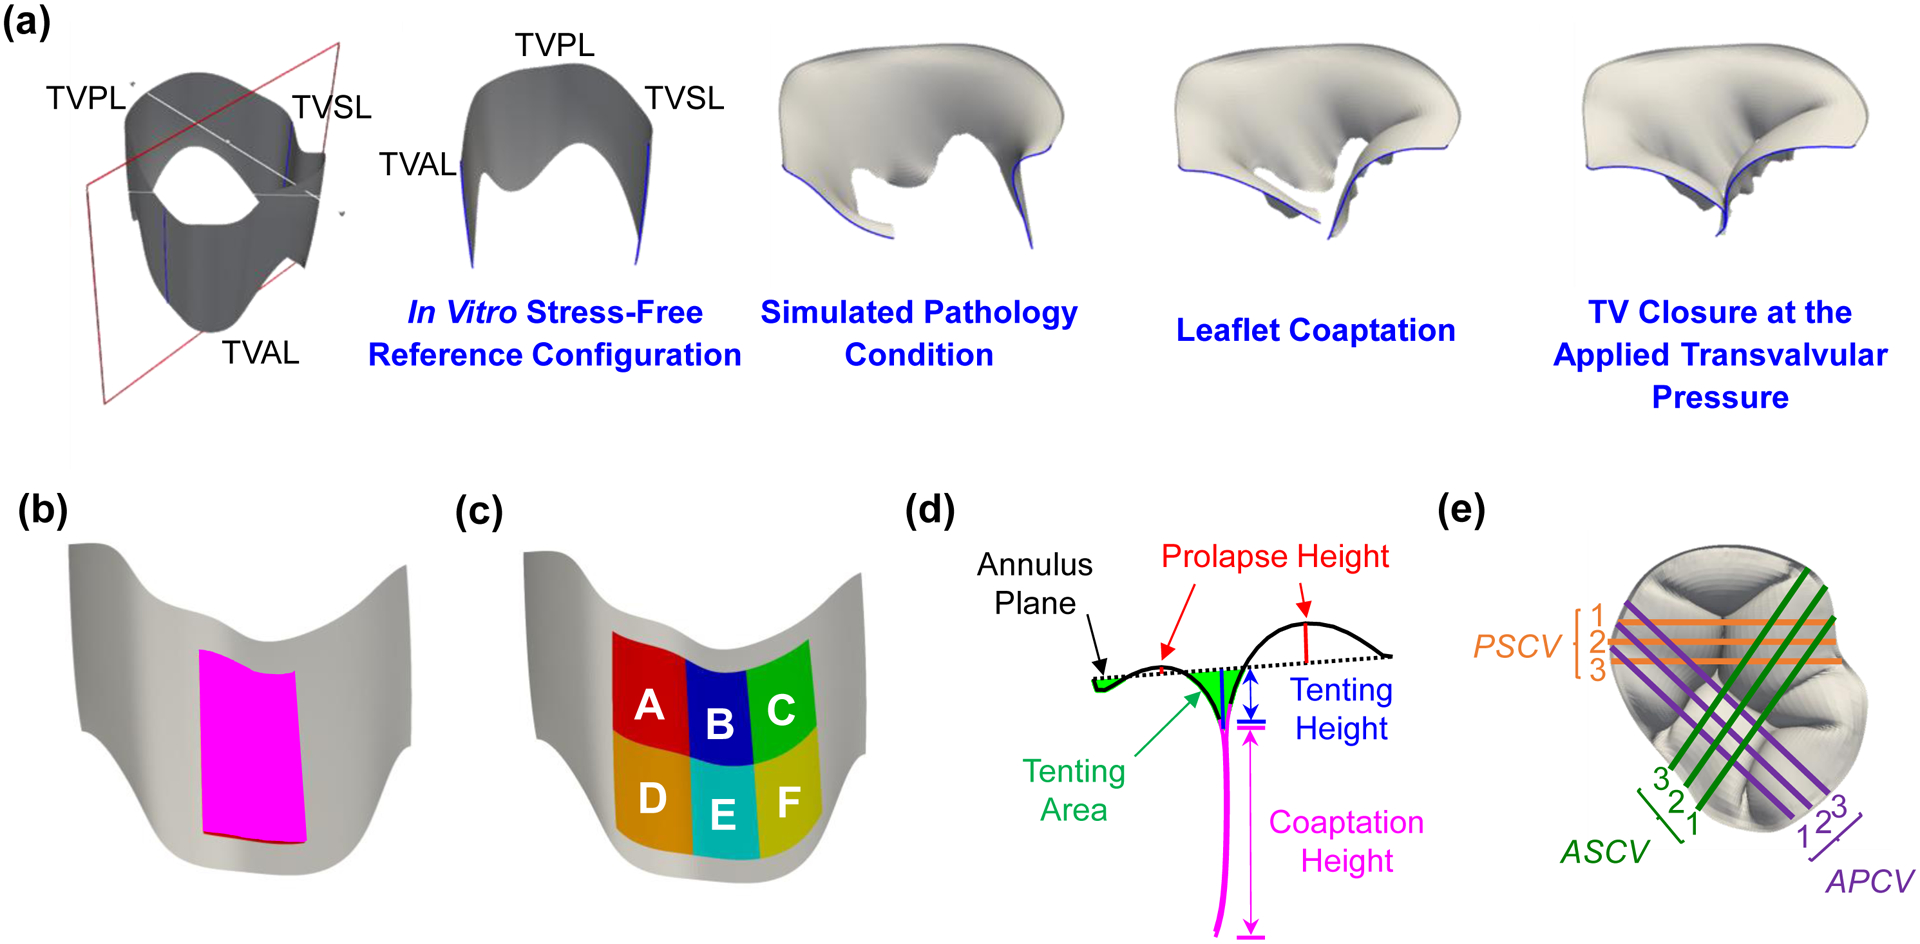
(a) In vitro stress-free reference configuration and three configurations of interest for analyzing the finite element simulation results. Note that the healthy and pulmonary hypertension study scenarios do not contain the simulated pathology condition because no modifications to the TV geometry are involved. (b) Central region and (c) six smaller regions used for comparing the engineering mechanics values between the simulation results and the in vitro experimental data from Laurence et al. (2019) [26]. (d) Definition of the clinically-relevant geometry metrics and (e) the nine cut views (PSCV: posterior-septal cut view; ASCV: anterior-septal cut view; APCV: anterior-posterior cut view) used for post-processing and analyses of the geometry-related metrics.
These engineering mechanics metrics for the healthy scenario were considered as the baseline throughout the comparative studies. Furthermore, the effect(s) of each pathological scenario were determined by calculating the percentage change in the average mechanics metrics with respect to the baseline (healthy) values. These relative percentage values are presented as a range for the three TV leaflets or the three papillary muscle tips to provide a concise comparison of different study scenarios. Moreover, the von Mises stresses and Green-Lagrange strains were also averaged with respect to six smaller regions of the TV anterior leaflet (Fig. 3c) for comparison with our recent in vitro experimental investigation of the regional variations in the mechanical properties of the TV anterior leaflet [26].
2.3.2. Clinically-Relevant Geometry Metrics
Clinical and in vitro studies often determine three quantities from 2D imaging data to assess tricuspid regurgitation (Fig. 3d), which include the tenting area, tenting height, and coaptation height (or coaptation area). These quantities were determined for each simulation scenario by first importing the closed TV leaflet geometry into ParaView (Kitware Inc., Clifton Park,NY) and next creating slices through the geometry to obtain 2D representations of the closed TV geometry (Fig. 3e). The 2D contours were then analyzed with an in-house MATLAB program (MathWorks, Natick, MA) to compute these clinically-relevant geometry values. Specifically, nine cut views were considered for each simulation that included three evenly-spaced slices (Fig. 3e). The geometry metrics were calculated for all nine cut views, and the results for the healthy scenario were considered as the baseline throughout the comparative studies. The effect(s) of each simulated pathological scenario were determined by calculating the percentage change of each geometry metric with respect to the baseline (healthy) values. To provide a concise comparison, the effect(s) associated with each study scenario are presented using the range of percentage differences.
3. Results
3.1. Simulation of Systolic Closure of the Healthy TV
The maximum and minimum principal Green-Lagrange strains are plotted on the undeformed TV leaflet geometries with their corresponding principal directions (Fig. 4a–b). The mean±SD of the maximum principal Green-Lagrange strain for each TV leaflet was: 0.31±0.14 (TVAL), 0.38±0.15 (TVPL), and 0.39±0.13 (TVSL). Further comparisons with other in vitro mechanical characterization studies are provided in Section 4.2. The von Mises stress, the maximum principal Green-Lagrange strain, and the minimum principal Green-Lagrange strain associated with the closed geometry of the healthy TV are shown in Figure 5.
Figure 4 –
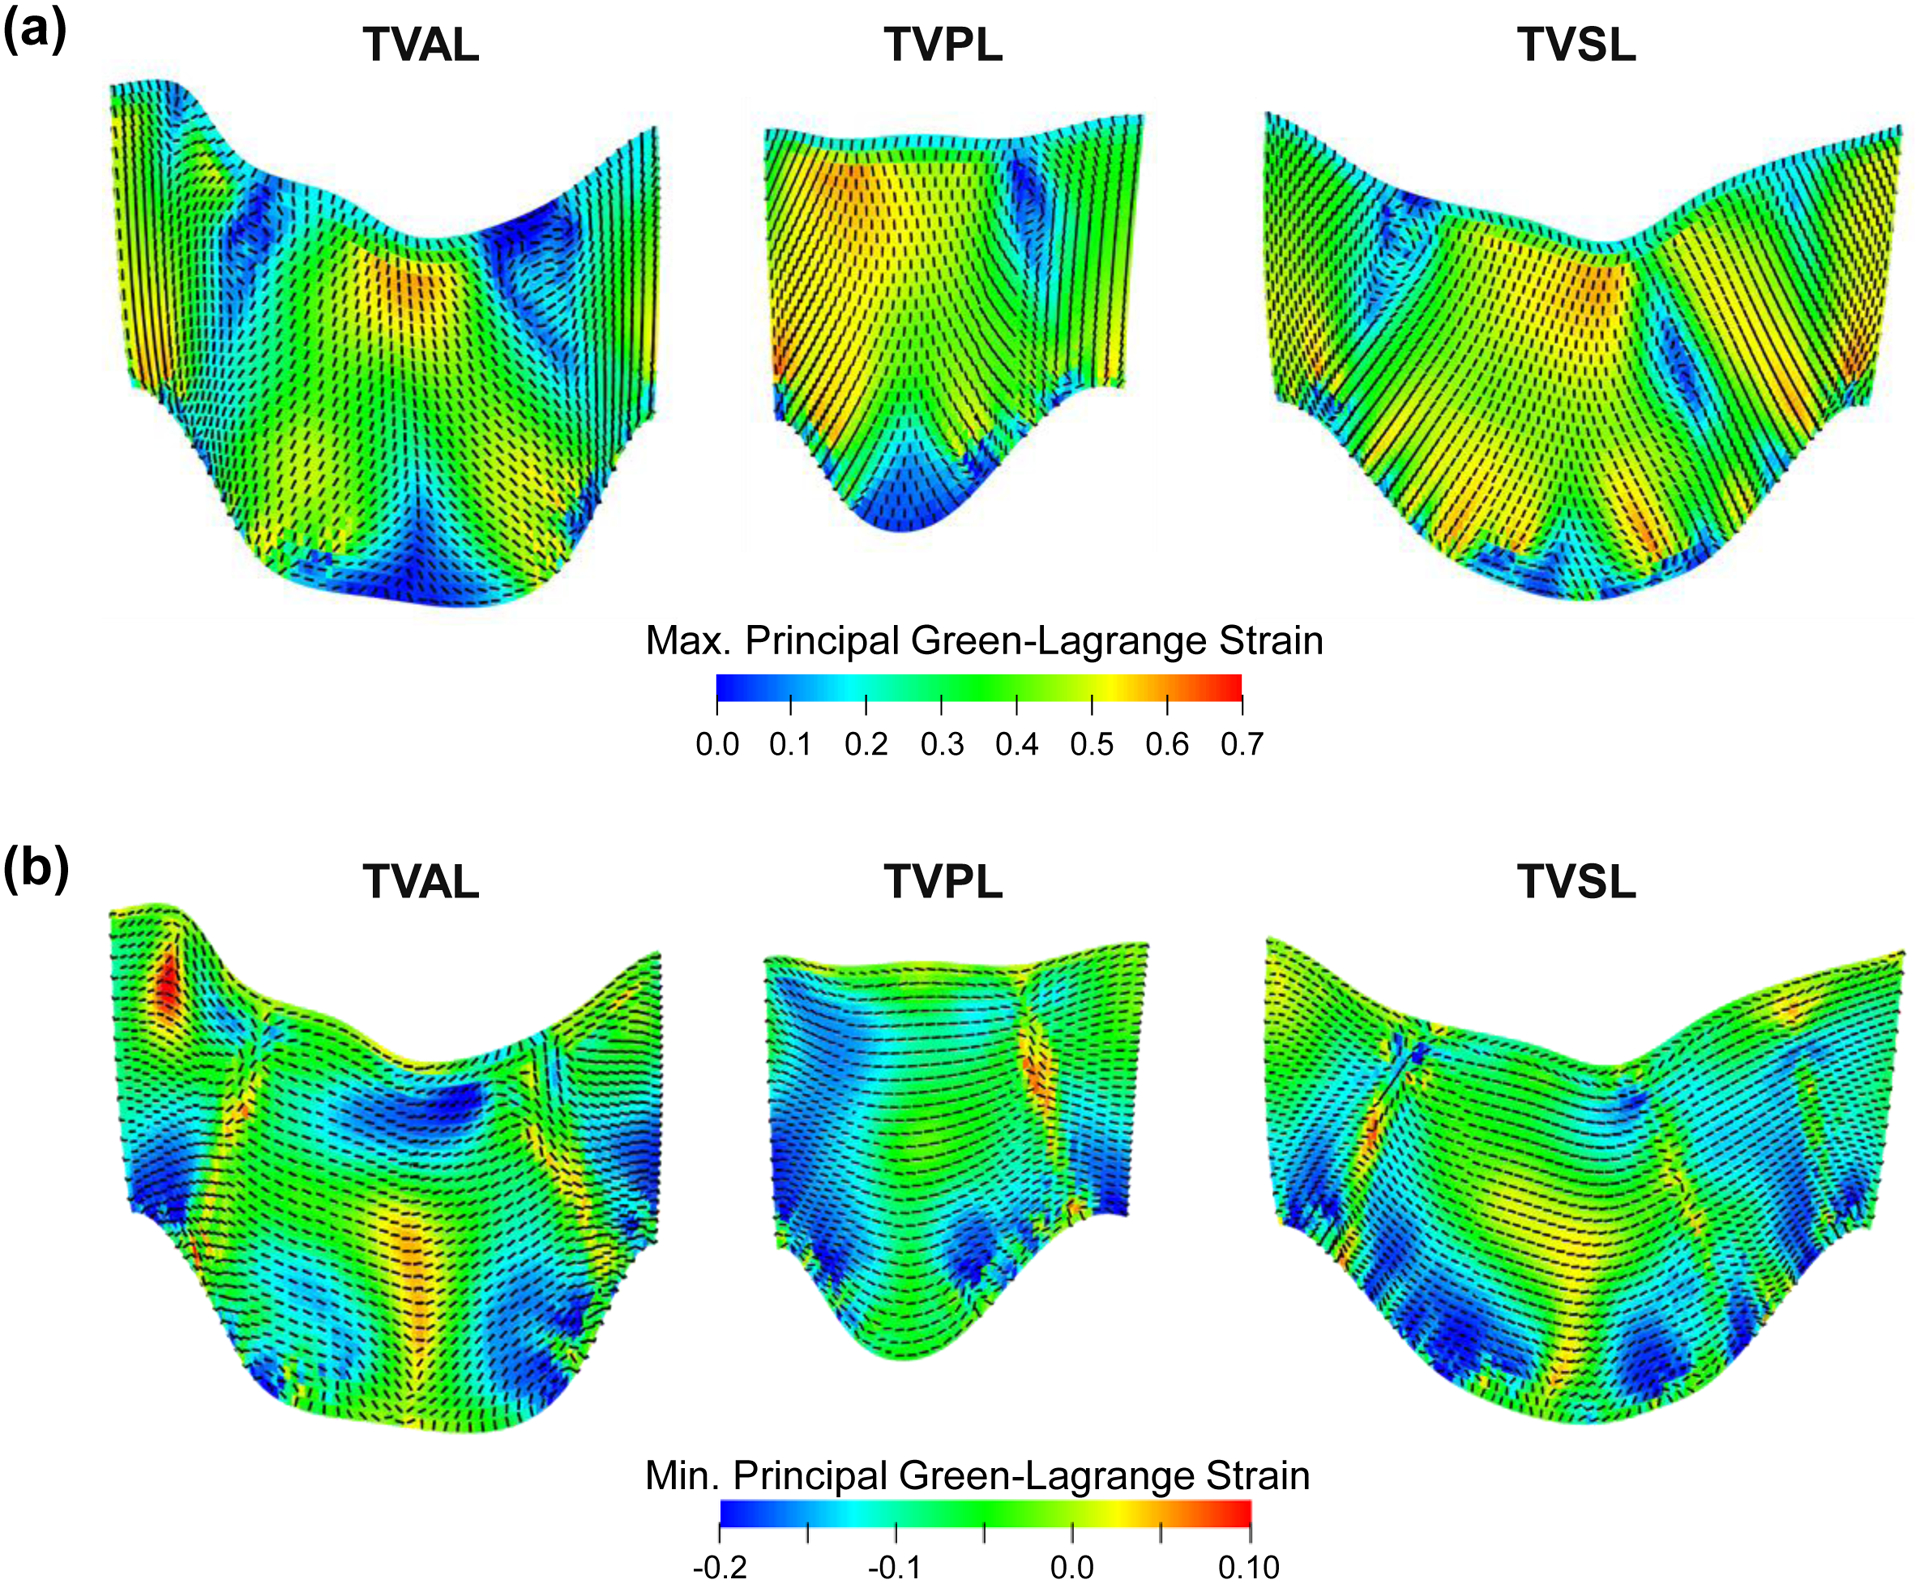
Contours of (a) the maximum principal Green-Lagrange strain, and (b) the minimum principal Green-Lagrange strain plotted on the undeformed leaflet geometry. The dashed lines indicate the principal direction of the maximum/minimum principal Green-Lagrange strains. (Acronyms: TVAL: tricuspid valve anterior leaflet, TVPL: tricuspid valve posterior leaflet, TVSL: tricuspid valve septal leaflet).
Figure 5 –
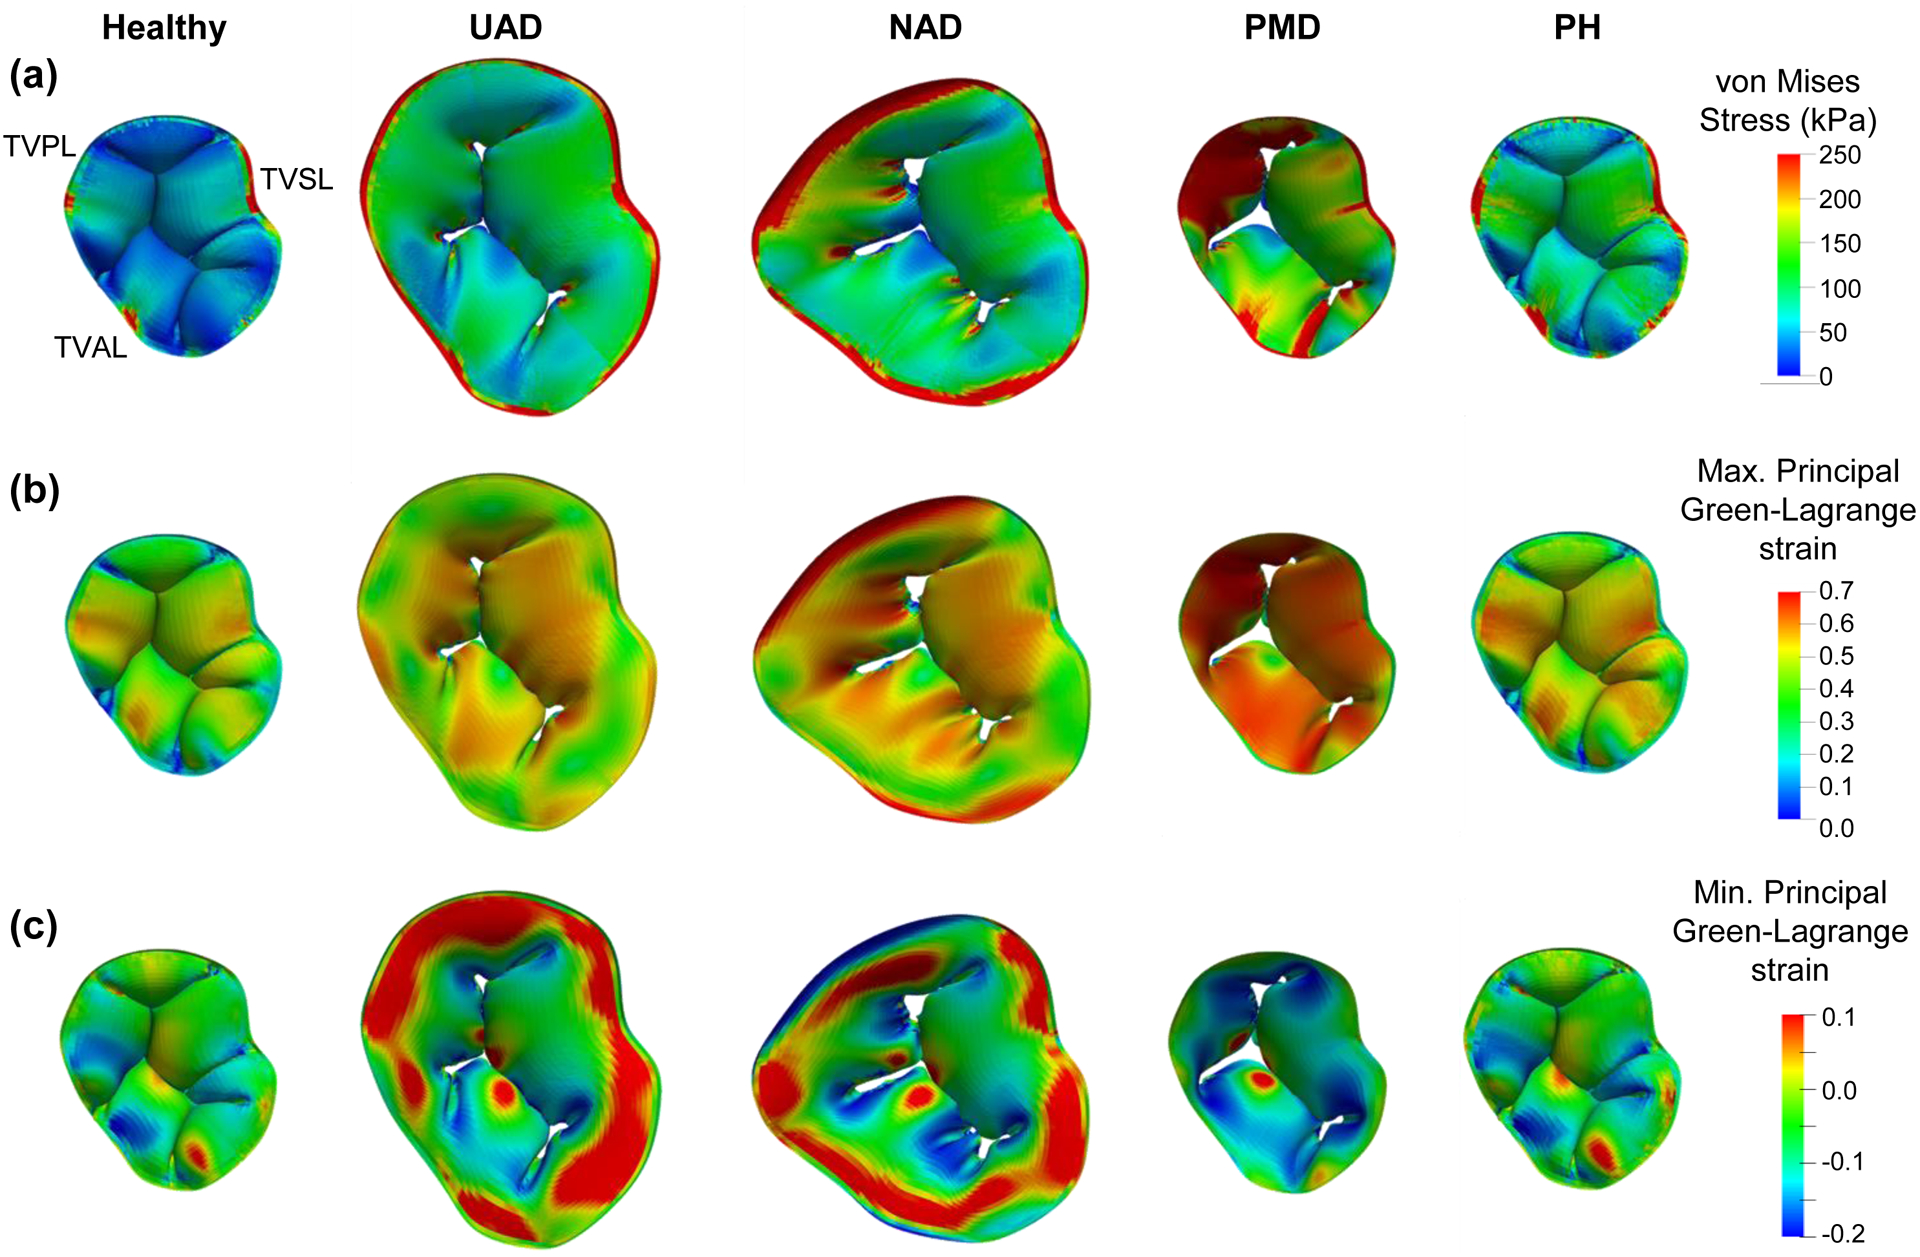
Finite element simulation results for the healthy and functional tricuspid regurgitation pathology study scenarios: (a) von Mises stress, (b) maximum principal Green-Lagrange strain, and (c) minimum principal Green-Lagrange strain. (Acronyms: UAD: uniform annulus dilation, NAD: non-uniform annulus dilation, PMD: papillary muscle displacement, PH: pulmonary hypertension).
3.2. Comparisons Between Healthy and Pathological Scenarios
3.2.1. Engineering Mechanics Metrics
There were four primary observations from the predicted von Mises stress (Fig. 6a), maximum and minimum principal Green-Lagrange strains (Fig. 6b–c), and the papillary muscle tip reaction forces (Fig. 6d). First, the PM displacement generally had a more pronounced effect on the engineering mechanics quantities for all three TV leaflets. Secondly, the non-uniform annulus dilation consistently led to more apparent increases in the mechanics metrics when compared to the uniform annulus dilation, with the differences approaching 60%. Third, the pulmonary hypertension study scenario had a less perceptible effect on the engineering mechanics metrics compared to the other pathological study scenarios (25% of the PM displacement scenario), except the septal leaflet. Finally, the minimum principal Green-Lagrange strain did not have consistent trends with many of the study scenarios, i.e., a larger magnitude at the diseased state or coaptation compared to the final closed configuration. Detailed quantitative values are summarized in Table 2. Similar trends were also observed for the studies associated with a flattened TV annulus (Fig. S1 and Table S1).
Figure 6 –
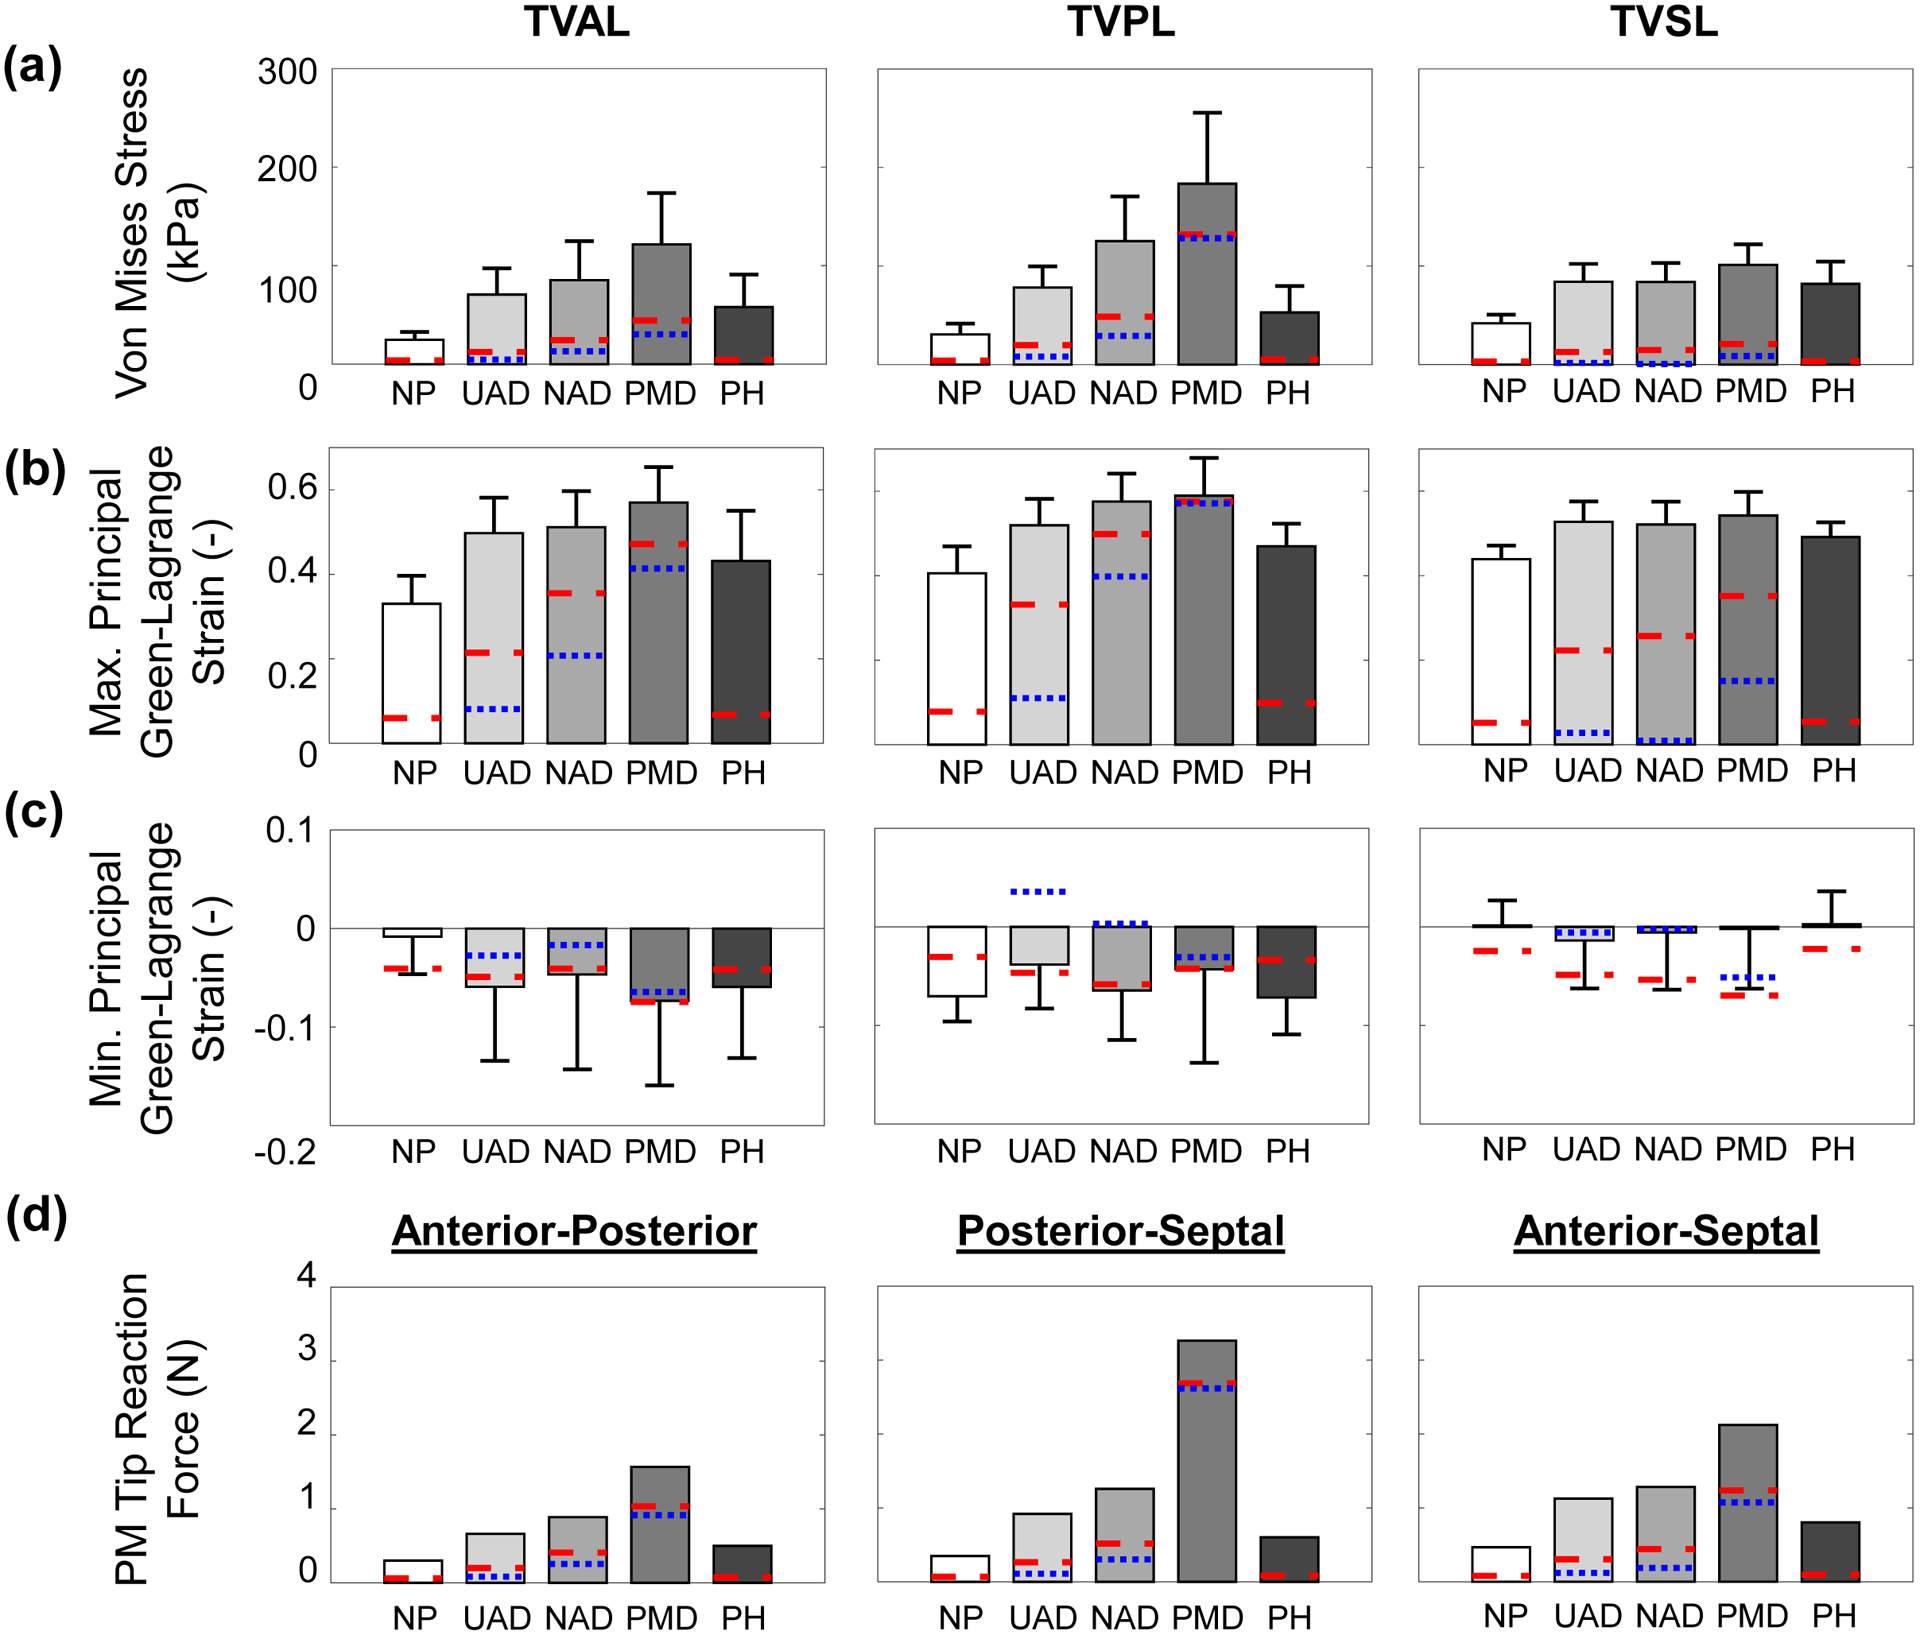
Central leaflet region’s mechanics metrics for each numerical study scenario considering a saddle-shaped annulus configuration: (a) average von Mises stress, (b) average maximum principal Green-Lagrange strain, (c) average minimum principal Green-Lagrange strain, and (d) papillary muscle tip reaction force. The blue dotted lines (…) are mechanics metrics values at the simulated pathology condition, whereas the red dashed lines (--) are the mechanics metrics values at the leaflet coaptation. Note: the PH scenario does not have the simulated pathology condition (i.e., blue dashed lines). (Acronyms: TVAL: tricuspid valve anterior leaflet, TVPL: tricuspid valve posterior leaflet, TVSL: tricuspid valve septal leaflet, NP: no pathology, UAD: uniform annulus dilation, NAD: non-uniform annulus dilation, PMD: papillary muscle displacement, PH: pulmonary hypertension).
Table 2 –
Percentage difference of the mechanics metrics for all the pathological study scenarios with reference to the healthy TV. Values of the von Mises stress and the maximum and minimum principal Green-Lagrange strains for the healthy scenario are presented as mean±SD.
| TVAL | TVPL | TVSL | PM Tip Force | |||||||||
|---|---|---|---|---|---|---|---|---|---|---|---|---|
| VMS (kPa) | MaxPE (−) | MinPE (−) | VMS (kPa) | MaxPE (−) | MinPE (−) | VMS (kPa) | MaxPE (−) | MinPE (−) | AP (N) | AS (N) | PS (N) | |
| Healthy | 24.7±7.9 | 0.33±0.07 | 0.01±0.04 | 30.6±10.9 | 0.41±0.06 | 0.07±0.03 | 41.9±8.6 | 0.44±0.03 | 0.00±0.03 | 0.30 | 0.47 | 0.35 |
| UAD | +163.4% | +43.4% | +187.6% | +154.9% | +28.0% | −45.7% | +100.5% | +20.1% | 986.3% | +163.2% | +141.0% | +120.5% |
| NAD | +296.6% | +73.9% | +1249.0% | +308.6% | +41.9% | −8.4% | +100.1% | +18.7% | 463.9% | +259.9% | +174.5% | +195.4% |
| PMD | +372.1% | +71.6% | +566.1% | +498.5% | +45.3% | −38.8% | +141.3% | +23.6% | 228.2% | +833.5% | +354.2% | +421.8% |
| PH | +102.6% | +23.4% | −110.8% | +72.6% | +15.8% | +1.8% | +95.5% | +12.0% | +64.5% | +72.4% | +71.9% | +66.4% |
Acronyms: TVAL: tricuspid valve anterior leaflet, TVPL: tricuspid valve posterior leaflet, TVSL: tricuspid valve septal leaflet, PM: papillary muscle, VMS: von Mises stress, MaxPE: maximum principal Green-Lagrange strain, MinPE: minimum principal Green-Lagrange strain, AP: anterior-posterior, AS: anterior-septal, PS: posterior-septal, UAD: uniform annulus dilation, NAD: non-uniform annulus dilation, PMD: papillary muscle displacement, and PH: pulmonary hypertension
3.2.2. Clinically-Relevant Geometry Metrics
The geometry metrics for all the study scenarios were different depending on the two leaflets under investigation and were different based on the cut view selected for the analysis (Fig. 7), with the anterior-posterior cut view (APCV) being consistently larger across each metric. Additionally, the anterior-posterior cut view #3 (APCV-3), anterior-septal cut view #3 (ASCV-3), and posterior-septal cut view #3 (PSCV-3) typically had a larger tenting area (12.5–94.9 mm2 vs. 6.0–86.7 mm2), a larger tenting height (3.1–9.5 mm vs. 2.4–12.8 mm), and a larger coaptation height (7.0–12.2 mm vs. 5.6–30.1 mm).
Figure 7 –
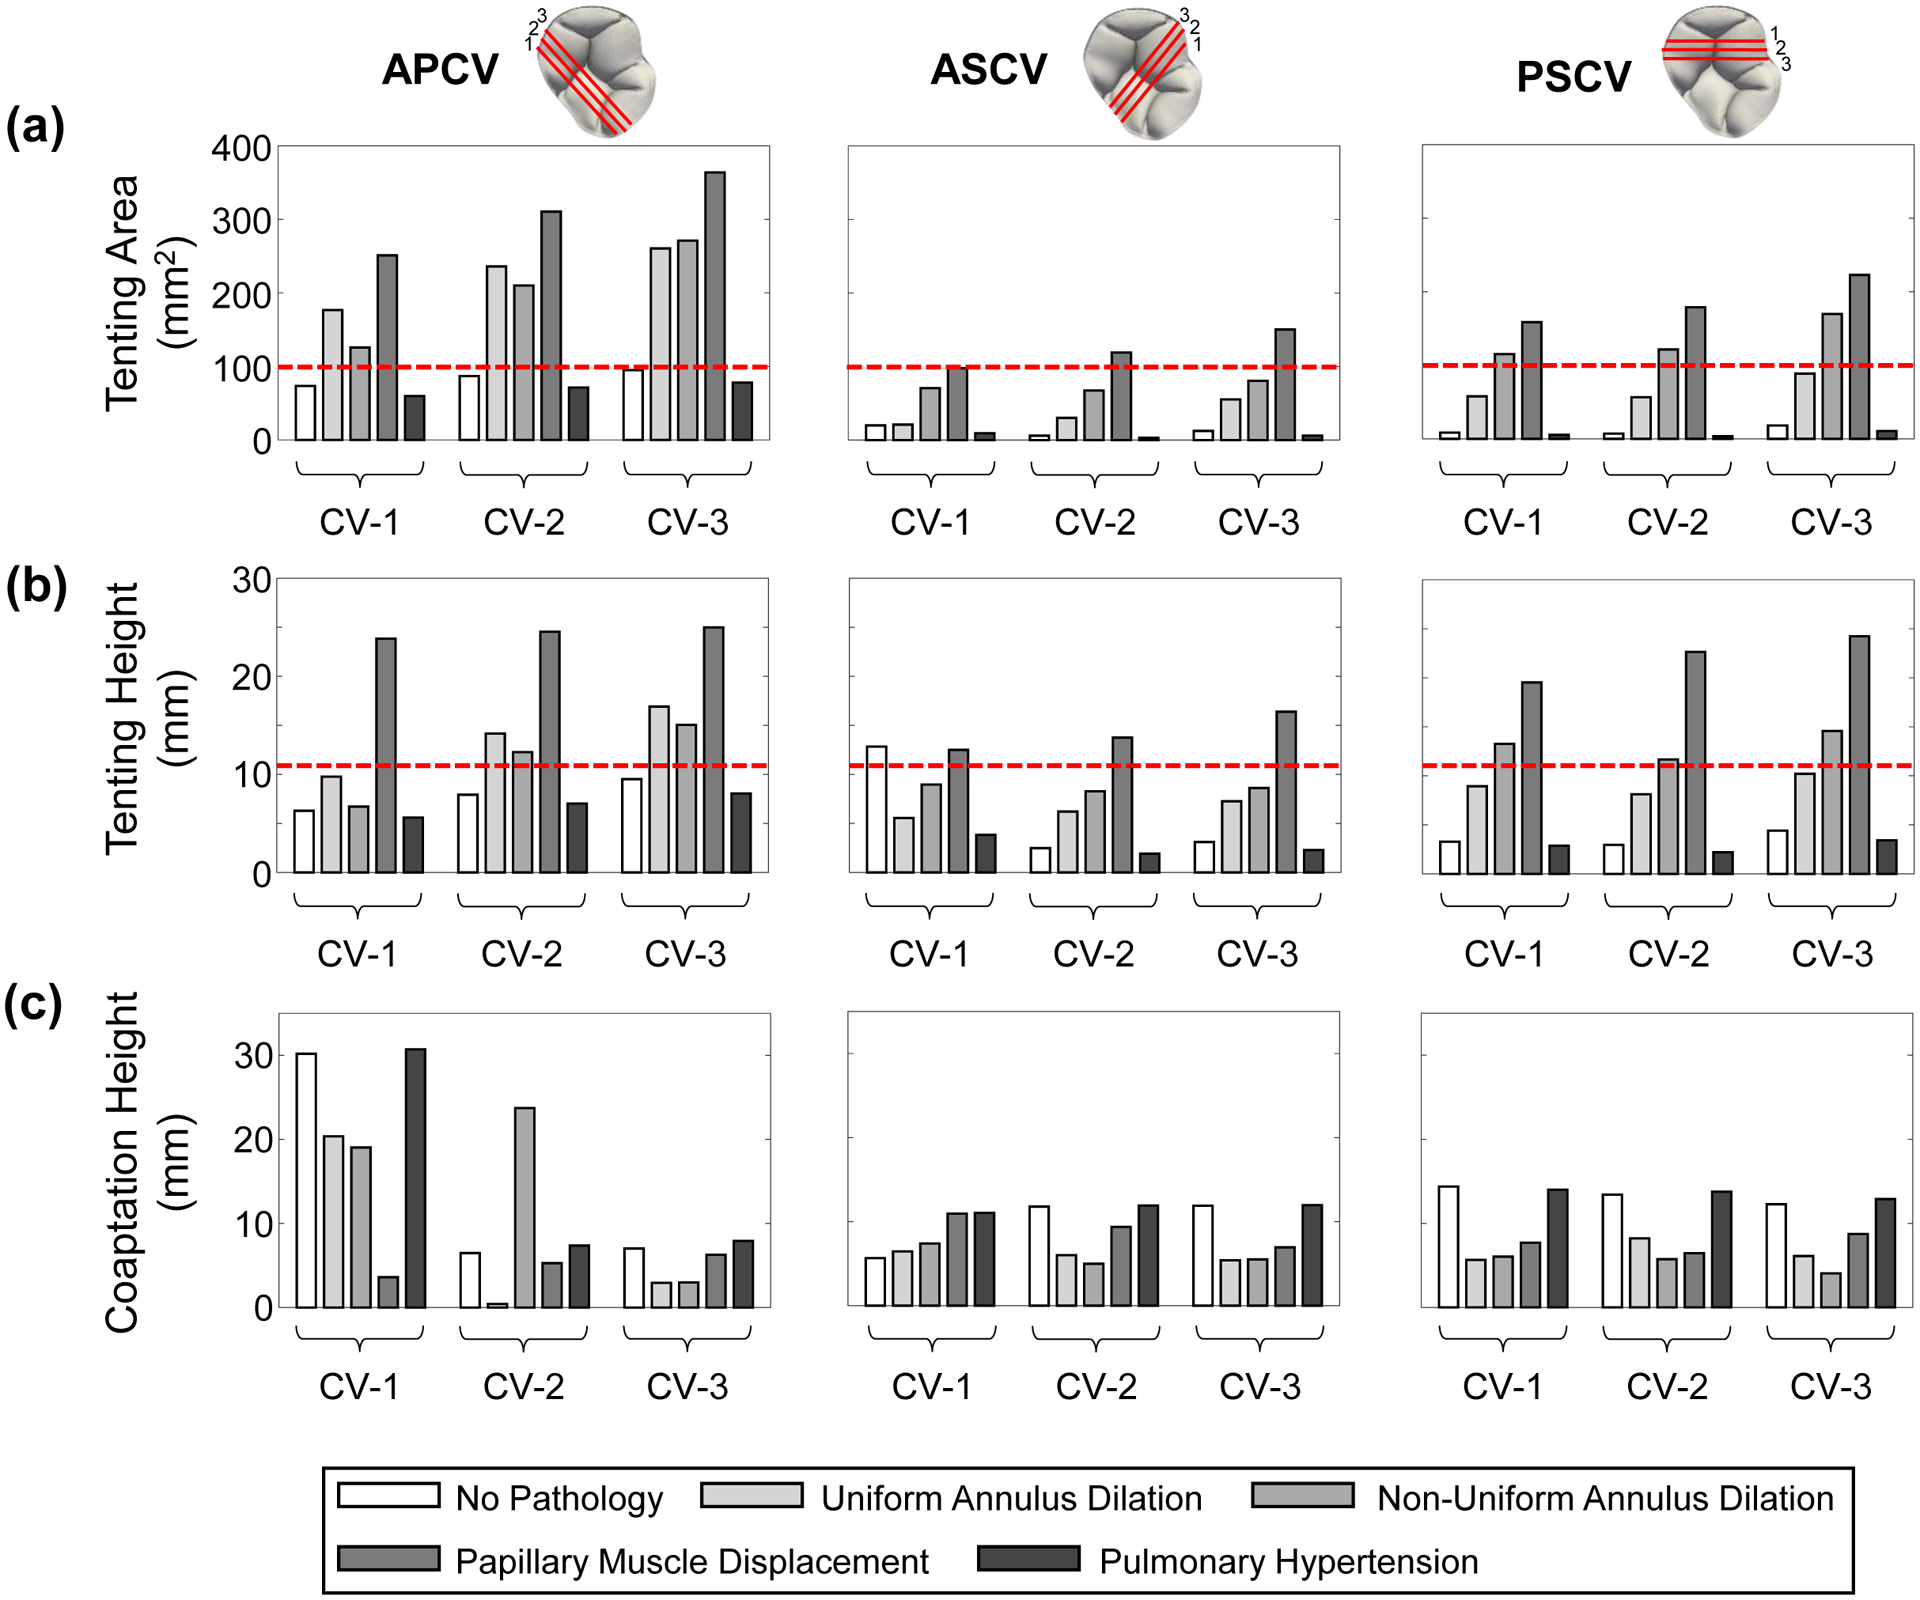
Clinically-relevant geometry metrics associated with the coaptation between two leaflets of the simulated TV for each numerical study scenario considering a saddle-shaped annulus configuration. The red dashed lines in (a) show the tenting area value observed by Kim et al. (2006) [10] while the red dashed lines in (b) show the tenting height value observed by Sukmawan et al. (2007) [36] that are associated with tricuspid regurgitation. (Acronyms: CV: cut view, APCV: anterior-posterior CV, ASCV: anterior-septal CV, PSCV: posterior-septal CV).
The changes in the geometry metrics of APCV-3, ASCV-3, and PSCV-3 for all pathological scenarios, except pulmonary hypertension, agreed with the clinical observations for the formation or worsening of TR (Table 3)—an increased tenting area (+174% to +1129%) and an increased tenting height (+58% to +450%) together with a decreased coaptation height (−10.6% to −67%). In contrast, the pulmonary hypertension study scenario resulted in opposite trends with decreases in the tenting area (−17.8% to −50.4%) and tenting height (−15.4% to −26.3%) accompanied with an increase in the coaptation height (+0.6% to +13%). Similar trends were also observed for the other cut views (Fig. 7 and Table 3) and the flattened TV annulus (Fig. S2 and Table S2). These results suggest that annulus dilation and PM displacement may be the main contributors to TV regurgitation, whereas pulmonary hypertension may be a key driver for right ventricle enlargement that could later cause tricuspid regurgitation.
Table 3 –
Percentage difference of the geometry metrics for all the pathological study scenarios with reference to the healthy TV.
| APCV-1 | APCV-2 | APCV-3 | ASCV-1 | ASCV-2 | ASCV-3 | PSCV-1 | PSCV-2 | PSCV-3 | ||
|---|---|---|---|---|---|---|---|---|---|---|
| Tenting Area | H | 73.4 mm2 | 86.7 mm2 | 94.9 mm2 | 19.9 mm2 | 6.0 mm2 | 12.5 mm2 | 8.4 mm2 | 7.1 mm2 | 18.1 mm2 |
| UAD | +140.7% | +171.9% | +174.4% | +5.8% | +403.1% | +341.9% | +584.9% | +696.0% | +388.9% | |
| NAD | +71.2% | +142.0% | +185.5% | +253.8% | +1023.5% | +544.6% | +1263.7% | +1611.2% | +835.8% | |
| PMD | +242.0% | +257.6% | +283.4% | +389.8% | +1881.9% | +1102.4% | +1778.1% | +2419.2% | +1129.0% | |
| PH | −18.7% | −17.9% | −17.8% | −53.0% | −49.8% | −50.4% | −36.7% | −49.8% | −41.5% | |
| Tenting Height | H | 6.2 mm | 7.9 mm | 9.5 mm | 12.8 mm | 2.4 mm | 3.1 mm | 3.2 mm | 2.9 mm | 4.4 mm |
| UAD | +55.3% | +78.7% | +77.8% | −56.7% | +150.3% | +134.2% | +172.4% | +174.6% | +131.5% | |
| NAD | +6.7% | +54.9% | +58.1% | −30.2% | +233.6% | +177.8% | +304.3% | +294.7% | +230.6% | |
| PMD | +279.2% | +209.7% | +162.6% | −2.6% | +454.6% | +428.7% | +494.9% | +665.2% | +449.6% | |
| PH | −11.1% | −11.4% | −15.4% | −70.2% | −22.9% | −26.3% | −12.2% | −25.4% | −22.3% | |
| Coaptation Height | H | 30.1 mm | 6.4 mm | 7.0 mm | 5.6 mm | 11.7 mm | 11.8 mm | 14.3 mm | 13.4 mm | 12.2 mm |
| UAD | −32.5% | −93.6% | −58.1% | +14.2% | −49.0% | −54.6% | −60.7% | −38.7% | −50.2% | |
| NAD | −36.9% | +266.6% | −57.5% | +30.9% | −57.7% | −53.7% | −58.0% | −57.2% | −67.0% | |
| PMD | −88.0% | −18.5% | −10.6% | +93.8% | −20.5% | −41.6% | −46.4% | −51.9% | −28.8% | |
| PH | +1.8% | +13.8% | +13.0% | +95.3% | +1.1% | +0.6% | −2.6% | +2.7% | +5.0% |
Acronyms: APCV: anterior-posterior cut view, ASCV: anterior-septal cut view, PSCV: posterior-septal cut view, H: healthy, UAD: uniform annulus dilation, NAD: non-uniform annulus dilation, PMD: papillary muscle displacement, and PH: pulmonary hypertension
3.3. Papillary Muscle Displacement Scenarios
The FE results for different types of PM displacement (apical, longitudinal, and combined, see Fig. 2b) showed the formation of a regurgitant orifice for the apical and combined PM displacement scenarios at the clinically-observed diseased state (Fig. 8). In contrast, the regurgitant orifice was not observed in the longitudinal PM displacement simulation scenarios, which showed similar results to the healthy TV. This discrepancy in the two PM displacement types suggests that the apical displacement may be the more critical contributor to the mechanical and geometrical changes that are induced by the papillary muscle displacement.
Figure 8 –
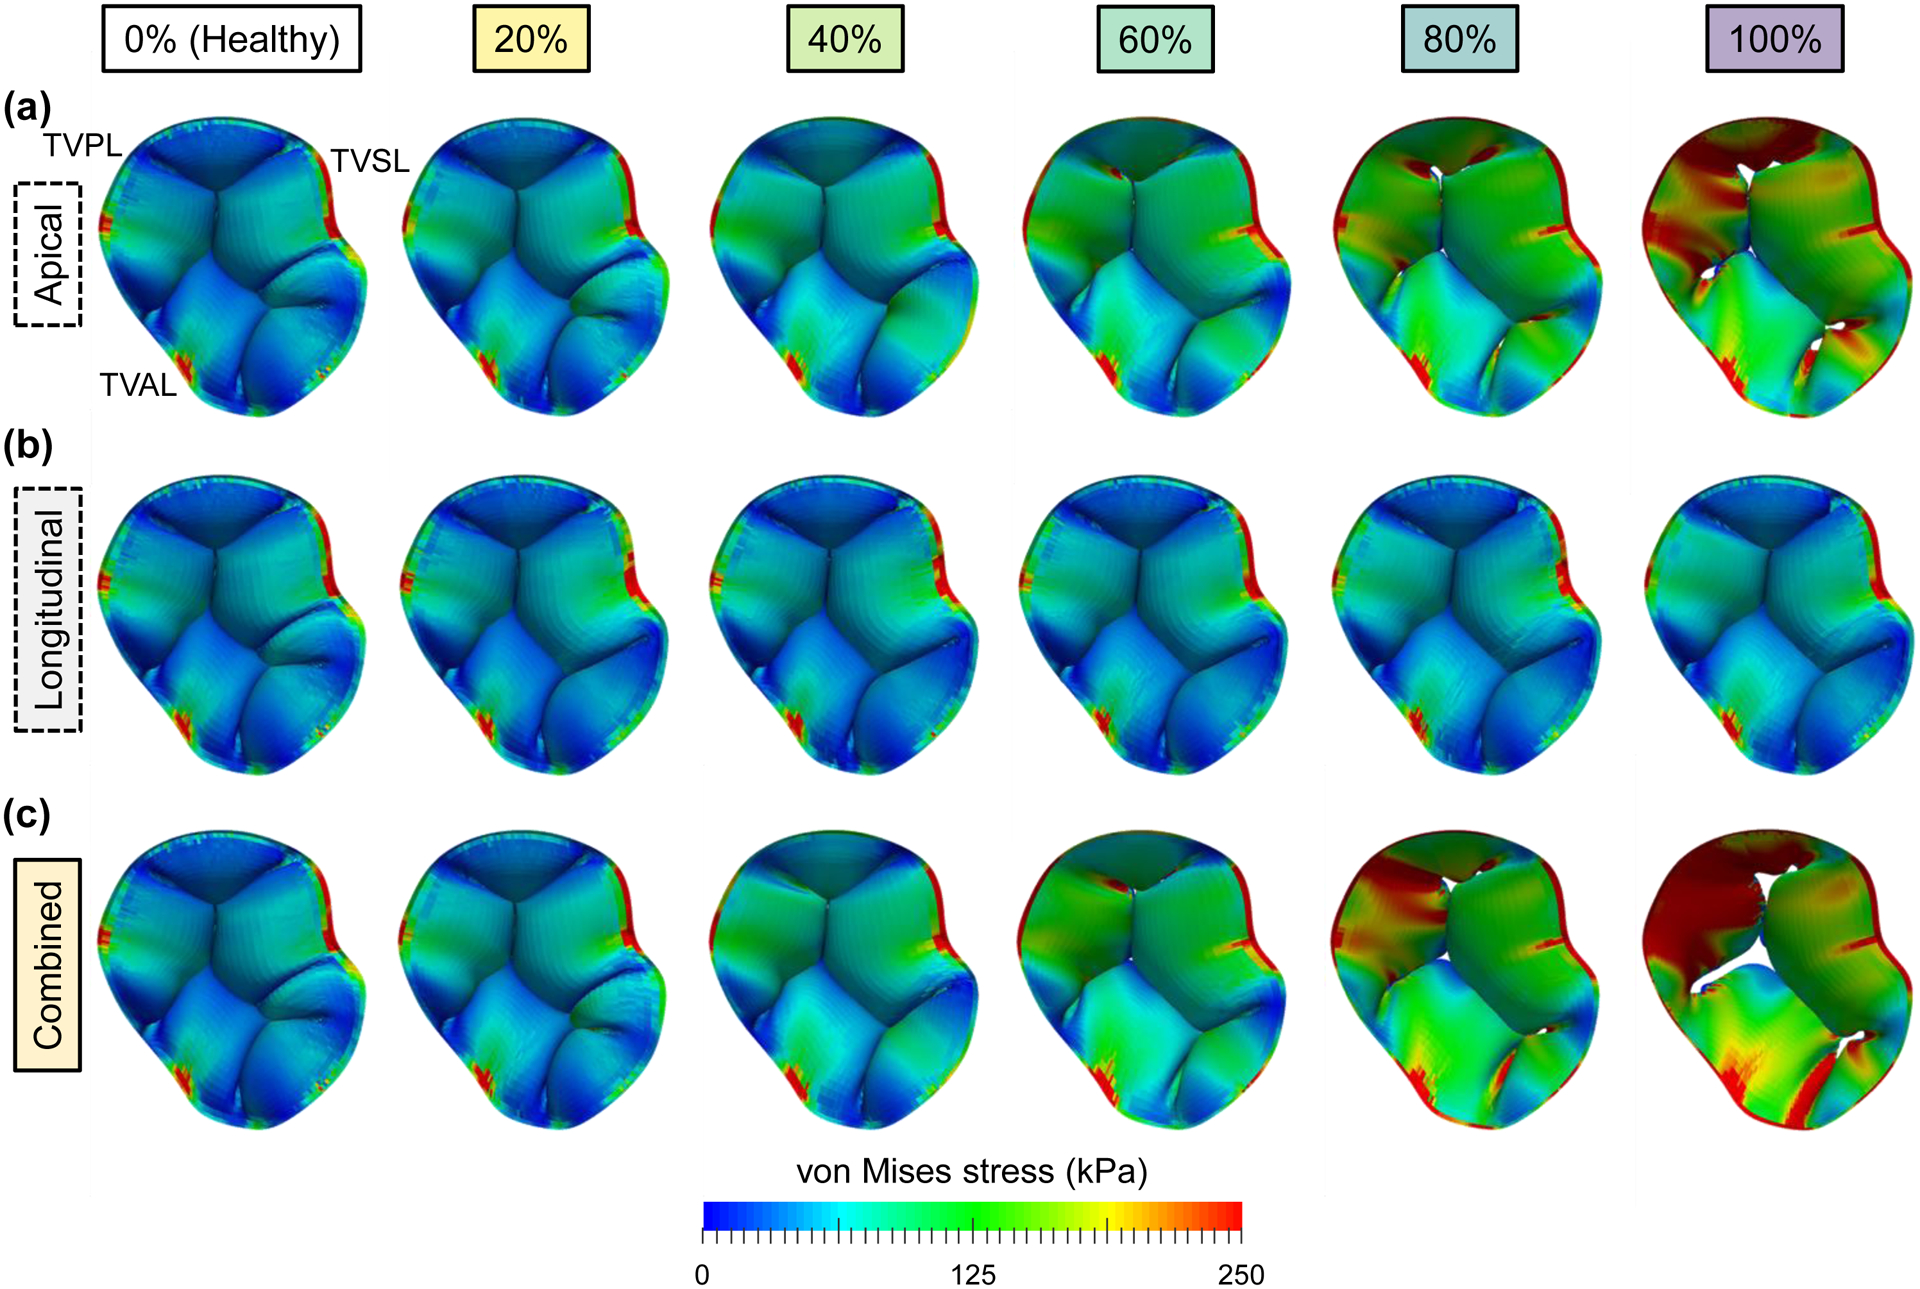
Predicted von Mises stress contours for the study sub-scenarios of papillary muscle displacement: (a) apical displacement only, (b) longitudinal displacement only, and (c) combined apical and longitudinal displacements. The columns represent the varying percentages (0–100%) of the PM displacement values found in Spinner et al. (2011) [22].
3.4. Chordae Rupture Scenarios
No scenarios associated with TV leaflet flail were observed in rupturing only one chordae group. By further considering the rupture of two chordae groups, we found five study scenarios resulting in TV leaflet flail (Fig. 9a–b). Two of those scenarios involved ruptured chordae groups attached to the TVAL, while another three involved ruptured chordae groups attached to the TVSL. The TVAL flail resulted in a decrease of the average von Mises stress of the TVPL (−2.9 to −22.5%) and an increase of the average von Mises stress of the TVSL (+60.4 to +113.8%). In contrast, the TVSL flail resulted in an increase of the average von Mises stresses of both the TVPL (+93.3 to +124.4%) and the TVSL (+102 to +104.6%). The results from this study scenario provide preliminary insight into which chordae tendineae group may have a more crucial contribution to preventing TV leaflet flail.
Figure 9 –
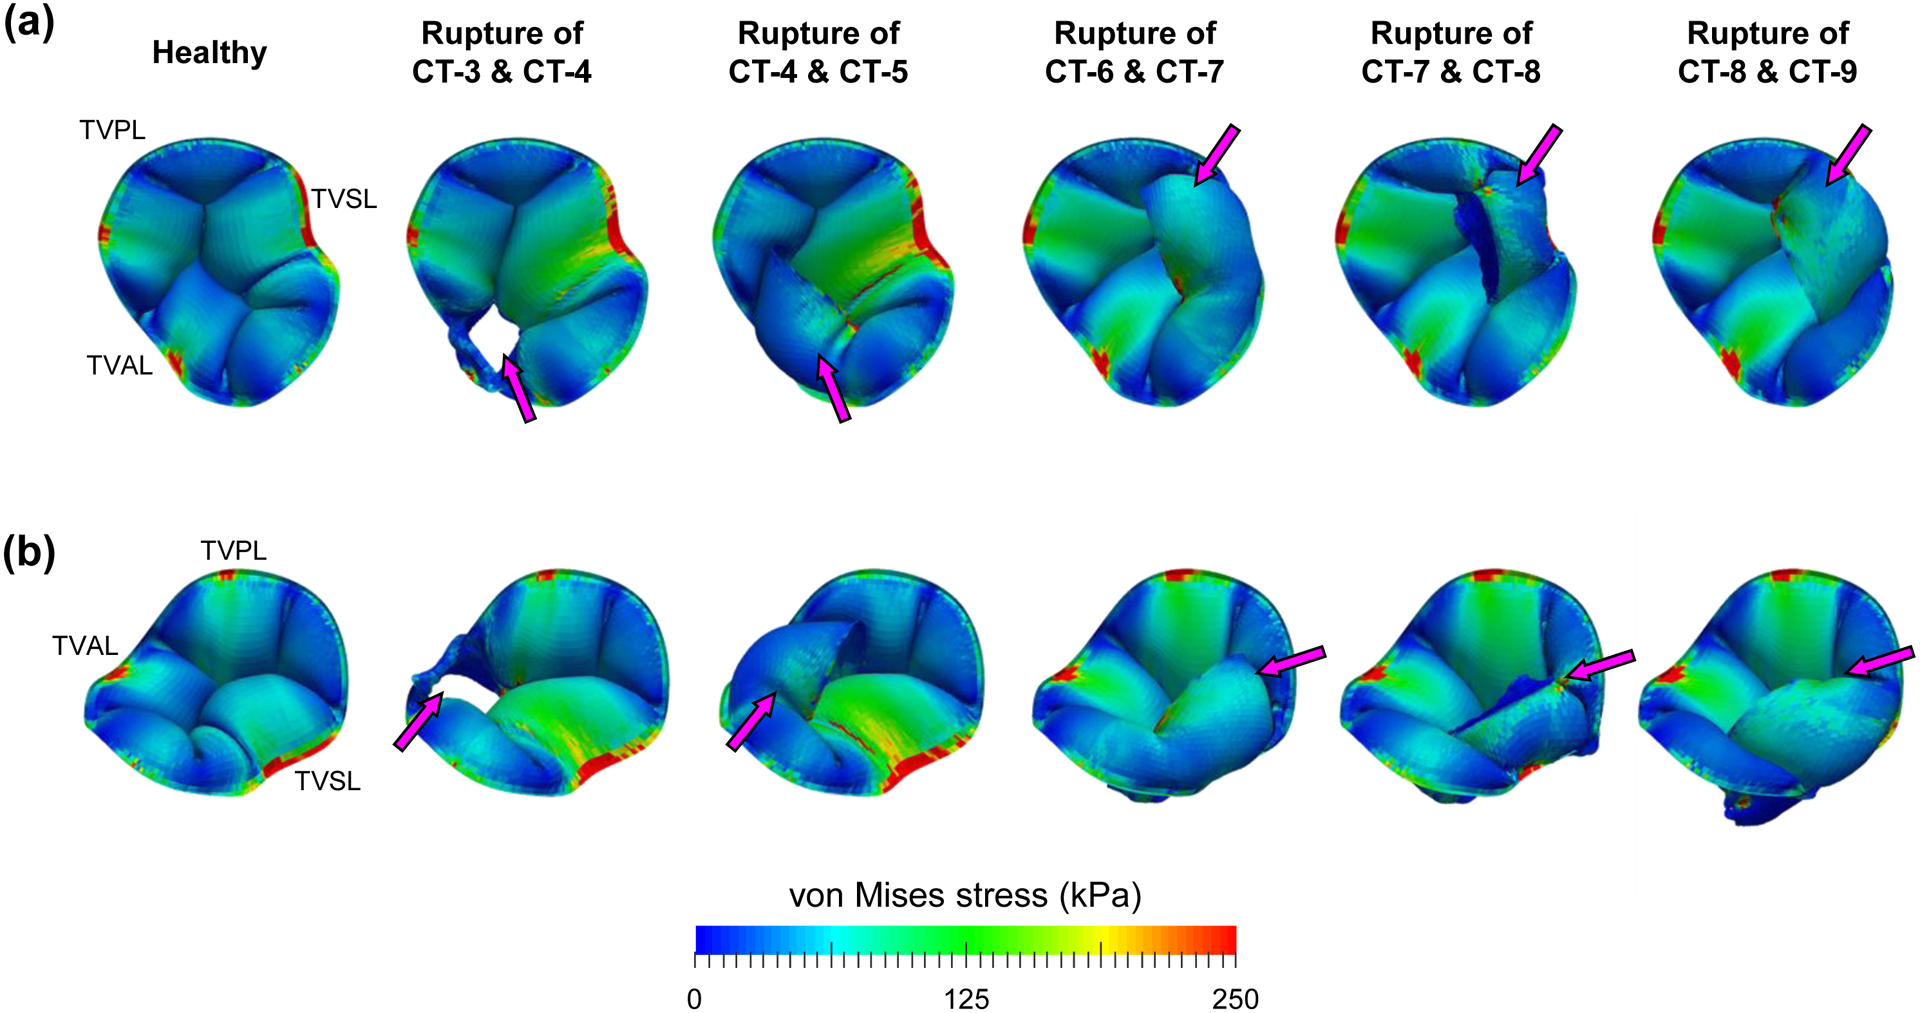
Predicted von Mises stress contours for the study scenarios of rupturing chordae groups: (a) from the superior view, and (b) from the isometric view (magenta arrows indicate the TV leaflet flail into the right atrium).
4. Discussion
4.1. Overall Findings
In this study, for the first time FE simulations were performed to study various pathological conditions of the tricuspid heart valve and to quantify pathology-induced changes to the mechanical environment and the closed valve geometry. Our results indicated that PM displacement has a more discernable effect on the engineering mechanics (+24 to +834%) and geometry metrics (−42 to 1129%) compared to TV annulus dilation (+19 to +309% and −67 to 836%) or pulmonary hypertension (+12 to +103% and −50 to 13%). This observation may have important implications for annuloplasty surgical repair that primarily aims to restrict the annulus size and restore leaflet coaptation. Alternatively, individualized surgical options could be developed to lessen the effects of leaflet tethering on the TV closing behavior [27].
Comparisons between the uniform and non-uniform annulus dilation simulation results revealed that the non-uniform dilation configuration provides a less-favorable mechanical and geometrical environment. The non-uniform dilation scenario consistently led to more observable changes in the TV leaflet stresses (+100 to 309% vs. +100 to 163%), leaflet strains (+19 to +74% vs. +20 to +43%), PM forces (+175 to +260% vs. +121 to +163%), tenting areas (+71 to +1611% vs. +6 to +696%), and tenting heights (−30 to +304% vs. −57 to +175%). These observations are in accordance with the clinical understanding that the non-uniform annulus dilation occurs on the septo-lateral plane due to restrictions imposed by the heart septum [4,5] and underscores the need for individualized surgical strategies.
In the chordae rupture study scenarios, five of the 55 simulations rupturing two chordae groups showed TV leaflet flail, which involved only the chordae groups attached to the TV anterior or septal leaflet. Interestingly, the chordae groups for each of the five simulations were neighboring chordae groups (e.g., CT-3 and CT-4 or CT-8 and CT-9, Fig. 9). These findings have clinically-relevant implications that the chordae groups attached to the anterior or septal leaflets may be more critical to ensure proper leaflet closure, and that the existing repair techniques, such as chordae replacement [28], could be refined according to the guidance provided by the in-silico modeling.
4.2. Comparisons with Existing Literature
4.2.1. Engineering Mechanics Metrics
Firstly, our simulation results of the healthy TV were compared to the existing computational modeling studies. The von Mises stresses averaged over the central region (belly) of the TV leaflets from our study (TVAL: 24.7±7.9 kPa, TVPL: 30.6±10.9 kPa, TVSL: 41.9±8.6 kPa) were larger than those documented by Singh-Gryzbon et al. (2019) [14] (12.5±6.3 kPa) but more aligned with Stevanella et al. (2010) [11] (25–100 kPa) and Kong et al. (2018) [13] (TVAL: 37–80 kPa, TVPL: 25–91 kPa, TVSL: 24–63 kPa). Differences in the predicted stresses may be due to the different material models selected and different material properties used in the current work and other numerical studies.
Secondly, the maximum principal Green-Lagrange strains averaged over the central region of the TV leaflets from our simulations (TVAL: 0.33±0.07, TVPL: 0.41±0.06, TVSL: 0.44±0.03) were slightly lower than what was found in Stevanella et al. (2010) [11]: ~0.52 but larger than those reported in Kong et al. (2018) [13] (TVAL: 0.19–0.26, TVPL: 0.07–0.17, TVSL: 0.11–0.21) and Singh-Gryzbon et al. (2019) [14]: 0.17. Moreover, when simulating a regurgitant TV, Singh-Gryzbon et al. (2019) [14] obtained a smaller increase in the predicted stresses (+7.5% vs. +372%) and in the predicted strains (+12% vs. +72%) of the leaflet’s central region as compared to the present study. The difference may be due to the choice of the diseased configuration for the reference configuration in their simulations, which may inadequately account for the effects of leaflet tethering. In contrast, choosing the healthy state as the reference configuration in our FE simulations revealed that the majority of the PM reaction forces initiated and developed at the simulated pathological scenario (blue dotted line in Figure 6d).
Thirdly, the maximum principal Green-Lagrange strains were compared with the existing ex vivo and in vivo TV studies in the literature. The peak Green-Lagrange strain for the TVSL in this study (0.44±0.03) was larger than the porcine ex vivo results (0.11) from Khoiy et al. [29]. However, our in-silico results for the TVAL (0.33±0.07), TVPL (0.41±0.06), and the TVSL (0.44±0.03) were within the range of ovine in vivo hearts (TVAL: 0.28–1.19, TVPL: 0.16–1.06, TVSL: 0.26–0.40) investigated by Mathur et al. [30]. Several factors may contribute to the differences and similarities within these studies. For example, our preliminary data showed large anatomical variations in the key model parameters (e.g., the leaflet heights and the commissure heights) for porcine hearts. These variations will likely affect the simulation results, and the inter-species variations (e.g., porcine vs. ovine) should also be considered. Moreover, the inherent differences between the ex vivo and in vivo studies, such as the active annulus contraction and ventricle-regulated transvalvular pressure, may also influence the comparisons. Our ongoing extensions of the model include incorporating the experimental data from Khoiy et al. [29] to validate our in-silico model and strengthen the comparisons with the existing literature.
Fourthly, the experimental data from previous in vitro mechanical characterizations were evaluated at an equibiaxial stress corresponding to the average von Mises stress of 29.9 kPa for the TV anterior leaflet, as found in this study (Table 4). The maximum principal stretches (approximately in the radial direction) are most similar to the radial stretches observed by Ross et al. (2019) [31]. The discrepancies in the circumferential stretches between the present simulation-based study and the existing in vitro mechanical characterizations may be due to the lack of including pre-strains in our in-silico model. Therefore, the stress-free reference condition may be most close to the in vitro “mounted” configuration prior to experimental preconditioning. This underscores the necessity for a better understanding of the true stress-free reference configuration for constitutive modeling and TV computational modeling [32].
Table 4 –
Comparison of the average tissue stretch λ and the Green-Lagrange strain E for the central region of the TVAL between the present work and other in vitro TVAL mechanical characterizations (values were determined at an equibiaxial Cauchy stress of 24.7 kPa). Results from the present study are reported in mean±SD, whereas other studies are in mean±standard error of the mean (SEM).
| Study | Species | λcirc | λrad |
|---|---|---|---|
| Present Numerical Study | – | 0.94±0.07 | 1.31±0.09 |
| Khoiy et at. (2016) [37]† | Porcine | 1.07±0.01 | 1.13±0.03 |
| Jett et al. (2018) [18]‡ | Porcine | 1.19±0.02 | 1.54±0.07 |
| Ovine (Adult) | 1.45±0.08 | 1.68±0.04 | |
| Ovine (Juvenile) | 1.48±0.09 | 1.69±0.06 | |
| Ross et al. (2019) [31]‡ | Porcine | 1.18±0.02 | 1.21±0.01 |
| Study | Species | Ecirc | Erad |
| Present Numerical Study | – | −0.06±0.07 | 0.36±0.13 |
| Pham et al. (2017) [38]† | Human | 0.11±0.01 | 0.15±0.01 |
| Pokutta-Paskaleva et al. (2019) [39]† | Porcine | 0.02±0.01 | 0.14±0.03 |
Experimental data with respect to the post-preconditioned configuration.
Experimental data with respect to the mounted configuration.
Finally, the regional deformations from the FE simulations are compared with our recent regional-based mechanical characterization study [26] (Table 5). One key observation from that experimental study was that the TVAL central regions (B and E in Fig. 3c) had a larger anisotropy index (i.e., the ratio of the radial stretch to the circumferential stretch) than the edge regions (A, C, D and F in Fig. 3c), indicating the inhomogeneous distribution of the tissue deformation. The FE results of the regional deformations in the present study showed similar characteristics near the annulus, despite using an isotropic material model, suggesting that this regional heterogeneity be related to the TV closing behavior. However, the heterogenous distribution of the tissue deformation was not as pronounced near the leaflet free edge, which may be due to the leaflet contact.
Table 5 –
Comparison of the average tissue stretch in the circumferential λcirc and the radial λrad directions between the present study and our previous study on the regional variations in the tissue mechanics of the TVAL. Results from the present study are reported in mean±SD, whereas the results from Laurence et al. (2019) [26] are provided in mean±SEM.
| TVAL Region | Present Simulation-Based Study | Laurence et al. (2019) [26] | |||||
|---|---|---|---|---|---|---|---|
| von Mises stress (kPa) | λcirc | λrad | Anisotropy Index | λcirc | λrad | Anisotropy Index | |
| A | 28.3±14.4 | 0.92±0.04 | 1.28±0.10 | 1.40±0.15 | 1.29±0.06 | 1.31±0.06 | 1.01 |
| B | 47.5±20.2 | 0.90±0.08 | 1.39±0.06 | 1.55±0.19 | 1.25±0.03 | 1.36±0.08 | 1.09 |
| C | 21.3±12.1 | 0.93±0.05 | 1.19±0.10 | 1.29±0.15 | 1.27±0.05 | 1.26±0.06 | 0.99 |
| D | 29.1±9.2 | 0.90±0.04 | 1.34±0.04 | 1.50±0.10 | 1.26±0.05 | 1.33±0.08 | 1.05 |
| E | 14.3±6.9 | 0.98±0.05 | 1.20±0.08 | 1.23±0.11 | 1.18±0.03 | 1.27±0.07 | 1.08 |
| F | 33.6±16.3 | 0.86±0.05 | 1.35±0.07 | 1.58±0.14 | 1.19±0.03 | 1.21±0.05 | 1.01 |
Note: Anisotropy Index = λrad/λcirc
4.2.2. Clinically-Relevant Geometry Metrics
The in vitro study by Casa et al. (2013) [33] compared how PM displacement and annulus dilation affected the TV closing behavior, and demonstrated that PM displacement resulted in larger changes in the tenting area. Specifically, they observed tenting area values of 10–60 mm2, which are much lower than our simulation results (50–200 mm2). These differences could arise from the selection of valve geometry. [33] used an excised porcine valve, whereas we used a parametric representation of the TV based on previous literature. Moreover, [33] showed that the TV coaptation area (analogous to the coaptation height) decreased in both PM displacement and annulus dilation, which agreed with our FE results.
On the other hand, Kim et al. (2006) [10] suggested that a tenting area >100 mm2 under an apical four-chamber view is associated with severe FTR. This observation is reflected in our FE study with the posterior-septal cut view – one possible combination for the apical four-chamber view [34,35] – showing tenting area values greater than 100 mm2 for the annulus dilation and papillary muscle displacement scenarios. Furthermore, the annulus dilation and papillary muscle displacement scenarios in the present study exhibited tenting heights >10 mm for all posterior-septal cut views, which is in good agreement with the study by Sukmawan et al. (2007) [36] that reported tenting height values of 10.6±4.0 mm for patients with FTR (n=17). However, a recent 3D echocardiography study has demonstrated that it is more likely (81% vs 19%) to view the anterior and septal leaflets rather than the posterior and septal leaflets in the apical four-chamber view [35]. With this in mind, the ASCV results from the present FE study showed tenting areas <100 mm2 and tenting heights <10 mm for the annulus dilation scenarios, suggesting no FTR. However, the finite element simulations (Fig. 5) showed clear organ-level regurgitation, implying that some patients with different heart geometries may be falsely diagnosed based on these general clinical recommendations. Rather, patient-specific geometries and biomechanical function should be considered for providing accurate clinical recommendations.
4.3. Study Limitations and Future Extensions
There are several limitations to be addressed in future work. Firstly, the material models used in this study were simplified, and homogeneous representations of the respective structure’s mechanical response were assumed, i.e., TV leaflets (isotropic) and chordae tendineae (linearly elastic). Although the material model for the TV leaflets captures some regional heterogeneities in the leaflet deformations that agree with our previous in vitro study [26], it is necessary to employ a material model that adequately captures the material anisotropy that is typically observed in the in vitro biaxial mechanical testing of TV leaflets [18,37–39] or the complex layered leaflet structure [40]. There are limited studies developing and investigating material models for the tricuspid valve [41]. Thus, an extensive study on this topic is warranted that explores existing material model’s performance for the tricuspid valve, such as the phenomenological models [42–46] or the microstructurally informed models [47–49]. Furthermore, key aspects of the TV leaflet’s microstructure could be incorporated to better understand the effects of FTR pathologies on the load-dependent relationship of tissue mechanics and collagen fiber architecture [50].
As for CT modeling, recent experimental mechanical characterizations of the mitral valve chordae tendineae have shown a nonlinear mechanical response [51,52], which is not accurately captured by the linearly elastic model used in this study. Our lab is currently quantifying the mechanical and structural properties of the TV chordae tendineae that will then be used with a material model, such as the Ogden model [53], to more accurately capture the sub-valvular component’s nonlinear mechanical response.
Secondly, we assumed a uniform thickness for the thin-shell elements of the TV leaflets and the truss elements of the chordae tendineae. This does not adequately represent the experimentally-measured non-uniform thickness of the TV leaflets [26] or the chordae classification-specific thickness [54], which may influence the FE simulation results. Although previous TV simulation studies [13,14] attempted to improve these model simplifications by using 3D solid elements, simulations with such elements for modeling an incompressible material possess well-known numerical issues, such as volumetric locking [55–57] and element distortion owing to the distinct thin-membrane structure of the heart valves. Utilizing shell elements for modeling TV leaflets, on the other hand, would be a better choice than 3D solid elements in terms of numerical stability and computational efficiency. Thus, as a moderate future extension of our work, we will incorporate the fully-comprehensive information, such as the non-uniform and chordae classification-specific thicknesses, into the shell and truss elements by using the ABAQUS *DISTRIBUTION TABLE, as described in Lee et al. (2015) [58]. Another extension of our modeling framework is to incorporate the dynamic motions of the TV annulus and PMs that better resembles the in vivo behaviors of these sub-valvular components. Khoiy et al. [29] developed an ex vivo passive beating heart apparatus to quantify the TVSL deformations and to investigate how chordae rupture affects the dynamic annulus motion [59]. We are currently enhancing our model by incorporating these ex vivo dynamic annulus deformations, and we are planning to use the experimental measurements for the septal leaflet strains from [29] as a first step towards a more comprehensive validation of the model predictions.
Thirdly, the present model does not incorporate pre-strains of the TV leaflets that are present in vivo, and the in vivo stress-free reference configuration needs to be determined. Previous studies have quantified these pre-strains for the aortic valve [60] and the mitral valve [61], and the effects of these pre-strains have been quantified via inverse finite element analysis [32,62]. In the heart valve biomechanics community it is typically assumed that the preconditioning protocol will restore the soft tissues to their in vivo functional state prior to mechanical data collection [63]. However, an exact comparison has yet to be made and the pre-strain values have not been quantified for the TV leaflets. Our group is currently designing an experimental apparatus to quantify the TV leaflet pre-strain values, and the information will be incorporated in future work using the present FE model.
Fourthly, the present model does not consider the mechanically sensitive valvular interstitial cells (VICs), which play an important role in the cell-mediated valvular growth and remodeling. Salma et al. [64] showed that the mitral valve VICs undergo a phenotypic activation from a fibroblast phenotype to a myofibroblast phenotype in pathological scenarios. The phenotypic activation is accompanied by the growth and remodeling of the extracellular matrix (ECM) of the valve leaflet tissue, including an upregulation of matrix metalloproteinases, increased collagen synthesis, and an increased presence of glycosaminoglycans (GAGs) and proteoglycans (PGs). Analogous investigations have not yet been made for the VICs of the tricuspid valve leaflets, but we anticipate that similar VIC-mediated ECM changes would occur for the diseased TV leaflets. These changes would influence the tissue-level mechanical response, such as a material stiffening in the direction of newly synthesized collagen fibers or increased viscoelasticity following glycosaminoglycan deposition [31]. Consequently, the organ-level TV function would be altered, and it is unknown how these changes would alter the in vivo stress-free reference configuration. Thus, future extensions are warranted to quantify the growth and remodeling capabilities of the VICs of the TV for enhancing our in-silico model [65]. This model enhancement would enable re-evaluation of the current clinical treatments, such as the TV annuloplasty ring with a 17% recurrence rate of moderate-to-severe or severe regurgitation after 8 years of the initial surgical repair [66], and examine new therapeutic ideas (e.g., pharmacological treatments [67]).
Fifthly, the effects of pulmonary hypertension on the right ventricle’s shape and function were not considered in the present in-silico study. Previous clinical studies [1,3] have shown an enlargement of the right ventricle following pulmonary hypertension. Although we attempted to emulate these changes in the papillary muscle displacement study scenario, it is anticipated the right ventricle geometry changes would also affect the TV apparatus due to its proximity. Therefore, an ideal scenario would be a simulation of the TV apparatus and the ventricles simultaneously, which would open new avenues for capturing the unique pathological and anatomical features of the right ventricle (RV). For example, the in-silico model could be used to simulate the RV segmental dysfunction associated with local akinesia (i.e., the reduced motion of the ventricle) [68], or it could represent 20–40% of the RV systolic pressure and volume outflow that comes from the ventricular interdependence [69]. In these scenarios, the contributions from the different ventricle regions (i.e., the inlet septum, the membranous septum, and the infundibular septum) could be systematically examined [70]. This would not only better represent the relationship between the TV and the right ventricle, but an investigation like the present study could be performed to better understand how FTR affects the right ventricle mechanical environment.
Another limitation of our study is that the results presented in this study were only for one specific TV geometry that may not be representative of the whole population. Preliminary data from our lab for porcine hearts show large ranges for the leaflet heights and the commissure heights, which will be an important consideration when formulating generalized observations about the effects of FTR on the TV function. Future extensions should consider TV geometries across different species (e.g., ovine, porcine or human) to provide more realistic comparisons to the existing in vivo ovine studies [30,71–73] and to increase the model’s clinical translatability. In parallel to this in-silico study, our labs are currently developing a versatile TV geometry modeling framework, based on non-uniform rational B-splines (NURBS), to flexibly represent various individual TV geometries and/or the population-averaged one. Interested readers are referred to our report [74]. We plan to use this geometry modeling framework with TV anatomical data from multiple porcine hearts to further explore how the anatomical variations affect the organ-level biomechanical function as well as the tissue-level mechanical responses. Nevertheless, we anticipate the trends of the results presented in this study will be relatively consistent between different geometries and species, while the magnitude of changes may be the primary difference.
Finally, the computational model must be validated using patient-specific TV geometries and boundary conditions before it can be implemented for direct use with clinical data. Once properly validated, this FE simulation pipeline can act as a virtual test bed for new treatment ideas for comparisons with the healthy or diseased TV, and existing therapeutic options. Changes in the mechanical and geometry metrics can then be determined to provide a quantitative indicator for the device’s performance prior to any in vivo animal studies or clinical trials. Additionally, patient-specific investigations can be performed to enhance the clinical diagnosis of FTR and provide personally tailored therapeutic design.
4.4. Concluding Remarks
This pilot in-silico modeling-based study has provided new insight into how FTR pathologies alter the TV biomechanical function and the closed geometry of the tricuspid heart valve. Our systematic computational investigations of the FTR pathologies have revealed that PM displacement alters the TV biomechanical function more noticeably than annulus dilation or pulmonary hypertension. Our simulation results also showed that the mechanical changes associated with non-uniform dilation are more evident than those induced by uniform annulus dilation. Furthermore, the pulmonary hypertension study scenarios exhibited opposite trends of the changes in the geometry metrics compared to the annulus dilation and PM displacement scenarios. Finally, our simulations of chordae rupture demonstrated that the chordae attached to the TV anterior and septal leaflets may be more crucial to prevent leaflet flail. These key observations could enhance the current understanding of FTR, and extensions of this work are warranted to address patient-specific diagnosis and treatment of TV disease.
Supplementary Material
Acknowledgments
Grant supports from the American Heart Association (AHA) Scientist Development Grant (SDG) Award (16SDG27760143) and the Presbyterian Health Foundation (PHF) Team Science Grant (C5122401) are greatly acknowledged. CHL was in part supported by the institutional start-up fund from the School of AME, the IBEST-OUHSC Funding for Interdisciplinary Research, and the research funding from the Research Council at OU. DWL was supported by the National Science Foundation Graduate Research Fellowship (NSF GRFP 2019254233).
Nomenclature
Anatomy & FE Result Post-Processing
- AP
Anterior-posterior
- APCV
Anterior-posterior cut view
- AS
Anterior-septal
- ASCV
Anterior-septal cut view
- CT
Chordae Tendineae
- CH
Coaptation height
- LH
Leaflet height
- PM
Papillary muscle
- PS
Posterior-septal
- PSCV
Posterior-septal cut view
- RV
Right ventricle
- TV
Tricuspid valve
- TVAL
Tricuspid valve anterior leaflet
- TVPL
Tricuspid valve posterior leaflet
- TVSL
Tricuspid valve septal leaflet
Disease & Pathology
- αx
Scaling factor in the x-direction for non-uniform TV annulus dilation
- αy
Scaling factor in the y-direction for non-uniform TV annulus dilation
Scaling factor for uniform TV annulus dilation
- FA
Flattened annulus
- FTR
Functional tricuspid regurgitation
- H
Healthy
- NAD
Non-uniform annulus dilation
- PH
Pulmonary hypertension
- PMD
Papillary muscle displacement
- UAD
Uniform annulus dilation
Modeling & Mechanics Related
- C
Right Cauchy-Green tensor
- Circ
Circumferential direction of the TV leaflets
- E
Green-Lagrange strain tensor
- F
Deformation gradient tensor
- FE
Finite element
- I1
First invariant of C
- J
Jacobian of F, i.e., detF
- λ
Stretch ratio
- MaxPE
Maximum principal Green-Lagrange strain
- MinPE
Minimum principal Green-Lagrange strain
- p
Penalty parameter to enforce the incompressibility condition
- Rad
Radial direction of the TV leaflets
- VMS
von Mises stress
- W
Strain-energy density function
Appendix A: Verification of the Material Model Implementation in the ABAQUS VUMAT Subroutine
The selected material model in Eq. (1) was implemented using the ABAQUS VUMAT subroutine and verified by simulating a 5×5 mm planar tissue undergoing biaxial tension. For this verification problem, symmetry was assumed, a displacement of 0.87 mm was applied in each direction (Fig. A1a), and the results were compared with the analytical solution (Fig. A1b). An excellent agreement between the simulations result via the VUMAT subroutine and the analytical solution verify the correct implementation of the material model for the subsequent tricuspid valve simulations.
Figure A1 –
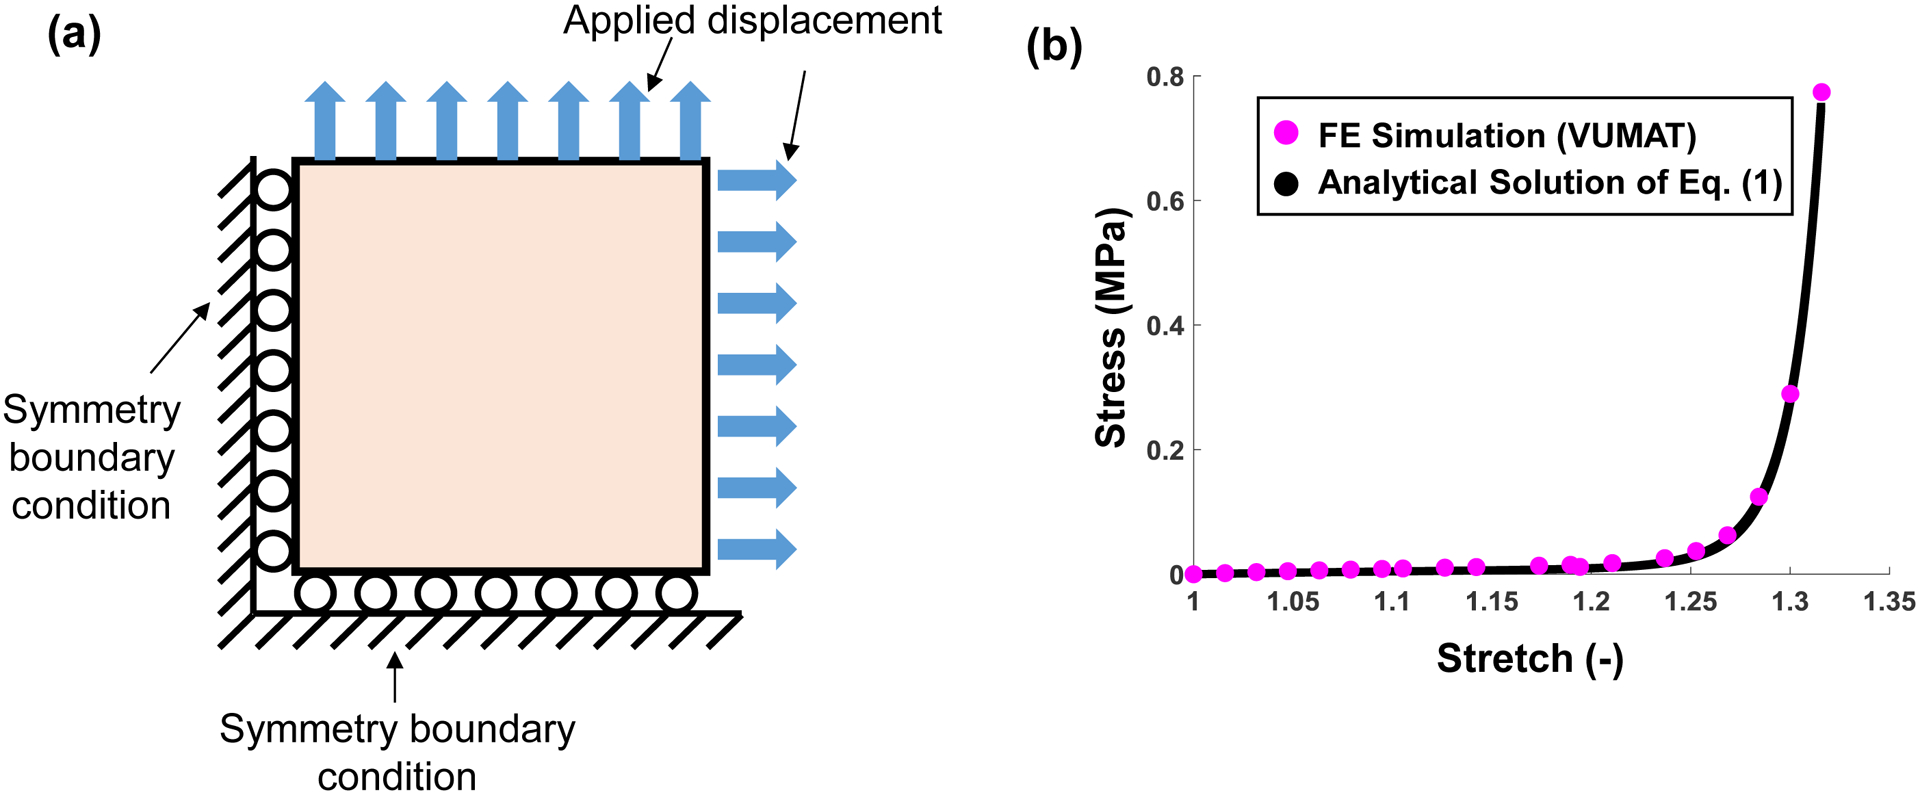
(a) Schematic of the VUMAT verification problem for simulating biaxial tension of a square specimen. (b) Comparison of the FE results and the analytical solutions.
Appendix B: Determination of the Non-Uniformly Dilated Annulus Configuration
This appendix outlines the method for determining the scaling factors for achieving the 40% annulus dilation for the non-uniform annulus dilation scenario (Section 2.2.2). The algorithm for determining the non-uniformly dilated TV annulus provided in Figure B1 is summarized as follows:
(Step 1) Make an initial guess at the values of αx and αy;
(Step 2) Create the dilated annulus geometry using Eq. (3);
- (Step 3) Compute the aspect ratio (AR), that is the ratio of the longest length in the x-direction to the longest length in the y-direction, and compare with a targeted aspect ratio of 1.0;
- If AR>1.0, then increase αx and decrease αy. Repeat Steps 2–3;
- If AR<1.0, then decrease αx and increase αy. Repeat Steps 2–3;
- If |AR-1.0| <10−6, then advance to Step 4.
- (Step 4) Compute the total annulus length Lannulus and calculate the ratio of the current annulus length to the initial annulus length L0;
- If Lannulus/L0 <1.4, increase both αx and αy and repeat Steps 2–4;
- If Lannulus/L0 >1.4, decrease both αx and αy and repeat Steps 2–4;
- If |Lannulus/L0 - 1.4| < 10–6, then the iteration is terminated and the current values of αx and αy are determined scaling factors for the non-uniform annulus dilation study scenarios.
(Step 5) Create the final dilated annulus geometry with AR=1.0 that is 1.4 times the size of the original TV annulus.
Figure B1 –
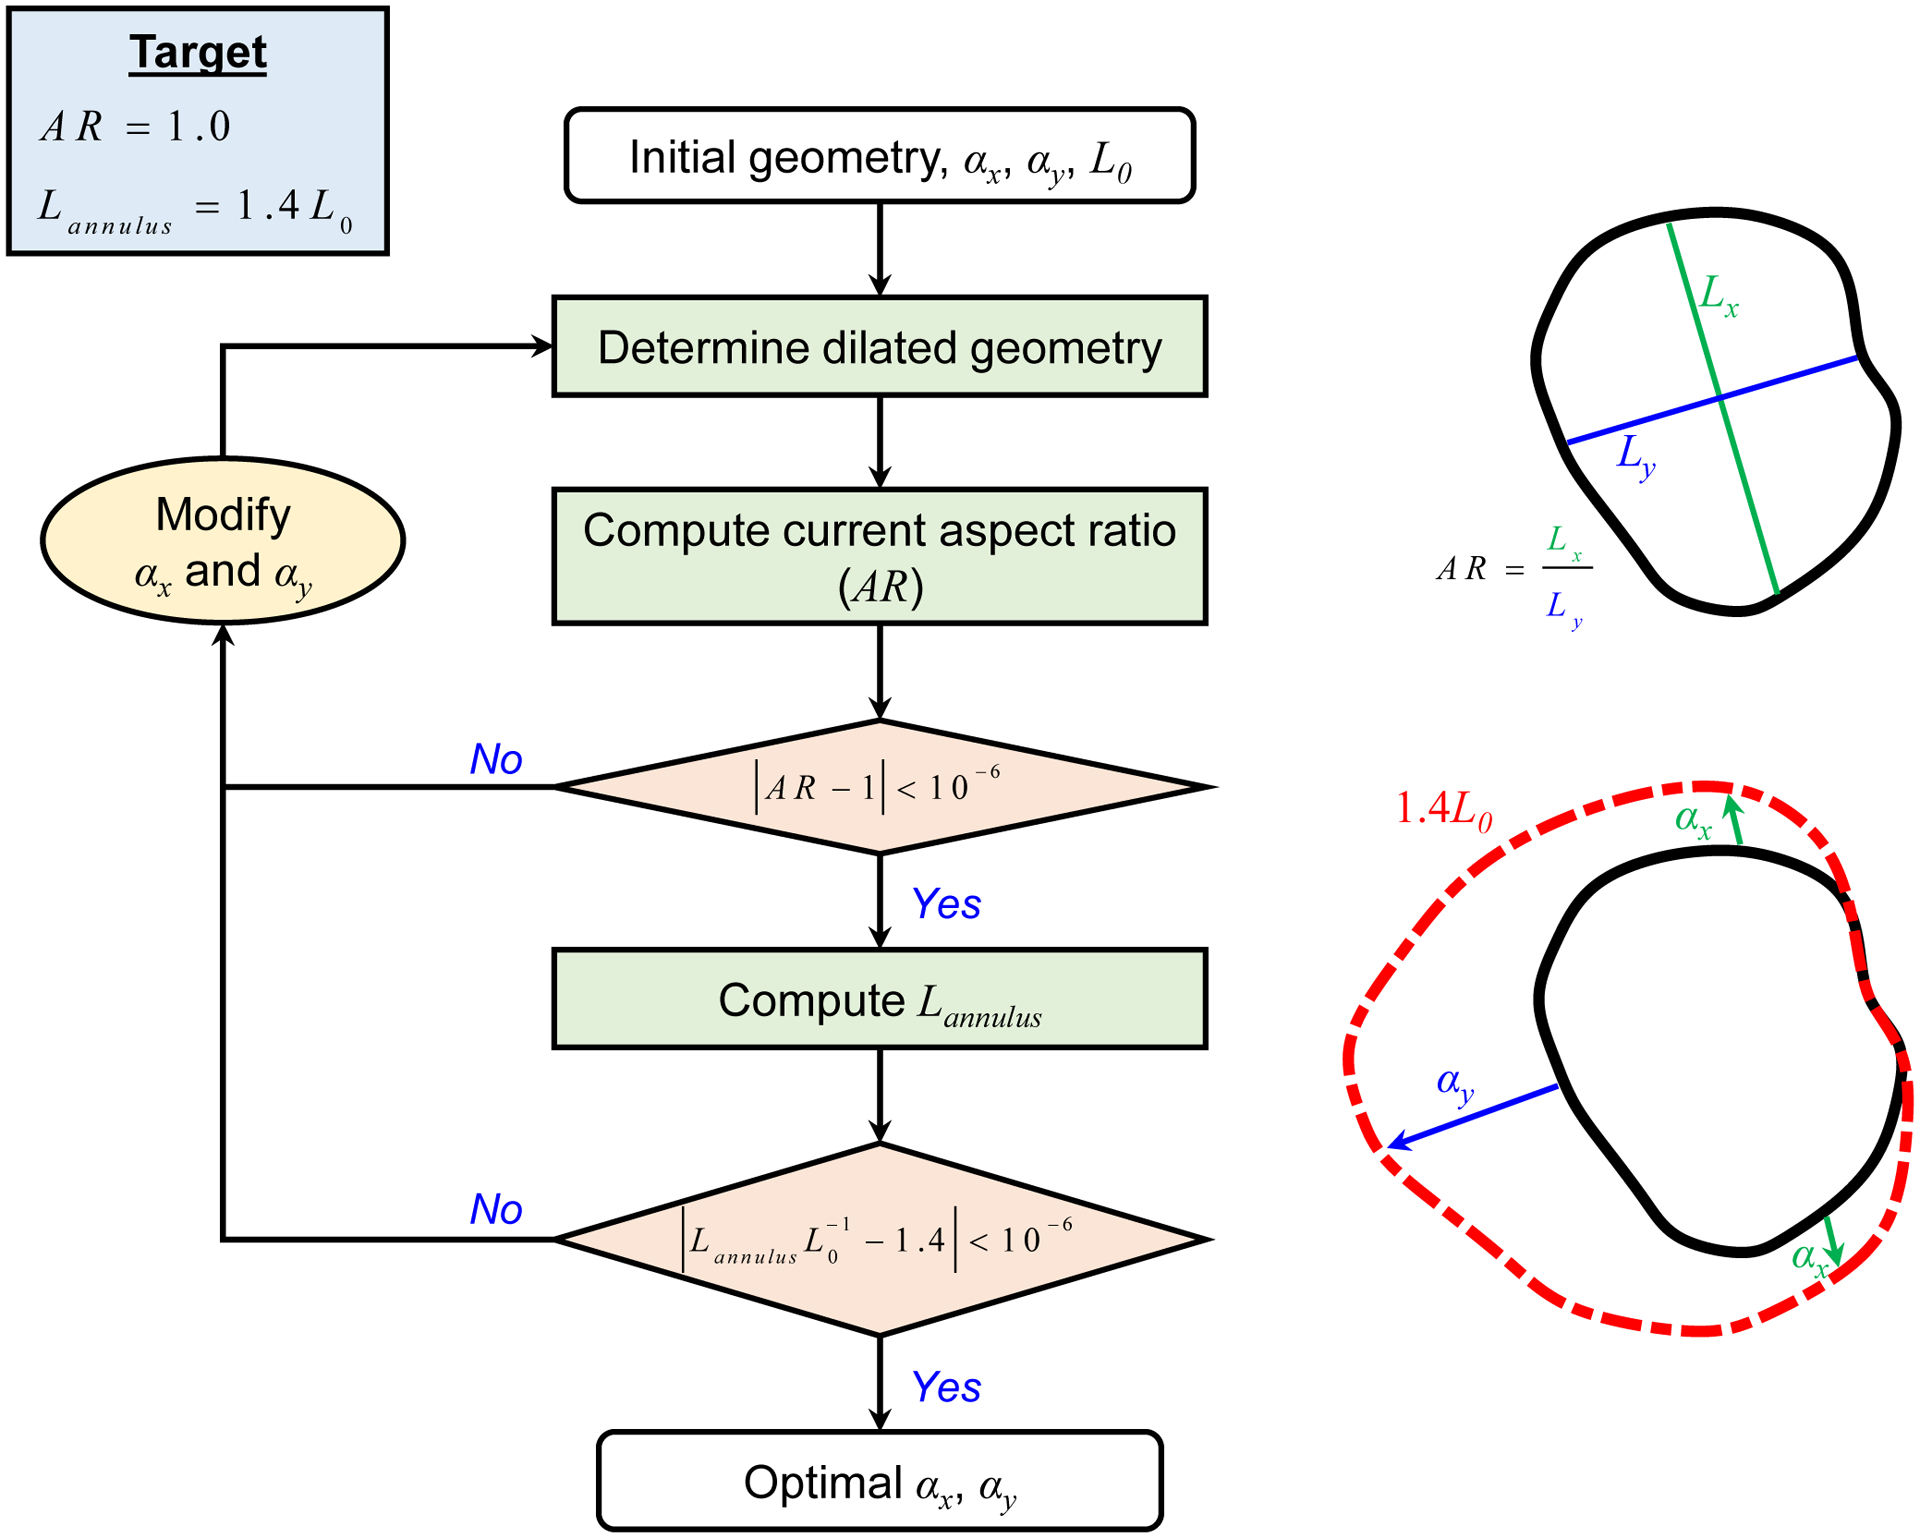
Flowchart of the algorithmic procedure to determine the optimal values of αx and αy for the non-uniform annulus dilation scenario, targeting an aspect ratio (AR) of 1.0 and Lannulus=1.4L0, where Lannulus Is the total annulus length and L0 the initial annulus length.
Appendix C: Comparison of the Healthy FE Simulation Result with the micro-CT 3D Point Cloud
The healthy FE simulation closed geometry (Fig. 5a) was compared with the micro-CT based 3D point cloud data used to generate the FE model geometry (see Section 2.1.1). A qualitative comparison of the two surfaces (Fig. C1a–b) shows that the differences are primarily in the regions where FE predictions (red surface) have creases in the closed TV leaflet configuration, such as the TVAL or the TVSL. Additionally, the bidirectional local distance measure [75] was computed to quantitatively compare the two surfaces (Fig. C1c). The statistical values of the bidirectional local distance, presented as median±0.5*interquartile range (IQR), show acceptable small errors for the three TV leaflets: 1.66±0.79 mm for the TVAL, 0.98±0.56 mm for the TVPL, and 1.12±0.70 mm for the TVSL.
Figure C1 –
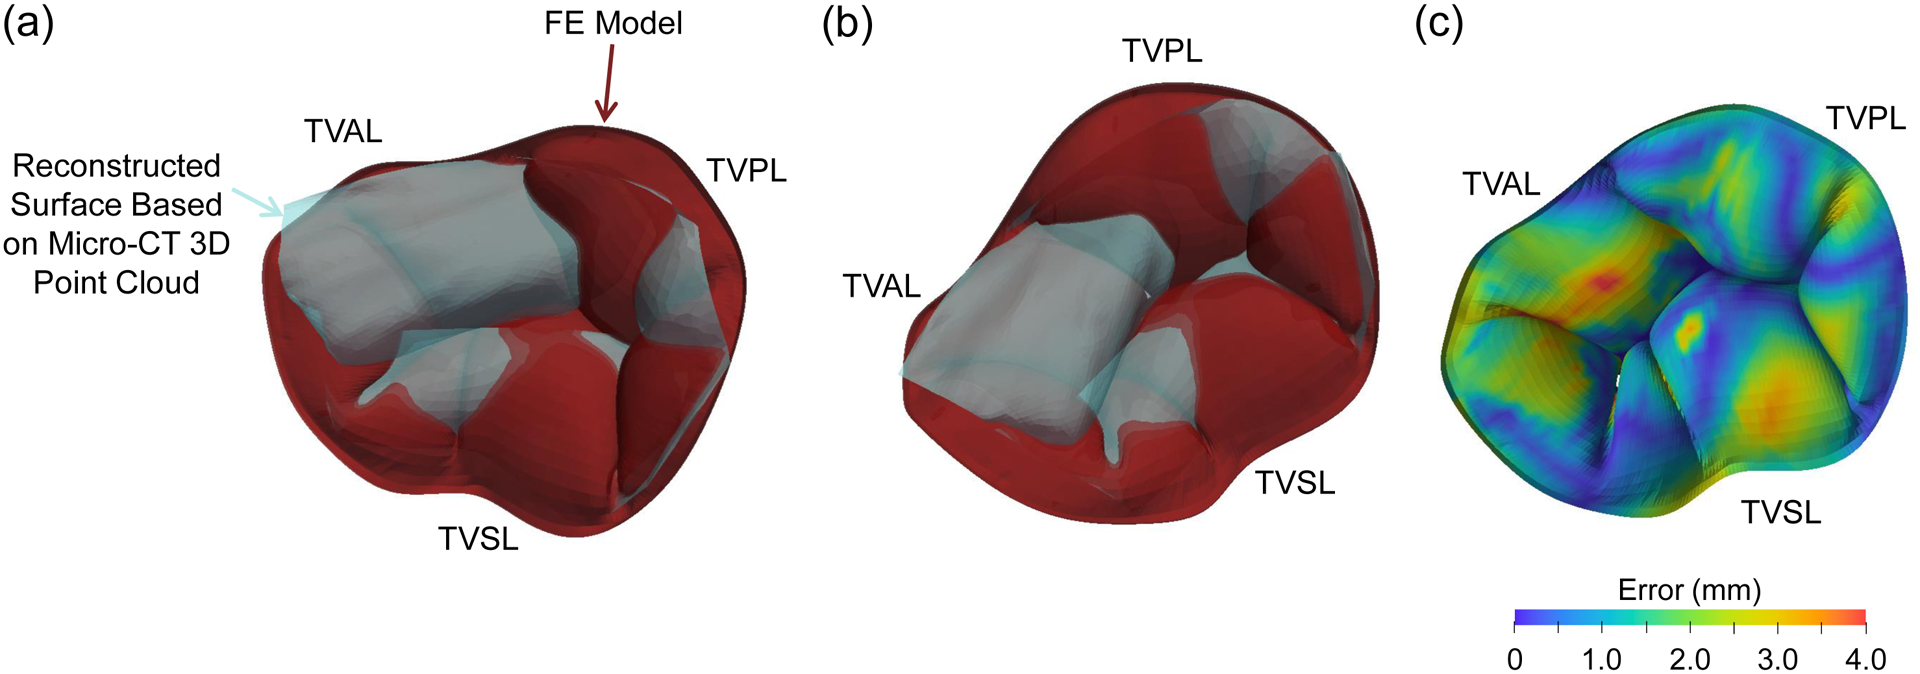
(a-b) Two selected angles of view to compare the FE simulation result (red surface) with the surface reconstructed from the image 3D point cloud data used for the FE model development (light blue surface). (c) Contour of the bidirectional local distance error measurement.
Footnotes
Conflicts of Interest
The authors of this paper have no financial or personal relationships with other people or organizations that could inappropriately influence (bias) our work.
References
- 1.Badano LP, Ginghina C, Easaw J, et al. Right ventricle in pulmonary arterial hypertension: Haemodynamics, structural changes, imaging, and proposal of a study protocol aimed to assess remodelling and treatment effects. Eur. J. Echocardiogr 2009;11(1):27–37. doi: 10.1093/ejechocard/jep152. [DOI] [PubMed] [Google Scholar]
- 2.Spinner EM, Lerakis S, Higginson J, et al. Correlates of tricuspid regurgitation as determined by 3D echocardiography: Pulmonary arterial pressure, ventricle geometry, annular dilatation, and papillary muscle displacement. Circ. Cardiovasc. Imaging 2012;5(1):43–50. doi: 10.1161/CIRCIMAGING.111.965707. [DOI] [PubMed] [Google Scholar]
- 3.Topilsky Y, Khanna A, Le Tourneau T, et al. Clinical context and mechanism of functional tricuspid regurgitation in patients with and without pulmonary hypertension. Circ. Cardiovasc. Imaging 2012;5(3):314–323. doi: 10.1161/CIRCIMAGING.111.967919. [DOI] [PubMed] [Google Scholar]
- 4.Maffessanti F, Gripari P, Pontone G, et al. Three-dimensional dynamic assessment of tricuspid and mitral annuli using cardiovascular magnetic resonance. Eur. Heart J. Cardiovasc. Imaging 2013;14(10):986–995. doi: 10.1093/ehjci/jet004. [DOI] [PubMed] [Google Scholar]
- 5.Song J-M, Jang M-K, Kim Y-J, Kim D-H, Kang D-H, Song J-K. Right ventricular remodeling determines tricuspid valve geometry and the severity of functional tricuspid regurgitation: A real-time 3-dimensional echocardiography study. Korean Circ. J 2010;40(9):448–453. doi: 10.4070/kcj.2010.40.9.448. [DOI] [PMC free article] [PubMed] [Google Scholar]
- 6.Sun Y-P, O’Gara PT. Epidemiology, anatomy, pathophysiology and clinical evaluation of functional tricuspid regurgitation. Minerva Cardioangiol. 2017;65(5):469–479. doi: 10.23736/S0026-4725.17.04398-5. [DOI] [PubMed] [Google Scholar]
- 7.Braunwald NS, Ross J Jr, Morrow AG. Conservative management of tricuspid regurgitation in patients undergoing mitral valve replacement. Circulation 1967;35(4s1):I-63–I-69. doi: 10.1161/01.CIR.35.4S1.I-63. [DOI] [PubMed] [Google Scholar]
- 8.Dreyfus GD, Corbi PJ, Chan KMJ, Bahrami T. Secondary tricuspid regurgitation or dilatation: Which should be the criteria for surgical repair? Ann. Thorac. Surg 2005;79(1):127–132. doi: 10.1016/j.athoracsur.2004.06.057. [DOI] [PubMed] [Google Scholar]
- 9.Anyanwu AC, Adams DH. Functional tricuspid regurgitation in mitral valve disease: Epidemiology and prognostic implications. Semin. Thorac. Cardiovasc. Surg 2010;22(1):69–75. doi: 10.1053/j.semtcvs.2010.05.006. [DOI] [PubMed] [Google Scholar]
- 10.Kim H-K, Kim Y-J, Park J-S, et al. Determinants of the severity of functional tricuspid regurgitation. Am. J. Cardiol 2006;98(2):236–242. doi: 10.1016/j.amjcard.2006.01.082. [DOI] [PubMed] [Google Scholar]
- 11.Stevanella M, Votta E, Lemma M, Antona C, Redaelli A. Finite element modelling of the tricuspid valve: A preliminary study. Med. Eng. Phys 2010;32(10):1213–1223. doi: 10.1016/j.medengphy.2010.08.013. [DOI] [PubMed] [Google Scholar]
- 12.Kamensky D, Xu F, Lee C-H, Yan J, Bazilevs Y, Hsu M-C. A contact formulation based on a volumetric potential: Application to isogeometric simulations of atrioventricular valves. Comput. Meth. Appl. Mech. Eng 2018;330:522–546. doi: 10.1016/j.cma.2017.11.007. [DOI] [PMC free article] [PubMed] [Google Scholar]
- 13.Kong F, Pham T, Martin C, et al. Finite element analysis of tricuspid valve deformation from multi-slice computed tomography images. Ann. Biomed. Eng 2018;46(8):1112–1127. doi: 10.1007/s10439-018-2024-8. [DOI] [PMC free article] [PubMed] [Google Scholar]
- 14.Singh-Gryzbon S, Sadri V, Toma M, Pierce EL, Wei ZA, Yoganathan AP. Development of a computational method for simulating tricuspid valve dynamics. Ann. Biomed. Eng 2019;47(6):1422–1434. doi: 10.1007/s10439-019-02243-y. [DOI] [PubMed] [Google Scholar]
- 15.Lee C-H, Laurence DW, Ross CJ, et al. Mechanics of the tricuspid valve—From clinical diagnosis/treatment, in-vivo and in-vitro investigations, to patient-specific biomechanical modeling. Bioengineering 2019;6(2):47. doi: 10.3390/bioengineering6020047. [DOI] [PMC free article] [PubMed] [Google Scholar]
- 16.Meador WD, Mathur M, Rausch MK. Tricuspid valve biomechanics: A brief review. In: ed. Advances in Heart Valve Biomechanics Springer, 2018:105–114. [Google Scholar]
- 17.Morgan AE, Howell K, Chen S, et al. Imaging and computational modeling of tricuspid regurgitation and repair. doi: 10.20517/2574-1209.2019.32. [DOI]
- 18.Jett SV, Laurence DW, Kunkel RP, et al. An investigation of the anisotropic mechanical properties and anatomical structure of porcine atrioventricular heart valves. J. Mech. Behav. Biomed. Mater 2018;87:155–171. doi: 10.1016/j.jmbbm.2018.07.024. [DOI] [PMC free article] [PubMed] [Google Scholar]
- 19.Demiray H A note on the elasticity of soft biological tissues. J. Biomech 1972;5(3):309–311. doi: 10.1016/0021-9290(72)90047-4. [DOI] [PubMed] [Google Scholar]
- 20.McLaughlin VV, Archer SL, Badesch DB, et al. ACCF/AHA 2009 expert consensus document on pulmonary hypertension: A report of the American College of Cardiology Foundation Task Force on expert consensus documents and the American Heart Association developed in collaboration with the American College of Chest Physicians; American Thoracic Society, Inc.; and the Pulmonary Hypertension Association. J. Am. Coll. Cardiol 2009;53(17):1573–1619. doi: 10.1016/j.jacc.2009.01.004. [DOI] [PubMed] [Google Scholar]
- 21.Thabut G, Dauriat G, Stern JB, et al. Pulmonary hemodynamics in advanced COPD candidates for lung volume reduction surgery or lung transplantation. Chest 2005;127(5):1531–1536. doi: 10.1378/chest.127.5.1531. [DOI] [PubMed] [Google Scholar]
- 22.Spinner EM, Shannon P, Buice D, et al. In vitro characterization of the mechanisms responsible for functional tricuspid regurgitation. Circulation 2011;124(8):920–929. doi: 10.1161/CIRCULATIONAHA.110.003897. [DOI] [PubMed] [Google Scholar]
- 23.Chan MC, Giannetti N, Kato T, et al. Severe tricuspid regurgitation after heart transplantation. The Journal of heart and lung transplantation 2001;20(7):709–717. doi: 10.1016/s1053-2498(01)00258-3. [DOI] [PubMed] [Google Scholar]
- 24.D’Aloia A, Bonadei I, Vizzardi E, et al. Different types of tricuspid flail: Case reports and review of the literature. Hellenic Journal of Cardiology 2016;57(2):134–137. doi: 10.1016/j.hjc.2016.03.007. [DOI] [PubMed] [Google Scholar]
- 25.Pan J-Y, Lin C-C, Chang J-P. Successful repair of neonatal tricuspid regurgitation due to chordae rupture. J. Thorac. Dis 2018;10(3):E186. doi: 10.21037/jtd.2018.02.08. [DOI] [PMC free article] [PubMed] [Google Scholar]
- 26.Laurence DW, Ross CJ, Jett SV, et al. An investigation of regional variations in the biaxial mechanical properties and stress relaxation behaviors of porcine atrioventricular heart valve leaflets. J. Biomech 2019;83:16–27. doi: 10.1016/j.jbiomech.2018.11.015. [DOI] [PMC free article] [PubMed] [Google Scholar]
- 27.Yamauchi H, Vasilyev NV, Marx GR, et al. Right ventricular papillary muscle approximation as a novel technique of valve repair for functional tricuspid regurgitation in an ex vivo porcine model. J. Thorac. Cardiovasc. Surg 2012;144(1):235–242. doi: 10.1016/j.jtcvs.2012.01.028. [DOI] [PubMed] [Google Scholar]
- 28.Tabata M, Kasegawa H, Fukui T, Shimizu A, Sato Y, Takanashi S. Long-term outcomes of artificial chordal replacement with tourniquet technique in mitral valve repair: A single-center experience of 700 cases. J. Thorac. Cardiovasc. Surg 2014;148(5):2033–2038. e2031. doi: 10.1016/j.jtcvs.2014.03.045. [DOI] [PubMed] [Google Scholar]
- 29.Khoiy KA, Biswas D, Decker TN, Asgarian KT, Loth F, Amini R. Surface strains of porcine tricuspid valve septal leaflets measured in ex vivo beating hearts. J. Biomech. Eng 2016;138(11):111006. doi: 10.1115/1.4034621. [DOI] [PubMed] [Google Scholar]
- 30.Mathur M, Jazwiec T, Meador WD, et al. Tricuspid valve leaflet strains in the beating ovine heart. Biomech. Model. Mechanobiol 2019;18(5):1351–1361. doi: 10.1007/s10237-019-01148-y. [DOI] [PMC free article] [PubMed] [Google Scholar]
- 31.Ross CJ, Laurence DW, Richardson J, et al. An investigation of the glycosaminoglycan contribution to biaxial mechanical behaviors of porcine atrioventricular heart valve leaflets. J. R. Soc. Interface 2019;16(156):20190069. doi: 10.1098/rsif.2019.0069. [DOI] [PMC free article] [PubMed] [Google Scholar]
- 32.Rausch MK, Kuhl E. On the effect of prestrain and residual stress in thin biological membranes. J. Mech. Phys. Solids 2013;61(9):1955–1969. doi: 10.1016/j.jmps.2013.04.005. [DOI] [PMC free article] [PubMed] [Google Scholar]
- 33.Casa LD, Dolensky JR, Spinner EM, Veledar E, Lerakis S, Yoganathan AP. Impact of pulmonary hypertension on tricuspid valve function. Ann. Biomed. Eng 2013;41(4):709–724. doi: 10.1007/s10439-012-0713-2. [DOI] [PubMed] [Google Scholar]
- 34.Addetia K, Yamat M, Mediratta A, et al. Comprehensive two-dimensional interrogation of the tricuspid valve using knowledge derived from three-dimensional echocardiography. J. Am. Soc. Echocardiogr 2016;29(1):74–82. doi: 10.1016/j.echo.2015.08.017. [DOI] [PMC free article] [PubMed] [Google Scholar]
- 35.Stankovic I, Daraban AM, Jasaityte R, Neskovic AN, Claus P, Voigt J-U. Incremental value of the en face view of the tricuspid valve by two-dimensional and three-dimensional echocardiography for accurate identification of tricuspid valve leaflets. J. Am. Soc. Echocardiogr 2014;27(4):376–384. doi: 10.1016/j.echo.2013.12.017. [DOI] [PubMed] [Google Scholar]
- 36.Sukmawan R, Watanabe N, Ogasawara Y, et al. Geometric changes of tricuspid valve tenting in tricuspid regurgitation secondary to pulmonary hypertension quantified by novel system with transthoracic real-time 3-dimensional echocardiography. J. Am. Soc. Echocardiogr 2007;20(5):470–476. doi: 10.1016/j.echo.2006.10.001. [DOI] [PubMed] [Google Scholar]
- 37.Khoiy KA, Amini R. On the biaxial mechanical response of porcine tricuspid valve leaflets. J. Biomech. Eng 2016;138(10):104504. doi: 10.1115/1.4034426. [DOI] [PubMed] [Google Scholar]
- 38.Pham T, Sulejmani F, Shin E, Wang D, Sun W. Quantification and comparison of the mechanical properties of four human cardiac valves. Acta Biomater. 2017;54:345–355. doi: 10.1016/j.actbio.2017.03.026. [DOI] [PubMed] [Google Scholar]
- 39.Pokutta-Paskaleva A, Sulejmani F, DelRocini M, Sun W. Comparative mechanical, morphological, and microstructural characterization of porcine mitral and tricuspid leaflets and chordae tendineae. Acta Biomater. 2019;85:241–252. doi: 10.1016/j.actbio.2018.12.029. [DOI] [PMC free article] [PubMed] [Google Scholar]
- 40.Kramer KE, Ross CJ, Laurence DW, et al. An investigation of layer-specific tissue biomechanics of porcine atrioventricular heart valve leaflets. Acta Biomater. 2019;96:368–384. doi: 10.1016/j.actbio.2019.06.049. [DOI] [PMC free article] [PubMed] [Google Scholar]
- 41.Khoiy KA, Pant AD, Amini R. Quantification of material constants for a phenomenological constitutive model of porcine tricuspid valve leaflets for simulation applications. J. Biomech. Eng 2018;140(9):094503. doi: 10.1115/1.4040126. [DOI] [PubMed] [Google Scholar]
- 42.Holzapfel GA, Gasser TC, Ogden RW. A new constitutive framework for arterial wall mechanics and a comparative study of material models. J. Elast. Phys. Sci. Solids 2000;61(1–3):1–48. doi: 10.1023/A:1010835316564. [DOI] [Google Scholar]
- 43.Lee C-H, Amini R, Gorman RC, Gorman JH 3rd, Sacks MS. An inverse modeling approach for stress estimation in mitral valve anterior leaflet valvuloplasty for in-vivo valvular biomaterial assessment. J. Biomech 2014;47(9):2055–2063. doi: 10.1016/j.jbiomech.2013.10.058. [DOI] [PMC free article] [PubMed] [Google Scholar]
- 44.May-Newman K, Yin FC. A constitutive law for mitral valve tissue. J. Biomech. Eng 1998;120(1):38–47. doi: 10.1115/1.2834305. [DOI] [PubMed] [Google Scholar]
- 45.Prot V, Skallerud B, Holzapfel GA. Transversely isotropic membrane shells with application to mitral valve mechanics. Constitutive modelling and finite element implementation. Int. J. Numer. Meth. Eng 2007;71(8):987–1008. doi: 10.1002/nme.1983. [DOI] [Google Scholar]
- 46.Tong P, Fung Y-C. The stress-strain relationship for the skin. J. Biomech 1976;9(10):649–657. doi: 10.1016/0021-9290(76)90107-X. [DOI] [PubMed] [Google Scholar]
- 47.Fan R, Sacks MS. Simulation of planar soft tissues using a structural constitutive model: Finite element implementation and validation. J. Biomech 2014;47(9):2043–2054. doi: 10.1016/j.jbiomech.2014.03.014. [DOI] [PMC free article] [PubMed] [Google Scholar]
- 48.Holzapfel GA, Niestrawska JA, Ogden RW, Reinisch AJ, Schriefl AJ. Modelling non-symmetric collagen fibre dispersion in arterial walls. J. R. Soc. Interface 2015;12(106):20150188. doi: 10.1098/rsif.2015.0188. [DOI] [PMC free article] [PubMed] [Google Scholar]
- 49.Zhang W, Ayoub S, Liao J, Sacks MS. A meso-scale layer-specific structural constitutive model of the mitral heart valve leaflets. Acta Biomater. 2016;32:238–255. doi: 10.1016/j.actbio.2015.12.001. [DOI] [PMC free article] [PubMed] [Google Scholar]
- 50.Jett SV, Hudson LT, Baumwart R, et al. Integration of polarized spatial frequency domain imaging (pSFDI) with a biaxial mechanical testing system for quantification of load-dependent collagen architecture in soft collagenous tissues. Acta Biomater. 2020;102:149–168. doi: 10.1016/j.actbio.2019.11.028. [DOI] [PMC free article] [PubMed] [Google Scholar]
- 51.Chen L, Yin FC, May-Newman K. The structure and mechanical properties of the mitral valve leaflet-strut chordae transition zone. J. Biomech. Eng 2004;126(2):244–251. [DOI] [PubMed] [Google Scholar]
- 52.Zuo K, Pham T, Li K, Martin C, He Z, Sun W. Characterization of biomechanical properties of aged human and ovine mitral valve chordae tendineae. J. Mech. Behav. Biomed. Mater 2016;62:607–618. doi: 10.1016/j.jmbbm.2016.05.034. [DOI] [PMC free article] [PubMed] [Google Scholar]
- 53.Ogden RW. Elastic deformations of rubberlike solids. In: Hopkins HG and Sewell MJ, ed. Mechanics of Solids. New York: Pergamon, 1982:499–537. [Google Scholar]
- 54.Ross CJ, Laurence DW, Hsu M-C, et al. Mechanics of porcine heart valves’ strut chordae tendineae investigated as a leaflet–chordae–papillary muscle entity. Ann. Biomed. Eng 2020. doi: 10.1007/s10439-020-02464-6. [DOI] [PMC free article] [PubMed] [Google Scholar]
- 55.Ausserer M, Lee S. An eighteen‐node solid element for thin shell analysis. Int. J. Numer. Meth. Eng 1988;26(6):1345–1364. doi: 10.1002/nme.1620260609. [DOI] [Google Scholar]
- 56.Doll S, Schweizerhof K, Hauptmann R, Freischläger C. On volumetric locking of low‐order solid and solid‐shell elements for finite elastoviscoplastic deformations and selective reduced integration. EngCo 2000;17(7):874–902. doi: 10.1108/02644400010355871. [DOI] [Google Scholar]
- 57.Sze K, Chan W, Pian T. An eight‐node hybrid‐stress solid‐shell element for geometric non‐linear analysis of elastic shells. Int. J. Numer. Meth. Eng 2002;55(7):853–878. doi: 10.1002/nme.535. [DOI] [Google Scholar]
- 58.Lee C-H, Rabbah J-P, Yoganathan AP, Gorman RC, Gorman JH III, Sacks MS. On the effects of leaflet microstructure and constitutive model on the closing behavior of the mitral valve. Biomech. Model. Mechanobiol 2015;14(6):1281–1302. doi: 10.1007/s10237-015-0674-0. [DOI] [PMC free article] [PubMed] [Google Scholar]
- 59.Khoiy KA, Asgarian KT, Loth F, Amini R. Dilation of tricuspid valve annulus immediately after rupture of chordae tendineae in ex-vivo porcine hearts. PLoS ONE 2018;13(11):e0206744. doi: 10.1371/journal.pone.0206744. [DOI] [PMC free article] [PubMed] [Google Scholar]
- 60.Aggarwal A, Pouch AM, Lai E, et al. In-vivo heterogeneous functional and residual strains in human aortic valve leaflets. J. Biomech 2016;49(12):2481–2490. doi: 10.1016/j.jbiomech.2016.04.038. [DOI] [PMC free article] [PubMed] [Google Scholar]
- 61.Amini R, Eckert CE, Koomalsingh K, et al. On the in vivo deformation of the mitral valve anterior leaflet: Effects of annular geometry and referential configuration. Ann. Biomed. Eng 2012;40(7):1455–1467. doi: 10.1007/s10439-012-0524-5. [DOI] [PMC free article] [PubMed] [Google Scholar]
- 62.Feng Y, Lee C-H, Sun L, Ji S, Zhao X. Characterizing white matter tissue in large strain via asymmetric indentation and inverse finite element modeling. J. Mech. Behav. Biomed. Mater 2017;65:490–501. doi: 10.1016/j.jmbbm.2016.09.020. [DOI] [PMC free article] [PubMed] [Google Scholar]
- 63.Chuong C-J, Fung Y-C. Residual Stress in Arteries. In: Schmid-Schnöbein GW, Woo SL-Y and Zweifach BW, ed. Frontiers in Biomechanics. New York: Springer-Verlag, 1986:117–129. [Google Scholar]
- 64.Ayoub S, Lee C-H, Driesbaugh KH, et al. Regulation of valve interstitial cell homeostasis by mechanical deformation: Implications for heart valve disease and surgical repair. J. R. Soc. Interface 2017;14(135):20170580. doi: 10.1098/rsif.2017.0580. [DOI] [PMC free article] [PubMed] [Google Scholar]
- 65.Cyron C, Humphrey J. Growth and remodeling of load-bearing biological soft tissues. Mecc 2017;52(3):645–664. doi: 10.1007/s11012-016-0472-5. [DOI] [PMC free article] [PubMed] [Google Scholar]
- 66.Pozzoli A, Lapenna E, Vicentini L, Alfieri O, De Bonis M. Surgical indication for functional tricuspid regurgitation at initial operation: judging from long term outcomes. Gen. Thorac. Cardiovasc. Surg 2016;64(9):509–516. doi: 10.1007/s11748-016-0677-5. [DOI] [PubMed] [Google Scholar]
- 67.Rausch MK. Growth and remodeling of the atrioventricular heart valves: A potential target for pharmacological treatment? Current Opinion in Biomedical Engineering 2019. doi: 10.1016/j.cobme.2019.12.008. [DOI] [Google Scholar]
- 68.McConnell MV, Solomon SD, Rayan ME, Come PC, Goldhaber SZ, Lee RT. Regional right ventricular dysfunction detected by echocardiography in acute pulmonary embolism. The American Journal of Cardiology 1996;78(4):469–473. doi: 10.1016/s0002-9149(96)00339-6. [DOI] [PubMed] [Google Scholar]
- 69.Santamore WP, Dell’Italia LJ. Ventricular interdependence: significant left ventricular contributions to right ventricular systolic function. Prog. Cardiovasc. Dis 1998;40(4):289–308. doi: 10.1016/s0033-0620(98)80049-2. [DOI] [PubMed] [Google Scholar]
- 70.Haddad F, Hunt SA, Rosenthal DN, Murphy DJ. Right ventricular function in cardiovascular disease, part I: anatomy, physiology, aging, and functional assessment of the right ventricle. Circulation 2008;117(11):1436–1448. doi: 10.1161/CIRCULATIONAHA.107.653576. [DOI] [PubMed] [Google Scholar]
- 71.Malinowski M, Schubert H, Wodarek J, et al. Tricuspid annular geometry and strain after suture annuloplasty in acute ovine right heart failure. Ann. Thorac. Surg 2018;106(6):1804–1811. doi: 10.1016/j.athoracsur.2018.05.057. [DOI] [PubMed] [Google Scholar]
- 72.Rausch MK, Malinowski M, Meador WD, Wilton P, Khaghani A, Timek TA. The effect of acute pulmonary hypertension on tricuspid annular height, strain, and curvature in sheep. Cardiovasc. Eng. Technol 2018;9(3):365–376. doi: 10.1007/s13239-018-0367-9. [DOI] [PubMed] [Google Scholar]
- 73.Rausch MK, Malinowski M, Wilton P, Khaghani A, Timek TA. Engineering analysis of tricuspid annular dynamics in the beating ovine heart. Ann. Biomed. Eng 2018;46(3):443–451. doi: 10.1007/s10439-017-1961-y. [DOI] [PubMed] [Google Scholar]
- 74.Johnson E, Laurence D, Lee C-H, Hsu M-C. Parametric Design and Optimization of Structrually Effective Prosthetic Triscupsid Valves. In: 15th U.S. National Congress on Computational Mechanics. Austin, Texas: 2019. [Google Scholar]
- 75.Kim HS, Park SB, Lo SS, Monroe JI, Sohn JW. Bidirectional local distance measure for comparing segmentations. Med. Phys 2012;39(11):6779–6790. doi: 10.1118/1.4754802. [DOI] [PMC free article] [PubMed] [Google Scholar]
Associated Data
This section collects any data citations, data availability statements, or supplementary materials included in this article.