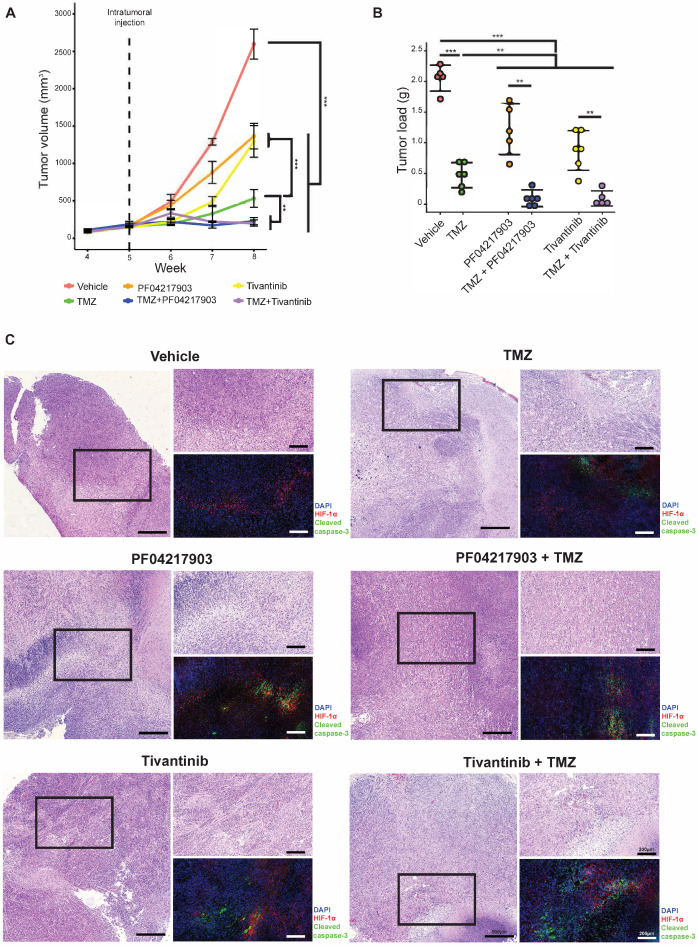
Figure 5.
Tumor analysis of GPC xenograft models. (A) Growth of GPC xenografts in mice treated with vehicle, TMZ, PF04217903, PF04217903+TMZ via intratumoral injection. Data are represented as mean±SD from n = 5-6 biological replicates. * p < 0.05, ** p < 0.01, *** p < 0.001 between groups. (B) Tumor load of GPC xenografts in mice treated with vehicle, TMZ, tivantinib, tivantinib+TMZ via intratumoral injection. Data are represented as mean±SD from n = 5-6 biological replicates. * p < 0.05, ** p < 0.01, *** p < 0.001 between groups. (C) Representative images of GPC xenografts at Day 3 post-injection. Immunofluorescence staining for HIF-1α (red) and cleaved caspase-3 (green) while the nuclei were counterstained with DAPI (blue). Hematoxylin and eosin (H&E) staining was performed with other sections from the same tumor xenografts. Scale bars are 500 µm and 200 µm for wide and magnified fields, respectively.

