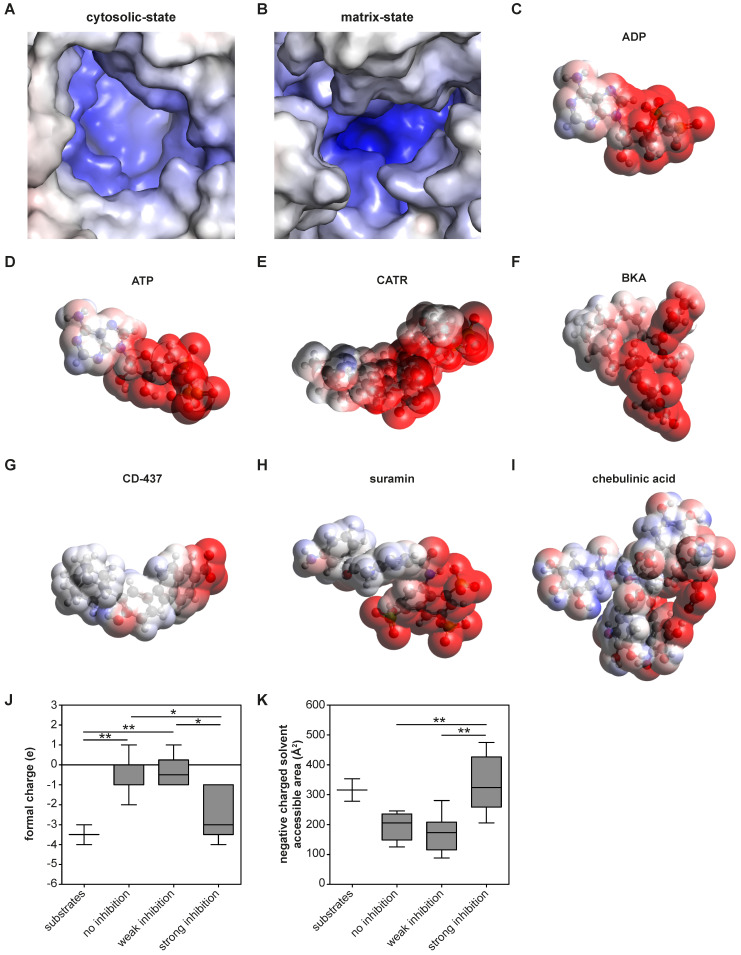
Figure 5.
| Molecular surface charge distribution are shared inhibitor and substrate characteristics. (A-B) The electrostatic potential surface is shown for the AAC binding pocket. (A) The cytosolic-state model is based on the CATR-inhibited ScAAC2 structure (PBB: 4C9G) 63 and (B) the matrix-state on the BKA-inhibited TtAAC structure (PDB: 6GCI) 29. Surface is colored by electrostatic potential (blue, +20 kT e-1; white, neutral; red, -20 kT e-1). Surface charge distributions are shown for the AAC substrates (C) ADP and (D) ATP, the canonical AAC inhibitors (E) CATR and (F) BKA, as well as other AAC inhibitors (G) CD-437, (H) suramin and (I) chebulinic acid. Surface is colored by electrostatic potential (blue, +15 kT e-1; white, neutral; red, -15 kT e-1). Molecular surface calculations were performed at pH 7.0 for all substrates and inhibitors, and included the (J) formal charge and (K) negative charged solvent accessible area. Compounds were classified either as strong inhibitors (inhibition at 10 and 100 µM, Figure 4A-B), weak inhibitors (only inhibition at 100 µM, Figure 4B) or non-binders. Substrates are ADP and ATP. Statistical analysis: one-way ANOVA with Bonferroni's post hoc analysis to compare all conditions *p<0.05; **p<0.01. Data presented as Box-Whisker plots.

