

Abstract
One-carbon metabolism plays a central role in a broad array of metabolic processes required for the survival and growth of tumor cells. However, the molecular basis of how one-carbon metabolism may influence RNA methylation and tumorigenesis remains largely unknown. Here we show MTHFD2, a mitochondrial enzyme involved in one-carbon metabolism, contributes to the progression of renal cell carcinoma (RCC) via a novel epitranscriptomic mechanism that involves HIF-2α. We found that expression of MTHFD2 was significantly elevated in human RCC tissues, and MTHFD2 knockdown strongly reduced xenograft tumor growth. Mechanistically, using an unbiased methylated RNA immunoprecipitation sequencing (meRIP-Seq) approach, we found that MTHFD2 plays a critical role in controlling global N6-methyladenosine (m6A) methylation levels, including the m6A methylation of HIF-2α mRNA, which results in enhanced translation of HIF-2α. Enhanced HIF-2α translation, in turn, promotes the aerobic glycolysis, linking one-carbon metabolism to HIF-2α-dependent metabolic reprogramming through RNA methylation. Our findings also suggest that MTHFD2 and HIF-2α form a positive feedforward loop in RCC, promoting metabolic reprograming and tumor growth. Taken together, our results suggest that MTHFD2 links RNA methylation status to the metabolic state of tumor cells in RCC.
Introduction
There will be an estimated 65,000 new cases of kidney cancer in the US in 2018, of which about 90% will be renal cell carcinomas (RCC) [1]. At the time of initial diagnosis, approximately one third of patients with RCC have evidence of metastatic disease [2]. Targeted therapies such as VEGF and mTOR inhibitors, have shown promise in a subset of patients but resistance is common [3]. As such, new approaches to expand our current strategies for the treatment of patients with RCC are urgently needed.
Clear cell renal cell carcinoma (ccRCC) is morphologically characterized by enhanced glycogen and lipid-laden cells, which underscores the fundamental drive towards metabolic reprogramming in the disease [4, 5]. New insights from the Cancer Genome Atlas (TCGA) and other recent studies have validated many significant metabolic alterations associated with ccRCC, wherein cancer cells characteristically exhibit upregulation of genes involved in glycolysis [6–9]. The enhanced glycolytic activity in ccRCC is principally mediated by the increased hypoxia inducible factor (HIF) signaling. In ccRCC, the functional loss of the von Hippel–Lindau (VHL) tumor suppressor gene, an E3 ubiquitin ligase that marks the alpha subunits of HIFs for degradation, leads to accumulation of HIF-αs and enhanced transcription of HIF target genes [10–14]. These target genes are canonically involved in metabolic, angiogenic, proliferative, and invasive pathways [15–17].
One-carbon metabolism is increasingly being recognized as an important pathway in cancer by generating biosynthetic substrates necessary for proliferating cancer cells [18–22]. Although there is evidence to suggest that enzymes in the one-carbon metabolism pathway could be involved in ccRCC progression, there is the limited data on the underlying molecular mechanisms that contribute to the development of ccRCC by one-carbon metabolism. This metabolic pathway is initiated in the mitochondria by the covalent linkage of tetrahydrofolate (THF) to a one-carbon methylene group to form 5,10-methylenetetrahydrofolate (5,10-CH2–THF). Methylenetetrahydrofolate dehydrogenase 2 (MTHFD2) is a critical enzyme in this pathway whose enzymatic activity oxidizes the one-carbon moiety on 5,10-CH2-THF yielding 5,10-methenyltetrahydrofolate (5,10-CHTHF) and NAD(P)H. These substrates are further utilized to produce metabolites that are necessary in several anabolic processes, including nucleobase, protein, and lipid generation (Fig. 1a) [23, 24]. Notably, MTHFD2 is crucial for mouse development, and its deletion causes embryos to be glycine auxotrophs and die after embryonic day 12.5 [23, 25]. In addition to its physiological impact, MTHFD2 has been shown to contribute to tumor growth in both solid and hematologic cancers [26–28]. Despite the potential effect of MTHFD2 on methylation and tumor growth, its precise role in the development of ccRCC remains unknown.
Fig. 1.
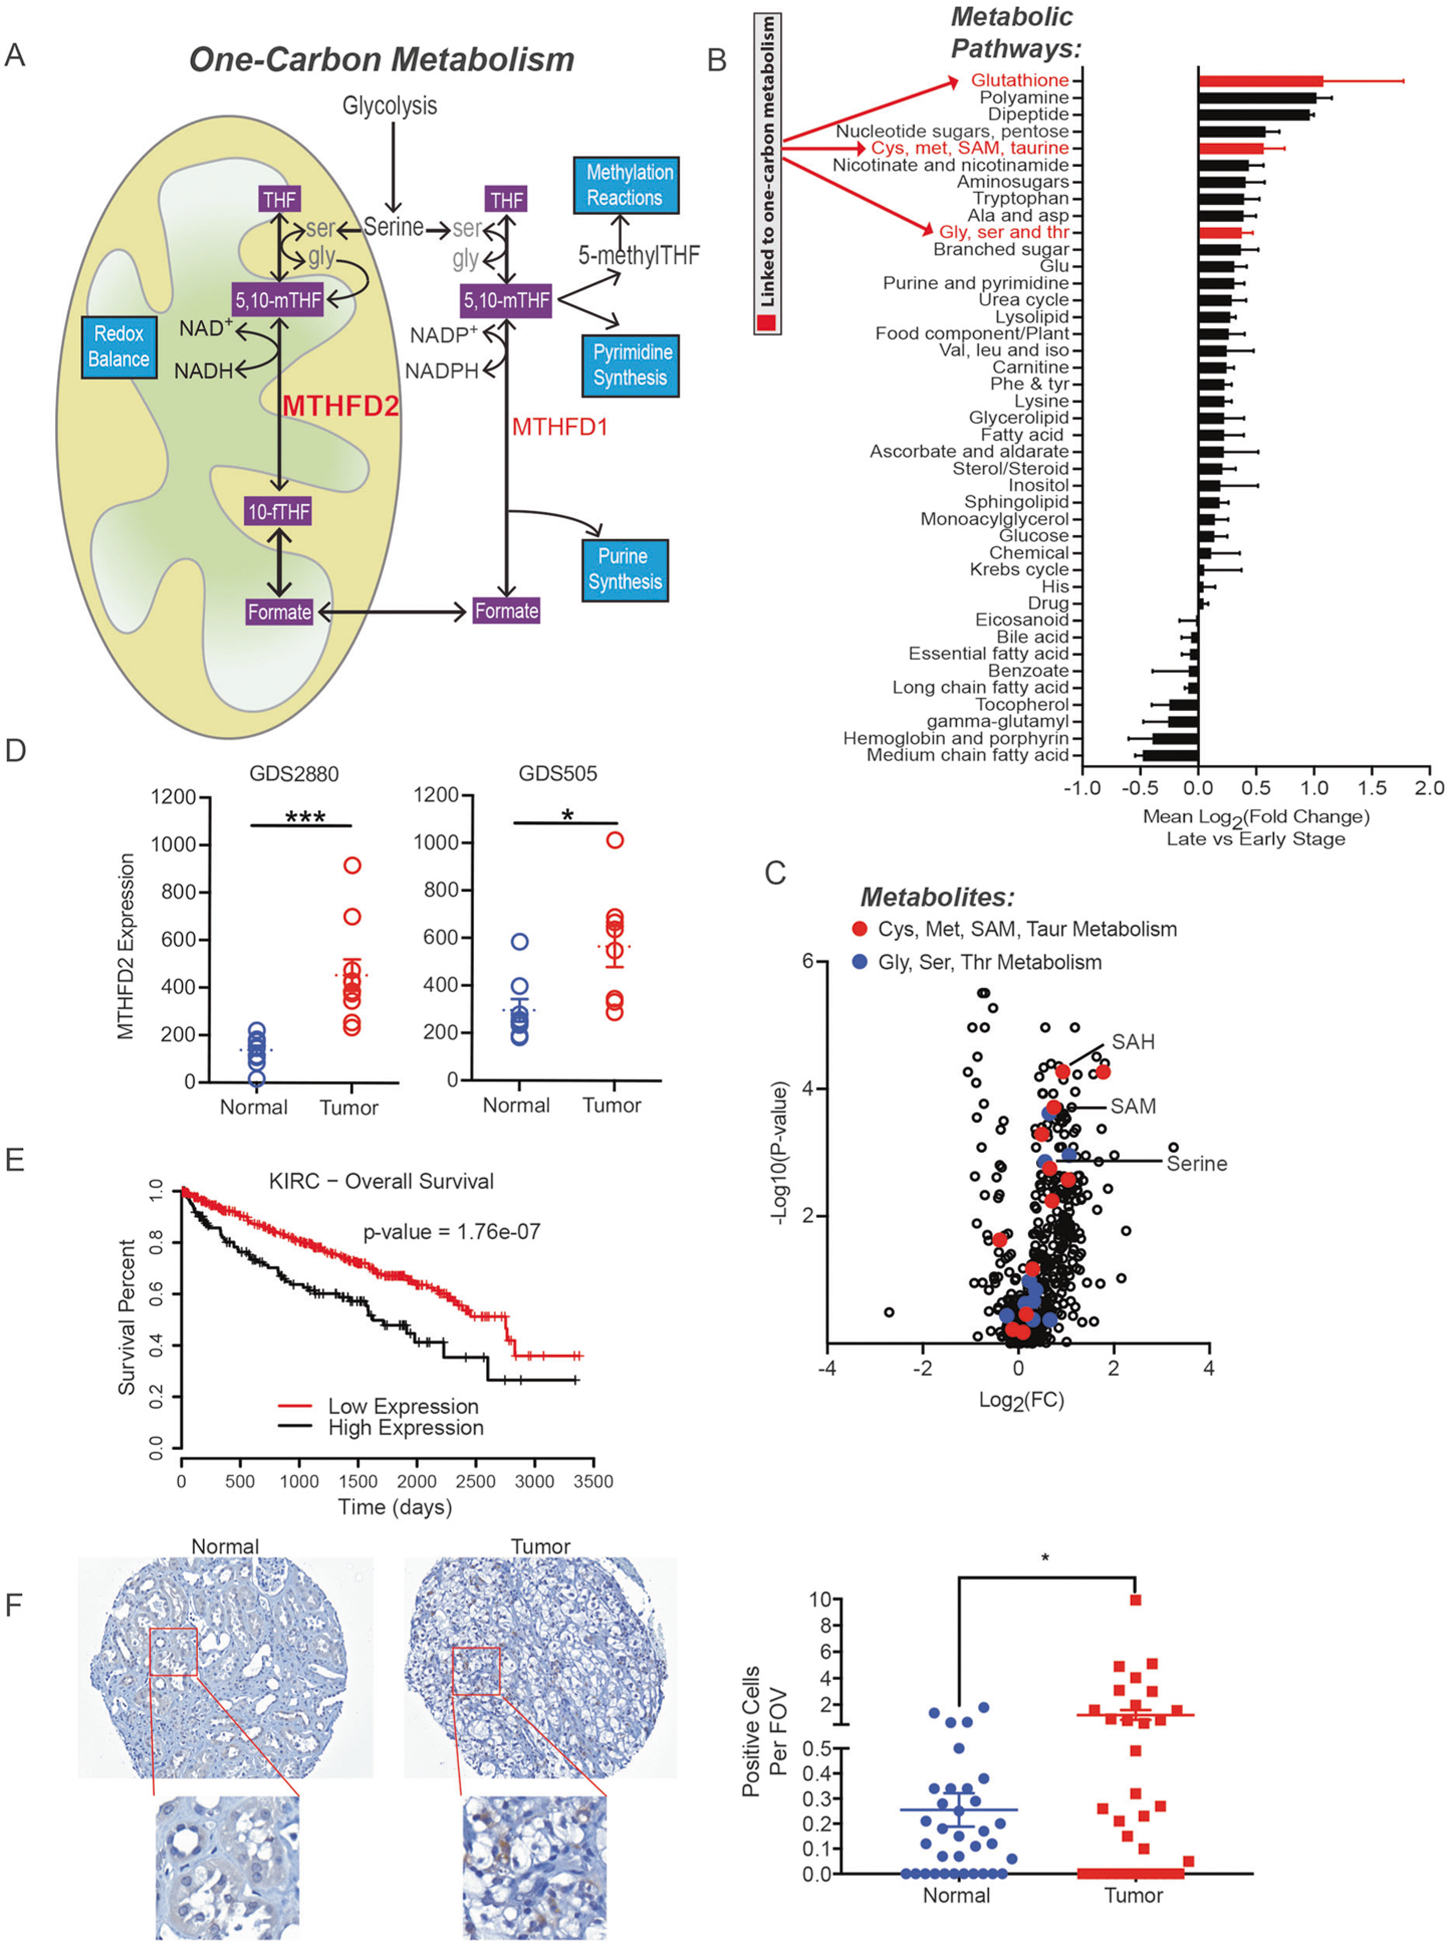
MTHFD2 is upregulated in ccRCC patients correlating with poor prognosis. a Overview of the one-carbon metabolism pathway. b Mean fold change for each metabolite classification and c volcano plot of metabolite levels in late stage (III and IV) versus early stage (I and II) ccRCC tumors. d MTHFD2 mRNA levels determined using two independent RCC datasets from the gene expression omnibus. (GDS2880: n = 10, GDS505: n = 8). e Kaplan–Meier plot of patients with high (more than 2SD above normal matched tissue) and low MTHFD2 expression (less than 2SD above normal matched tissue). f Immunohistochemistry measuring MTHFD2 expression from RCC patients at 20× magnification (normal n = 34, tumor n = 33). *P < 0.05; **P < 0.01; ***P < 0.001
RNA methylation is a reversible and nonstoichiometric posttranscriptional modification to mRNA that epitranscriptomically regulates a variety of physiological events. N6-methyladenosine (m6A), the most common methylation modification in mammalian mRNA molecules [29], has been shown to be important for mRNA regulation. Enrichment of m6A at the consensus sequence, GGAC, typically occurs near the stop codon and untranslated regions of an mRNA [30, 31]. A key cellular function of the m6A RNA modification is to regulate the translation of mRNAs. Elevated m6A levels on mRNA have been shown to increase translation efficiency, and have also been linked to the development of cancer [32, 33]. Whereas, alterations in one-carbon metabolism are known to be associated with cancer development, whether one-carbon metabolism could affect m6A RNA modification in ccRCC and, if affected, which gene transcripts would be impacted remained unknown.
In this report, we identify MTHFD2 as a critical link between the one-carbon metabolism pathway and global alterations in RNA methylation in RCC. Our results indicate over activation of MTHFD2 leads to an increase in methylation marks on nucleic acids. Specifically, we found that MTHFD2 regulates the HIF-2α-dependent metabolic reprograming via regulation of epitranscriptomic landscape. These observations suggest MTHFD2 plays a role in the metabolic transformation of RCC and provides a rationale for targeting this enzyme pharmacologically for RCC treatment.
Results
MTHFD2 is overexpressed in patients with RCC and is associated with poor prognosis
We mined metabolomics datasets that assessed metabolites in ccRCC and matched adjacent normal kidney tissues [34]. Metabolites and metabolic pathways associated with one-carbon metabolism, namely members in glutathione, glycine/serine/threonine, and cysteine/methionine metabolism were elevated in late stage (stage III and IV) ccRCC tumors compared to early stage tumors (stage I and II) (Fig. 1b, c). This analysis supports an elevated one-carbon metabolism pathway in ccRCC. In addition, we also observed high MTHFD2 expression in ccRCC tumors compared with normal matched kidneys using two datasets from the gene expression omnibus (GEO) (Fig. 1d) [35–37]. We mined the ccRCC dataset from the Cancer Genome Atlas (TCGA-KIRC), and found high MTHFD2 levels correlating with the stage of ccRCC, and that patients who had high levels of MTHFD2 exhibited a worse survival rate compared with patients with low MTHFD2 expression (Fig. 1e, Supplemental Fig. 1A). To validate these findings, we measured MTHFD2 protein levels in a tissue microarray of ccRCC tumors versus normal kidney tissues in a cohort of patients at MD Anderson Cancer Center. We found MTHFD2 protein levels were significantly higher in ccRCC tumors over normal kidney tissues (Fig. 1f). Taken together, these findings indicate that MTHFD2 is upregulated in ccRCC tissues, and that high expression of MTHFD2 correlates with poor prognosis.
MTHFD2 is required for ccRCC tumor growth
Studies in both solid and hematological cancers have recently shown MTHFD2 suppression correlates with decreased tumor growth [26, 27]. To determine whether elevated MTHFD2 levels are functionally implicated in RCC progression, we next generated two well-established RCC cell lines (786-O and CAKI-1) with stable shRNA-mediated knockdown of MTHFD2 (Fig. 2a). These cells were xenografted subcutaneously into immune-deficient (Nu/J) mice with one flank receiving the MTHFD2 knockdown cells (shMTHFD2) and the other flank receiving the scramble control line (shControl). In the CAKI-1 xerographs, four of six shControl xenografts developed measurable tumors whereas only one out of six shMTHFD2 xenografts formed a visible and measurable tumor (Fig. 2b, c). In the 786-O xenografts, suppression of MTHFD2 also resulted in blunted tumor growth, with the average weight and volume of shMTHFD2 tumors significantly reduced compared with shControl tumors (Fig. 2d–f). We confirmed MTHFD2 was suppressed in excised 786-O shMTHFD2 tumor lysates by western blot analysis (Fig. 2g). The dramatic reduction in tumor growth when MTHFD2 was depleted suggests that the one-carbon metabolism pathway plays an important role in RCC. However, the mechanistic rationale for how MTHFD2 depletion leads to decreased tumor burden remained unclear.
Fig. 2.
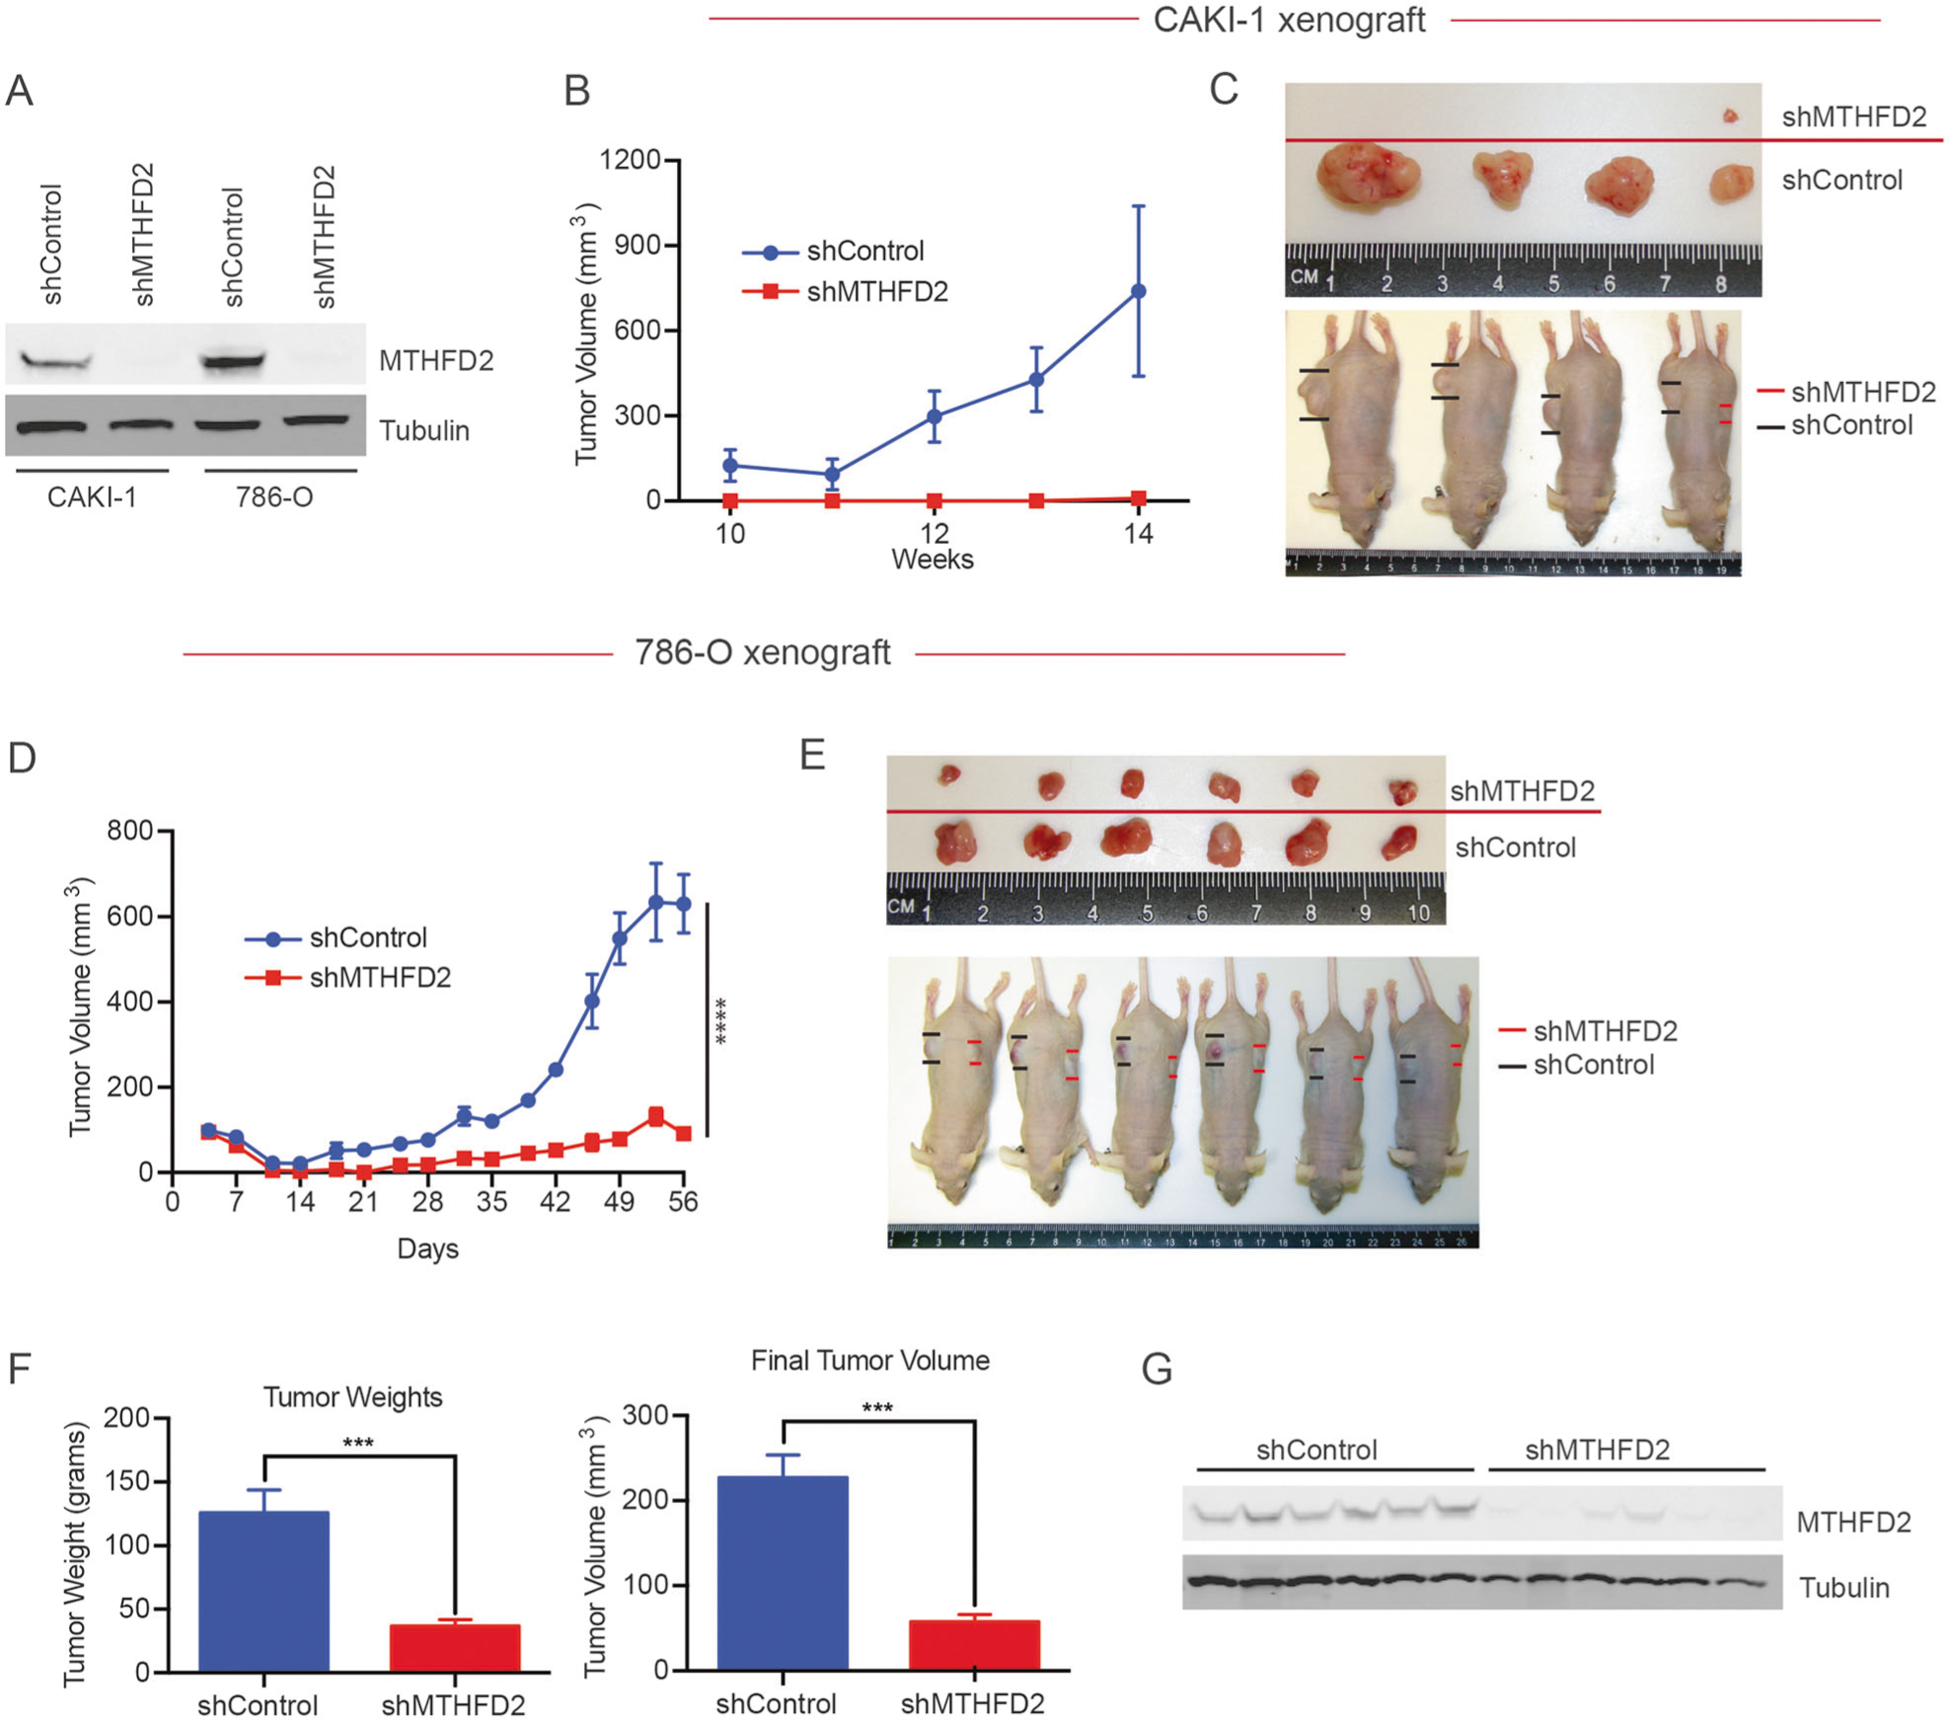
MTHFD2 is required for ccRCC tumor growth. a Western blot showing effective knockdown of MTHFD2 protein using stable shRNA expression in two RCC cell lines. Male nude mice (n = 6 per line) received subcutaneous injections of 5 × 10⁶ cells stably expressing ectopic MTHFD2-shRNA or nontargeting controls. b CAKI-1 and d 786-O tumor growth measured over time using calipers. c CAKI-1 and e 786-O tumors at time of resection, mice were sacrificed and tumors were removed surgically. f 786-O tumor weight and volume after resection. G MTHFD2 protein was measured via western blot from resected tumor lysate. ***P < 0.001; ****P < 0.0001
Suppression of MTHFD2 reduces proliferation and glycolytic activity
Our xenograft data implicate MTHFD2 expression in ccRCC is a driver for tumor growth. Consistent with these findings, we found that MTHFD2 suppression impaired the proliferation, migration, and invasion of 786-O cells in vitro (Supplemental Fig. 1B–D). In addition, treatment with MTH-1459 and MTH-1479, two novel MTHFD2 specific inhibitors (Raze Therapeutics), reduced cell proliferation in a dose-dependent manner in 786-O cells (Fig. 3a). Interestingly, RCC4 cells, another established RCC line with low levels of MTHFD2 protein relative to 786-O, were less affected by treatment with MTHFD2 inhibitors (Fig. 3b).
Fig. 3.

Suppression of MTHFD2 reduces proliferation and glycolytic activity. Two MTHFD2 inhibitors, MTH-1459, and MTH-1479, were added to a 786-O (with high expression of MTHFD2) and b RCC4 (with low expression of MTHFD2) and cell number was measured after 2, 4, and 6 days (n = 3 per concentration). c shMTHFD2 and shControl were plated at equal concentrations. sodium formate (5 μM) was added to cell culture media. Cell number was measured after 4 days (n = 3 per condition). d Extracellular acidification rate (ECAR) was measured in 786-O shControl and shMTHFD2 cells using a Seahorse Bioanalyzer. The area under the curve (AUC) for basal (after addition of glucose) and maximal (after addition oligomycin) ECAR was calculated (n = 5). e Oxygen consumption rate (OCR) was measured in 786-O shControl/shMTHFD2, and TCKM1, a noncancerous renal proximal tubule cell line (n = 4 for 786-O and n = 3 for TCKM1). f ATP amount, both from total cellular lysate and isolated mitochondria, was measured using a luciferase-based assay. Levels from each were normalized to SDHA protein via western blot from the respective lysate (n = 3 per condition). *P < 0.05; **P < 0.01; ***P < 0.001; ****P < 0.0001
To determine whether MTHFD2 enzymatic activity is required for cell proliferation in RCC cells, we added formate, the end product of mitochondrial one-carbon metabolism, to 786-O shControl and shMTHFD2 cells. We found that adding formate to shMTHFD2 cells restored cell growth to shControl levels over 4 days, while having no effect on control cells (Fig. 3c), suggesting the activity of MTHFD2 rather than the amount of MTHFD2 protein is critical for cell proliferation. These data further strengthen the hypothesis that mitochondrial one-carbon metabolism activity is rate-limiting for cell proliferation in ccRCC cells.
It is well known that cancer cells characteristically reprogram their metabolism to support growth and proliferation [38]. Among several metabolic alterations in cancer cells, aerobic glycolysis and reduced oxidative phosphorylation (OXPHOS) have been extensively reported as central metabolic perturbances. Thus, to probe the metabolic reprogramming potentially caused by MTHFD2 depletion, we assessed the effect of MTHFD2 on the glycolytic status in MTHFD2 knockdown cells and found that both the basal and maximal ECAR (extracellular acidification rate) a measurement of the production of lactate from glycolysis were decreased in MTHFD2 knockdown cells (Fig. 3d). However, oxygen consumption rate a measurement of OXPHOS potential, in 786-O cells (both shControl and shMTHFD2) was much lower than a normal renal tubule cell line, TCMK-1 (Fig. 3e). In addition, both total and mitochondrial levels of ATP in shControl and shMTHFD2 cells were comparable (Fig. 3f). Taken together, our data suggested that MTHFD2 can promote the glycolytic activity of the cell, however the mechanism driving this activation was not yet clear.
MTHFD2 modulates epitranscriptomic methylation of HIF-2α
Since one-carbon metabolism can support a range of anabolic processes, including regeneration of the methyl-donor pool for methylation of lipids, DNA, RNA and proteins, we assessed the effect of MTHFD2 knockdown on methylation marks, which are critical for fine-tuning of gene expression. We observed that depleting MTHFD2 in 786-O cells exhibited a marked decrease in global methylation levels of nucleic acids and histones, with the most dramatic impact of MTHFD2 suppression was observed on RNA methylation (Fig. 4a, Supplemental Fig. 2A, B). Consistent with this observation, immunostaining of the 786-O shControl xenografts showed higher levels of m6A on RNA relative to shMTHFD2 xenografts. (Fig. 4b). In addition, measurement of s-adenosylmethionine (SAM), the universal methyl donor that is replenished through one-carbon metabolism, was also significantly reduced in shMTHFD2 786-O cells (Supplemental Fig. 2C). Thus, MTHFD2 suppression likely lowers global m6A levels by depleting SAM. Interestingly, SAM was found to be significantly higher in late stages of ccRCC (Fig. 4c).
Fig. 4.

MTHFD2 modulates epitranscriptomic methylation of HIF-2α. a Global N6-methyladenosine levels were quantified from shControl and shMTHFD2 and using an ELISA (n = 9 per cell line). b Immunohistochemistry probing for m6A on shControl and shMTHFD2 resected xenografts (shControl: n = 11, shMTHFD2: n = 15 fields of view). c SAM levels, normalized to the patient’s matched normal tissue SAM level, in ccRCC patients stages I–IV. d Schematic representing isolation of m6A-mRNA starting from total RNA, which was subsequently used for RNA-seq and qPCR. e RNA-seq on methylated immunoprecipated RNA (meRIP-seq) results plotting fold change against p-value for methylation changes. Significantly hypomethylated and hypermethylated transcripts with higher than twofold change compared with control cells are in blue and red respectively. f The KEGG pathway map for RCC. Significantly hypomethylated and hypermethylated transcripts are in green and red, respectively. *P < 0.05; **P < 0.01; ***P < 0.001
Based on these findings, we next focused on the effect of MTHFD2 on RNA methylation. Previous studies have shown methylation on N6 of adenosines (m6A) of mRNA, particularly near stop codons, can enhance translation [32, 33]. To determine whether depletion of mRNA methylation via MTHFD2 knockdown has gene specific consequences, we performed methylated mRNA immunoprecipitation (meRIP) (Fig. 4d). The pool of m6A-enriched mRNA was then subjected to next generation sequencing to determine gene specific changes in m6A levels. We found, in agreement with the global ELISA analysis of m6A levels (Fig. 4a), the majority of transcripts that had significant changes in methylation levels was hypomethylated in MTHFD2 depleted cells, while maintaining a similar pattern of m6A enrichment near the stop codon (Fig. 4e, Supplemental Fig. 2D). We performed a gene set enrichment analysis on the significantly hypomethylated transcripts and found five KEGG gene sets were significantly enriched (FDR < 0.25). Of note, the top KEGG gene set was the renal cell carcinoma gene set (Supplemental Fig. 3A). Interestingly, we found HIF-2α mRNA, a key factor in tumor growth and survival of ccRCC tumors [39, 40], to be hypomethylated in MTHFD2 depleted 786-O cells (Fig. 4f). We verified the reduction of m6A methylation on HIF-2α mRNA by probing the methyl-immunoprecipitated mRNA with qPCR primers that amplify the methylated region of HIF-2α. EGFR and β-actin were used as positive and negative controls, respectively (Supplemental Fig. 3B) [33].
MTHFD2 is in a positive feedforward loop with HIF-2α
To further explore the effect of MTHFD2 regulation on HIF-2α, we measured mRNA and protein levels of HIF-2α in MTHFD2 knockdown and control cells. HIF-2α mRNA was not significantly changed in the knockdown cells; however, protein levels were reduced in MTHFD2 depleted cells (Fig. 5a, b). In addition, pharmacological inhibition of MTHFD2 reduced HIF-2α protein levels (Fig. 5c). This supports the hypothesis that MTHFD2-dependent m6A methylation on HIF-2α mRNA promotes its translation. To further explore this phenomenon, we generated luciferase constructs with either the 3′ UTR of HIF-2α mRNA or an equal length sequence from the LacZ gene inserted after the luciferase stop codon (Fig. 5d). The constructs containing the HIF-2α 3′ UTR (HIF-2α WT) expressed in shControl cells had enhanced translation of luciferase over the LacZ control (EV). However, consistent with our hypothesis, the translation of luciferase with the HIF-2α WT construct when expressed in shMTHFD2 cells was significantly lower compared to shControl HIF-2α WT cells (Fig. 5e). Mutating the m6A site (found from the meRIP-seq data) in the 3′ UTR of HIF-2α from GGAC to 232 GCGC(HIF-2α Mut) effectively blunted the translation of HIF-2α in shControl cells, while not significantly effecting translation in the shMTHFD2 cells (Fig. 5e).
Fig. 5.
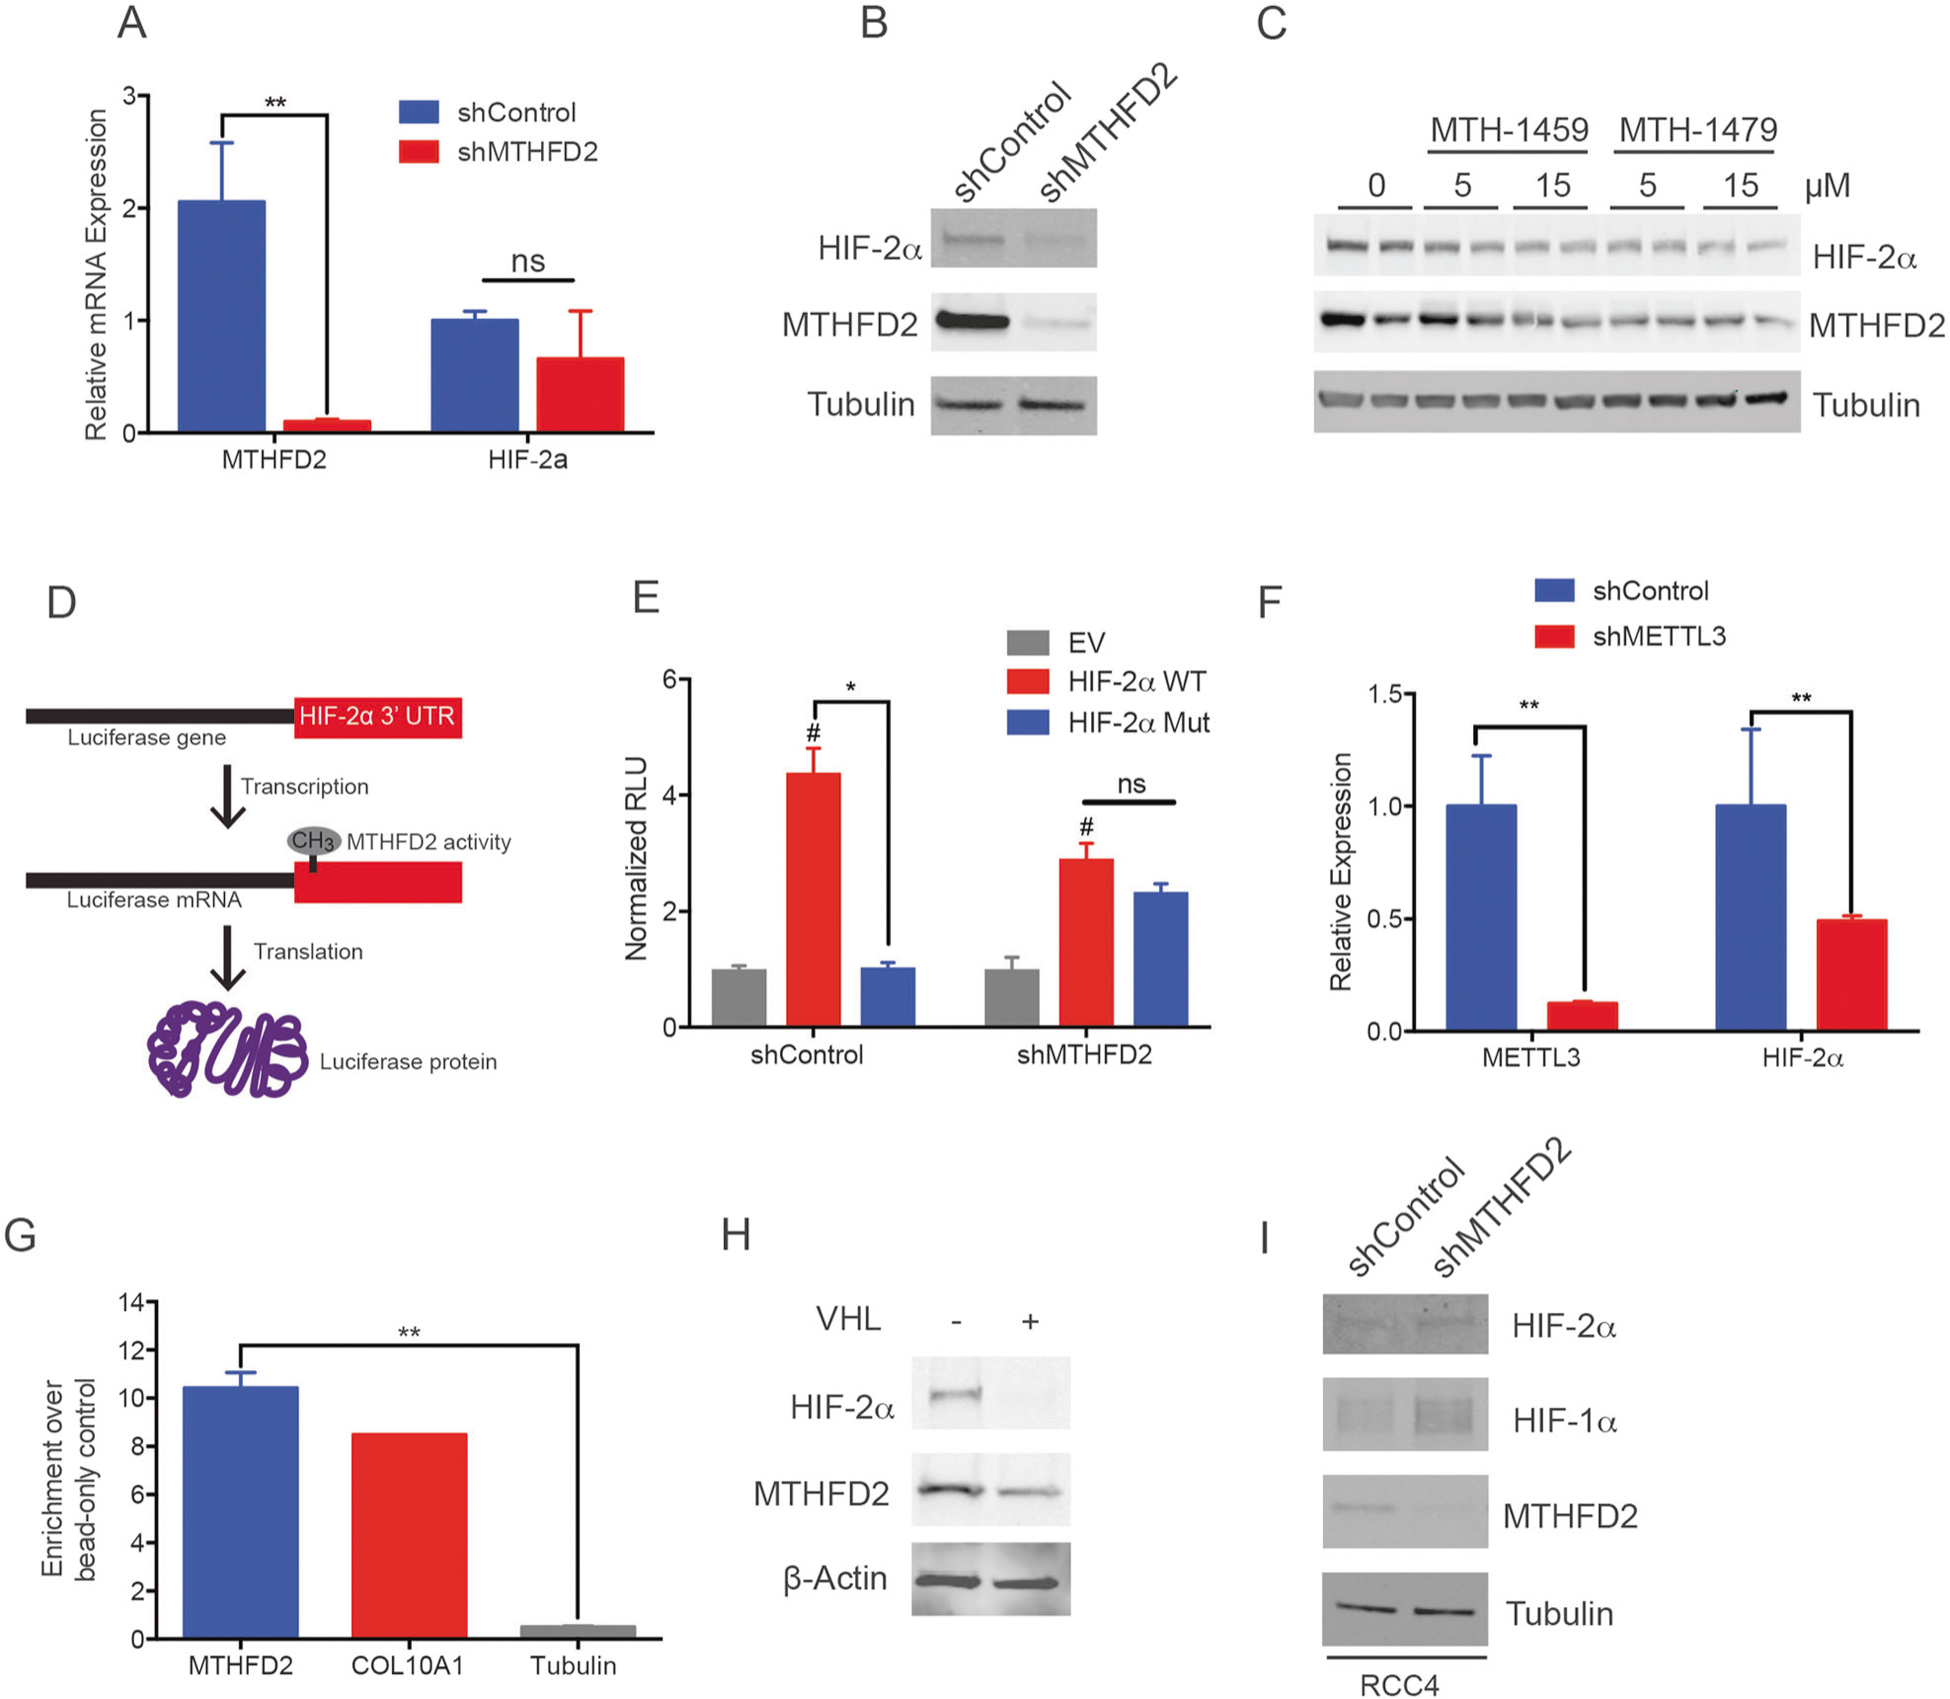
MTHFD2 is in a positive feedforward loop with HIF-2α. a mRNA (n = 3 per line) and b protein levels of MTHFD2 and HIF-2α in 786-O shControl and shMTHFD2 cells. c HIF-2α was probed on a western blot after 786-O cells were treated with MTHFD2 inhibitors. d 3′ UTR from HIF-2α (WT in e), or the same length sequence from the LacZ gene (EV in e), was placed behind a luciferase construct to determine its effect on mRNA translation. The HIF-2α construct was mutated to GCGC (Mut in e) at the GGAC sequence found to be enriched with m6A from the meRIP-seq experiment. The constructs were transfected into 786-O shControl and shMTHFD2 cells. e Luminescence was measured using the Steady-Glo® luciferase assay system (n = 3 per condition). f Protein expression of HIF-2α in METTL3 knockdown cells. g ChIP-qPCR assay was performed using a HIF-2α antibody for the immunoprecipitation. A canonical HIF-2α binding sequence found in the Mthfd2 promoter as well as Col10A1, a known target of HIF-2α and tubulin, as negative control, were probed (n = 3 per condition). h Western blot for HIF-2α and MTHFD2 in 786-O cells re-expressing VHL. i Western blot for HIF-2α and HIF-1α in RCC4 cells with and without MTFHD2 knockdown. *P < 0.05; **P < 0.01; #P < 0.05 shControl;HIF-2α WT versus shMTHFD2;HIF-2α WT
m6A on mRNA is posttranscriptionally installed by the RNA methyltransferase complex comprising METTL3, METTL14, and WTAP. Thus, we next evaluated the effect of the catalytic subunit of the methyltransferase complex, METTL3, on HIF-2α expression to assess whether HIF-2α may be regulated by METTL3-mediated methylation. To this end, we knocked down METTL3 in 786-O cells and measured HIF-2α protein levels. Notably, the HIF-2α level in METTL3 depleted cells was significantly lower than the control cells (Fig. 5f). These data indicate that MTHFD2 regulates mRNA methylation, and specifically increase METTL3-dependent HIF-2α mRNA methylation, effectively increasing its translation and protein levels in RCC cell lines.
Since HIF-2α is a transcription factor, we also queried whether MTHFD2 is a transcription target of HIF-2α. To this end, we searched and found a putative HIF-2α binding site in the promoter region of the Mthfd2 gene. Using a ChIP-qPCR assay we established that indeed HIF-2α binds to this promoter region of the Mthfd2 gene (Fig. 5g). Interestingly, we also found that HIF-2α, but not HIF-1α, overexpression increased the expression of MTHFD2 levels (Supplemental Fig. 4A). Ablating HIF-2α protein levels in 786-O cells by re-expressing VHL also reduced MTHD2 protein levels (Fig. 5h). We next checked the expression of both HIF-1α and HIF-2α in RCC4 cells with and without MTHFD2 knockdown. We found that MTHFD2 knockdown increased the level of HIF-1α in these cells while HIF-2α was unchanged (Fig. 5i). There are relatively fewer m6A consensus sequences in the last exon and 3′ UTR of HIF-1α mRNA compared with the last exon and 3′ UTR of HIF-2α mRNA (three versus eight, respectively), which may account for the differences between HIF-1α and HIF-2α. In addition, HIF-1α has been shown to be inversely regulated with HIF-2α [41], so the expression of HIF-1α may affect the MTFHD2-dependent regulation of HIF-2α in these cells.
Finally, we stained RCC and normal kidney sections for MTHFD2 and HIF-2α. There was a large amount of overlap in signal in the RCC sections indicating that MTHFD2 and HIF-2α, when expressed, are expressed together (Supplemental Fig. 4B). These observations suggest that MTHFD2 and HIF-2α form a positive feedforward loop in RCC, and targeting one of these proteins can potentially affect the other’s downstream effectors, limiting key RCC phenotypes.
MTHFD2 promotes aerobic glycolysis in a HIF-2α dependent manner
We next examined the impact of HIF-2α as a downstream target of MTHFD2, and its impact on MTHFD2–mediated aberrant metabolism and cell proliferation. We ectopically expressed HIF-2α protein in shMTHFD2 786-O cells (Fig. 6a). We found that by restoring HIF-2α levels, the proliferative ability of 786-O cells depleted of MTHFD2 was partially rescued (Fig. 6b). In addition, restoring HIF-2α in shMTHFD2 cells restored the expression of HIF-2α target transcripts, including glycolytic genes solute carrier family 2 member 1 (SLC2A1), which encodes for the glucose transporter GLUT1, vascular endothelial growth factor alpha, transforming growth factor beta and lactate dehydrogenase A (LDHA) (Fig. 6c). These findings suggest that the HIF-2α could play a role in MTHFD2-mediated enhanced glycolysis. To further decipher the role of HIF-2α and MTHFD2-mediated glycolysis, we treated shMTHFD2 and shControl 786-O cells with 2-deoxyglucose (2-DG), a glycolysis inhibitor. 786-O shControl cell growth was significantly inhibited by 2-DG, whereas the effect on 786-O shMTHFD2 cells was not as pronounced. The sensitivity to glycolysis inhibition by 2-DG was restored when HIF-2α was re-expressed in shMTHFD2 cells (Fig. 6d, e), suggesting that HIF-2α is mediating the MTHFD2-dependent regulation of glycolysis.
Fig. 6.
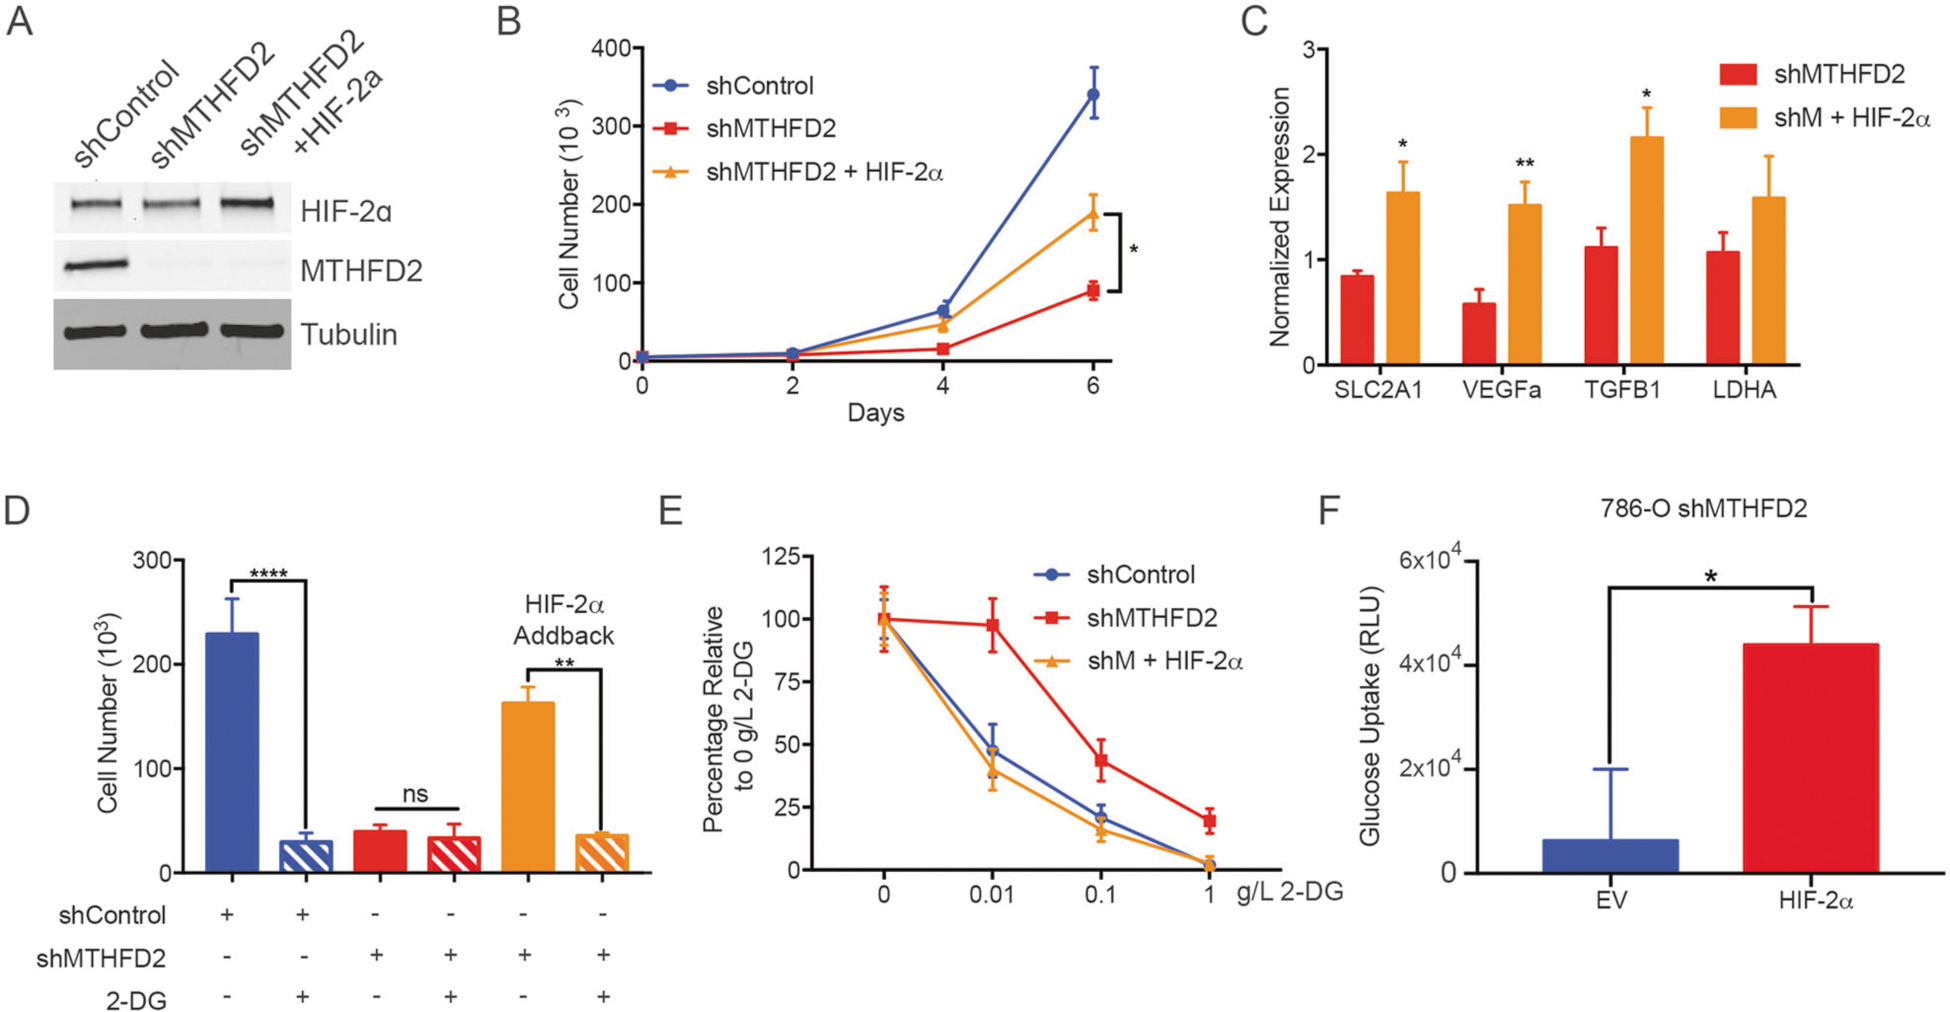
MTHFD2 promotes aerobic glycolysis in a HIF-2α dependent manner. a Western blot showing HIF-2α expression in shControl and shMTHFD2+/− HIF-2α 786-O cells. b shControl and shMTHFD2 +/− HIF-2α cells were plated at equal concentrations and cell number was measured after 2, 4, and 6 days (n = 3 per cell line). c RT-qPCR of HIF-2α target genes in shMTHFD2 and shMTHFD2 + HIF-2α cells (n = 6 per cell line). d Total cell number for shControl and shMTHFD2+/− HIF-2α treated with 0.1 g/L 2-DG (n = 3 per condition). e Growth inhibition curve for shControl and shMTHFD2 +/− HIF-2α treated with 2-DG at various concentrations (n = 3 per concentration). f Relative luminescence measured using a glucose uptake assay (n = 5). *P < 0.05; **P < 0.01; ****P < 0.0001
ccRCC is well established as a metabolically active disease, embodying the Warburg Effect wherein OXPHOS is reduced in favor of HIF-mediated aerobic glycolysis. The dependence of ccRCC on glycolysis is in part a result of induction of HIF-2α-mediated enhanced glucose uptake [42]. Thus, we also measured the ability of shMTHFD2 cells, with and without HIF-2α, to uptake glucose in 786-O cells. We observed that shMTHFD2 cells with exogenous HIF-2α were able to uptake significantly higher levels of glucose than shMTHFD2 cells lacking exogenous HIF-2α (Fig. 6f), suggesting that the MTHFD2-dependent enhanced glucose uptake in 786-O cells is regulated by HIF-2α. Taken together, our findings indicate that MTHFD2-dependent regulation of HIF-2α via RNA methylation directly links the metabolic status of the cell and regulation of tumor growth. The ability of MTHFD2 to directly regulate the metabolic profile of ccRCC cells demonstrates the critical role of this one-carbon metabolism enzyme in ccRCC.
Discussion
In this study, we have identified a novel role for the mitochondrial one-carbon metabolism enzyme, MTHFD2, in ccRCC progression and HIF-mediated metabolism. MTHFD2 and one-carbon metabolites were found to be abundant in ccRCC patients, indicative of poor prognosis and late stage disease. Genetic and pharmacological targeting of MTHFD2 yields a robust decrease in tumor growth, ccRCC cell proliferation, and ccRCC cells’ glycolytic performance. Mechanistically, we showed that MTHFD2 is a regulator of RNA methylation in ccRCC, effectively enhancing HIF-2α protein levels directly enhance MTHFD2 transcription and transcription of metabolic gene targets that promotes glycolysis (Fig. 7). This novel feedforward loop emerged as rate-limiting for the growth ccRCC.
Fig. 7.
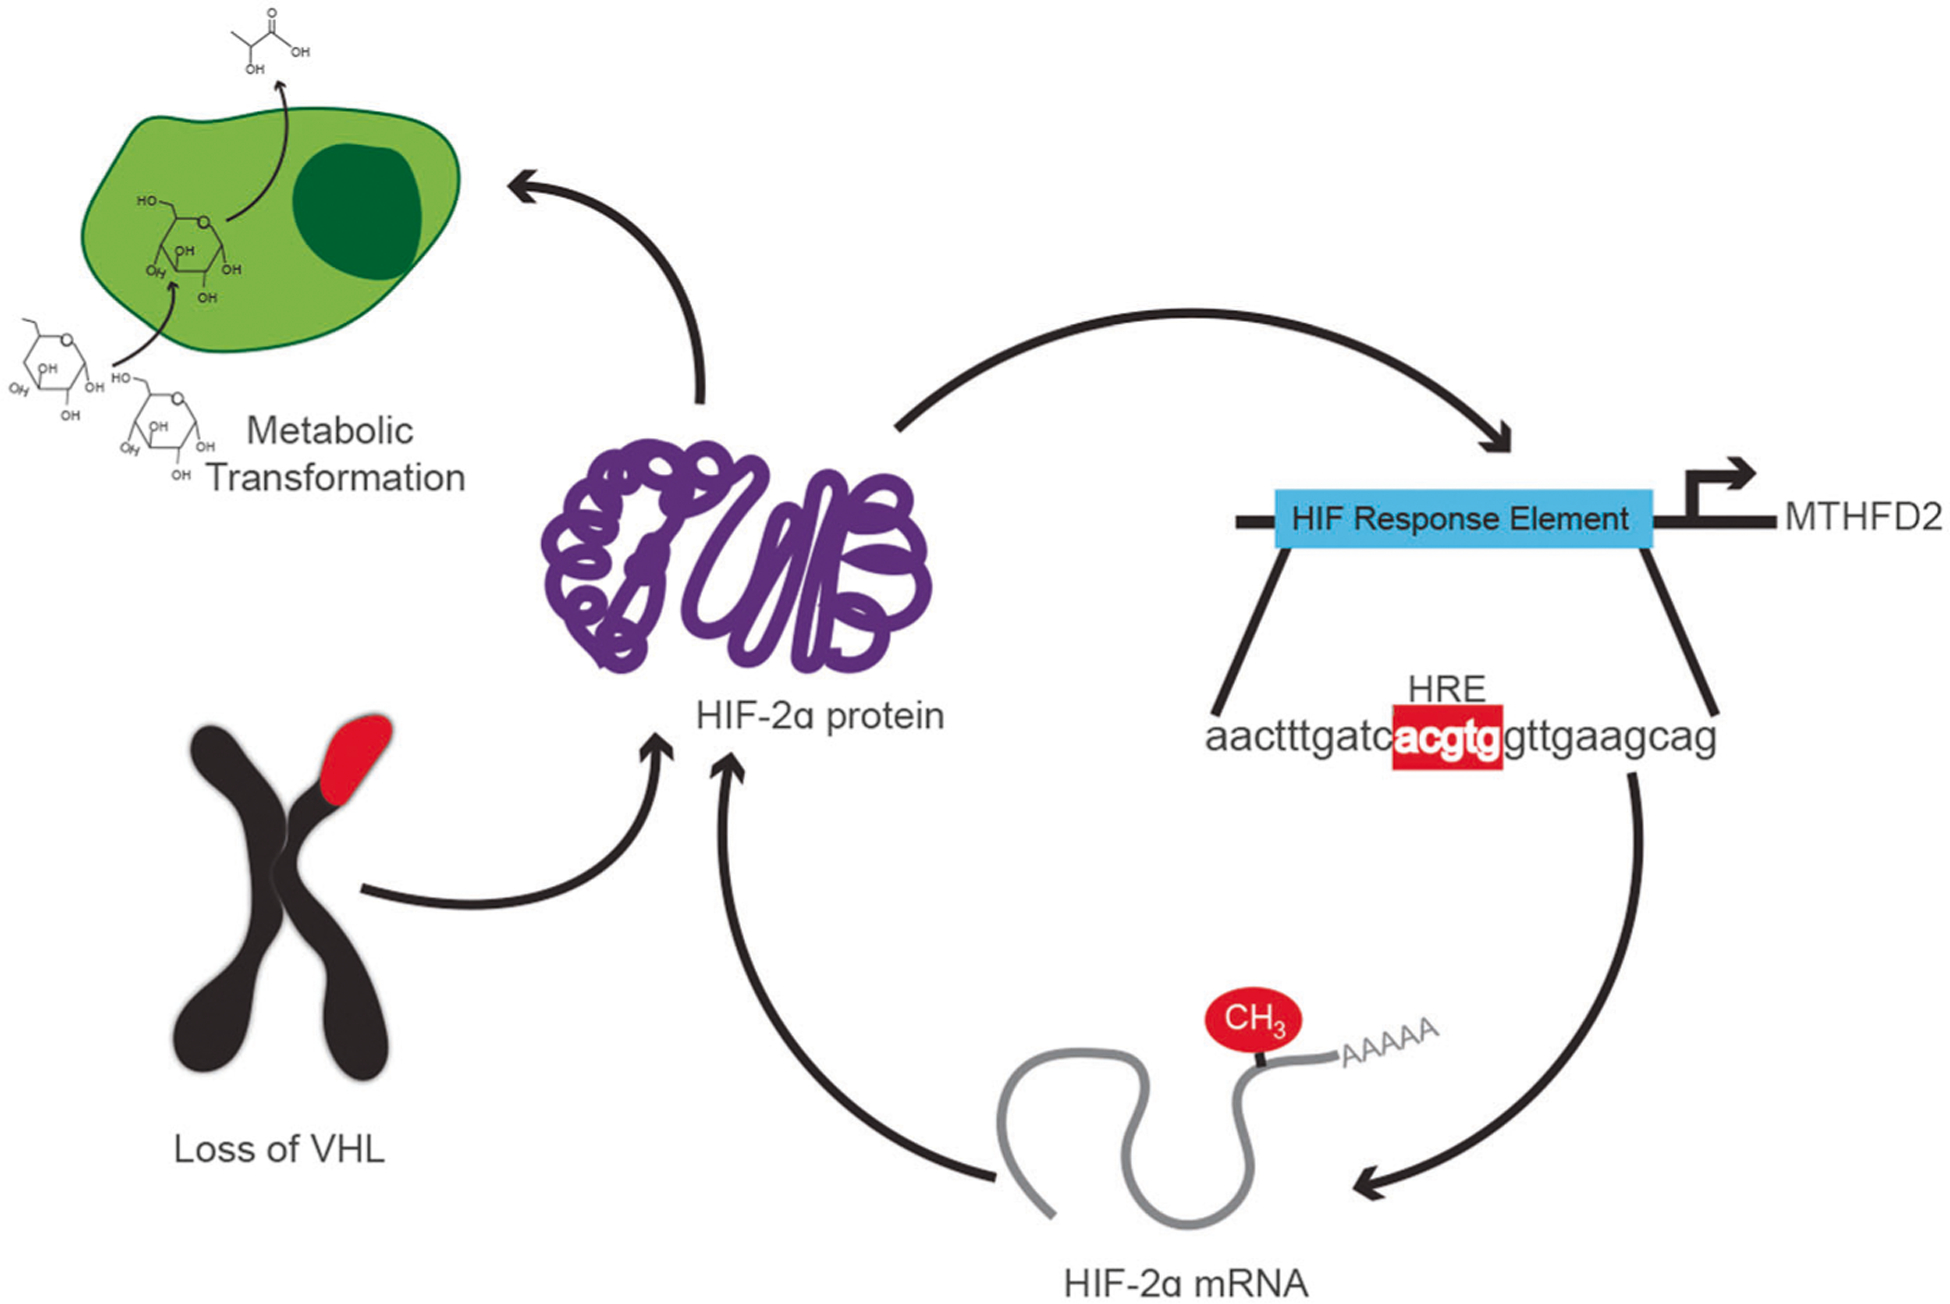
Overall model for the interaction between MTHFD2 and HIF-2α on regulation of RCC metabolic transformation. HIF-2α is stabilized via the loss of VHL. This initiates the positive feedforward loop between MTHFD2 and HIF-2α, wherein HIF-2α increases the transcription of MTHFD2. Higher levels of MTHFD2 increase m6A levels, including on the 3′ UTR of HIF-2α mRNA. This leads to an increase in translation of HIF-2α mRNA, increasing HIF-2α protein levels. Increased HIF-2α protein levels drives the metabolic phenotype seen in RCC
We demonstrated that both genetic and pharmacological inhibition of MTHFD2 in ccRCC cells attenuates growth in culture and xenograft models, as well as attenuates metastatic potential in vitro. Previously, MTHFD2 has been known to play multiple roles on regulating oncogenesis, including regulation of redox balance, generation of nucleotides, and even the potential for a moonlighting role in the nucleus [18, 43]. Although some of these known mechanisms could also potentially play a role in ccRCC tumorigenesis, our findings highlight the regulation of the epitranscriptomic changes as a critical role for MTHFD2 in ccRCC. By controlling epitranscriptomic levels, we show for the first time that MTHFD2 activity modulates the glycolytic status of ccRCC cells through a HIF-2α-dependent mechanism. Consistent with our findings, a recent study has shown modulation of the one-carbon metabolism pathway can alter mitochondrial and glycolytic metabolism by directly affecting methyl modifications of tRNAs in the mitochondria [44]. Our work continues to highlight that the one-carbon metabolism pathway is intricately linked to the metabolic status of the cell, a hallmark of cancer regulation. In addition, MTHFD2’s ability to regulate the HIF-2α-dependent metabolic status of the cell are especially relevant for RCC as HIF-2α is a critical oncogene in RCC development and is actively being targeted for pharmaceutical inhibition for treatment of RCC [45, 46].
One interesting aspect of our study was to show that the interaction between HIF-2α and MTHFD2 is bidirectional, since we also provide data indicating that not only MTHFD2 regulates HIF-2α, but HIF-2α can also regulate MTHFD2. These findings suggest that MTHFD2 acts both upstream and downstream of the HIF-2α protein. Our data suggest that HIF-2α, which is often at high levels in RCC, upregulates MTHFD2 transcript expression by binding to the Mthfd2 promoter, thus increasing MTHFD2 protein levels. MTHFD2 activity then drives an increase in methylation of the HIF-2α mRNA, enhancing the translation of HIF-2α protein driving the HIF-2α metabolic reprogramming canonical to RCC. These data support the existence of a link between MTHFD2 activity and metabolic reprogramming through HIF-2α mRNA methylation. In addition, these data show MTHFD2 and HIF-2α can regulate each other’s protein levels, thus forming a positive feedforward loop driving several downstream signature phenotypes associated with ccRCC. We speculate that because of this positive feedforward, inhibition of MTHFD2 could have additional benefits on tumor growth beyond what has been known, and opens new avenues for pursuing this enzyme as a target for therapeutic modalities.
Finally, our study highlighted the transforming effects of one-carbon metabolism through the modulation of methylation marks on HIF-2α RNA. Epitranscriptomic regulation of mRNA translation and stability is thought to allow for rapid response to stimuli by increasing translation efficiency and regulating mRNA stability. Previous studies have shown increased mRNA methylation, near the stop codon, increases translation levels of the marked mRNA leading to higher protein levels, and thus the epitranscriptome could regulate key oncogenes [32, 33]. In agreement with these previous studies, we found decreased methylation of HIF-2α mRNA decreases its translation. Interestingly, the results of our meRIP-seq experiment show that a vast number of transcripts are significantly hypomethylated in cells depleted of MTHFD2. We chose to focus on HIF-2α, as it has been shown to have significant functions in RCC. However, it is likely that MTHFD2-dependent epitranscriptomic methylation causes regulation of many other proteins that are important for RCC tumorigenesis. As such, further exploration of epitranscriptomic regulation in RCC could lead to new understanding of the biology of RCC and the discovery of targets for therapies in treating RCC in the future.
Methods
RCC patient data
Metabolomics data was used from Hakimi et al. [34] to assess late stage versus early stage metabolites. Two mRNA array datasets comparing renal cell carcinoma tissue to normal kidney tissue from the GEO datasets were used (GDS505, GDS2880) to compare MTHFD2 levels. TCGA was mined for MTHFD2 expression, clinical stage and outcome in the kidney renal clear cell carcinoma (KIRC) dataset. Patients were separated by stage and MTHFD2 expression in each stage was graphed then compared using Kruskal–Wallis followed by Dunn’s multiple comparisons test. KIRC patients were also separated by MTHFD2 expression levels then fit to a Kaplan–Meier curve. Sections of a tissue microarray containing normal kidney (n = 34) and renal cell carcinoma (n = 33) tissue were probed with an anti-MTHFD2 antibody (abcam, ab151447). The sections were then incubated with an HRP secondary antibody and stained with DAB. Hematoxylin was used to counter stain the nuclei. The stained microarray was imaged, and a threshold was applied to resulting images to identify positive cells.
Tissue culture, stable cell generation, and transfections
786-O (ATCC, RRID:CVCL_1051), CAKI-1 (ATCC, RRID: CVCL_0234), and RCC4 cells were cultured in RPMI-1640, McCoy’s 5A with 25 mM HEPES, and DMEM media (Corning), respectively. All media was supplemented with 10% FBS and 1% antibiotic–antimycotic unless otherwise noted. Cells were kept below 10 passages and were checked for mycoplasma contamination using the Lookout® Myco-plasma PCR detection Kit (Sigma-Aldrich). Stable MTHFD2 knockdown was achieved using a lentivirus generated from pLKO plasmid containing shRNA sequence (Sigma-Aldrich) transduced into the specified cell lines and selected for using puromycin. HIF-2α overexpression was achieved by sub-cloning the HIF-2α sequence from HA-HIF-2α wt-pBabe-Puro (HA-HIF-2α wt-pBabe-Puro was a gift from William Kaelin (Addgene plasmid # 26055; http://n2t.net/addgene: 26055; RRID:Addgene_26055) [47]) into the empty pBabe-neo construct (pBABE-neo was a gift from Hartmut Land & Jay Morgenstern & Bob Weinberg (Addgene plasmid # 1767; http://n2t.net/addgene:1767; RRID:Addgene_1767) [48]). Retrovirus was made by transfecting this construct into Phoenix-Ampho cells and harvesting the viral media. Selection was done using 500 μg/mL G418. METTL3 knockdown was achieved using lentiviral particles generated by the shRNA and ORFeome core at MD Anderson Cancer Center.
Xenograft experiments
Xenograft tumors were generated by injection (5.0 × 10⁶ cells/injection) of shMTHFD2 786-O and CAKI-1 lines and their respective shControl cell lines (n = 6 per line, sample size calculated for 80% power to detect a twofold difference with 95% confidence) subcutaneously into 6-week-old male Nu/J mice (Jackson Lab strain number 002019, RRID: IMSR_JAX:002019, mice were randomly taken for each cell line experiment). shControl cells were injected into the right flank, while shMTHFD2 cells were injected into the left flank. Tumor formation was monitored and measured twice weekly using digital calipers, and tumor volume was calculated using the formula 0.5(length)(width)2. At the time of sacrifice, tumors were isolated from surrounding tissues. Tumors were sectioned into five pieces. One section was fixed in 10% formalin for 16 h at 4 °C. One section was fixed in OCT media and frozen on dry ice. The remaining three sections were snap frozen in liquid nitrogen. One of the snap frozen sections was used to isolate protein by homogenization in RIPA buffer followed by centrifugation (12,000 rpm for 10 min at 4 °C). The supernatant yielded the isolated protein fraction used for western blot analysis.
Western blotting and antibodies
Cells were lysed in RIPA (radioimmunoprecipitation) buffer (10 mM Tris, 1 mM EDTA, 0.5 mM EGTA, 1% Triton X-100, 0.1% sodium deoxycholate, 0.1% SDS, 140 mM NaCl, pH 8.0) containing protease/phosphatase inhibitor cocktail (Roche 78441B), 1 mM PMSF, and 1 mM sodium orthovanadate, and the resulting protein concentration was measured using a BCA assay (Pierce). Samples were diluted to equivalent concentrations in 1× sample buffer then loaded and run on 4–15% Bis-Tris gels (Invitrogen). Resulting protein gels were transferred to nitrocellulose membranes, blocked with 5% blotting grade blocker (Bio-Rad) and blotted overnight with the designated primary antibodies. Primary antibodies against the following proteins were used: MTHFD2 (Abcam, ab151447 for western blotting, Abcam, ab56772 for immunofluorescence), Tubulin (Santa Cruz Biotechnology, 2144S), HIF-2α (Cell Signaling Technology, 7096S), METTL3 (Proteintech, 15073–1-AP), H3K4Me3, H3K9Me3 (Abcam, ab8580, ab8898) H3K27Me3 (Millipore, ABE44). For western blots, secondary incubation with either DyLight 800 goat anti-rabbit or DyLight 680 goat anti-mouse (Invitrogen), membranes were imaged using an Odyssey scanner (LI-COR). For immunofluorescence, secondaries were AlexaFluor488 anti-mouse and AlexaFluor594 anti-rabbit (Invitrogen).
In vitro knockdown experiments
Cell proliferation was measured in shMTHFD2 and shControl cells by plating 2000 cells per line per well in triplicate in three 24-well plates in serum free media overnight, then normal cell growth media was added. For MTHFD2 inhibition assays, cells were plated at 2000 cells per well randomly in three 24-well pates and inhibitor solutions of 0, 5, 10, and 15 μM in DMSO (dimethylsulfoxide) were added in triplicate. Cells from one 24-well plate were collected using trypsin on days 2, 4, and 6. Cells were resuspended in 500 μL of media and counted twice using a hemocytometer. Cell migration was measured by plating cells to confluency on six glass circular coverslips per line. Once confluent, cells were scratched across the diameter of the coverslip creating a cell free area. Half of the coverslips were immediately fixed using 4% formaldehyde, stained with hematoxylin, and imaged. The remaining half were incubated for 8 h and then fixed, stained, and imaged. Cell invasion was measured using a CytoSelect™ 24-well cell invasion assay (Cell Biolabs) according to the manufacturer’s protocol.
Global methylation quantification
Global m6A and 5-methylcytosine (5mC) levels were quantified using EpiQuik™ m6A methylation and Methyl-Flash methylated DNA kits, respectively (Epigentek), according the manufacturer’s protocol. Briefly, total RNA or total DNA was collected and bound to strip wells then hybridized to an m6A or 5mC specific antibody. A detection antibody was added followed by a colorimetric developing solution for 3 min then stopped with a quenching solution. The absorbance of each well was read at 450 nm. SAM levels were quantified using the SAM ELISA Kit (Cell Biolabs) on cell lysate. One million cells were lysed in 0.5 mL of PBS by three freeze-thaw cycles; the assay was done according to the manufacturer’s instructions.
N6-methyladenosine RNA Immunoprecipitation (meRIP)
meRIP was performed similar to a previously described protocol [49]. Briefly, mRNA was isolated in duplicate from 300 μg of total RNA using the PolyATtract® mRNA isolation system (Promega). Resulting mRNA was chemically fragmented using NEBNext® magnesium RNA fragmentation module (NEB) at 95 °C for 3 min then purified via ethanol precipitation. Resulting RNA pellet was dissolved in RNase-free water. Overall 5% of total mRNA was removed as input control. Immunoprecipation was performed on 400 ng RNA at a 1 mL volume using 5× IP buffer (50 mM Tris pH 7.4, 750 mM NaCl, 0.5% Igepal CA-630) diluted to 1×, 10 μL SUPERaseIn, 12.5 μg antibody (Synaptic Systems) for 2 h at 4 °C then pulled down using 100 μL Rec A magnetic dynabeads (ThermoFisher). Beads were washed three times in 1× IP buffer. Methylated mRNA was eluted twice using 100 μL 1× IP buffer. Eluent was purified via ethanol precipitation. Purified RNA was sent to Arraystar for library preparation and sequencing. Raw sequencing reads are available at the sequence read archive (SRA accession PRJNA503481). The procedure was repeated for qPCR analysis.
qPCR
RNA was isolated from cells using an E.Z.N.A total RNA Kit (Omega) then quantified using a Nanodrop (ThermoFisher). cDNA was synthesized using SuperScript reverse transcriptase (ThermoFisher) and the qPCR was done using Power SYBR green master mix (Bio-Rad) on a StepOne real-time PCR system (ThermoFisher). Primers to amplify cDNA for the following genes were used: EPAS1: F-CAGAATCACAGAACTGATTGG R-TGACTCTTGGT-CATGTTCTC MTHFD2: F-GTGGATTTTGAAGGAGTC AG R-CTTTAGACTTCAGCACTTCTC SLC2A1: F- AA CTCTTCAGCCAGGGTCCAC R-CACAGTGAAGATGA TGAAGAC VEGFa: F- GGCAAAGTGACTGACCTGCT R-CTGTCTGTCTGTCCGTCAGC TGFB1: F-GCGACTC GCCAGAGTGGTTA R-GTTGATGTCCACTTGCAGTG TGTTA LDHA: F- AGCCCGATTCCGTTACCT R-CA CCAGCAACATTCATTCCA Tubulin: F-TTGGCCAGA TCTTTAGACCAGACAAC R-CCGTACCACATCCAGG ACAGAATC primers to amplify the enriched methylated RNA for the following genes were used: EPAS1: F- CAAGGAGGGGACCTCCTCAG R-CTGAGGAGGTCC CCTCCTTG EGFR: F-CAGAAAGGCAGCCACCAAAT R-GCTTGGCTTCCTTGGGAAAG
HIF-2α 3′ UTR Luciferase Assay
The 3′ UTR of HIF-2α was cloned into a luciferase reporter vector as described previously [50]. Briefly, primers (F-ATTGGAATTCTCGGGCCCTCATTTGAGTCCTACCT R- ATACCTCGAG GATACCAGTGTCAAAATACATTTC CT) were used to amplify the 3′ UTR from 786-O genomic DNA, which was then cloned behind a luciferase construct. Mutagenic PCR’s were performed to mutate the m6A motif from GGAC to GCGC. Constructs were transfected into 786-O shControl and shMTHFD2 cell lines (n = 3 per condition). Three days post transfection, luciferase activity was measured using the Steady-Glo® Luciferase Assay System (Promega, Madison, WI) according to the manufacturer’s instructions.
Chromatin Immunoprecipitation quantitative PCR (ChIP-qPCR)
The assay was performed as described previously [51] with slight modifications. Briefly, in triplicate, formaldehyde was added to a final concentration of 0.75% into the media. The cross-linking was quenched with glycine and cells were harvested in PBS. The cellular pellet was resuspended in lysis buffer and sonicated for 15 min, with 45 s on 15 s off on power level 3 using a sonic dismembrator (Fisher Scientific). Sonicated DNA was added to 10 μg of HIF-2α antibody (D9E3, Cell Signaling) or no antibody prepared with magnetic protein A Dynabeads (ThermoFisher Scientific) incubated overnight. Immunoprecipitated DNA underwent crosslink reversal and was purified using QIA-quick® PCR purification Kit (Qiagen). qPCR primers for the promoters used were HIF-2α: F–TCTCCTCAATGGATCCTATCAG R–TAGCCTCCAG GAAGGAAAGGA A; Col10A1 (Positive control): F-AGCTTCAGAAAG CTGCCAAG R–TCATCC ACAGACTGATGCAA.
Global and mitochondrial ATP level measurement
ATP measurements were performed using the Enliten® ATP assay system (Promega). Briefly, triplicate cells were split into two aliquots. One aliquot was subjected to mitochondria isolation using a mitochondria isolation kit for culture cells (ThermoFisher Scientific). Both the intact cells and isolated mitochondria pellets were resuspended in saline, with 5% taken out for SDS-PAGE analysis, the remaining saline suspension was treated 1:1 with 5% TCA (trichloroacetic acid), vortexed, then neutralized with half the original volume of 1 M Tris pH 7.75. The sample was diluted 1:1 with 1 M Tris pH 7.75. 10 μL of the diluted sample was added to 90 μL of the ATP assay reaction mix and plated in duplicate on a white-bottomed 96-well plate. Luminescence was then measured. The 5% of the original saline sample was diluted with 5× SDS buffer and run on a 7.5% SDS-PAGE gel and probed for SDHA (abcam, ab14715). The luminescence measurement was then normalized to the amount of SDHA.
Seahorse metabolic assays
Cells were plated on a 24-well XF24 plate (Seahorse Biosciences) at a 1.5 × 10⁴ cells/well in normal growth medium. Assay conditions and set up were performed according to the instructions described by Seahorse Biosciences. n = 5 for the glycolysis assay and n = 3, 4 for the mitochondrial stress assay with TCKM1 and 786-O lines, respectively.
2-deoxyglucose
786-O shControl and shMTHFD2+/− HIF-2α or shControl and shMETTL3 were plated at equal density. 2-deoxyglucose (2-DG) was added to glucose-free RPMI-1640 media supplemented with 10% FBS and 1% AA (ThermoFisher) at the stated concentrations, then glucose was added to bring the final concentration of glucose + 2-DG to 2 g/L. The 2-DG media was added to cells in triplicate and cells were grown for 4 days. Cells were trypsinized, resuspended, then counted using a hemocytometer.
Glucose Uptake
Cells were plated at 10,000 cells/well in a 96-well plate. Glucose uptake was measured using the Glucose Uptake-Glo™ Assay (Promega) according to the manufacturer’s protocol.
Statistics
Grouped data is reported as mean ± SEM. Student’s unpaired two-tailed t-test was run to compare two groups. Kruskal–Wallis followed by Dunn’s multiple comparisons test was run for nonparametric multigroup data (MTHFD2 expression in differing patient stages).
Study approval
All animal studies were performed in accordance with NIH guidelines and were approved by the IACUC of the Institute of Biosciences and Technology of Texas A&M University Health Science Center (Houston, Texas, USA).
Supplementary Material
Acknowledgements
FRD received grants from the NIH (R01-DK078900; R01-DK091310). MTH-1459 and MTH-1479 were provided by Raze Therapeutics.
Footnotes
Supplementary information The online version of this article (https://doi.org/10.1038/s41388-019-0869-4) contains supplementary material, which is available to authorized users.
Conflict of interest The authors declare that they have no conflict of interest.
References
- 1.American Cancer Society. Cancer facts & figures 2018. Atlanta: American Cancer Society; 2018. [Google Scholar]
- 2.Noone AM, Howlader N, Krapcho M, Miller D, Brest A, Yu M, et al. (eds). SEER cancer statistics review, 1975–2015. Bethesda, MD: National Cancer Institute; 2018. https://seer.cancer.gov/csr/1975_2015/, based on November 2017 SEER data submission, posted to the SEER web site. [Google Scholar]
- 3.Choueiri TK, Motzer RJ. Systemic therapy for metastatic renal-cell carcinoma. N Engl J Med. 2017;376:354–66. [DOI] [PubMed] [Google Scholar]
- 4.Hsieh JJ, Purdue MP, Signoretti S, Swanton C, Albiges L, Schmidinger M, et al. Renal cell carcinoma. Nat Rev Dis Prim. 2017;3:17009. [DOI] [PMC free article] [PubMed] [Google Scholar]
- 5.Gebhard RL, Clayman RV, Prigge WF, Figenshau R, Staley NA, Reesey C, et al. Abnormal cholesterol metabolism in renal clear cell carcinoma. J Lipid Res. 1987;28:1177–84. [PubMed] [Google Scholar]
- 6.Cancer Genome Atlas Research N. Comprehensive molecular characterization of clear cell renal cell carcinoma. Nature. 2013;499:43–9. [DOI] [PMC free article] [PubMed] [Google Scholar]
- 7.Wettersten HI, Aboud OA, Lara PN Jr., Weiss RH. Metabolic reprogramming in clear cell renal cell carcinoma. Nat Rev Nephrol. 2017;13:410–9. [DOI] [PubMed] [Google Scholar]
- 8.Li B, Qiu B, Lee DS, Walton ZE, Ochocki JD, Mathew LK, et al. Fructose-1,6-bisphosphatase opposes renal carcinoma progression. Nature. 2014;513:251–5. [DOI] [PMC free article] [PubMed] [Google Scholar]
- 9.Massari F, Ciccarese C, Santoni M, Brunelli M, Piva F, Modena A, et al. Metabolic alterations in renal cell carcinoma. Cancer Treat Rev. 2015;41:767–76. [DOI] [PubMed] [Google Scholar]
- 10.Gnarra JR, Tory K, Weng Y, Schmidt L, Wei MH, Li H, et al. Mutations of the VHL tumour suppressor gene in renal carcinoma. Nat Genet. 1994;7:85–90. [DOI] [PubMed] [Google Scholar]
- 11.Mack FA, Rathmell WK, Arsham AM, Gnarra J, Keith B, Simon MC. Loss of pVHL is sufficient to cause HIF dysregulation in primary cells but does not promote tumor growth. Cancer Cell. 2003;3:75–88. [DOI] [PMC free article] [PubMed] [Google Scholar]
- 12.Nickerson ML, Jaeger E, Shi Y, Durocher JA, Mahurkar S, Zaridze D, et al. Improved identification of von Hippel-Lindau gene alterations in clear cell renal tumors. Clin Cancer Res. 2008;14:4726–34. [DOI] [PMC free article] [PubMed] [Google Scholar]
- 13.Moore LE, Nickerson ML, Brennan P, Toro JR, Jaeger E, Rinsky J, et al. Von Hippel-Lindau (VHL) inactivation in sporadic clear cell renal cancer: associations with germline VHL polymorphisms and etiologic risk factors. PLoS Genet. 2011;7:e1002312. [DOI] [PMC free article] [PubMed] [Google Scholar]
- 14.Kaelin WG Jr. The von Hippel-Lindau tumor suppressor protein and clear cell renal carcinoma. Clin Cancer Res. 2007;13(2 Pt 2):680s–4s. [DOI] [PubMed] [Google Scholar]
- 15.Majmundar AJ, Wong WJ, Simon MC. Hypoxia-inducible factors and the response to hypoxic stress. Mol Cell. 2010;40:294–309. [DOI] [PMC free article] [PubMed] [Google Scholar]
- 16.Dengler VL, Galbraith M, Espinosa JM. Transcriptional regulation by hypoxia inducible factors. Crit Rev Biochem Mol Biol. 2014;49:1–15. [DOI] [PMC free article] [PubMed] [Google Scholar]
- 17.Zhang H, Gao P, Fukuda R, Kumar G, Krishnamachary B, Zeller KI, et al. HIF-1 inhibits mitochondrial biogenesis and cellular respiration in VHL-deficient renal cell carcinoma by repression of C-MYC activity. Cancer Cell. 2007;11:407–20. [DOI] [PubMed] [Google Scholar]
- 18.Yang M, Vousden KH. Serine and one-carbon metabolism in cancer. Nat Rev Cancer. 2016;16:650–62. [DOI] [PubMed] [Google Scholar]
- 19.Ben-Sahra I, Hoxhaj G, Ricoult SJ, Asara JM, Manning BD. mTORC1 induces purine synthesis through control of the mitochondrial tetrahydrofolate cycle. Science. 2016;351:728–33. [DOI] [PMC free article] [PubMed] [Google Scholar]
- 20.Labuschagne CF, van den Broek NJ, Mackay GM, Vousden KH, Maddocks OD. Serine, but not glycine, supports one-carbon metabolism and proliferation of cancer cells. Cell Rep. 2014;7:1248–58. [DOI] [PubMed] [Google Scholar]
- 21.Tedeschi PM, Markert EK, Gounder M, Lin H, Dvorzhinski D, Dolfi SC, et al. Contribution of serine, folate and glycine metabolism to the ATP, NADPH and purine requirements of cancer cells. Cell Death Dis. 2013;4:e877. [DOI] [PMC free article] [PubMed] [Google Scholar]
- 22.Ye J, Fan J, Venneti S, Wan YW, Pawel BR, Zhang J, et al. Serine catabolism regulates mitochondrial redox control during hypoxia. Cancer Discov. 2014;4:1406–17. [DOI] [PMC free article] [PubMed] [Google Scholar]
- 23.Tibbetts AS, Appling DR. Compartmentalization of Mammalian folate-mediated one-carbon metabolism. Annu Rev Nutr. 2010;30:57–81. [DOI] [PubMed] [Google Scholar]
- 24.Locasale JW. Serine, glycine and one-carbon units: cancer metabolism in full circle. Nat Rev Cancer. 2013;13:572–83. [DOI] [PMC free article] [PubMed] [Google Scholar]
- 25.Di Pietro E, Sirois J, Tremblay ML, MacKenzie RE. Mitochondrial NAD-Dependent Methylenetetrahydrofolate Dehydrogenase-Methnyltetrahydrofolate cyclohydrolase is essential for embryonic development. Mol Cell Biol. 2002;22:4158–66. [DOI] [PMC free article] [PubMed] [Google Scholar]
- 26.Pikman Y, Puissant A, Alexe G, Furman A, Chen LM, Frumm SM, et al. Targeting MTHFD2 in acute myeloid leukemia. J Exp Med. 2016;213:1285–306. [DOI] [PMC free article] [PubMed] [Google Scholar]
- 27.Koufaris C, Gallage S, Yang T, Lau CH, Valbuena GN, Keun HC. Suppression of MTHFD2 in MCF-7 breast cancer cells increases glycolysis, dependency on exogenous glycine, and sensitivity to folate depletion. J Proteom Res. 2016;15:2618–25. [DOI] [PubMed] [Google Scholar]
- 28.Ducker GS, Chen L, Morscher RJ, Ghergurovich JM, Esposito M, Teng X, et al. Reversal of cytosolic one-carbon flux compensates for loss of the mitochondrial folate pathway. Cell Metab. 2016;23:1140–53. [DOI] [PMC free article] [PubMed] [Google Scholar]
- 29.Fu Y, Dominissini D, Rechavi G, He C. Gene expression regulation mediated through reversible m(6)A RNA methylation. Nat Rev Genet. 2014;15:293–306. [DOI] [PubMed] [Google Scholar]
- 30.Meyer KD, Saletore Y, Zumbo P, Elemento O, Mason CE, Jaffrey SR. Comprehensive analysis of mRNA methylation reveals enrichment in 3’ UTRs and near stop codons. Cell. 2012;149:1635–46. [DOI] [PMC free article] [PubMed] [Google Scholar]
- 31.Dominissini D, Moshitch-Moshkovitz S, Schwartz S, Salmon-Divon M, Ungar L, Osenberg S, et al. Topology of the human and mouse m6A RNA methylomes revealed by m6A-seq. Nature. 2012;485:201–6. [DOI] [PubMed] [Google Scholar]
- 32.Wang X, Zhao BS, Roundtree IA, Lu Z, Han D, Ma H, et al. N(6)-methyladenosine Modulates Messenger RNA Translation Efficiency. Cell. 2015;161:1388–99. [DOI] [PMC free article] [PubMed] [Google Scholar]
- 33.Lin S, Choe J, Du P, Triboulet R, Gregory RI. The m(6)A Methyltransferase METTL3 Promotes Translation in Human Cancer Cells. Mol Cell. 2016;62:335–45. [DOI] [PMC free article] [PubMed] [Google Scholar]
- 34.Hakimi AA, Reznik E, Lee CH, Creighton CJ, Brannon AR, Luna A, et al. An Integrated Metabolic Atlas of Clear Cell Renal Cell Carcinoma. Cancer Cell. 2016;29:104–16. [DOI] [PMC free article] [PubMed] [Google Scholar]
- 35.Barrett T, Wilhite SE, Ledoux P, Evangelista C, Kim IF, Toma-shevsky M, et al. NCBI GEO: archive for functional genomics data sets-update. Nucleic Acids Res. 2013;41(Database issue):D991–5. [DOI] [PMC free article] [PubMed] [Google Scholar]
- 36.Lenburg ME, Liou LS, Gerry NP, Frampton GM, Cohen HT, Christman MF. Previously unidentified changes in renal cell carcinoma gene expression identified by parametric analysis of microarray data. BMC Cancer. 2003;3:31. [DOI] [PMC free article] [PubMed] [Google Scholar]
- 37.Tun HW, Marlow LA, von Roemeling CA, Cooper SJ, Kreinest P, Wu K, et al. Pathway signature and cellular differentiation in clear cell renal cell carcinoma. PLoS ONE. 2010;5:e10696. [DOI] [PMC free article] [PubMed] [Google Scholar]
- 38.Hanahan D, Weinberg RA. Hallmarks of cancer: the next generation. Cell. 2011;144:646–74. [DOI] [PubMed] [Google Scholar]
- 39.Qiu B, Ackerman D, Sanchez DJ, Li B, Ochocki JD, Grazioli A, et al. HIF2alpha-Dependent Lipid Storage Promotes Endoplasmic Reticulum Homeostasis in Clear-Cell Renal Cell Carcinoma. Cancer Discov. 2015;5:652–67. [DOI] [PMC free article] [PubMed] [Google Scholar]
- 40.Martinez-Saez O, Gajate Borau P, Alonso-Gordoa T, Molina-Cerrillo J, Grande E. Targeting HIF-2 alpha in clear cell renal cell carcinoma: A promising therapeutic strategy. Crit Rev Oncol Hematol. 2017;111:117–23. [DOI] [PubMed] [Google Scholar]
- 41.Raval RR, Lau KW, Tran MG, Sowter HM, Mandriota SJ, Li JL, et al. Contrasting properties of hypoxia-inducible factor 1 (HIF-1) and HIF-2 in von Hippel-Lindau-associated renal cell carcinoma. Mol Cell Biol. 2005;25:5675–86. [DOI] [PMC free article] [PubMed] [Google Scholar]
- 42.Shimba S, Wada T, Hara S, Tezuka M. EPAS1 promotes adipose differentiation in 3T3-L1 cells. J Biol Chem. 2004;279:40946–53. [DOI] [PubMed] [Google Scholar]
- 43.Gustafsson Sheppard N, Jarl L, Mahadessian D, Strittmatter L, Schmidt A, Madhusudan N, et al. The folate-coupled enzyme MTHFD2 is a nuclear protein and promotes cell proliferation. Sci Rep. 2015;5:15029. [DOI] [PMC free article] [PubMed] [Google Scholar]
- 44.Morscher RJ, Ducker GS, Li SH, Mayer JA, Gitai Z, Sperl W, et al. Mitochondrial translation requires folate-dependent tRNA methylation. Nature. 2018;554:128–32. [DOI] [PMC free article] [PubMed] [Google Scholar]
- 45.Chen W, Hill H, Christie A, Kim MS, Holloman E, Pavia-Jimenez A, et al. Targeting renal cell carcinoma with a HIF-2 antagonist. Nature. 2016;539:112–7. [DOI] [PMC free article] [PubMed] [Google Scholar]
- 46.Cho H, Du X, Rizzi JP, Liberzon E, Chakraborty AA, Gao W, et al. On-target efficacy of a HIF-2alpha antagonist in preclinical kidney cancer models. Nature. 2016;539:107–11. [DOI] [PMC free article] [PubMed] [Google Scholar]
- 47.Yan Q, Bartz S, Mao M, Li L, Kaelin WG Jr. The hypoxia-inducible factor 2alpha N-terminal and C-terminal transactivation domains cooperate to promote renal tumorigenesis in vivo. Mol Cell Biol. 2007;27:2092–102. [DOI] [PMC free article] [PubMed] [Google Scholar]
- 48.Morgenstern JP, Land H. Advanced mammalian gene transfer: high titre retroviral vectors with multiple drug selection markers and a complementary helper-free packaging cell line. Nucleic Acids Res. 1990;18:3587–96. [DOI] [PMC free article] [PubMed] [Google Scholar]
- 49.Dominissini D, Moshitch-Moshkovitz S, Salmon-Divon M, Amariglio N, Rechavi G. Transcriptome-wide mapping of N(6)-methyladenosine by m(6)A-seq based on immunocapturing and massively parallel sequencing. Nat Protoc. 2013;8:176–89. [DOI] [PubMed] [Google Scholar]
- 50.Long J, Wang Y, Wang W, Chang BH, Danesh FR. Identification of microRNA-93 as a novel regulator of vascular endothelial growth factor in hyperglycemic conditions. J Biol Chem. 2010;285:23457–65. [DOI] [PMC free article] [PubMed] [Google Scholar]
- 51.Komata M, Katou Y, Tanaka H, Nakato R, Shirahige K, Bando M. Chromatin immunoprecipitation protocol for mammalian cells. Methods Mol Biol. 2014;1164:33–8. [DOI] [PubMed] [Google Scholar]
Associated Data
This section collects any data citations, data availability statements, or supplementary materials included in this article.