

SUMMARY
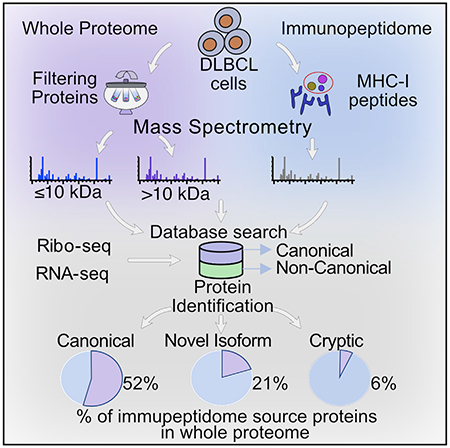
Combining RNA sequencing, ribosome profiling, and mass spectrometry, we elucidate the contribution of non-canonical translation to the proteome and major histocompatibility complex (MHC) class I immunopeptidome. Remarkably, of 14,498 proteins identified in three human B cell lymphomas, 2,503 are non-canonical proteins. Of these, 28% are novel isoforms and 72% are cryptic proteins encoded by ostensibly non-coding regions (60%) or frameshifted canonical genes (12%). Cryptic proteins are translated as efficiently as canonical proteins, have more predicted disordered residues and lower stability, and critically generate MHC-I peptides 5-fold more efficiently per translation event. Translating 5′ “untranslated” regions hinders downstream translation of genes involved in transcription, translation, and antiviral responses. Novel protein isoforms show strong enrichment for signaling pathways deregulated in cancer. Only a small fraction of cryptic proteins detected in the proteome contribute to the MHC-I immunopeptidome, demonstrating the high preferential access of cryptic defective ribosomal products to the class I pathway.
Graphical Abstract
In brief
Ruiz Cuevas et al. describe a proteogenomic strategy for the detection of non-canonical proteins based on ribosome profiling. Relative to canonical proteins, cryptic proteins are translated as efficiently, are more disordered and unstable, and are particularly efficient at generating MHC-I peptides.
INTRODUCTION
Ribosome profiling (Ribo-seq) and mass spectrometry (MS) analyses reveal that many proteins are encoded by non-canonical open reading frames (ORFs) (Brunet et al., 2018, 2019; Ingolia, 2016; Lu et al., 2019). Non-canonical proteins are encoded by both ostensibly non-coding ORFs and canonical ORFs in +1 or +2 reading frames. Accumulating evidence suggests that, far from representing translational noise, non-canonical proteins often exhibit critical and diverse cellular functions (Chen et al., 2020; van Heesch et al., 2019). Notably, when compared to classic ORFs, non-canonical ORFs present several distinctive features: they are shorter; have lower transcription and translation rates; commonly initiate translation on near-cognate codons (i.e., differ from AUG by a single nucleotide); and are predicted to be less stable in vivo (Chen et al., 2020; Erhard et al., 2018; Fields et al., 2015; Ivanov et al., 2011; Lu et al., 2019; Samandi et al., 2017; Starck et al., 2012).
Due to their short length and low abundance, non-canonical proteins are challenging to detect in whole-cell extracts by shotgun MS analyses. However, in the cells of jawed vertebrates, major histocompatibility complex class I molecules (MHC-I) have the remarkable ability to non-covalently bind and protect peptides, many of which derive from defective ribosomal products (DRiPs) and short-lived proteins (SLiPs) (Yewdell, 2003). DRiPs are translation products that do not achieve functional integration to the proteome and are degraded with an average half-life on the order of 8 min (Bourdetsky et al., 2014; Milner et al., 2006; Qian et al., 2006; Reits et al., 2000; Schubert et al., 2000). MHC-I-peptide complexes are transported to the cell surface to enable T cell immunosurveillance of infected and neoplastic cells. Cell surface MHC-I-associated peptides (MAPs) exhibit half-lives on the order of 12 h (Blaha et al., 2019; Prevosto et al., 2016), far longer than their source polypeptides in the case of SLiPs and DRiPs (Dersh et al., 2021). Thus, MHC-I serves as a sink for peptides whose source protein translation would otherwise be invisible to MS due to their rapid degradation.
Indeed, accumulating evidence indicates that a sizeable fraction of MAPs is encoded by non-canonical ORFs (Chong et al., 2020; Laumont et al., 2016, 2018; Ouspenskaia et al., 2020), which provide most tumor-specific antigens (Laumont et al., 2018; Zhao et al., 2020). Due to its tight linkage to translation, the class I immunopeptidome is highly dynamic and sensitive to metabolic perturbation, infection, and neoplastic transformation (Caron et al., 2011; Laumont et al., 2018; Wei et al., 2019). By contrast, the MHC class II immunopeptidome largely derives from large and stable proteins, with a trace contribution of non-canonical ORFs (Chong et al., 2020), due to the predominant loading of class II molecules in the lysosomal/endosomal compartment.
MS analysis provides concrete evidence for the translation of a given polypeptide. Large-scale MS analyses of proteins and MAPs have been considerably refined over the last few years, with notable increases in sensitivity and accuracy (Chong et al., 2020; Courcelles et al., 2020; Ghosh et al., 2020; Ouspenskaia et al., 2020; Purcell et al., 2019; Vizcaino et al., 2020). However, shotgun MS still requires creating a reference database to identify peptides present in a given sample. This becomes limiting when searching for non-canonical peptides that potentially originate from any genomic sequence. All-frame in silico translation of entire transcriptomes creates enormous databases, and searching MS data against such inflated reference databases generates false positives at an unacceptable rate (Finotello et al., 2019; Nesvizhskii, 2010, 2014). Various approaches have been employed to optimize the reference database size based on the in silico translation of transcriptomic data.
One reductionist approach to identify unique tumor-specific MAPs rests on purging the reference database of sequences present in non-tumor cells (Laumont et al., 2018; Zhao et al., 2020). More recently, two proof-of-principle studies established that cancer MAPs can be identified using reference databases built from Ribo-seq (Chong et al., 2020; Ouspenskaia et al., 2020). Here, we describe a proteogenomic approach to identify non-canonical translation products present in whole-cell extracts and the immunopeptidome. Our findings demonstrate distinct features of the non-canonical translatome and their critical contribution to tumor immunosurveillance.
RESULTS
A proteogenomic strategy for identification of non-canonical translation products
To identify non-canonical proteins, we developed an approach that combines Ribo-seq and RNA sequencing (RNA-seq) data to create non-redundant sample-specific protein databases (Ribo-db) containing only actively translated sequences. Indeed, after retrieving and sequencing ribosome-protected RNA fragments, Ribo-seq produces a detailed map of active cell translation events (Ingolia et al., 2009). Here, we collected Ribo-seq translation initiation sites (TISs), elongation, and RNA-seq data from three human diffuse large B cell lymphomas (DLBCLs), HBL-1, DoHH2, and SU-DHL-4. We intersected genomic positions of the start codons to the genomic positions of the assembled transcripts (Ribo-seq elongation and RNA-seq) to generate the set of ORFs (coupled start codon with an assembled transcript) for in silico translation (see STAR methods and Figure 1A). From this set of ORFs, we define canonical proteins as those translated from an annotated start codon coupled to the corresponding transcript according to genome version GRCh38.p10 (GENCODE version 26). We define non-canonical translation products as those originating from a non-annotated initiation site, a new transcript, or both. We combined translation products into a sample-specific database for MS analysis (Figure 1A).
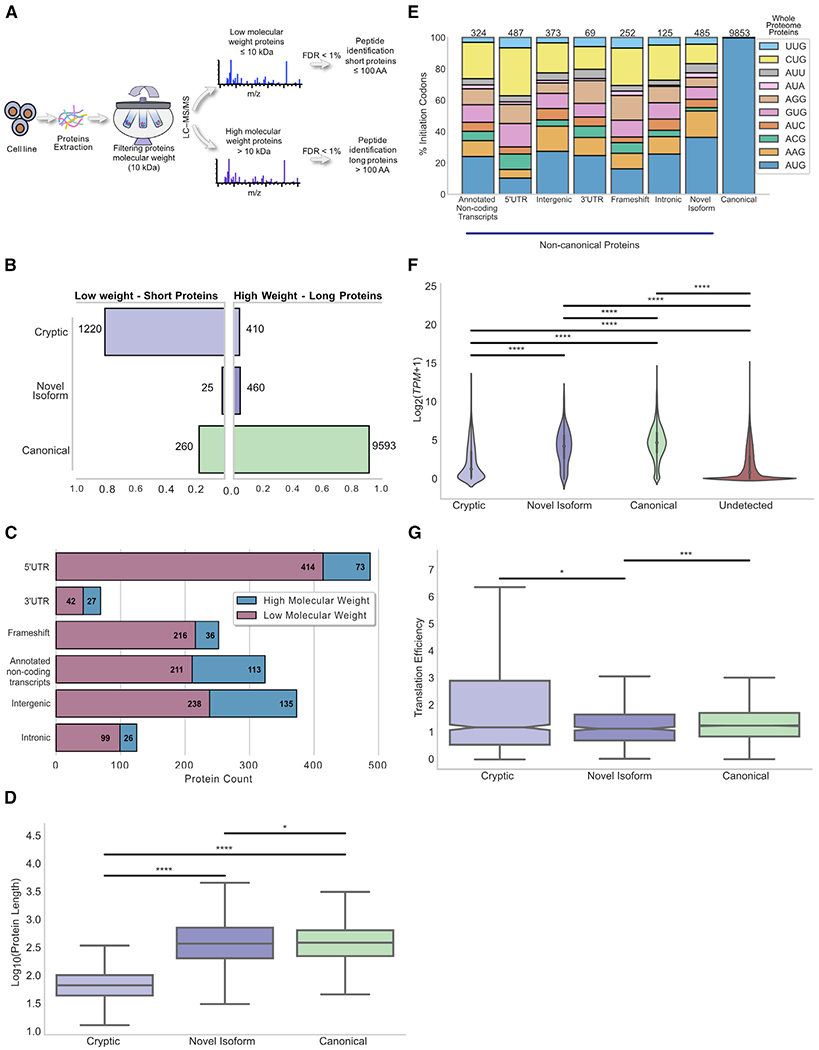
Figure 1. Ribo-seq-based proteogenomic approach for MS identification of non-canonical translation products.
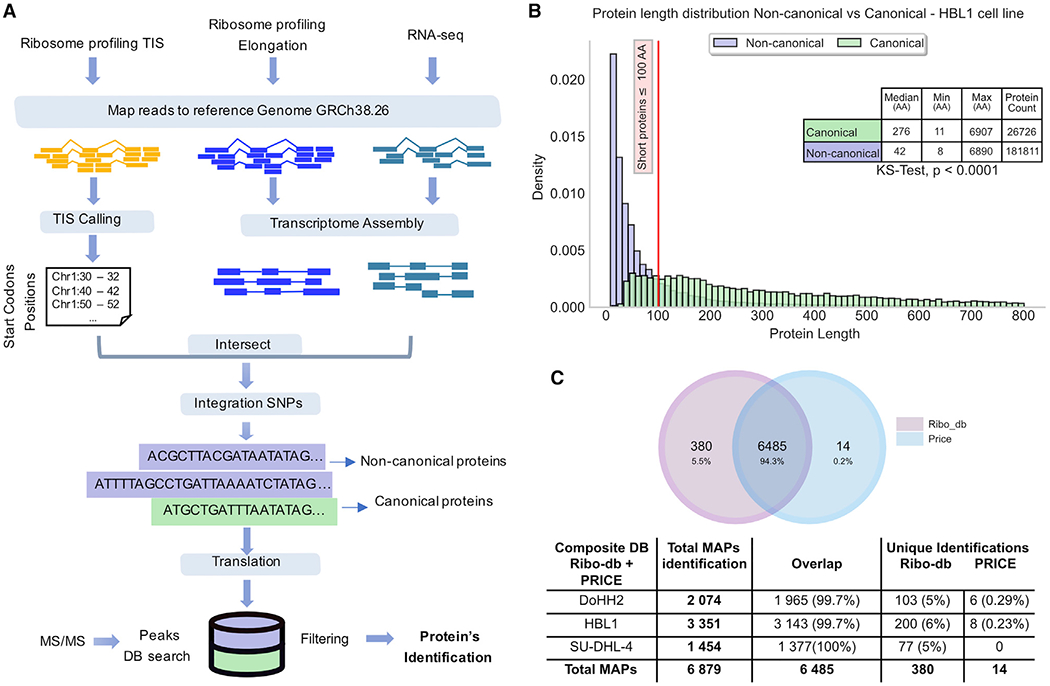
(A) General overview of the workflow used to generate sample-specific databases containing active canonical and non-canonical translations based on Ribo-seq data.
(B) Length distribution of canonical versus non-canonical proteinsfrom HBL-1 cells. ****p < 0.0001; Kolmogorov-Smirnov test. Proteins with a length >800 amino acids are not displayed.
(C) Venn diagram and table showing MAPs identified with the Ribo-db approach and the PRICE method.
We first analyzed the general features of Ribo-db-predicted canonical and non-canonical translation products. As reported (Samandi et al., 2017), non-canonical proteins were more numerous but shorter than canonical proteins (Figure 1B). Indeed, ~70% of non-canonical proteins in the three cell lines were ≤100 amino acids (Figures 1B and S1A–S1B). Next, we assessed the sensitivity and specificity of Ribo-db by comparison to PRICE as a benchmark (Erhard et al., 2018). PRICE was developed to identify non-canonical translation events that generate MAPs. Because the calculation of the false discovery rate (FDR) is directly related to the size of the database under target-decoy approaches (Blakeley et al., 2012; Nesvizhskii, 2010, 2014), it is difficult to make a valid comparison between databases in which their size differs significantly (Table S1). To mitigate this, for each DLBCL, we generated a composite database combining Ribo-db and PRICE sequences to identify MAPs detected by tandem MS. We based MAP identification on three criteria: a peptide length between 8 and 11 amino acids; a predicted MHC binding affinity in the top 2% for the corresponding human leukocyte antigen (HLA) class I molecules expressed by each tumor; and a sample-specific FDR (see STAR methods and Figure S1E). We recognize that peptides with lower predicted MHC binding affinity can represent genuine MAPs (Capietto et al., 2020). However, given the very high number of predicted non-canonical proteins (Figure 1B), we deemed it preferable, at this stage, to employ stringent selection criteria that may underestimate the number of non-canonical MAPs. Our Ribo-db approach identified 99.7% of MAPs identified with PRICE and 5% to 6% of MAPs missed by PRICE (Figure 1C). The number of MAPs identified per cell line positively correlated with the total class I cell surface expression determined by the binding of the W6/32 pan HLA class I monoclonal antibody (mAb) (Figures S1C and S1D). We conclude that Ribo-db is well suited to discovering non-canonical translation products, outperforming PRICE, the previous best-in-class method for probing peptides arising from non-canonical translation.
The global landscape of non-canonical MAPs
To optimize MAP identification and evaluate the contribution of non-canonical translation products, we performed MS searches using the Ribo-db customized databases. Because this database is smaller than the composite (Ribo-db+PRICE) database (Table S1), we discarded fewer identified MAPs because of the FDR. Despite the smaller size of the Ribo-db database, we identified 166 more MAPs than if we had used the composite database (7,045 versus 6,879 total MAPs, respectively) (Figure S1C). To identify MAP source proteins, we considered that any MAP sequence might be redundant in the database. Therefore, we used a strategy to assign the most likely origin for individuals MAPs, based on (1) the start codon score issued from the TIS-calling method, (2) the presence of an optimal or strong Kozak motif embedding the start codon (Kozak, 1987), and (3) the expression level of the source transcript as determined by read numbers (Figure S1E).
Out of the 7,045 identified MAPs, 6,520 source ORFs were canonical and 525 were non-canonical (Figure 2A). Key features of canonical and non-canonical MAPs were highly similar: length distribution (mostly nonamers); PEAKS peptide confidence score (20.92 canonical versus 20.15 non-canonical median scores); and NetMHC-pan predicted MHC binding affinity in the top 2% for the corresponding HLA allotype (median binding rank % of 0.16 for canonical and 0.15 for non-canonical MAPs).
Figure 2. Features of MAPs derived from canonical and non-canonical proteins.
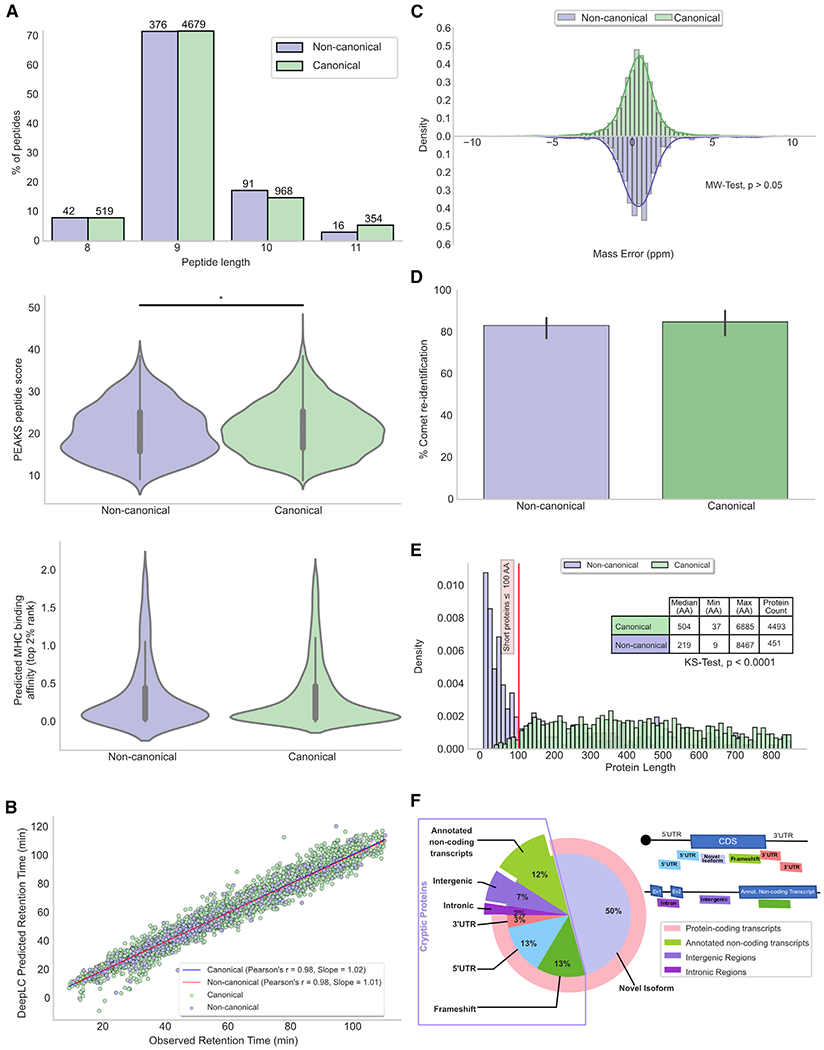
(A–C) Displayed data refer to all canonical (n = 6,520) and non-canonical (n = 525) MAPs (total from 3 cell lines, 2 replicates each).
(A) Length, spectrum score (*p < 0.05; t test); MHC binding (p > 0.05; Kolmogorov-Smirnov test).
(B) Pearson correlations between observed and DeepLC-predicted retention times of MAPs derived from canonical and non-canonical proteins.
(C) Relative mass error of MAPs derived from canonical and non-canonical proteins. p > 0.05; two-sided Mann-Whitney U test.
(D) Percentage of successful MAPs re-identification with Comet. p > 0.05; two-sided Mann-Whitney U test. Bar plot shows the median with error bars: 95% confidence interval (CI) (n = 3 cell lines).
(E) Length distribution of canonical (n = 4,493) and non-canonical (n = 451) MAPs source proteins. ****p < 0.0001; Kolmogorov-Smirnov test. Proteins with a length >800 amino acids are not displayed.
(F) Non-canonical MAPs source proteins derive from coding and non-coding transcripts. Pie chart showing the percentages of non-canonical proteins for each biotype and diagram illustrating how various types of transcripts were designated as a function of their genomic location.
We then assessed the accuracy of non-canonical identifications using three validation methods. First, we compared the observed retention times of liquid chromatography-tandem mass spectrometry (LC-MS/MS)-sequenced peptides (Wen et al., 2020) to the DeepLC algorithm predicted-retention times (Bouwmeester et al., 2020). Both canonical and non-canonical peptides showed an excellent correlation between experimental and predicted retention times (Figure 2B). Second, we evaluated the relative mass error between the measured experimental values and the expected mass for all peptides. No significant difference was found in the distribution of mass errors of canonical versus non-canonical peptides (Figure 2C). Lastly, we repeated all peptide searches using Comet (Eng et al., 2015). The average percentage of PEAKs to Comet peptides re-identification was similar for canonical and non-canonical peptides (85% for canonical and 83% for non-canonical peptides) (Figure 2D). Together, these validations further reinforce the authenticity of our non-canonical identifications.
The 6,520 canonical MAPs derive from 4,493 canonical proteins (91%) and the 525 non-canonical MAPs from 451 non-canonical proteins (9%) (Figure S2A). Consistent with the differential length of canonical and non-canonical proteins (Figures 1B, S1A, and S1B), non-canonical MAPs derived from shorter proteins than canonical MAPs (Figure 2E). Non-canonical MAP source proteins were classified according to their gene biotype (transcript classification) using GENCODE annotation (Harrow et al., 2012). The majority (79%) derives from sequences within protein-coding transcripts (including novel isoforms, UTRs, and frameshifts); 12% from transcripts assumed to be non-coding, such as pseudogenes, non-coding RNAs, or processed transcripts; 7% from intergenic regions; and 2% from introns (Figure 2F). This is consistent with evidence for peptides generated from these ostensibly non-coding regions of the genome (Apcher et al., 2013; Coulie et al., 1995; Laumont et al., 2016; Lu et al., 2019; van Heesch et al., 2019), though it does not support a major role for introns in generating the immunopeptidome in these cells.
As previously shown (Chen et al., 2020), among the non-canonical proteins derived from protein-coding transcripts, MAP source ORFs attributed to 5′ UTR were 4-fold more frequent than 3′ UTR (13% versus 3% of total non-canonical proteins) (Figures 2F and S2B). MAPs resulting from canonical gene frameshifting (13%) confirmed the proteome’s malleability because a canonical protein may not be the transcript’s sole translation product. Such translation can occur from ribosomes bypassing a start codon or shifting frames during translation due to mRNA structure (Bullock and Eisenlohr, 1996).
Half (50%; n = 225) of the non-canonical proteins originated from novel isoforms (Figures 2F and S2B). This group corresponds to proteins in frame with a canonical protein for which we eitherfound few initiation events at the annotated start codon or the absence of an annotated start codon. Because their sequence overlaps with canonical proteins and their large size, these proteins were considered hereafter as novel isoforms. Consequently, for subsequent analyses, we analyzed novel isoforms separately from the rest of the non-canonical proteins. The remaining non-canonical proteins were further qualified as cryptic proteins.
Divergent properties of cryptic and canonical MAP source proteins
Next, we elucidated the features of cryptic proteins, novel isoforms, and canonical MAP source proteins. By definition, canonical (annotated) proteins initiated almost exclusively (99.9%) on an AUG codon. Importantly, Ribo-seq TIS revealed that, first, 40% of newly identified proteins initiated on unannotated AUG initiation sites and, second, more than half of the cryptic and novel isoform MAP source proteins (53% and 67%, respectively) initiated from a non-AUG near-cognate codon (Figures 3A and S2C). As previously reported (Ingolia et al., 2011; Ivanov et al., 2010; Lee et al., 2012; Starck et al., 2012), CUG was the most efficient codon at initiating unannotated proteins, though AAG was also frequently used and other near-cognate codons were well represented.
Figure 3. Properties of MAP source proteins.
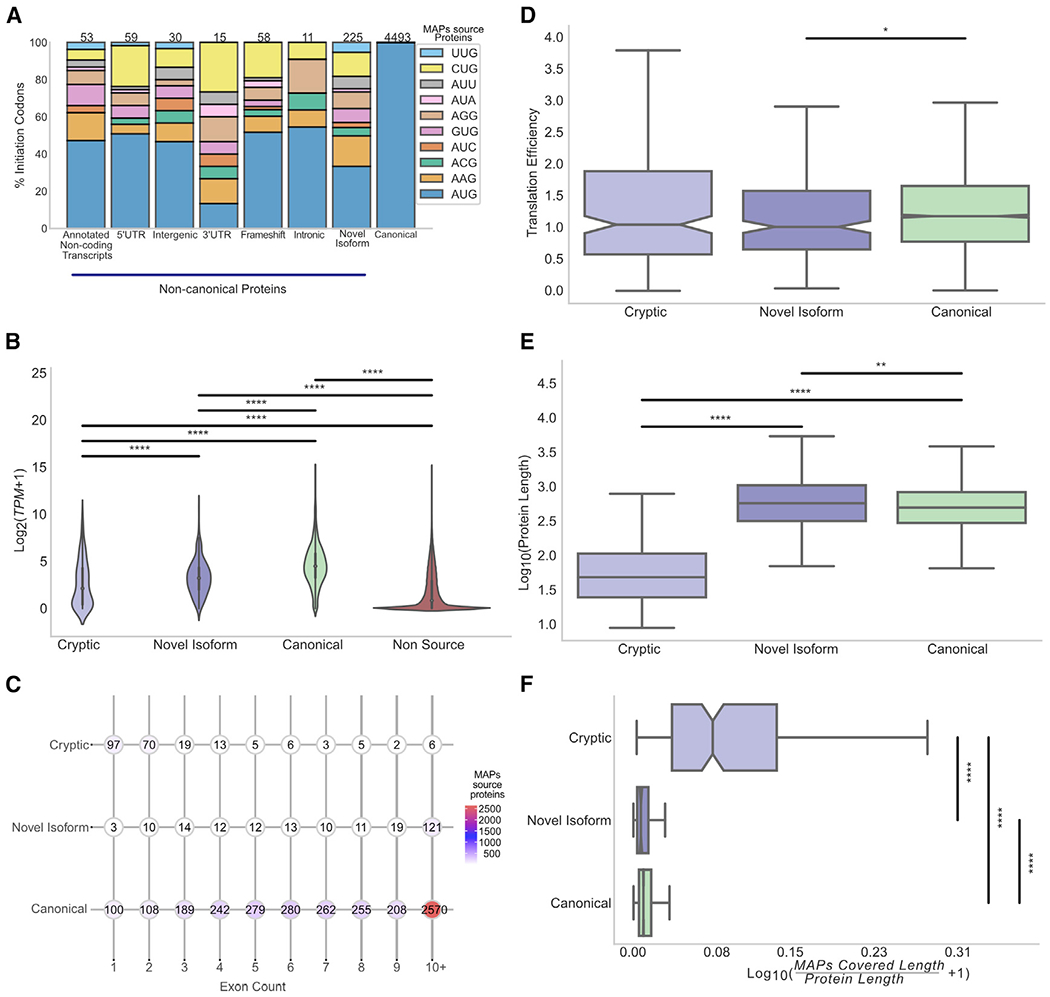
(A) More than half of the non-canonical MAP source proteins (60%) initiated at a near-cognate codon. Stacked bar plot shows the percentage of proteins deriving from AUG and near-cognate codons for canonical proteins and various subgroups of non-canonical MAP source proteins.
(B) Transcript expression level distribution of canonical (n = 4,493), novel isoforms (n = 225), and cryptic (n = 226) MAP source transcripts versus non-source proteins (n = 647,686). ****p < 0.0001; Kolmogorov-Smirnov test.
(C) Dot charts displaying the exons count for each category of MAP source proteins; each dot corresponds to the number of proteins bearing a given number of exons (median = 2 exons for cryptic, 11 exons for novel isoform and canonical proteins).
(D) Translation efficiency of MAP source proteins. Boxplots show the translation efficiency distribution for each category of MAP source proteins. *p < 0.05; two sided Mann-Whitney U test.
(E) Boxplots indicate the length distribution of MAP source proteins for each category: cryptic; novel isoform; and canonical. Median length in cryptic (49 amino acids), canonical (504 amino acids), and novel isoform (582 amino acids) is shown. **p < 0.01; ****p < 0.0001; two-sided Mann-Whitney U test.
(F) Cryptic proteins are proficient in generating MAPs. Boxplots show the ratio of the length covered by MAPs to the protein’s length in number of amino acids. ****p < 0.0001; two-sided Mann-Whitney U tests.
In line with previous reports (Bassani-Sternberg et al., 2015; Pearson et al., 2016), canonical MAPs derive from transcripts with higher expression than transcripts that do not generate MAPs (non-source transcripts; Figure 3B). Similarly, for cryptic MAPs and MAPs from novel isoforms, transcripts that generate MAPs are more abundant than non-source transcripts. Hence, for any genomic region, transcript levels positively correlated with MAP generation. Among MAP source transcripts, we found small but significant differences in abundance according to the following hierarchy: canonical proteins > novel isoforms > cryptic protein (median = 4.51 transcripts per million [TPM], 3.24 TPM, and 2.15 TPM, respectively; note that each cell has 500,000 mRNAs) (Figure 3B). Cryptic transcripts contained significantly fewer exons, with a median of 2 exons compared to a median of 11 exons for transcripts coding for canonical proteins and novel isoforms (Figure 3C). Indeed, 73% of cryptic MAP source proteins contained only one or two exons.
Next, using Ribo-seq and RNA-seq data, we compared the translation efficiency of each MAP source transcript (translation events per mRNA) (Figure 3D). We observed that the translation efficiency of novel isoforms was only marginally inferior to that of canonical proteins, which in turn was similar to cryptic MAP source proteins. Among MAP source cryptic proteins, those deriving from an intergenic region showed the highest translation efficiency (Figure S2D). We further examined how the subcellular localization of MAP source proteins influences translation efficiency (see STAR methods). We compared the translation efficiency of MAP source proteins from 6 subcellular localizations: cytosol, membrane, nucleus, extracellular, mitochondrion and secretory pathway. As a negative control, we computed the translation efficiency of the canonical proteins non-source of MAPs (background), independently of their localization. Two points can be made from these analyses. First, the translation efficiency of canonical proteins generating no MAPs was lower than that of MAP source proteins from any localization, except for proteins located in the nucleus (Figures S2E and S2F). Second, proteins targeted to membranes or mitochondria were the most efficiently translated, followed by the secretory pathway and extracellular proteins.
Cryptic MAP source proteins had a mean length of only 49 amino acids compared to 504 and 582 residues for canonical proteins and novel isoforms, respectively (Figure 3E). For canonical proteins, the number of MAPs presented is related to protein length (Pearson et al., 2016). If this applies to all translation products, the short size of cryptic proteins should significantly decrease their chance of generating MAPs. In accordance with this, we validated that the number of identified MAPs increased linearly with source protein length (Figure S3A). Then, for each protein, we calculated the number of amino acids detected in the immunopeptidome versus the number of amino acids in the source protein. This ratio was much higher for cryptic proteins versus canonical proteins (~5-fold) and novel isoforms (~7-fold) (Figure 3F). We conclude that, relative to canonical transcripts, cryptic transcripts are shorter, less abundant, and translated at similar efficiency but are ~5-fold more efficient at generating MAPs.
The global landscape of cryptic proteins in the wholecell proteome
MS protein detection is proportional to protein abundance and length (Lubec and Afjehi-Sadat, 2007). To enhance cryptic protein detection in whole-cell extracts of the three DLBCL lines, we performed tandem analyses on fractions separated by molecular weight before trypsin digestion. Low-molecular-weight fractions (≤10 kDa) contained proteins bearing less than ~100 amino acids, whereas high molecular weight (≤10 kDa) contained longer proteins. We used PEAKs software to identify tryptic peptides of 7 and 25 amino acids and used the same strategy to assign the most likely source protein as for MAPs (FDR ≤ 1%) (Figure 4A).
Figure 4. Features of canonical and cryptic proteins detected in tryptic digests of whole-cell extracts.
(A) Schematic overview of the method used for whole-proteome analyses. Proteins were filtered according to their molecular weight to maximize the detection of short proteins, which are a rich source of cryptic proteins.
(B–D) Displayed data refer to 3 cell lines, 1 replicate each.
(B) Proportion of each protein category detected in low-versus high-molecular-weight fractions. Low-weight fraction is enriched in cryptic proteins, whereas high-weight fraction is enriched in canonical proteins.
(C) Genomic origin of cryptic proteins identified in the whole-proteome extracts.
(D) Boxplots indicating the length distribution of proteins for each category: cryptic; novel isoform; and canonical. Median length of cryptic (67 amino acids), canonical (387 amino acids), and novel isoform (372 amino acids) proteins is shown. *p < 0.05; ****p < 0.0001; two-sided Mann–Whitney U test.
(E) Stacked bar plot showing the percentage of proteins deriving from AUG and near-cognate codons for canonical proteins along with each subgroup of the non-canonical proteins from whole-proteome extracts.
(F) RNA expression level of transcripts coding for detected (n = 11,968) proteins compared to transcripts coding for undetected proteins (n = 640,662). ****p < 0.0001; Kolmogorov-Smirnov test.
(G) Boxplots showing the translation efficiency of various categories of proteins identified from whole-proteome extracts. *p < 0.05; **p < 0.01; two-sided Mann-Whitney U test.
We identified 1,505 low- and 10,463 high-molecular-weight proteins. The vast majority of low-molecular-weight proteins were cryptic (81%), with canonical proteins (91%) dominating the high-molecular-weight fraction (Figure 4B). Interestingly, intergenic regions are the principal source of high-molecular-weight cryptic proteins (33%), although most (55%) low-weight cryptic proteins derive from protein-coding transcripts, with significant enrichment for 5′ UTR-encoded proteins(34%; Figure 4C). Similar to MAP source proteins (Figure 3E), cryptic proteins identified in whole-proteome analyses were significantly shorter than canonical proteins and novel isoforms (median size of 387 amino acids for canonical proteins; 372 for novel isoforms versus 67 for cryptic proteins) (Figure 4D).
Cryptic proteins from whole-proteome extracts initiated less frequently at an AUG codon (23%; Figure 4E) than cryptic proteins detected in the immunopeptidome (40%; Figure 3A). Indeed, CUG (21%) was nearly as likely as AUG (23%) to initiate translation of cryptic proteome proteins. As with the immunopeptidome, transcripts coding MS-identified proteins were more abundant than transcripts coding for undetected proteins (Figure 4F). And, as with MAP source proteins, the translation efficiency of cryptic proteins detected in the whole proteome was similar to that of canonical proteins and slightly superior to that of novel isoforms (Figure 4G).
Disorder and instability of cryptic MAP source proteins
Even for conventional proteins, the whole-cell proteome only partially overlaps with the immunopeptidome (Granados et al., 2015; Pearson et al., 2016; Shraibman et al., 2019; Yewdell et al., 2019). Thus, we detected only 52% (2,351 out of 4,493) of conventional MAP source proteins in whole proteomes (Figure 5A). Notably, this ratio decreased to 6% (14/226) in the case of cryptic MAP source proteins: why such a dramatic discrepancy?
Figure 5. Cryptic proteins are disordered and unstable.
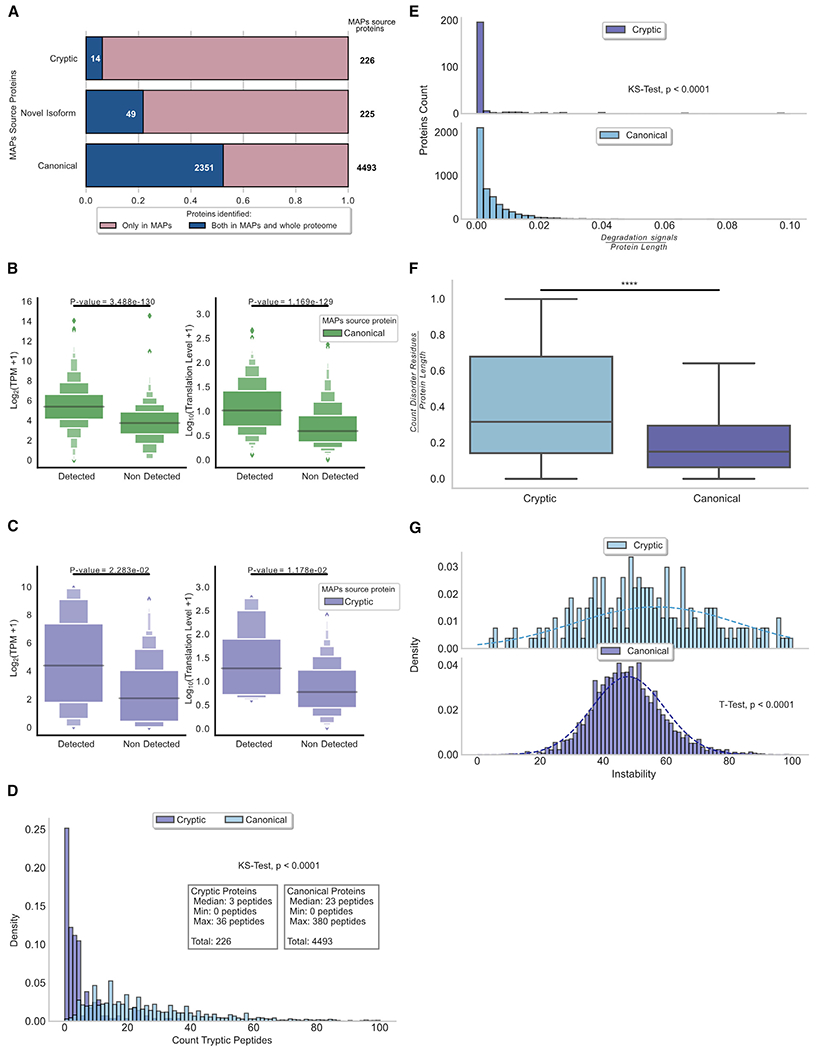
(A) MAP source proteins are underrepresented in the whole-proteome analysis. Bar plot depicting the total number of proteins identified in the immunopeptidome (pink bars) and the overlap with proteins detected in the whole proteome (blue bars) is shown. Cryptic proteins showed a low overlap (6%) compared to novel isoforms (21%) and canonical proteins (52%).
(B) Transcription- and translation-level abundance of canonical MAP source proteins. Left panel: box plots show the transcription expression level of transcripts at the origin of canonical MAP source proteins detected and non-detected in the whole-proteome analysis. Right panel: box plots show the translation level of transcripts at the origin of canonical MAP source proteins detected and non-detected in the whole-cell proteome analysis. Statistical difference was assessed by Mann-Whitney U test.
(C) Transcription- and translation-level abundance of cryptic MAP source proteins. Left panel: box plots show the transcription expression level of transcripts at the origin of cryptic MAP source proteins detected and non-detected in the whole-proteome analysis. Right panel: box plots show the translation level of transcripts at the origin of cryptic MAP source proteins detected and non-detected in the whole-cell proteome analysis. Statistical difference was assessed by Mann-Whitney U test.
(D) Distribution of the number of predicted tryptic peptides per MAP source protein (median = 3 peptides for cryptic proteins and 23 peptides for canonical proteins). Statistical significance was assessed by Kolmogorov-Smirnov test.
(E) Cryptic proteins present fewer degradation signals compared to canonical proteins. Histogram plots in the top and bottom panels depict the number of predicted degradation signal (canonical ubiquitination sites, D box, and KEN box motifs) relative to the protein size for cryptic and canonical proteins, respectively. Statistical significance was assessed by Kolmogorov-Smirnov test.
(F) Cryptic proteins contain significantly more disordered residues than canonical proteins. Boxplots depicting the number of disordered residues predicted per protein relative to the protein’s length for cryptic and canonical proteins source of MAPs are shown. ****p < 0.0001; two-sided Wilcoxon rank-sum test.
(G) Cryptic proteins are less stable in vivo. Histogram plot showing the distribution of the instability index predicted for cryptic and canonical proteins. Statistical significance was assessed by Student’s t test.
First, consistent with the idea that MS favors detecting abundant proteins, the low expression of cryptic MAP source transcripts (relative to canonical MAP source transcripts) hampers their detection in the whole proteome (Figure 3B). Accordingly, transcript expression correlates with detecting MAP source proteins in the whole-cell proteome (Figures 5B and 5C, left panels). Leveraging our Ribo-seq data, we determined that translation level (ribosome occupancy) was higher in proteome-detected versus non-detected MAP source proteins, confirming that protein abundance impacts MS detection (Figures 5B and 5C, right panels). Second, detecting cryptic proteins in whole proteomes is hampered by their brevity, which alone results in zero to few (median = 3) predicted tryptic peptides per protein compared to 23 for conventional proteins (Figure 5D). Third, we considered the contribution of rapid degradation. Proteasomal digestion is the main route for protein degradation and MAP generation (Myers et al., 2018). Proteasomes initiate degradation at disordered substrate regions; most, but not all, substrates need to be ubiquitylated, particularly for MAP generation (Wei et al., 2017). We found a lower density of degradation signals (ubiquitination sites, D box, and KEN box motifs) (Liu et al., 2012; Mészáros et al., 2018; Radivojac et al., 2010) in cryptic relative to canonical proteins (Figure 5E). However, protein disorder analysis revealed that disordered regions occurred at twice the frequency in cryptic (31% of amino acids) versus conventional MAP source proteins (15% of amino acids) (Figure 5F). Also, the instability index (Guruprasad et al., 1990) predicts the decreased stability of cryptic proteins (Figure 5G).
Finally, we analyzed the correlation between ribosome stalling in up-, mid-, and downstream coding regions of MAP source transcripts and their detection in the proteome (Figure S3B). We found a small but significant decrease in ribosome coverage in the upstream coding region of proteome-detected proteins, consistent with diminished stalling relative to non-detected proteins. These data collectively indicate that MAP source cryptic proteins contain zero to very few tryptic peptides, are low-abundance proteins generated with fewer stalling events, and are highly disordered and unstable. These factors likely account for their overrepresentation in the immunopeptidome and underrepresentation in the proteome.
Features of non-canonical proteins
We next evaluated several features of non-canonical proteins identified in the immunopeptidome and/or the whole proteome of the DLBCL lines (Figure S4A). Non-canonical proteins demonstrate little bias in chromosomal origin (Figure 6A). However, chromosome-16-derived proteins exhibited an increased proportion of novel isoforms. This may result from cytogenetic abnormalities involving chromosome 16 in DLBCL (Vick et al., 2018). Notably, an unexpectedly high proportion of MAP source proteins derived from chromosome 12 (Figure S4B), consistent with the shared DLBCL abnormalities (e.g., polysomy) involving chromosome 12 (Chan et al., 1998; Younes et al., 1994). Overall, these findings indicate that, although all chromosomes generate numerous non-canonical proteins, their expression can be enhanced by cancer-associated genetic alterations.
Figure 6. Chromosomal origin and function of non-canonical proteins.
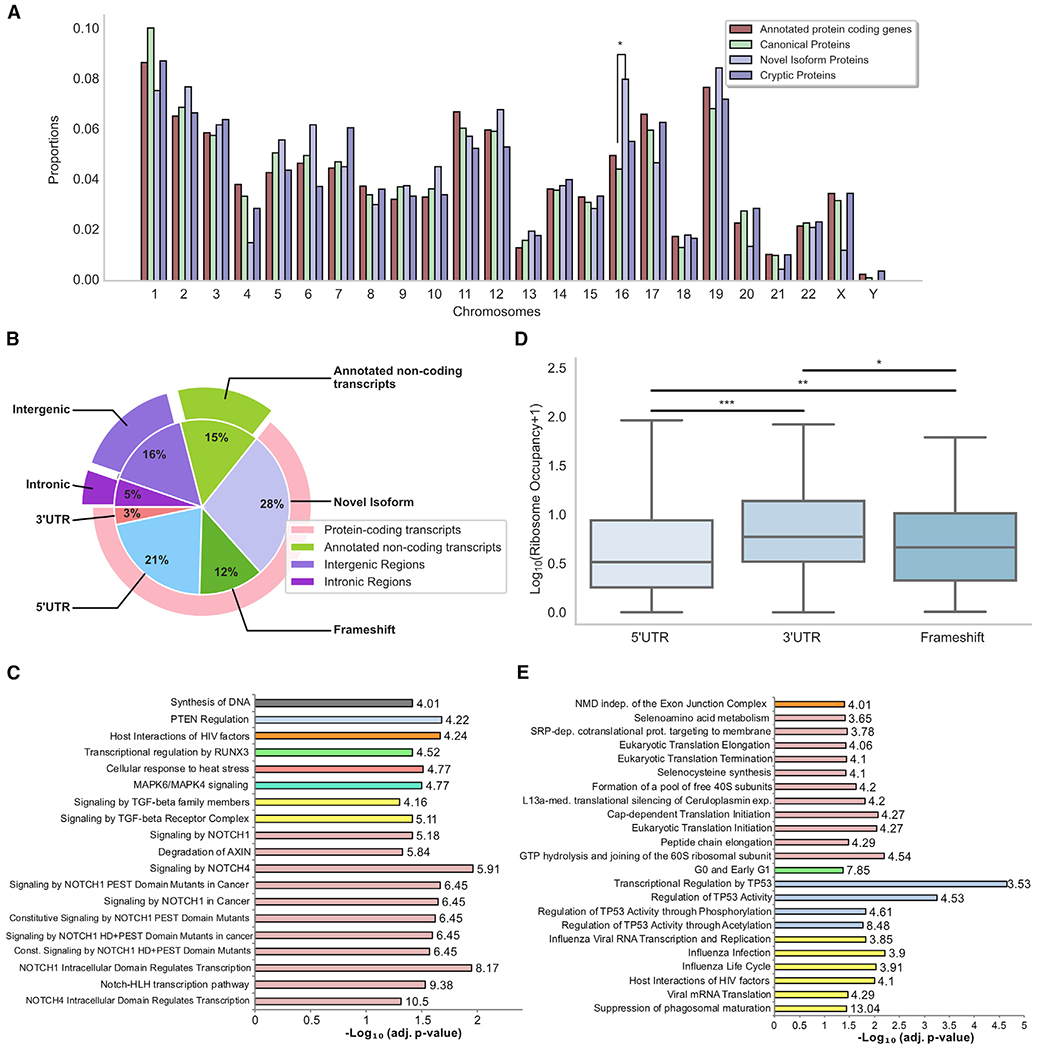
(A) Non-canonical identified proteins derive from all chromosomes. Bar graph shows the chromosomal origin of each category of proteins. *p < 0.05; two-sided Fisher’s exact test.
(B) Genomic origins of the whole set of non-canonical identified proteins. Pie chart shows the percentages of non-canonical proteins derived from different genomic regions.
(C) Novel isoforms derive from genes that regulate pathways commonly perturbed in DLBCL and other cancers. Reactome pathways enriched in the list of genes corresponding to proteins for which a novel isoform was identified (n = 403 unique genes). Panther overrepresentation test; numbers in the bargraph correspond to fold enrichment of each pathway. Fisher’s exact test with FDR correction; adj. p < 0.05; fold enrichment >4.
(D) 5′ UTR cryptic proteins hinder the translation of main ORFs. Ribosome occupancy of the canonical coding sequence (CDS) of genes producing a cryptic protein via frameshift, 5′ UTR, or 3′ UTR translation is shown. *p < 0.05; **p < 0.01; ***p < 0.001; two-sided Mann-Whitney U test.
(E) 5′ UTR cryptic proteins regulate the translation of canonical proteins involved in transcription, translation, and antiviral responses (n = 501 unique genes). Panther overrepresentation test; numbers on the bargraph correspond to fold enrichment of each pathway. Fisher’sexacttest with FDR correction; adj. p < 0.05; fold enrichment >3.
Novel isoforms constitute a major fraction of unconventional proteins (28%) (Figures 6B and S4C). Alternative start codon initiation resulting in alternative protein isoforms translation is a common event in cancer (Xu and Ruggero, 2020). It affects the balance between multiple forms of a protein, which can have distinct and even opposite functions. We interrogated our dataset to identify signaling pathways enriched among the canonical genes generating these novel isoforms (n = 403) (Figure 6C). Interestingly, these genes were mostly involved in signaling pathways often deregulated in cancer, including AXIN, mitogen-activated protein kinase 4 (MAPK4), MAPK6, NOTCH1, NOTCH4, PTEN, RUNX3, and transforming growth factor β (TGF-β). NOTCH signaling, which is commonly perturbed in DLBCL and other cancers (Aster et al., 2017; Karube et al., 2018), was the most overrepresented in our analysis.
5′ UTRs represented the second most important cryptic protein source (21%;) (Figures 6B and S4C). Because upstream ORFs can modulate translation of main-ORFs (Young and Wek, 2016), we examined how canonical protein translation is altered by upstream 5′ UTR translation of a cryptic protein. We found that the canonical ORF of transcripts encoding 5′ UTR cryptic proteins had significantly lower ribosome occupancy than those encoding 3′ UTR and frameshift proteins (Figure 6D). This observation suggests that translating cryptic 5′ UTR proteins hijacks ribosomes to hamper translation of the corresponding main ORF.
Finally, to evaluate the potential impactof 5′ UTR cryptic proteins on cell function, we analyzed the reactome of the genes encoding these proteins (n = 501). We found a conspicuous enrichment in genes involved in transcription, translation, and antiviral responses (Figure 6E), consistent with a functional role for 5′ UTR cryptic proteins in regulating various cellular processes.
DISCUSSION
We have developed a proteogenomic method to identify unannotated proteins whose peptides are detected in the whole-cell proteome and immunopeptidome. Our approach, which integrates RNA-seq, Ribo-seq, and MS data, identified 2,503 new non-canonical human proteins expressed from all chromosomes: 1,842 cryptic proteins (72%) and 661 novel isoforms (28%) (Figure 6B). As expected, a majority (85%) of translation events detected by Ribo-seq was not identified by MS (Tables S2 and S3). This was remarkably conspicuous for non-canonical proteins, as only 0.44% could be found by MS. Two facts can explain this. First, Ribo-seq-built databases must, to some extent, overestimate real translation products, especially non-canonical ones, due to imperfect sequence matching with genomic information. Second, and more importantly, MS captures only a small fraction of what is translated. Despite these caveats, our findings clearly demonstrate that ribosome profiling is a powerful tool to detect the translation of non-canonical transcripts, which are generally absent from MS databases because of their unannotated status.
Cryptic proteins are particularly interesting: 83% derived from ostensibly non-coding ORFs and 17% from alternative frame translation of canonical ORFs. Cryptic transcripts were slightly less abundant than canonical transcripts. Integrating Ribo-seq and RNA-seq data reveals that cryptic and canonical proteins are, surprisingly, translated with similar efficiency. Extending previous findings (Chong et al., 2020; Laumont et al., 2016, 2018; Ouspenskaia et al., 2020), cryptic proteins are coded by relatively short ORFs and frequently initiate with non-AUG near-cognate codons (which, except for CUG, are typically decoded as Met; Starck et al., 2012; Na et al., 2018). Cryptic proteins were far more likely than canonical proteins to be only detected in the immunopeptidome.
Critically, cryptic transcripts generated MAPs ~5-fold more efficiently than canonical transcripts (Figure 3F). The most plausible explanation is that cryptic proteins are rapidly degraded because they are disordered and unstable (Figures 5F and 5G), rendering them prototypical DRiPs. As a corollary, the global proteome, mainly consisting of stable proteins, has limited overlap with the immunopeptidome. Remarkably, only 6% of cryptic MAP source proteins were detected in tryptic digests of wholecell extracts (Figure 5A). Such selective antigenicity is a critical feature of class I antigen presentation, which cannot function as a mirror of the proteome, which is dominated by a relatively small number of gene products (just 250 housekeeping proteins comprising ~50% of the proteome). This could also be explained by the few predicted tryptic sites in cryptic proteins (Figure 5D), consistent with a negative bias in detecting short proteins due to the standard enzyme used in proteomic analysis.
Stable isotope labeling with amino acids in cell culture (SILAC) mass spectrometry kinetic studies in tumor cell lines also point to a limited correlation between the proteome and immunopeptidome and suggest a substantial contribution of DRiPs/SLiPs as a source of MAPs (Bourdetsky et al., 2014; Milner et al., 2006). Most short-lived MAP source proteins identified by SILAC MS kinetic analyses are subunits of multiprotein complexes. These likely become SLiPs due to stoichiometric subunits imbalances or other difficulties in becoming incorporated into their intended complex. A large fraction of MAPs identified in the present study would be missed entirely in such SILAC MS kinetic analyses due to the method-inherent shortcomings (e.g., search database limited by annotated proteins; failure to detect [tryptic] peptide in multiple time points and samples in SILAC MS analysis to determine MAP source; Bourdetsky et al., 2014; Milner et al., 2006). This would bias the identification of DRiP-derived MAPs to longer and more-abundant source proteins.
Cryptic proteins detected in the cell proteome were longer (median of 67 amino acids) than those found in the immunopeptidome (median of 49 amino acids) (Figures 3E and 4D), likely a reflection of the likelihood that longer peptides can achieve a more-stable structure. Cryptic proteins detected in the immunopeptidome were initiated more frequently at an AUG codon than those found in the whole proteome (Figures 3A and 4E). This suggests that a subset of proteins initiated in AUG codons may have preferred access to the MHC-I presentation pathway, extending findings that CUG and other near-cognate-based initiation favor peptide generation under stress conditions (Starck and Shastri, 2016).
Whereas intergenic regions are the primary source of longer cryptic proteins found in the whole proteome, translation of 5′ UTRs was particularly common for shorter cryptic proteins found both in the immunopeptidome and the whole-cell proteome. Notably, translation of 5′ UTR cryptic proteins correlated with decreased ribosome occupancy of the main ORF, which was not seen with cryptic proteins derived from other regions in protein-coding transcripts (3′ UTR and frameshift) (Figure 6D). The main ORFs whose translation was hindered by 5′ UTR cryptic proteins mainly regulate transcription, translation, and antiviral responses (Figure 6E). Translation of 5′ UTRs is known to negatively regulate translation of downstream ORF in cell stress (Jiang et al., 2017; Reverendo et al., 2019; Young and Wek, 2016). Our findings suggest that this extends to cryptic proteins. Additional studies are needed to generalize these findings from DLBCLs to other cancer cells and normal cells.
The 661 novel isoforms reported herein further illustrate the polycistronic nature of human genes (Brunet et al., 2018). Arguably, their most intriguing feature was that they showed a strong enrichment for signaling pathways deregulated in cancer, NOTCH being the most striking example (Figure 6C). Chromosome 16 was a particularly rich source of novel isoforms (Figure 6A). Accordingly, in DLBCLs, this chromosome commonly presents aberrations (e.g., duplications and trisomies), whose frequency increases with patient age (Vick et al., 2018). We also observed that chromosome 12, which is also commonly rearranged in DLBCLs, was a particularly rich source of cryptic MAPs. Together, these data suggest that underlying genomic aberrations may impact the non-canonical translation landscape by increasing the production of novel isoforms or cryptic proteins. How this affects the presentation of tumor-specific antigens that can be targeted for immunotherapy will be explored in further studies.
We detected only a small number of peptides from introns (135/7,045) (Figure S4A). Based on studies that peptides are efficiently derived from introns via translation of pre-spliced mRNA in the nucleus (Apcher et al., 2013; Martins et al., 2019), this is surprising, particularly given the fact that introns encode up to 10-fold more amino acids than exons (Francis and Wörheide, 2017). However, we note that, by performing Ribo-seq on cytoplasmic RNA, we may have missed a large pool of intron-encoded peptides translated in the nucleus.
Finally, it is worth considering the biological relevance of non-canonical translation of unstable proteins. This might result from the high entropy of cancer cells, which evolve to maximally proliferate at the organism’s cost, with little or no selection for the economical use of available resources. It is likely, however, that at least some of the gene products have functions, particularly if their degradation is conditionally regulated, for example, by the cell cycle or stress. A more-general function of this class of proteins would be to enhance tumor immunosurveillance. The cancer-specific nature of such translation is an obvious starting point for future studies.
STAR★METHODS
RESOURCE AVAILABILITY
Lead contact
Further information and requests for resources and reagents should be directed to and will be fulfilled by the Lead Contact, Claude Perreault (claude.perreault@umontreal.ca).
Materials availability
This study did not generate new unique reagents.
Data and code availability
The Python, bash scripts, and Jupyter notebooks generated during this study are available at GitHub, https://github.com/lemieux-lab/Ribo-db.
The accession number for MS raw data and associated databases reported in this paperis PRIDE: PXD020620.
The accession number for RNA-seq and ribosomal profiling raw sequencing data reported in this paper is NCBI SRA: PRJNA647736.
EXPERIMENTAL MODEL AND SUBJECT DETAILS
Cell lines
DLBCL lines HBL-1, DoHH2, and SU-DHL-4 bearing HLA A02:06, B51:01, C14:02; A01:01, B08:01, B44:02, C07:01, C07:04 and A02:01, A31:01, B15:01, C03:04, respectively, were cultured in complete medium consisting of Advanced RPMI medium (GIBCO) supplemented with 5% heat-inactivated fetal bovine serum (Seradigm), 1% Penicillin/Streptomycin (GIBCO), and Glutamax (GIBCO). Cells were grown in a humidified atmosphere at 37°C with 5% CO2 and routinely tested for mycoplasma contamination using Universal Mycoplasma Detection Kit (ATCC). The HLA genotype and sex of cell lines (Male: HBL-1, DoHH2, SU-DHL-4) were validated by RNA sequencing.
METHOD DETAILS
Ribosomal profiling, RNA-seq sample preparation, and sequencing
Ribosomal profiling was performed as previously described (McGlincy and Ingolia, 2017) with modifications as follows: DLBCL cell cultures were seeded at 2x10⁵ cells/ml in 50 mL of complete medium in duplicates for each cell line and condition. Enrichment for initiating ribosomes was done by treating the cell cultures with harringtonine (LKT Laboratories) at 5 μg/ml for 30 minutes at 37°C before harvesting. Thirty-six hours after seeding, the cells were pelleted by centrifugation (300 g, 5 min., RT), cell pellets were immediately put on ice and washed with ice-cold DPBS (GIBCO), centrifuged (300 g, 5 min., 4°C) and cell pellets flash-frozen in liquid nitrogen. Samples processing proceeded without delay until sucrose cushion purified ribosomes were resuspended in TRI. Reagent Solution (Ambion) and stored at −80°C. Cycloheximide was included only in lysis buffer at 100 mg/ml. RNA concentration in cell lysates was quantitated by Qubit RNA BR Assay Kit (Invitrogen) using Qubit 4 fluorometer. The lysates containing 30 μg of RNA were diluted to the final volume of 200 μl with polysome buffer and treated with 15 U of RNase I (10 U/μl, Lucigen) at room temperature (24°C) for 45 min on a tube rotator. The ribosomal RNA depletion was done in two steps: First, size-selected ribosome protected fragments were depleted by Ribo-Zero Gold rRNA Removal Kit (Human, Mouse, Rat) (Illumina). Second, circularized cDNA was depleted using biotinylated complementary oligonucleotides as previously described (Ingolia et al., 2012). Ribosomal profiling libraries were sequenced on Illumina HiSeq 4000 to achieve 350-400 million raw reads per sample (~100 million for harringtonine treated samples). Ribosome profiling footprint library quality was assessed using riboWaltz (Lauria et al., 2018) via trinucleotide codon periodicity plotting against annotated protein-coding ORFs. Ribosome profiling samples exhibiting clear trinucleotide periodicity were retained for subsequence ORF detection. RNaseq libraries were prepared from the same cell lysates as the ribosome profiling sequencing libraries. Five micrograms of RNA per sample lysate were diluted with nuclease-free water to the final volume of 40 μl, treated with DNase I (Zymo Research) at RT for 15 min, and diluted with sodium dodecyl sulfate solution to the final concentration of 1%. Total RNA was purified using RNA Clean & Concentrator-5 (Zymo Research). RNaseq libraries were prepared using TruSeq Stranded mRNA Library Prep kit (Illumina) and sequenced as PE 75 cycles on Illumina NextSeq 550 to high depth.
Quantification MHC-I molecules per cell
MHC-I’s absolute membrane density was evaluated on 3 DLBCL cell lines by indirect labeling with a purified anti-human HLA-ABC (clone W6/32) or a mouse IgG2a isotype control, using commercially available QIFIKIT (Dako) according to the manufacturer’s instructions.
Ribosome Profiling data pre-processing
Illumina adapters from the 3′ end of the Ribosome Profiling TIS and Elongation Sequencing Fragments (RPSF) were removed using fastx_clipper (http://hannonlab.cshl.edu/fastx_toolkit/). UMI detection and extraction were performed using UMI_tools (Smith et al., 2017). Next, only relevant RPSFs (i.e., reads with a length between 26 and 34 nucleotides) were retained for further human genomic coordinate mapping (reference genome version GRCh38.p10/hg38) using STAR v.2.6.1.d (Dobin et al., 2013). We ran STAR with default settings except for the following modified parameters:–outSAMtype BAM SortedByCoordinate,–alignEndsType End-ToEnd,–seedSearchStartLmax 15,–outFilterMismatchNoverLmax0.05,–outFilterMatchNmin 25. Finally, the BAM files were deduplicated using UMI_Tools.
RNA-sequencing data pre-processing
Illumina adapters from the 3′ end of the RNA-sequencing reads were removed using Trimmomatic version 0.35 and then mapped to the reference genome version GRCh38.p10/hg38 using STAR v.2.6.1.d (Dobin et al., 2013). We ran STAR with default settings except for the following modified parameters:–outSAMtype BAM SortedByCoordinate,–outFilterMismatchNoverLmax 0.05,–outFilter-MatchNmin 40.
Ribo-db approach: detection of active translation sequences
To generate a complete and noiseless sample-specific database suitable for MS searches, we translated in-silico the actively translated sequences (canonical and non-canonical ORF) assessed by combining Ribo and RNA-seq data as follows:
A) TIS calling: to detect sample-specific Translation Initiation Sites (TIS) from the aligned Ribo-seq TIS reads, we developed a probabilistic approach to estimate a confidence score to identify genomic positions of putative start codons.
To achieve this, we assumed that all annotated start codons aligning with Ribo-TIS reads were true start codons. From this, we estimate the probability of each position (pos) into each read length l = (26,…,34), to act as the first nucleotide of the ribosomal p-site, therefore, being the first nucleotide of a start codon (sc), as follows:
Let r = {reads being at first nt of a start codon | len = l, then pos = p}
Let R = {total reads being at first nt of a start codon|len = l};
whereP(sc | len = l, pos = p )is the probability of a sc at the read position pos in the read of length l = (26, …,34).
Then, we computed two heuristics to evaluate the certainty of the ribosomal P-site location into each read length l, and the relevance of the read-alignment regarding its multimapping.
The first heuristic H1(l) assigned a normalized weight to each read length (26-34 nucleotides), computed through the standard deviation of the read positions acting as start codons, as follows:
Let σ = {σl| stdev of read positions acting as start codons for l = (26,…,34)};
The second heuristic H2(Rr) assigned a weight to each Ribo-Tis read according to its rank (Rr) in which STAR has reported such alignments, as follows:
where maxR is the max number of hits reported by STAR (default = 10). Thus, a fragment that has been mapped several times will have a decreasing weight per alignment. For instance, a Ribo-Tis read that has three alignments in the genomes would have for R1 a weight equal to 1, R2 a weight equal to 0.89 and for R3 a weight equal to 0.78.
The combination of these three criteria allowed us to weight reads mapped to the genome for the identification of the start codons, using the following probability model:
where x is the genomic position of the first nucleotide of a candidate start codon and c is the event that indicates that the position x is a start codon sc.
Finally, to establish a threshold on P(pos|c) to retain only the start codons candidates with high confidence, we ranked the computed confidence results to plot a receiver operating characteristic curve (ROC curve). This curve was plotted using the known start codons as positives and any other start codon candidates as negatives. We computed the Euclidean distance to a perfect classifier (0,1) for each point on the curve and then reported the threshold corresponding to that point’s shortest distance. Thus, any start codon candidate whose computed confidence was above the threshold was considered a positive start codon position and was retained for further analysis.
B) Assembly of reads into transcripts: to capture the complete transcriptome, including both annotated and unannotated transcripts, we generated sample-specific transcriptomes assemblies from Ribo-seq elongation data collected from actively translating cells and RNA-Seq data. To this end, we used String Tie v1.3.6 (Pertea et al., 2015) guided by a reference annotation (Ensembl release 88) in RNA-seq and Ribosome Profiling Elongation BAM files.
C) Intersect: to detect the set of actively translated ORFs, we use the intersection function of the BEDTools (Quinlan and Hall, 2010) suite in the BED file with the genomic positions of the positives start codons as well as each of the gtf files reported by StringTie for transcriptome assemblies based on Ribosome profiling Elongation and RNA-seq. Therefore, start codons intersecting assembled transcripts (i.e., pairs (start codon, transcript)) were collected as they represent the active ORFs that will be translated in-silico. From this set of ORFs, we define canonical proteins as those translated from an annotated start codon coupled to the corresponding transcript (known couplings) according to genome version GRCh38.p10 (GENCODE version 26). We define non-canonical translation products as those originating from unknown couplings.
D) SNPs integration: to generate sample-specific transcription information, we integrated high-quality single-nucleotide polymorphisms (SNPs) identified from RNA-seq data to the assembled transcripts. Single-nucleotide variants were identified using freeBayes version 1.0.2-16-gd466dde (arXiv:1207.3907) and exported in a VCF, which was converted to an agnostic singlenucleotide polymorphism file format. The high-quality sample-specific SNPs identified (freeBayes quality > 20) were then inserted at their correct position into the intersected transcripts. When a given position was ambiguous, the integration was done through the corresponded IUPAC symbol.
E) In-silico translation: to generate a sample-specific database, each transcript (from RNA-seq or Ribosome Profile Elongation) was translated from the frame dictated by the coupled start codon until the first in-frame stop codon. Any protein sequence longer or equal to 8 AA was retained. Any protein sequence nested in a longer sequence was not added to the database. However, we keep track of all information about proteins (i.e., which proteins were added to the database and which were not), as we use it to assign the most likely origin of each peptide. To avoid combinatorial explosion, we translated the transcripts containing the IUPAC symbols, the complete protein sequence once, and translated short sequences around the locations of the IUPAC symbols (20 nucleotides in the flanking regions of the SNPs).
We used Ribo-seq data from translation initiation site (TIS), elongation and RNA-seq data from three human diffuse large B cell lymphomas (DLBCL), HBL-1, DoHH2, and SU-DHL-4 to generate sample-specific databases using the Ribo-db approach. These databases were used to perform mass spectrometry analysis of the immunopeptidome and the whole proteome. The number of proteins identified in these analyses is shown in Table S2. The percentage of proteins detected by MS among the proteins identified by Ribo-seq is shown in Table S3.
Immunopeptidome sample preparation
Cells for immunopeptidome analysis were grown and harvested the same way and in parallel with ribosome profiling cell cultures. The cells were counted during the washing step with ice-cold DPBS, and aliquots of 200 million cells were centrifuged and pellets flash-frozen in liquid nitrogen, stored at −80°C.
Mass spectrometry analysis: immunoprecipitation and sequencing by LC-MS/MS
For MHC-I peptides isolation, we performed immunoprecipitation on two replicates per cell line using W6/32 antibody (BioXCell, 1mg per 10E8 cells) as previously described (Lanoixet al., 2018). Replicates were composed of 2x10⁸ cells for HBL-1 and 4x10⁸ cells for SU-DHL-4 and DoHH2. Dried peptide extracts were resuspended in 4% formic acid and loaded on a homemade C18 analytical column (15 cm x 150 μm i.d. packed with C18 Jupiter Phenomenex of particle size 5 μmn and pore size 300 Å) with a 56-min gradient (DoHH2 and SU-DHL-4) or 106-minute gradient (HBL-1) from 0% to 30% ACN (0.2% formic acid) and a 600 nL/min flow rate on a nEasyLC II system. Samples were analyzed with a Q-Exactive HF mass spectrometer (Thermo Fisher Scientific) in positive ion mode with Nanospray 2 source at 1.6 kV. Each full MS spectrum, acquired with a 60,000 resolution was followed by 20 MS/MS spectra, where the most abundant multiply charged ions were selected for MS/MS sequencing with a resolution of 30,000, an automatic gain control target of 2x10⁴, an injection time of 800 ms and collisional energy of 25%.
MAP identification
MAPs were eluted from three DLBCL cell lines and analyzed by liquid chromatography-MS/M.S. (LC-MS/MS). MS/MS spectra were searched against sample-specific customized databases using Peaks X (Bioinformatics Solution Inc.). For peptide identification, tolerance was set at 10 ppm and 0.01 Da for precursor and fragment ions, respectively. The occurrence of oxidation (M) and deamidation (NQ) was considered as variable post-translational modifications.
Following peptide identification, a list of unique peptides was obtained for each sample. Binding affinities to the sample’s HLA alleles were predicted with NetMHCpan 4.0 (Jurtz et al., 2017). Only peptides with a length between 8 and 11 amino-acid and a NetMHC percentile rank ≤ 2% were retained for further annotation. Finally, a false discovery rate (FDR) of 1% was applied on the remaining peptide scores, corresponding to sample-specific FDRs in the range of 1.4 to 2,9% if applied on total PSMs (DoHH2 = 1.6%, SU-DHL-4 = 2.9%, HBL-1 = 1.4%). These filtering steps were made with the use of MAPDP (Courcelles et al., 2020). For each identified peptide, we interrogated all protein sequences to identify those that could be at the source of the peptide. We sequentially applied the following rules to assign to the peptide the most likely source protein based on (i) the highest starting codon confidence score, (ii) the presence of an optimal (GCC[R]CCstartG[V]) or strong ([R]NNstartG[V]) Kozak motif (Kozak, 1987) around the start codon, (iii) the level of expression of the source transcript through the StringTie computed TPM measurements.
Comet v2019.01.5, a different MS search engine, was used to perform PEAKs re-identification. The raw files were converted to mzXML format with the MsConvert tool of ProteoWizard and searched against the relevant sample-specific customized databases. Comet was used with the same parameters as for PEAKS. Following peptide identification, a list of unique peptides was obtained for each sample, and a false discovery rate (FDR) of 1% was applied to the peptide scores. All canonical and non-canonical MAPs identified by PEAKS for each sample were queried in the peptide list, and only perfect matches were considered successful reidentifications.
To ensure that our cryptic peptides did not correspond to improperly assigned post-translationally modified canonical peptides, PEAKS searches were performed using the standard reference protein database (Ensembl GRCh38.88 annotations), including the six most frequent post-translational modifications reported for HLA class-I associated peptides (Kote et al., 2020; Mommen et al., 2014). In addition to oxidation (M) and deamidation (NQ), we searched for peptides bearing either phosphorylation, cysteinylation, N-cyclisation (pyroQ), or N-terminal acetylation. Out of the 243 spectrum IDs assigned to cryptic peptides in our study, only four were re-assigned to a canonical sequence harboring a post-translational modification. Hence post-translational modifications might be a confounding factor for at most 1.6% of cryptic peptides.
Retention time prediction and relative mass error
As validation criteria of the MAPs identification robustness, we assessed the Pearson’s correlation between the retention time observed and the predicted retention time for each MAPs category (canonical and non-canonical). Peptide retention times were predicted using DeepLC 0.1.14 (Bouwmeester et al., 2020), with default parameters. The model was calibrated using retention time of 250 peptides (top 10 PEAKS scoring peptides from 25 equal-sized retention time bins). Also, we evaluated the relative mass error for each MAP and compared the distributions for the two MAPs category (canonical and non-canonical). Peptide relative mass error is presented in parts per million mass errors (ppm) unit and was assessed through the MAPDP platform (Courcelles et al., 2020).
Composite DB: Ribo-db + PRICE
To validate the relevance of the Ribo-db approach, we ran the PRICE v.1.0.3 method (Erhard et al., 2018) on the BAM files containing mapped reads of ribosome Profiling TIS and Elongation of each cell line with default parameters besides the -novelTranscripts parameter. The predicted ORFs were translated following the same rules as for Ribo-db (i.e., SNP integration and in-silico translation) and were added to the sample-specific Ribo-db database. Next, for each cell line, MS/MS spectra were searched against each sample composite database. The lists of unique identifications obtained from PEAKS were filtered based on 1) length between 8 and 11 amino acids, 2) percentile rank ≤ 2% for at least one on the relevant MHC-I molecules as predicted by NetMHCpan 4.0,3) FDR ≤ 1% estimation. Each sample-specific database (i.e., Ribo-db and PRICE-db) was independently queried for each peptide identified to count the number of unique and shared peptides found in the databases.
Biotype screening
Non-canonical proteins were designated as a function of their transcript genomic location: 5′ or 3′ UTR proteins are in 5′/3′ UTR or overlapping CDS and 5′/3′UTR; frameshift proteins are in coding transcripts but out-of-frame of canonical translations; intronic proteins are in intronic regions or in exon-intron junction; annotated non-coding transcripts proteins are in transcripts annotated as pseudogenes, non-coding RNA and processed transcripts; intergenic proteins are in novel transcripts. We set out to determine the category associated with each non-canonical protein through two validation steps. First, as we used StringTie in a reference-guided manner, we used the reference_transcript (field returned by StringTie) of the transcript from which the protein originated. Therefore, if the non-canonical protein derived from a protein-coding transcript, depending on the location of the protein within the transcript relative to the canonical protein, the non-canonical protein was assigned to the categories: ‘5′UTR’ and ‘3′UTR’, ‘Novel Isoform’ (proteins that share the same reading frame of the canonical protein but originate from an alternative starting codon), ‘Frameshift’ (proteins in a different reading frame than the canonical one), or’Intronic’ (proteins derived from transcripts containing intronic regions of a canonical protein). If the non-canonical protein derived from an annotated non-coding transcript, then it was directly assigned to the category of ‘annotated non-coding transcript’. Finally, non-canonical proteins whose genomic location was not part of any annotated transcript were assigned to the Intergenic category. The second step was designed to find a consensus category for each protein. Since we knew that some assembled transcripts were not associated with a reference_transcript, we chose to interrogate the annotations (Ensembl gtf file) to find all possible categories associated with the protein’s location. Therefore, we had possibly associated categories for each protein, and we assigned to the protein the most represented category.
Translation efficiency and ribosome occupancy
The translational efficiency of each MAPs source protein was calculated as the ratio between translation (derived from counts of ribosome profiling reads) over transcription (derived from RNA-Seq reads). These measurements were computed as described by Ingolia (Ingolia et al., 2011). First, the ribosome occupancy (translation level) was computed as the number of Ribosome Profiling Elongation fragments aligned to the coding protein sequence divided by the protein sequence length. Second, such measurements were normalized by dividing the total number of Ribosome Profiling Elongation fragments aligned to any coding transcript sequence. Finally, as the same measurements were computed for RNA-seq reads, a gene’s translation efficiency was calculated as the normalized Ribosome Profiling Elongation ratio to the normalized RNA-seq.
Translation efficiency analysis of canonical protein location
We extracted information on the canonical protein subcellular compartments from ComPPI db (Veres et al., 2015), which provides confidence scores (0-1) for subcellular protein localization. For each canonical MAP source protein, we considered all its major locations, i.e., those having confidence scores above 0.8. We used the subcellular compartment with the highest score for proteins without a localization score above this threshold. Moreover, for the few proteins underrepresented in the database, we assessed their more likely localization manually in Uniprot. Therefore, we compared the translation efficiency of MAP source proteins from 6 subcellular localizations: cytosol, membrane, nucleus, extracellular, mitochondrion, secretory pathway, and we used as a negative control, the translation efficiency of the canonical proteins non-source of MAPs (background).
Stalling ribosomes
We examined the ribosome profiling elongation coverage of each transcript source of MAPs proteins and compared it to the coverage of transcripts non-source of MAPs (we chose proteins uniquely detected in the whole proteome as non-source of MAPs). We defined the upstream and downstream of a transcript as the first and last 33% of the transcript’s length (33% up and the last 33% down). The 34% of the length of the transcript at the middle was defined as Midstream. We assessed for each nucleotide of the transcript the number of ribosome profiling elongation reads and then computed for each whole transcript its median coverage. Next, we calculated the median at the Upstream, Midstream, and Downstream sections of the transcript to compute the fold change relative to the whole transcript’s median coverage.
Whole proteome analysis
Protein pellets were resuspended in 50 mM ammonium bicarbonate and separated with an Amicon Ultra-15 10K centrifugal filter device. Proteins staying on the filter were resuspended in 50mM ammonium bicarbonate. Ten mM TCEP [Tris(2-carboxyethyl) phosphine hydrochloride Thermo Fisher Scientific] was added to the samples, and samples were vortexed for 1 h at 37°C. Chloroacetamide (Sigma-Aldrich) was added for alkylation to a final concentration of 55 mM. Samples were vortexed for another hour at 37°C. One microgram of trypsin was added, and digestion was performed for 8 h at 37°C. Samples were dried and solubilized in 5% ACN-0.2% formic acid (FA). Peptides were separated on a homemade reversed-phase column (150-μm i.d. by 200 mm) with a 216-min gradient from 10 to 30% ACN-0.2% FA and a 600-nl/min flow rate on an Easy nLC-1000 connected to an Orbitrap Fusion (Thermo Fisher Scientific, San Jose, CA). Each full MS spectrum acquired at a resolution of 120,000 was followed by tandem-MS (MS-MS) spectra acquisition on the most abundant multiply charged precursor ions for a maximum of 3 s. Tandem-MS experiments were performed using collision-induced dissociation (CID) at a collision energy of 30%. The data were processed using PEAKS X (Bioinformatics Solutions, Waterloo, ON) and the sample-specific databases. Afalse discovery rate (FDR) of 1% was applied to the peptide scores. Mass tolerances on precursor and fragment ions were 10 ppm and 0.3 Da, respectively. Fixed modification was carbamidomethyl (C). Selected variable posttranslational modifications were oxidation (M), deamidation (NQ), phosphorylation (STY), acetylation (N-ter). To assign protein origin of tryptic peptides, we used the same rules as for immunopeptidomics experiences. For each identified peptide, we interrogated all protein sequences to identify those that could be at the source of the tryptic peptide. We sequentially applied the following rules to assign to the peptide the most likely protein origin based on (i) the highest starting codon confidence score, (ii) the presence of an optimal (GCC[R]CCstartG[V]) or strong ([R]NNstartG[V]) Kozak motif (Kozak, 1987) around the start codon, (iii) the level of expression of the source transcript through the StringTie computed TPM measurements.
Theoretical trypsin digestion, UB sites, disordered regions, and instability index prediction
We counted the theoretical number of tryptic peptides generated after in-silico digestion and preserved those with a length ranging between 7 and 25 aa for each cryptic and canonical protein. Degradation signals were predicted based on i) GPS-ARM version 1.0 (Liu et al., 2012) for D -box and KEN -box motifs, and ii) UbPred (Radivojac et al., 2010) for prediction of canonical ubiquitination sites with high confidence (≥0.84). To identify Intrinsically Disordered Protein Regions, we used the biophysics-based approach IUPred2 (Mészáros et al., 2018), with a disorder value cut-off set at 0.5. The instability index of each protein, which predicts protein stability based on the order and frequency of certain dipeptides, was computed using the function ProteinAnalysis from the module Prot-Param of the Biopython module SeqUtils. This function implements the method described by Guruprasad et al. (Guruprasad et al., 1990). Proteins with instability indexes over 40 are predicted to be less stable.
Reactome pathway overrepresentation test
Genes corresponding to annotated canonical proteins encoded within novel isoforms sequences or downstream of 5′UTR-initiated cryptic proteins were submitted to Panther’s “Statistical overrepresentation test” (http://www.pantherdb.org/) using reactome pathways as the annotation set. The whole list of Homo sapiens genes was used as a reference. Statistical significance of the enrichment of each pathway was assessed using Fisher’s exact test, with the Benjamini-Hochberg false discovery rate (FDR) correction for multiple comparisons (adjusted p value < 0.05). To limit the number of pathways displayed in graphs, we applied, in addition to p< 0.05, a threshold on each pathway’s level of enrichment. Therefore, for novel isoforms, statistically overrepresented pathways with enrichment > 4 were displayed. For 5′UTR cryptic proteins, statistically overrepresented pathways with enrichment > 3 were shown.
QUANTIFICATION AND STATISTICAL ANALYSIS
Analyses and figures were performed using Python v2.7.6 or R v3.5.1. Correlation tests were done using the python function scipy.stats.linregress. All statistical tests used are mentioned in the respective figure legends. Significant level (*p < 0.05, **p < 0.01, ***p < 0.001 and ****p < 0.0001) are reported in the figures. Kolmogorov-Smirnov, Fisher’s exact, Mann-Whitney U, T-Test, Wilcoxon rank-sum tests were performed using ks_2samp, fisher_exact, mannwhitneyu, ttest_ind, wilcoxon functions from scipy.stats python module, respectively. Unless mentioned otherwise, all boxes in boxplots show the third (75th) and first quartiles (25th), and the box bands show the median (second quartile) of the distribution; whiskers extend to 1.5 times the interquartile distance from the box.
Supplementary Material
KEY RESOURCES TABLE
| REAGENT or RESOURCE | SOURCE | IDENTIFIER |
|---|---|---|
| Antibodies | ||
| InVivoMAb anti-human MHC Class I (W6/32) | BioXcell | Cat# BE0079; RRID: AB_1107730 |
| Anti-human HLA-ABC (W6/32) | Biolegend | Cat# 311402; RRID: AB_314871 |
| Mouse IgG2a, κ Isotype Ctrl Antibody | Biolegend | Cat# 400201 |
| Chemicals, peptides, and recombinant proteins | ||
| Advanced RPMI 1640 Medium | Thermo Fisher | Cat# 12633012 |
| Fetal Bovine Serum | Seradigm | Cat# 1500-500 |
| AIM V medium | Thermo Fisher | Cat# 12055091 |
| Penicillin-Streptomycin (10,000 U/mL) | Thermo Fisher | Cat# 15140122 |
| GlutaMAX Supplement | Thermo Fisher | Cat# 35050061 |
| Gentamycin | Thermo Fisher | Cat# 15750060 |
| Harringtonine | LKT Laboratories | Cat# H0169 |
| DPBS, calcium, magnesium | GIBCO | Cat# 14040141 |
| UltraPure Sucrose | Invitrogen | Cat# 15503022 |
| TRI Reagent Solution | Invitrogen | Cat# AM9738 |
| Cycloheximide, High Purity - CAS 66-81-9 - Calbiochem | Sigma-Aldrich | Cat# 239764 |
| RNase I, E. coli | Lucigen | Cat# N6901K |
| DNase I | Zymo Research | Cat# E1009-A |
| Nuclease-Free Water (not DEPC-Treated) | Invitrogen | Cat# AM9932 |
| SDS, 20% Solution, RNase-free | Invitrogen | Cat# AM9820 |
| Formic acid | Sigma-Aldrich | Cat#FX0440-7 |
| C18 Jupiter Phenomenex | Phenomenex | Cat# 04A-4263 |
| Acetonitrile | Thermo Fisher | Cat# A996SK-4 |
| Ammonium bicarbonate | Sigma-Aldrich | Cat# A6141 |
| TCEP [Tris(2-carboxyethyl) phosphine hydrochloride | Thermo Fisher | Cat# 20490 |
| Chloroacetamide | Sigma-Aldrich | Cat# C0267 |
| Trypsin | Promega | Cat# V511A |
| Critical commercial assays | ||
| Universal Mycoplasma Detection Kit | ATCC | Cat# 30-1012K |
| Qubit RNA BR Assay Kit | Invitrogen | Cat# Q10211 |
| Ribo-Zero Gold rRNA Removal Kit (Human, Mouse, Rat) | Illumina | Cat# MRZG12324 |
| RNA Clean & Concentrator-5 | Zymo Research | Cat# R1013 |
| TruSeq Stranded mRNA Library Prep kit | Illumina | Cat# 20020594 |
| PureProteome protein A magnetic beads | Millipore | Cat# LSKMAGA10 |
| QIFIKIT | Agilent | Cat# K0078 |
| Deposited data | ||
| DLBCL cell line samples: RNaseq data | This study | NCBI SRA: PRJNA647736 |
| DLBCL cell line samples: Ribo-seq data | This study | NCBI SRA: PRJNA647736 |
| DLBCL samples immunopeptidomic and whole proteome tryptic data | This study | PRIDE: PXD020620 |
| Experimental models: cell lines | ||
| HBL-1 cell line | Lab of Martin Dyer | RRID: CVCL_4213 |
| SU-DHL-4 cell line | Lab of Mark Raffeld | RRID: CVCL_0539 |
| DoHH2 cell line | DSMZ | Cat# ACC-47; RRID: CVCL_1179 |
| Software and algorithms | ||
| Ribo-db Pipeline | This study | https://github.com/lemieux-lab/Ribo-db |
| STAR | (Dobin et al., 2013) | https://github.com/alexdobin/STAR |
| SAMtools | (Li et al., 2009) | http://www.htslib.org/doc/ |
| StringTie | (Pertea et al., 2015) | https://ccb.jhu.edu/software/stringtie/ |
| PEAKS X | Bioinformatics Solutions | https://www.bioinfor.com/ |
| Comet | (Eng et al., 2015) | http://comet-ms.sourceforge.net/ |
| NetMHCpan 4.0 | (Jurtz et al., 2017) | http://www.cbs.dtu.dk/services/NetMHCpan-4.0/ |
| Freebayes | (Garrison and Marth, 2012) | https://github.com/freebayes/freebayes |
| Proteowizard | Proteowizard Software | http://proteowizard.sourceforge.net |
| BEDtools | (Quinlan and Hall, 2010) | https://bedtools.readthedocs.io/en/latest/ |
| MAPDP | (Courcelles et al., 2020) | https://gitlab.com/iric-proteo/mapdp |
| DeepLC 0.1.14 | (Bouwmeester et al., 2020) | https://github.com/compomics/DeepLC |
| PRICE v.1.0.3 | (Erhard et al., 2018) | https://github.com/erhard-lab/gedi/wiki/Price |
| GPS-ARM version 1.0 | (Liu etal., 2012) | http://arm.biocuckoo.org/ |
| UbPred | (Radivojac et al., 2010) | http://www.ubpred.org/ |
| IUPred2 | (Mészáros et al., 2018) | https://iupred2a.elte.hu/ |
| Biopython module SeqUtils | Biopython module | https://biopython.org/docs/1.75/api/Bio.SeqUtils.html |
| Panther classification system | Panther algorithm | http://www.pantherdb.org/ |
| riboWaltz | (Lauria et al., 2018) | https://github.com/LabTranslationalArchitectomics/riboWaltz |
Highlights.
A proteogenomic method integrating ribosome profiling and mass spectrometry
Of 14,498 proteins, 2,503 were non-canonical: 28% new isoforms and 72% cryptic proteins
Cryptic proteins are more disordered and unstable than classical proteins
Cryptic proteins are particularly efficient at generating MHC-I peptides
ACKNOWLEDGMENTS
We thank Pierre-Henri Wuillemin and Natalia Sokolovska for their invaluable support in model design. We are grateful to Qingchuan Zhao, Anca Apavaloaei, and Assya Trofimov for useful biological insights and all other members of our laboratories for their thoughtful suggestions. We also thank Patrick Gendron and Jean-Philippe Laverdure for assistance with bioinformatics tools. This work was supported by grants from IVADO and the Canada First Research Excellence Fund (Apogée/CFREF), BioCanRx, the Canadian Cancer Society (no. 705604), the Canadian Institutes of Health Research (FDN 148400), and The Oncopole (EMC2 Grant). J.H. and J.W.Y. are supported by the Division of Intramural Research of the NIAID, and L.M.S. by the Division of Intramural Research, NCI. This work was additionally generously supported by a FLEX grant from the Division of Intramural Research, NCI. We would also like to thank the CCR Sequencing Facility at Frederick National Laboratory for Cancer Research for performing the sequencing.
Footnotes
SUPPLEMENTAL INFORMATION
Supplemental information can be found online at https://doi.org/10.1016/j.celrep.2021.108815.
DECLARATION OF INTERESTS
The authors declare no competing interests.
REFERENCES
- Apcher S, Millot G, Daskalogianni C, Scherl A, Manoury B, and Fåhraeus R (2013). Translation of pre-spliced RNAs in the nuclear compartment generates peptides for the MHC class I pathway. Proc. Natl. Acad. Sci. USA 110, 17951–17956. [DOI] [PMC free article] [PubMed] [Google Scholar]
- Aster JC, Pear WS, and Blacklow SC (2017). The varied roles of Notch in cancer. Annu. Rev. Pathol. 12, 245–275. [DOI] [PMC free article] [PubMed] [Google Scholar]
- Bassani-Sternberg M, Pletscher-Frankild S, Jensen LJ, and Mann M (2015). Mass spectrometry of human leukocyte antigen class I peptidomes reveals strong effects of protein abundance and turnover on antigen presentation. Mol. Cell. Proteomics 14, 658–673. [DOI] [PMC free article] [PubMed] [Google Scholar]
- Blaha DT, Anderson SD, Yoakum DM, Hager MV, Zha Y, Gajewski TF, and Kranz DM (2019). High-throughput stability screening of neoantigen/HLA complexes improves immunogenicity predictions. Cancer Immunol. Res. 7, 50–61. [DOI] [PMC free article] [PubMed] [Google Scholar]
- Blakeley P, Overton IM, and Hubbard SJ (2012). Addressing statistical biases in nucleotide-derived protein databases for proteogenomic search strategies. J. Proteome Res. 11, 5221–5234. [DOI] [PMC free article] [PubMed] [Google Scholar]
- Bourdetsky D, Schmelzer CE, and Admon A (2014). The nature and extent of contributions by defective ribosome products to the HLA peptidome. Proc. Natl. Acad. Sci. USA 111, E1591–E1599. [DOI] [PMC free article] [PubMed] [Google Scholar]
- Bouwmeester R, Gabriels R, Hulstaert N, Martens L, and Degroeve S (2020). DeepLC can predict retention times for peptides that carry as-yet unseen modifications. bioRxiv, 2020.2003.2028.013003. [DOI] [PubMed] [Google Scholar]
- Brunet MA, Levesque SA, Hunting DJ, Cohen AA, and Roucou X (2018). Recognition of the polycistronic nature of human genes is critical to understanding the genotype-phenotype relationship. Genome Res. 28, 609–624. [DOI] [PMC free article] [PubMed] [Google Scholar]
- Brunet MA, Brunelle M, Lucier JF, Delcourt V, Levesque M, Grenier F, Samandi S, Leblanc S, Aguilar JD, Dufour P, et al. (2019). OpenProt: a more comprehensive guide to explore eukaryotic coding potential and proteomes. Nucleic Acids Res. 47 (D1), D403–D410. [DOI] [PMC free article] [PubMed] [Google Scholar]
- Bullock TN, and Eisenlohr LC (1996). Ribosomal scanning past the primary initiation codon as a mechanism for expression of CTL epitopes encoded in alternative reading frames. J. Exp. Med. 184, 1319–1329. [DOI] [PMC free article] [PubMed] [Google Scholar]
- Capietto AH, Jhunjhunwala S, Pollock SB, Lupardus P, Wong J, Hänsch L, Cevallos J, Chestnut Y, Fernandez A, Lounsbury N, et al. (2020). Mutation position is an important determinant for predicting cancer neoantigens. J. Exp. Med. 217, e20190179. [DOI] [PMC free article] [PubMed] [Google Scholar]
- Caron E, Vincent K, Fortier MH, Laverdure JP, Bramoullé A, Hardy MP, Voisin G, Roux PP, Lemieux S, Thibault P, and Perreault C (2011).The MHC I immunopeptidome conveys to the cell surfacean integrative view of cellular regulation. Mol. Syst. Biol. 7, 533. [DOI] [PMC free article] [PubMed] [Google Scholar]
- Chan WY, Wong N, Chan AB, Chow JH, and Lee JC (1998). Consistent copy number gain in chromosome 12 in primary diffuse large cell lymphomas of the stomach. Am. J. Pathol. 152, 11–16. [PMC free article] [PubMed] [Google Scholar]
- Chen J, Brunner AD, Cogan JZ, Nuñez JK, Fields AP, Adamson B, Itzhak DN, Li JY, Mann M, Leonetti MD, and Weissman JS (2020). Pervasive functional translation of noncanonical human open reading frames. Science 367, 1140–1146. [DOI] [PMC free article] [PubMed] [Google Scholar]
- Chong C, Müller M, Pak H, Harnett D, Huber F, Grun D, Leleu M, Auger A,Arnaud M, Stevenson BJ, et al. (2020). Integrated proteogenomic deep sequencing and analytics accurately identify non-canonical peptides in tumor immunopeptidomes. Nat. Commun. 11, 1293. [DOI] [PMC free article] [PubMed] [Google Scholar]
- Coulie PG, Lehmann F, Lethé B, Herman J, Lurquin C, Andrawiss M, and Boon T (1995). A mutated intron sequence codes for an antigenic peptide recognized by cytolytic T lymphocytes on a human melanoma. Proc. Natl. Acad. Sci. USA 92, 7976–7980. [DOI] [PMC free article] [PubMed] [Google Scholar]
- Courcelles M, Durette C, Daouda T, Laverdure JP, Vincent K, Lemieux S, Perreault C, and Thibault P (2020). MAPDP: a cloud-based computational platform for immunopeptidomics analyses. J. Proteome Res. 19, 1873–1881. [DOI] [PubMed] [Google Scholar]
- Dersh D, Hollý J, and Yewdell JW (2021).A few good peptides: MHC class I-based cancer immunosurveillance and immunoevasion. Nat. Rev. Immunol. 21, 116–128. [DOI] [PubMed] [Google Scholar]
- Dobin A, Davis CA, Schlesinger F, Drenkow J, Zaleski C, Jha S, Batut P, Chaisson M, and Gingeras TR (2013). STAR: ultrafast universal RNA-seq aligner. Bioinformatics 29, 15–21. [DOI] [PMC free article] [PubMed] [Google Scholar]
- Eng JK, Hoopmann MR, Jahan TA, Egertson JD, Noble WS, and MacCoss MJ (2015). A deeper look into Comet–implementation and features. J. Am. Soc. Mass Spectrom. 26, 1865–1874. [DOI] [PMC free article] [PubMed] [Google Scholar]
- Erhard F, Halenius A, Zimmermann C, L’Hernault A, Kowalewski DJ, Weekes MP, Stevanovic S, Zimmer R, and Dölken L (2018). Improved Ribo-seq enables identification of cryptic translation events. Nat. Methods 15, 363–366. [DOI] [PMC free article] [PubMed] [Google Scholar]
- Fields AP, Rodriguez EH, Jovanovic M, Stern-Ginossar N, Haas BJ, Mertins P, Raychowdhury R, Hacohen N, Carr SA, Ingolia NT, et al. (2015). A regression-based analysis of ribosome-profiling data reveals a conserved complexity to mammalian translation. Mol. Cell 60, 816–827. [DOI] [PMC free article] [PubMed] [Google Scholar]
- Finotello F, Rieder D, Hackl H, and Trajanoski Z (2019). Next-generation computational tools for interrogating cancer immunity. Nat. Rev. Genet. 20, 724–746. [DOI] [PubMed] [Google Scholar]
- Francis WR, and Wörheide G (2017). Similar ratios of introns to intergenic sequence across animal genomes. Genome Biol. Evol. 9, 1582–1598. [DOI] [PMC free article] [PubMed] [Google Scholar]
- Garrison E, and Marth G (2012). Haplotype-based variant detection from short-read sequencing. arXiv, arXiv:1207.3907v2. https://arxiv.org/abs/1207.3907. [Google Scholar]
- Ghosh M, Gauger M, Marcu A, Nelde A, Denk M, Schuster H, Rammensee HG, and Stevanović S (2020). Guidance document: validation of a high-performance liquid chromatography-tandem mass spectrometry immunopeptidomics assay for the identification of HLA class I ligands suitable for pharmaceutical therapies. Mol. Cell. Proteomics 19, 432–443. [DOI] [PMC free article] [PubMed] [Google Scholar]
- Granados DP, Laumont CM, Thibault P, and Perreault C (2015). The nature of self for T cells-a systems-level perspective. Curr. Opin. Immunol. 34, 1–8. [DOI] [PubMed] [Google Scholar]
- Guruprasad K, Reddy BV, and Pandit MW (1990). Correlation between stability of a protein and its dipeptide composition: a novel approach for predicting in vivo stability of a protein from its primary sequence. Protein Eng. 4, 155–161. [DOI] [PubMed] [Google Scholar]
- Harrow J, Frankish A, Gonzalez JM, Tapanari E, Diekhans M, Kokocinski F, Aken BL, Barrell D, Zadissa A, Searle S, et al. (2012). GENCODE: the reference human genome annotation for The ENCODE Project. Genome Res. 22, 1760–1774. [DOI] [PMC free article] [PubMed] [Google Scholar]
- Ingolia NT (2016). Ribosome footprint profiling of translation throughout the genome. Cell 165, 22–33. [DOI] [PMC free article] [PubMed] [Google Scholar]
- Ingolia NT, Ghaemmaghami S, Newman JR, and Weissman JS (2009). Genome-wide analysis in vivo of translation with nucleotide resolution using ribosome profiling. Science 324, 218–223. [DOI] [PMC free article] [PubMed] [Google Scholar]
- Ingolia NT, Lareau LF, and Weissman JS (2011). Ribosome profiling of mouse embryonic stem cells reveals the complexity and dynamics of mammalian proteomes. Cell 147, 789–802. [DOI] [PMC free article] [PubMed] [Google Scholar]
- Ingolia NT, Brar GA, Rouskin S, McGeachy AM, and Weissman JS (2012). The ribosome profiling strategy for monitoring translation in vivo by deep sequencing of ribosome-protected mRNA fragments. Nat. Protoc. 7, 1534–1550. [DOI] [PMC free article] [PubMed] [Google Scholar]
- Ivanov IP, Loughran G, Sachs MS, and Atkins JF (2010). Initiation context modulates autoregulation of eukaryotic translation initiation factor 1 (eIF1). Proc. Natl. Acad. Sci. USA 107, 18056–18060. [DOI] [PMC free article] [PubMed] [Google Scholar]
- Ivanov IP, Firth AE, Michel AM, Atkins JF, and Baranov PV (2011). Identification of evolutionarily conserved non-AUG-initiated N-terminal extensions in human coding sequences. Nucleic Acids Res. 39, 4220–4234. [DOI] [PMC free article] [PubMed] [Google Scholar]
- Jiang Z, Yang J, Dai A, Wang Y, Li W, and Xie Z (2017). Ribosome profiling reveals translational regulation of mammalian cells in response to hypoxic stress. BMC Genomics 18, 638. [DOI] [PMC free article] [PubMed] [Google Scholar]
- Jurtz V, Paul S, Andreatta M, Marcatili P, Peters B, and Nielsen M (2017). NetMHCpan-4.0: improved peptide-MHC class I interaction predictions integrating eluted ligand and peptide binding affinity data. J. Immunol. 199, 3360–3368. [DOI] [PMC free article] [PubMed] [Google Scholar]
- Karube K, Enjuanes A, Dlouhy I, Jares P, Martin-Garcia D, Nadeu F, Ordóñez GR, Rovira J, Clot G, Royo C, et al. (2018). Integrating genomic alterations in diffuse large B-cell lymphoma identifies new relevant pathways and potential therapeutic targets. Leukemia 32, 675–684. [DOI] [PMC free article] [PubMed] [Google Scholar]
- Kote S, Pirog A, Bedran G, Alfaro J, and Dapic I (2020). Mass spectrometry-based identification of MHC-associated peptides. Cancers (Basel) 12, 535. [DOI] [PMC free article] [PubMed] [Google Scholar]
- Kozak M (1987). An analysis of 5′-noncoding sequences from 699 vertebrate messenger RNAs. Nucleic Acids Res. 15, 8125–8148. [DOI] [PMC free article] [PubMed] [Google Scholar]
- Lanoix J, Durette C, Courcelles M, Cossette É, Comtois-Marotte S, Hardy MP, Côté C, Perreault C, and Thibault P (2018). Comparison of the MHC I immunopeptidome repertoire of B-cell lymphoblasts using two isolation methods. Proteomics 18, e1700251. [DOI] [PubMed] [Google Scholar]
- Laumont CM, Daouda T, Laverdure JP, Bonneil É, Caron-Lizotte O, Hardy MP, Granados DP, Durette C, Lemieux S, Thibault P, and Perreault C (2016). Global proteogenomic analysis of human MHC class I-associated peptides derived from non-canonical reading frames. Nat. Commun. 7, 10238. [DOI] [PMC free article] [PubMed] [Google Scholar]
- Laumont CM, Vincent K, Hesnard L, Audemard É, Bonneil É, Laverdure JP, Gendron P, Courcelles M, Hardy MP, Côté C, et al. (2018). Noncoding regions are the main source of targetable tumor-specific antigens. Sci. Transl. Med 10, eaau5516. [DOI] [PubMed] [Google Scholar]
- Lauria F, Tebaldi T, Bernabò P, Groen EJN, Gillingwater TH, and Viero G (2018). riboWaltz: Optimization of ribosome P-site positioning in ribosome profiling data. PLoS Comput. Biol. 14, e1006169. [DOI] [PMC free article] [PubMed] [Google Scholar]
- Lee S, Liu B, Lee S, Huang SX, Shen B, and Qian SB (2012). Global mapping of translation initiation sites in mammalian cells at single-nucleotide resolution. Proc. Natl. Acad. Sci. USA 109, E2424–E2432. [DOI] [PMC free article] [PubMed] [Google Scholar]
- Li H, Handsaker B, Wysoker A, Fennell T, Ruan J, Homer N, Marth G, Abecasis G, and Durbin R; 1000 Genome Project Data Processing Subgroup (2009). The Sequence Alignment/Map format and SAMtools. Bioinformatics 25, 2078–2079. [DOI] [PMC free article] [PubMed] [Google Scholar]
- Liu Z, Yuan F, Ren J, Cao J, Zhou Y, Yang Q, and Xue Y (2012). GPS-ARM: computational analysis of the APC/C recognition motif by predicting D-boxes and KEN-boxes. PLoS ONE 7, e34370. [DOI] [PMC free article] [PubMed] [Google Scholar]
- Lu S, Zhang J, Lian X, Sun L, Meng K, Chen Y, Sun Z, Yin X, Li Y, Zhao J, et al. (2019). A hidden human proteome encoded by ‘non-coding’ genes. Nucleic Acids Res. 47, 8111–8125. [DOI] [PMC free article] [PubMed] [Google Scholar]
- Lubec G, and Afjehi-Sadat L (2007). Limitations and pitfalls in protein identification by mass spectrometry. Chem. Rev. 107, 3568–3584. [DOI] [PubMed] [Google Scholar]
- Martins RP, Malbert-Colas L, Lista MJ, Daskalogianni C, Apcher S, Pla M, Findakly S, Blondel M, and Fåhraeus R (2019). Nuclear processing of nascent transcripts determines synthesis of full-length proteins and antigenic peptides. Nucleic Acids Res. 47, 3086–3100. [DOI] [PMC free article] [PubMed] [Google Scholar]
- McGlincy NJ, and Ingolia NT (2017). Transcriptome-wide measurement of translation by ribosome profiling. Methods 126, 112–129. [DOI] [PMC free article] [PubMed] [Google Scholar]
- Mészáros B, Erdos G, and Dosztányi Z (2018). IUPred2A: context-dependent prediction of protein disorder as a function of redox state and protein binding. Nucleic Acids Res. 46 (W1), W329–W337. [DOI] [PMC free article] [PubMed] [Google Scholar]
- Milner E, Barnea E, Beer I, and Admon A (2006). The turnover kinetics of major histocompatibility complex peptides of human cancer cells. Mol. Cell. Proteomics 5, 357–365. [DOI] [PubMed] [Google Scholar]
- Mommen GP, Frese CK, Meiring HD, van Gaans-van den Brink J, de Jong AP, van Els CA, and Heck AJ (2014). Expanding the detectable HLA peptide repertoire using electron-transfer/higher-energy collision dissociation (EThcD). Proc. Natl. Acad. Sci. USA 111, 4507–4512. [DOI] [PMC free article] [PubMed] [Google Scholar]
- Myers N, Olender T, Savidor A, Levin Y, Reuven N, and Shaul Y (2018). The disordered landscape of the 20S proteasome substrates reveals tight association with phase separated granules. Proteomics 18, e1800076. [DOI] [PubMed] [Google Scholar]
- Na CH, Barbhuiya MA, Kim MS, Verbruggen S, Eacker SM, Pletnikova O, Troncoso JC, Halushka MK, Menschaert G, Overall CM, and Pandey A (2018). Discovery of noncanonical translation initiation sites through mass spectrometric analysis of protein N termini. Genome Res. 28, 25–36. [DOI] [PMC free article] [PubMed] [Google Scholar]
- Nesvizhskii AI (2010). A survey of computational methods and error rate estimation procedures for peptide and protein identification in shotgun proteomics. J. Proteomics 73, 2092–2123. [DOI] [PMC free article] [PubMed] [Google Scholar]
- Nesvizhskii AI (2014). Proteogenomics: concepts, applications and computational strategies. Nat. Methods 11, 1114–1125. [DOI] [PMC free article] [PubMed] [Google Scholar]
- Ouspenskaia T, Law T, Clauser KR, Klaeger S, Sarkizova S, Aguet F, Li B, Christian E, Knisbacher BA, Le PM, et al. (2020). Thousands of novel unannotated proteins expand the MHC I immunopeptidome in cancer. bioRxiv, 2020.2002.2012.945840. [DOI] [PMC free article] [PubMed] [Google Scholar]
- Pearson H, Daouda T, Granados DP, Durette C, Bonneil E, Courcelles M, Rodenbrock A, Laverdure JP, Cote C, Mader S, et al. (2016). MHC class I-associated peptides derive from selective regions of the human genome. J. Clin. Invest. 126, 4690–4701. [DOI] [PMC free article] [PubMed] [Google Scholar]
- Pertea M, Pertea GM, Antonescu CM, Chang TC, Mendell JT, and Salzberg SL (2015). StringTie enables improved reconstruction of a transcriptome from RNA-seq reads. Nat. Biotechnol. 33, 290–295. [DOI] [PMC free article] [PubMed] [Google Scholar]
- Prevosto C, Usmani MF, McDonald S, Gumienny AM, Key T, Goodman RS, Gaston JS, Deery MJ, and Busch R (2016). Allele-independent turnover of human leukocyte antigen (HLA) class Ia molecules. PLoS ONE 11, e0161011. [DOI] [PMC free article] [PubMed] [Google Scholar]
- Purcell AW, Ramarathinam SH, and Ternette N (2019). Mass spectrometry-based identification of MHC-bound peptides for immunopeptidomics. Nat. Protoc. 14, 1687–1707. [DOI] [PubMed] [Google Scholar]
- Qian SB, Princiotta MF, Bennink JR, and Yewdell JW (2006). Characterization of rapidly degraded polypeptides in mammalian cells reveals a novel layer of nascent protein quality control. J. Biol. Chem. 281, 392–400. [DOI] [PubMed] [Google Scholar]
- Quinlan AR, and Hall IM (2010). BEDTools: a flexible suite of utilities for comparing genomic features. Bioinformatics 26, 841–842. [DOI] [PMC free article] [PubMed] [Google Scholar]
- Radivojac P, Vacic V, Haynes C, Cocklin RR, Mohan A, Heyen JW, Goebl MG, and Iakoucheva LM (2010). Identification, analysis, and prediction of protein ubiquitination sites. Proteins 78, 365–380. [DOI] [PMC free article] [PubMed] [Google Scholar]
- Reits EA, Vos JC, Grommé M, and Neefjes J (2000). The major substrates for TAP in vivo are derived from newly synthesized proteins. Nature 404, 774–778. [DOI] [PubMed] [Google Scholar]
- Reverendo M, Mendes A, Argüello RJ, Gatti E, and Pierre P (2019). At the crossway of ER-stress and proinflammatory responses. FEBS J. 286, 297–310. [DOI] [PubMed] [Google Scholar]
- Samandi S, Roy AV, Delcourt V, Lucier JF, Gagnon J, Beaudoin MC, Vanderperre B, Breton MA, Motard J, Jacques JF, et al. (2017). Deep transcriptome annotation enables the discovery and functional characterization of cryptic small proteins. eLife 6, e27860. [DOI] [PMC free article] [PubMed] [Google Scholar]
- Schubert U, Antón LC, Gibbs J, Norbury CC, Yewdell JW, and Bennink JR (2000). Rapid degradation of a large fraction of newly synthesized proteins by proteasomes. Nature 404, 770–774. [DOI] [PubMed] [Google Scholar]
- Shraibman B, Barnea E, Kadosh DM, Haimovich Y, Slobodin G, Rosner I, López-Larrea C, Hilf N, Kuttruff S, Song C, et al. (2019). Identification of tumor antigens among the HLA peptidomes of glioblastoma tumors and plasma. Mol. Cell. Proteomics 18, 1255–1268. [DOI] [PMC free article] [PubMed] [Google Scholar]
- Smith T, Heger A, and Sudbery I (2017). UMI-tools: modeling sequencing errors in unique molecular identifiers to improve quantification accuracy. Genome Res. 27, 491–499. [DOI] [PMC free article] [PubMed] [Google Scholar]
- Starck SR, and Shastri N (2016). Nowhere to hide: unconventional translation yields cryptic peptides for immune surveillance. Immunol. Rev. 272, 8–16. [DOI] [PMC free article] [PubMed] [Google Scholar]
- Starck SR, Jiang V, Pavon-Eternod M, Prasad S, McCarthy B, Pan T, and Shastri N (2012). Leucine-tRNA initiates at CUG start codons for protein synthesis and presentation by MHC class I. Science 336, 1719–1723. [DOI] [PubMed] [Google Scholar]
- van Heesch S, Witte F, Schneider-Lunitz V, Schulz JF, Adami E, Faber AB, Kirchner M, Maatz H, Blachut S, Sandmann CL, et al. (2019). The translational landscape of the human heart. Cell 178, 242–260.e29. [DOI] [PubMed] [Google Scholar]
- Veres DV, Gyurkó DM, Thaler B, Szalay KZ, Fazekas D, Korcsmáros T, and Csermely P (2015). ComPPI: a cellular compartment-specific database for protein-protein interaction network analysis. Nucleic Acids Res. 43, D485–D493. [DOI] [PMC free article] [PubMed] [Google Scholar]
- Vick EJ, Richardson N, Patel K, Delgado Ramos GM, Altahan A, Alloway T, and Martin MG (2018). Age-related chromosomal aberrations in patients with diffuse large B-cell lymphoma: an in silico approach. World J. Oncol. 9, 97–103. [DOI] [PMC free article] [PubMed] [Google Scholar]
- Vizcaíno JA, Kubiniok P, Kovalchik KA, Ma Q, Duquette JD, Mongrain I, Deutsch EW, Peters B, Sette A, Sirois I, and Caron E (2020). The human immunopeptidome project: a roadmap to predict and treat immune diseases. Mol. Cell. Proteomics 19, 31–49. [DOI] [PMC free article] [PubMed] [Google Scholar]
- Wei J, Zanker D, Di Carluccio AR, Smelkinson MG, Takeda K, Seedhom MO, Dersh D, Gibbs JS, Yang N, Jadhav A, et al. (2017). Varied role of ubiquitylation in generating MHC class I peptide ligands. J. Immunol. 198, 3835–3845. [DOI] [PMC free article] [PubMed] [Google Scholar]
- Wei J, Kishton RJ, Angel M, Conn CS, Dalla-Venezia N, Marcel V, Vincent A, Catez F, Ferré S, Ayadi L, et al. (2019). Ribosomal proteins regulate MHC class I peptide generation for immunosurveillance. Mol. Cell 73, 1162–1173.e5. [DOI] [PMC free article] [PubMed] [Google Scholar]
- Wen B, Li K, Zhang Y, and Zhang B (2020). Cancer neoantigen prioritization through sensitive and reliable proteogenomics analysis. Nat. Commun. 11, 1759. [DOI] [PMC free article] [PubMed] [Google Scholar]
- Xu Y, and Ruggero D (2020). The role of translation control in tumorigenesis and its therapeutic Implications. Annu. Rev. Cancer Biol 4, 437–457. [Google Scholar]
- Yewdell JW (2003). Immunology. Hide and seek in the peptidome. Science 301,1334–1335. [DOI] [PubMed] [Google Scholar]
- Yewdell JW, Dersh D, and Fåhraeus R (2019). Peptide channeling: the key to MHC class I immunosurveillance? Trends Cell Biol. 29, 929–939. [DOI] [PubMed] [Google Scholar]
- Younes A, Pugh W, Goodacre A, Katz R, Rodriguez MA, Hill D, Cabanillas F, and Andreeff M (1994). Polysomy of chromosome 12 in 60 patients with non-Hodgkin’s lymphoma assessed by fluorescence in situ hybridization: differences between follicular and diffuse large cell lymphoma. Genes Chromosomes Cancer 9, 161–167. [DOI] [PubMed] [Google Scholar]
- Young SK, and Wek RC (2016). Upstream open reading frames differentially regulate gene-specific translation in the integrated stress response. J. Biol. Chem. 291, 16927–16935. [DOI] [PMC free article] [PubMed] [Google Scholar]
- Zhao Q, Laverdure JP, Lanoix J, Durette C, Côté C, Bonneil É, Laumont CM, Gendron P, Vincent K, Courcelles M, et al. (2020). Proteogenomics uncovers a vast repertoire of shared tumor-specific antigens in ovarian cancer. Cancer Immunol. Res. 8, 544–555. [DOI] [PubMed] [Google Scholar]
Associated Data
This section collects any data citations, data availability statements, or supplementary materials included in this article.
Supplementary Materials
Data Availability Statement
The Python, bash scripts, and Jupyter notebooks generated during this study are available at GitHub, https://github.com/lemieux-lab/Ribo-db.
The accession number for MS raw data and associated databases reported in this paperis PRIDE: PXD020620.
The accession number for RNA-seq and ribosomal profiling raw sequencing data reported in this paper is NCBI SRA: PRJNA647736.