

Abstract
Osteosarcoma is a bone tumor frequently diagnosed in children and young adults. Despite advances in chemotherapy and surgical resection, tumors metastasize in 30% of osteosarcoma patients. In addition, side effects caused by chemotherapeutic drugs, as well as the development of chemoresistance, highlight the need to identify the molecular mechanisms involved in the pathogenesis of osteosarcoma. We compared 65 osteosarcoma samples to their adjacent normal tissues, as well as commercially obtained osteosarcoma cell lines with normal osteoblast cell lines, and identified a role for the microRNA (miR)-140/ubiquitin-specific protease 22 (USP22)/lysine-specific demethylase 1 (LSD1)/p21 axis in the development of osteosarcoma. Osteosarcoma tissues and cells exhibited poor miR-140 and p21 expression, whereas the expression of USP22 and LSD1 was increased. Overexpression of miR-140 inhibited cell proliferation, migration, and invasion and promoted cell apoptosis by directly targeting USP22, resulting in its decreased expression. Overexpression of USP22 reversed the effects of miR-140 overexpression in osteosarcoma cells. Overexpression of miR-140 or USP22 knockdown led to the ubiquitination and degradation of LSD1. miR-140 overexpression also suppressed tumorigenesis in vivo. This study revealed a role for miR-140 in the restriction of osteosarcoma development and identified miR-140 as a potential target for therapeutic intervention.
Keywords: osteosarcoma, microRNA-140, ubiquitin-specific protease 22, lysine-specific demethylase-1, p21, ubiquitination
Graphical Abstract
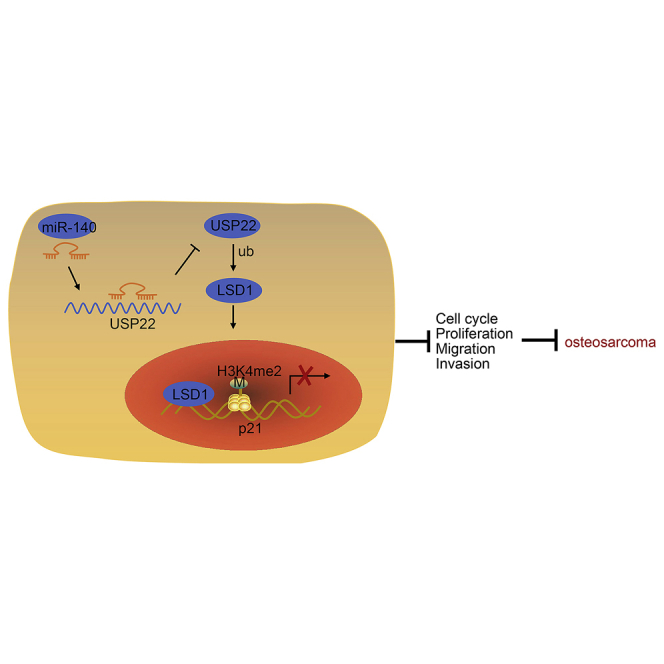
This study reveals a role for miR-140 in the restriction of osteosarcoma development and identifies miR-140 as a potential target for therapeutic intervention.
Introduction
Osteosarcoma is a common primary malignant bone tumor and most often develops in the first or second decade of life.1 The disease is extremely variable from one tumor to the next, limiting the efficacy of any single therapy.2 As such, the 5-year survival rate is roughly 30%, underscoring the urgent need for new therapies.3 Proliferation, apoptosis, angiogenesis, tumor microenvironment, migration, and invasion are all factors that regulate the progression of malignant cancers, including osteosarcoma.4 Therefore, the identification of mechanisms involved in osteosarcoma cell migration and invasion could lead to the development of novel therapeutic strategies used for the treatment of the disease.
MicroRNAs (miRNAs) control cell function by regulating the expression of different genes in specific cells altering cellular phenotype. Recent studies have identified miRNAs that regulate the development of osteosarcoma and that may serve as molecular drug targets.5,6 One such miRNA is hsa-miR-140-5p, which may serve as a potential biomarker for osteosarcoma therapies.7 Moreover, miR-140 inhibits tumor growth in osteosarcoma.8 miR-140-5p is also associated with overall survival, chemoresistance prognosis, and treatment of osteosarcoma.9 The specific mechanism by which miR-140 regulates the development of osteosarcoma remains to be elucidated, but our bioinformatic analysis identified a relationship between miR-140 and a target RNA encoding ubiquitin-specific protease 22 (USP22), a novel deubiquitinating enzyme and noted oncogene.10 Furthermore, suppression of USP22 inhibited the proliferation, invasion, and epithelial-to-mesenchymal transition (EMT) of osteosarcoma cells.11
Lysine-specific demethylase-1 (LSD1) is a flavin adenine dinucleotide-dependent enzyme, which regulates gene expression by removing H3K4me1/2 or H3K9me1/2.12,13 LSD1 is also linked to osteosarcoma, which plays a role in transcriptional regulation.14 LSD1 targets the promoter of p21, resulting in its demethylation and inhibiting p21 expression.15 As a well-known tumor suppressor gene, p21 can inhibit the progression of osteosarcoma.16 Our results indicate that the pathway connecting miR-140, USP22, LSD1, and p21 regulates the development of osteosarcoma and represents a potential therapeutic target for the treatment of disease.
Results
miR-140 targets and suppresses USP22 expression
With the use of the bioinformatics databases starBase and miRNA Data Integration Portal (mirDIP), we predicted 945 and 2,106 downstream target genes of miR-140, respectively. These genes, along with 2,017 genes classified as sarcoma related by the GeneCards database, were compared, and 61 intersecting genes overlapped all three datasets according to Venn diagram online analysis tools (Figure 1A). To predict the inter-relationship among 61 genes, we created a gene interaction network using the GeneMANIA website (Figure 1B). Subsequently, 14 genes with scores greater than 0.8 were adopted for the subsequent analysis (Table 1). UALCAN analysis of the expression of these 14 genes determined that the expression of CD276 and USP22 was significantly upregulated in sarcoma (Figure 1C). Moreover, USP22 was highly expressed in sarcoma samples compared with normal samples (Figure 1D) and was negatively correlated with miR-140 expression. The starBase database analysis indicated the presence of miR-140 binding sites in the USP22 transcript (Figure 1E). A dual-luciferase reporter assay was performed to verify the targeting relationship (Figure 1F), and the results showed a decrease in luminescent signal when cells were co-transfected with miR-140 mimic and wild-type (WT)-USP22 (p < 0.05). Moreover, the results of quantitative reverse transcription polymerase chain reaction (qRT-PCR) revealed that overexpression of miR-140 in HOS and U2OS cells significantly inhibited the expression of USP22 (p < 0.05) (Figures 1G and 1H; Figures S1A and S1B), which was consistent with western blot results (Figure 1I; Figure S1C).
Figure 1.

miR-140 targets and suppresses USP22 expression
(A) Venn diagram (http://jvenn.toulouse.inra.fr/app/example.html) identifying 61 overlapping genes predicted to be targets of miR-140 by the starBase (http://starbase.sysu.edu.cn/) and mirDIP (http://ophid.utoronto.ca/mirDIP/) databases and identified as sarcoma-related genes by the GeneCards database (https://www.genecards.org/). (B) Network construction of 61 genes by the GeneMANIA database (http://genemania.org/). (C) Expression patterns of 14 genes (>0.8 points evaluated by the GeneMANIA database) in sarcoma by the UALCAN database (http://ualcan.path.uab.edu/). (D) Expression of USP22 in sarcoma and normal tissues. (E) Putative miR-140 binding sites in the USP22 3′ UTR predicted using the starBase website. (F) Dual-luciferase reporter assay results verified the binding affinity between miR-140 and USP22 3′ UTR (∗p < 0.05 compared with WT-NC). (G and H) miR-140 (G) and USP22 (H) expression in HOS cells detected using qRT-PCR. (I) USP22 expression in HOS cells determined using western blot. (J and K) USP22 expression in osteosarcoma tissues (n = 65), measured using qRT-PCR (J) and western blot (K). (L) USP22 expression in osteosarcoma tissues (n = 65), measured using IHC assay (400×). (M) miR-140 expression in osteosarcoma tissues (n = 65), measured using qRT-PCR. (N) Correlation between miR-140 and USP22 analyzed by Pearson’s correlation coefficient. OS, osteosarcoma. ∗p < 0.05 compared with NC mimic or adjacent normal tissues. Comparison between osteosarcoma tissues and adjacent normal tissues is made using paired t test. Data between two groups are compared using unpaired t test. Cell experiment was repeated three times (n = 3).
Table 1.
Scoring for interaction genes in the GeneMANIA database
| Gene symbol | Score |
|---|---|
| UBR1 | 0.955022 |
| CD276 | 0.921964 |
| HELLS | 0.881546 |
| FRS2 | 0.858491 |
| MTHFR | 0.855887 |
| VTCN1 | 0.846307 |
| IFIT2 | 0.839143 |
| FADS1 | 0.837525 |
| LCOR | 0.829157 |
| SOAT1 | 0.822372 |
| CKAP2 | 0.816609 |
| L2HGDH | 0.809734 |
| USP22 | 0.807324 |
| KDM5A | 0.801593 |
qRT-qPCR and western blot were also conducted on osteosarcoma tissues and adjacent normal tissues, where they showed that USP22 expression was elevated in osteosarcoma tissues (p < 0.05) (Figures 1J and 1K). An immunohistochemistry (IHC) assay also showed that USP22 expression was higher in osteosarcoma tissues than the adjacent normal tissues (p < 0.05) (Figure 1L). The expression of miR-140 was decreased in osteosarcoma tissues, as detected by qRT-PCR (Figure 1M). Pearson’s correlation coefficient confirmed that miR-140 expression was negatively correlated with that of USP22 (Figure 1N). Taken together, these results indicate that miR-140 inhibits USP22 expression.
miR-140 attenuates malignant phenotypes of osteosarcoma cells by targeting USP22
To further evaluate effects of miR-140 regulation of USP22 on osteosarcoma, the expression of USP22 in the human osteoblast cell line hFOB1.19, as well as human osteosarcoma cell lines U2OS, SaOS-2, MG63, HOS, and SJSA1, was measured using qRT-PCR and western blot. USP22 expression was higher in all osteosarcoma cell lines than hFOB1.19 cells (Figures 2A and 2B). qRT-PCR showed that miR-140 expression was lower in all osteosarcoma cell lines compared to hFOB1.19 cells (Figure 2C). Furthermore, overexpression of miR-140 in HOS and U2OS cells distinctly inhibited USP22 expression, which was reversed by USP22 overexpression (Figures 2D and 2E; Figures S2A and S2B).
Figure 2.

Overexpression of miR-140 inhibits cell migration, invasion, and proliferation of osteosarcoma cells
(A and B) USP22 expression in normal osteoblast cells and osteosarcoma cell lines detected using qRT-PCR (A) and western blot (B). (C) Expression of miR-140 in normal osteoblast cells and osteosarcoma cell lines detected using qRT-PCR. (D) Expression of miR-140 in HOS cells examined using qRT-PCR. (E) USP22, Bcl2, Bax, cleaved caspase-3, cleaved PARP, E-cadherin, N-cadherin, and vimentin expression in HOS cells examined using western blot. (F−H) Cell proliferation (F), apoptosis (G), and cycle (H) analysis in HOS cells evaluated using colony-formation assay and flow cytometry, respectively. (I) Invasion and migration of HOS cells assessed using Transwell assay (200×). (A−C) ∗p < 0.05 compared with hFOB1.19 cells. (D−I) ∗p < 0.05 compared with cells in the NC mimic and empty vector group. #p < 0.05 compared with cells in the miR-140 mimic and empty vector group. Data among multiple groups are compared using one-way ANOVA. Cell experiment was repeated three times (n = 3).
Next, colony-formation assays and flow cytometry results indicated that overexpression of miR-140 inhibited proliferation and promoted apoptosis of HOS and U2OS cells, accompanied by more cells in the G0/G1 phase and less cells in the S and G2/M phase. Overexpressed USP22 accelerated cell proliferation and suppressed apoptosis, along with less cells in the G0/G1 phase and more cells in the S and G2/M phase, reversing the effects of miR-140 on cell proliferation, apoptosis, and cell cycle arrest (Figures 2F−2H; Figures S2C−S2E). Results of western blot on apoptosis-related proteins revealed that overexpressed miR-140 decreased Bcl2 expression and increased Bax, cleaved caspase-3, and cleaved poly (ADP-ribose) polymerase (PARP) expression in HOS and U2OS cells, whereas overexpression of USP22 induced the opposite effects on expression of Bcl2, Bax, cleaved caspase-3, and cleaved PARP and reversed the impacts of miR-140 (Figure 2E; Figure S2B). Overexpression of miR-140 also restricted HOS and U2OS cell invasion and migration, whereas USP22 overexpression resulted in opposing trends (Figure 2I; Figure S2F). In addition, overexpressed miR-140 led to downregulated N-cadherin and vimentin but upregulated E-cadherin, which was reversed by overexpressed USP22, suggesting that this pathway regulates EMT (Figure 2E; Figure S2B). In conclusion, miR-140 suppresses the development of osteosarcoma in vitro by downregulating USP22.
miR-140 suppresses USP22, leading to increased LSD1 ubiquitination and degradation
We constructed a USP22-based network of gene-gene interactions using the BioGRID database (Figure 3A). Nineteen genes were found in both the BioGRID and the GeneCards databases (as shown in Figure 3B). Likewise, the ChIPBase v2.0 database shows that USP22 is co-expressed with LSD1 (KDM1A) in osteoma sarcomatosum (SARC) (Figure 3C). Through Pearson’s correlation coefficient analysis, we found that the expression of USP22 and KDM1A mRNA showed a significant positive correlation in SARC samples. Knockdown of USP22 resulted in decreased LSD1 expression in HOS and U2OS cells (Figure 3D; Figure S3A), and USP22 was able to pull down LSD1 in co-immunoprecipitation (coIP) experiments using HOS and U2OS lysates (Figure 3E; Figure S3B). Moreover, depletion of USP22 promoted the ubiquitination of LSD1 (Figure 3F; Figure S3C). HOS and U2OS cells treated with chlorhexidine (CHX), a protein synthesis inhibitor, showed a decrease in USP22 and a reduction in LSD1 protein levels (Figure 3G; Figure S3D). Overexpression of miR-140 decreased the mRNA expression of USP22 and LSD1 (Figure 3H; Figure S3E), as well as the protein levels of LSD1 (Figure 3I; Figure S3F). The results above suggest that miR-140 targets USP22, preventing it from carrying out LSD1 deubiquitination and promoting LSD1 degradation.
Figure 3.

Overexpression of miR-140 reduces LSD1 expression by inhibiting USP22 in HOS cells
(A) A network of gene-gene interactions associated with USP22 constructed using the BioGRID database (https://thebiogrid.org/). (B) Nineteen genes were identified by both the BioGRID and GeneCards databases. (C) ChIPBase v.2.0 database (http://rna.sysu.edu.cn/chipbase/) analysis shows USP22 co-expressed with LSD1 (KDM1A) in osteoma sarcomatosum (SARC). Through Pearson’s correlation coefficient analysis, we found that the expression of USP22 and KDM1A mRNA showed a significant positive correlation in SARC samples. (D) USP22 and LSD1 protein expression in HOS cells detected using western blot. (E) CoIP for interaction between USP22 and LSD1 in HOS cells. (F) Effects of USP22 knockdown on LSD1 ubiquitination in HOS cells examined using coIP. (G) Effects of USP22 knockdown on LSD1 ubiquitination in CHX-treated HOS cells. (H) The mRNA expression of USP22 and LSD1 in HOS cells evaluated using qRT-PCR. (I) Effects of overexpressed miR-140 on LSD1 protein stability in CHX-treated HOS cells. ∗p < 0.05 compared with cells treated with si-NC or NC mimic. Data between two groups were compared using unpaired t test. Data among multiple groups were analyzed using one-way ANOVA, whereas data at different time points were compared using repeated-measures ANOVA. Cell experiment was repeated three times (n = 3).
Overexpression of miR-140 suppresses proliferation, migration, and invasion of osteosarcoma cells by regulating the USP22/LSD1 axis
To confirm the role of miR-140 in inhibiting the progression of osteosarcoma, qRT-PCR and western blot were used to detect the expression of LSD1 in the normal osteoblast cell line hFOB1.19 and osteosarcoma cell lines U2OS, SaOS-2, MG63, HOS, and SJSA1. The results showed that the expression of LSD1 was significantly higher in osteosarcoma cells compared to normal cells hFOB1.19 (Figures 4A and 4B). Further, we determined the expression of LSD1 in the osteosarcoma tissues and adjacent normal tissues by qRT-PCR and western blot analysis, which demonstrated that the mRNA and protein levels of LSD1 were significantly upregulated in osteosarcoma tissues (Figures S4A and S4B). Moreover, overexpression of miR-140 in HOS and U2OS cells significantly inhibited the expression of USP22 and LSD1, whereas overexpression of LSD1 reversed the effects of miR-140 overexpression on LSD1 expression (Figures 4C and 4D; Figures S5A and S5B). Overexpression of miR-140 inhibited HOS and U2OS cell proliferation in the colony-formation assay, whereas overexpression of LSD1 promoted cell proliferation and reversed the effects of overexpression of miR-140 (Figure 4E; Figure S5C). Flow cytometry results showed that overexpression of miR-140 in HOS and U2OS promoted cell apoptosis and resulted in more cells arrested in the G0/G1 phase and fewer cells in the S phase and G2/M phase. Conversely, overexpression of LSD1 inhibited cell apoptosis and resulted in fewer cells arrested in the G0/G1 phase and more cells in the S phase and G2/M phase, negating the effects of miR-140 overexpression (Figures 4F and 4G; Figures S5D and S5E). Overexpression of miR-140 also decreased the expression of Bcl2, whereas increased the expression of Bax, cleaved caspase-3, and cleaved PARP. Overexpression of LSD1 increased Bcl2 expression but decreased the expression of BAX, cleaved caspase-3, and cleaved PARP, again negating the effects of miR-140 overexpression (Figure 4D; Figure S5B). In the Transwell assay, overexpression of miR-140 decreased HOS and U2OS cell invasion and migration, whereas overexpression of LSD1 increased cell invasion and migration (Figure 4H; Figure S5F). Overexpressed miR-140 elevated E-cadherin expression but downregulated N-cadherin and vimentin expression, and this was reversed by overexpression of USP22 (Figure 4D; Figure S5B). In conclusion, miR-140 inhibits the development of osteosarcoma by inhibiting USP22-dependent LSD1.
Figure 4.

miR-140 suppresses HOS cell proliferation, migration, and invasion by downregulating LSD1 via USP22
(A and B) Measurement of LSD1 expression in hFOB1.19 and osteosarcoma cell lines using qRT-PCR (A) and western blot (B). (C) Expression of miR-140, USP22, and LSD1 in HOS cells detected using qRT-PCR. (D) Bcl2, BAX, cleaved caspase-3, cleaved PARP, E-cadherin, N-cadherin, and vimentin expression in HOS cells assessed using western blot. (E) Evaluation of HOS cell proliferation using the colony-formation assay. HOS cell apoptosis (F) and cell cycle (G) assessed using flow cytometry. (H) Transwell assay examining HOS cell invasion and migration. (A and B) ∗p < 0.05 compared with hFOB1.19 cells. (C−H) ∗p < 0.05 compared with cells in the NC-mimic and oe-NC group. #p < 0.05 compared with cells in the miR-140-mimic and oe-NC group. Data comparison among multiple groups is analyzed by one-way ANOVA. Each experiment was repeated three times (n = 3).
miR-140 enhances p21 H3K4me2 methylation through the USP22/LSD1 axis
To identify downstream targets of LSD1, LSD1 was knocked down using two different targeting sequences, followed by analysis by qRT-PCR. The results showed that both knockdown sequences could inhibit LSD1 expression in HOS and U2OS cells (Figure 5A; Figure S6A). Western blot results indicated that LSD1 knockdown in HOS and U2OS cells promoted p21 expression (Figure 5B; Figure S6B). Moreover, chromatin immunoprecipitation (ChIP) results indicated that inhibiting LSD1 expression in HOS and U2OS cells decreased LSD1 expression and led to H3K4me2 enrichment in the p21 promoter region (Figure 5C; Figure S6C). Overexpression of miR-140 in HOS and U2OS cells decreased LSD1 expression and also promoted H3K4me2 enrichment in the p21 promoter region (Figure 5D; Figure S6D). The above results indicate that miR-140 promotes p21 expression by preventing LSD1 from blocking H3K4me2 methylation of the p21 promoter.
Figure 5.

miR-140 enhances p21 H3K4me2 methylation by regulating the USP22/LSD1 axis in HOS cells
(A) qRT-PCR analysis of LSD1 expression in HOS cells. (B) Western blot for LSD1 and p21 expression in HOS cells. (C) ChIP detection of H3K4me2 enrichment and the presence of LSD1 on the p21 promoter region in HOS cells. (D) Effects of miR-140 overexpression on the enrichment of H3K4me2 and LSD1 on the p21 promoter region in HOS cells. ∗p < 0.05 compared with si-NC group or NC-mimic group. The data comparison between two groups is analyzed by unpaired t test. The comparison among multiple groups is analyzed by one-way ANOVA. Each experiment was repeated three times (n = 3).
miR-140 hinders the malignant phenotypes of osteosarcoma cells via p21
To further validate the function of miR-140 in osteosarcoma by affecting the expression of p21, the expression of p21 in osteoblast cell line and osteosarcoma cell lines was detected by qRT-PCR and western blot. The results showed that p21 expression was significantly lower in osteosarcoma cells compared with osteoblast cells (Figure 6A). Further, we determined the expression of p21 in the osteosarcoma tissues and adjacent normal tissues by qRT-PCR and western blot analysis, which demonstrated that the mRNA and protein levels of LSD1 were diminished in osteosarcoma tissues (Figures S4A and S4B). Two small interfering RNA (siRNA) sequences designed to target p21 effectively inhibited p21 expression in HOS and U2OS cells (Figure 6B; Figure S7A); therefore, siRNA against p21 (si-p21) was selected for subsequent experiments. Western blot results showed that overexpression of miR-140 in HOS and U2OS cells promoted p21 expression, which was reversed by inhibition of p21 (Figure 6C; Figure S7B). Colony-formation assay and flow cytometry results showed that knockdown of p21 promoted proliferation in HOS and U2OS cells, inhibited cell apoptosis, and arrested fewer cells in the G0/G1 phase but more cells arrested in the S and G2/M phase, reversing the effects of miR-140 overexpression on cell proliferation, apoptosis, and cycle progression (Figures 6D−6F; Figures S6D and S6E; Figure S7C). Knockdown of p21 also increased Bcl2 expression in HOS and U2OS cells, whereas the expression of Bax, cleaved caspase-3, and cleaved PARP decreased, overcoming the effects of miR-140 overexpression (Figure 6C; Figure S7B). Transwell assay results showed that knockdown of p21 increased HOS and U2OS cell invasion and migration (Figure 6G; Figure S7F). Moreover, depletion of p21 reduced the expression of E-cadherin but increased the expression of N-cadherin and vimentin, reversing the effects of miR-140 overexpression (Figure 6C; Figure S7B). In conclusion, upregulation of miR-140 removes regulatory constraints on p21 permitting p21 to suppress the progression of osteosarcoma.
Figure 6.

miR-140 suppresses the malignant phenotypes of HOS cells by promoting p21 expression
(A) qRT-PCR analysis of p21 expression in normal osteoblast cells and osteosarcoma cells. (B) qRT-PCR analysis of p21 expression in HOS cells. (C) Expression of USP22, LSD1, p21, Bcl2, BAX, cleaved caspase-3, cleaved PARP, E-cadherin, N-cadherin, and vimentin in HOS cells detected by western blot. (D−F) Analysis of proliferation (D), apoptosis (E), and cell cycle stage (F) of HOS cells using the colony-formation assay and flow cytometry. (G) Transwell assay examining HOS cell invasion and migration. (A) ∗p < 0.05 compared with hFOB1.19 cells. (B) ∗p < 0.05 compared with cells in the si-NC group. (C−G) ∗p < 0.05 compared with cells in the NC-mimic and si-NC group. #p < 0.05 compared with cells in the miR-140-mimic and si-NC group. Comparison of data among multiple groups is analyzed by one-way ANOVA. Each experiment was repeated three times (n = 3).
miR-140 reduces osteosarcoma tumor formation in vivo by suppressing USP22-mediated LSD1 stability and elevating p21 expression
In order to study the effects of miR-140 on USP22 and LSD1 stability, as well as the expression of p21 in vivo, nude mice were injected with lentivirus-based cells with overexpressed miR-140 and silenced p21, followed by measuring tumorigenic capacity, tumor volume, and tumor weight. In addition, the silencing efficiency of short hairpin RNAs (shRNAs) targeting p21 (sh-p21) has been validated in Figures S8A and S8B. The results showed that overexpression of miR-140 dampened tumorigenic capacity, tumor volume, and weight, whereas knockdown of p21 increased tumorigenic capacity, tumor volume, and tumor weight, effectively reversing the results obtained by miR-140 overexpression (Figures 7A and 7B). qRT-PCR results confirmed that mice transfected with cells expressing the miR-140 mimic had increased miR-140 expression (Figure 7C) and that overexpression of miR-140 downregulated USP22 and LSD1, but upregulated p21 expression. Knockdown of p21 also significantly decreased its expression (Figure 7D). TUNEL staining results showed that overexpression of miR-140 promoted tumor cell apoptosis, whereas knockdown of p21 inhibited tumor cell apoptosis and blocked the effects of miR-140 overexpression on tumor cells (Figure 7E). In conclusion, miR-140 suppresses cell tumorigenesis in vivo by regulating the USP22/LSD1/p21 pathway.
Figure 7.

miR-140 suppresses tumorigenesis in vivo by regulating the USP22/LSD1/p21 axis (n = 10)
(A) Quantification for volume of tumors 30 days after xenograft tumor assays. (B) Quantification for weight of tumors 30 days after xenograft tumor assays. (C) Expression of miR-140 in xenograft tumors determined using qRT-PCR. (D) Expression of USP22 and LSD1 in xenograft tumors assessed using western blot. (E) Apoptosis evaluated using TUNEL staining (400×), with TUNNEL-positive cells pointed by arrows. ∗p < 0.05 compared with the NC-mimic and sh-NC group. #p < 0.05 compared with the miR-140-mimic and sh-NC group. Data among multiple groups were analyzed by one-way ANOVA, and tumor volume is analyzed by repeated-measures ANOVA.
Discussion
miRNAs play an important role in regulating gene expression and are implicated in various pathophysiological processes, such as cancer cell invasion and proliferation.17 Emerging evidence suggests that miR-140 may suppress the progression of different malignancies, including gastric cancer,18 osteosarcoma,19 glioma,20 and colorectal cancer.21 In this study, we aim to identify putative targets and a downstream molecular mechanism that explains how miR-140 regulates osteosarcoma growth. The results suggest that miR-140 might represent a novel therapeutic target in the treatment of osteosarcoma.
We first identified that miR-140 was poorly expressed in osteosarcoma tissues and cells, consistent with a previous study, where its expression was also low in osteosarcoma.22 Furthermore, upregulation of miR-140 decreased Bcl2 expression, an anti-apoptotic protein, whereas increased the expression of pro-apoptotic proteins Bax and cleaved caspase-3.23 Upregulation of miR-140 also increase cleaved PARP expression, a marker for caspase-dependent apoptosis.24 Therefore, we inferred that overexpression of miR-140 induced cell apoptosis. Moreover, Transwell assay results indicated E-cadherin expression was elevated, whereas N-cadherin and vimentin expression was dampened after miR-140 overexpression. E-cadherin, N-cadherin, and vimentin are known as EMT-associated proteins.25 Inhibition of cell migration and invasion is characterized by increased E-cadherin and reduced N-cadherin and vimentin expression;26 therefore, overexpression of miR-140 appears to suppress cell invasion and migration of osteosarcoma cells. The inhibition of proliferation, migration, and invasion, along with increased apoptosis in osteosarcoma cells, was associated with impaired tumor growth in vivo.27 Taken above, we proposed that overexpression of miR-140 impaired tumor growth of osteosarcoma by suppressing osteosarcoma cell migration, invasion, and promoting apoptosis.
Bioinformatic and correlation analysis suggested that miR-140 targeted USP22 for downregulation. USP22 was previously reported to be highly expressed in both osteosarcoma tissues and cell lines and to facilitate cell migration and invasion while suppressing cell apoptosis,11 consistent with our results. However, the relationship between miR-140 and USP22 has not been well studied. To our knowledge, we are the first to confirm that miR-140 targets USP22 in osteosarcoma.
USP22 is thought to stabilize LSD1 expression by promoting deubiquitination.28 Ubiquitin-like proteins are reported to participate in the development of osteosarcoma by modulating ubiquitination.29 Increased LSD1 expression is connected to the pathology and progression of osteosarcoma.30 Coincidentally, we also found increased LSD1 expression after USP22 was overexpressed in osteosarcoma cells treated with the protein synthesis inhibitor, CHX.31 Under such conditions, knockdown of USP22 reduced the protein level of LSD1, which may restrain osteosarcoma progression.
Furthermore, the evidence collected from our study showed that miR-140 upregulated p21 expression through the USP22/LSD1 pathway. Furthermore, LSD1-regulated H3K4me2 demethylation of p21 reduced its expression in gastric cancer.15 Moreover, p21 is considered as a tumor suppressor in osteosarcoma.16 The suppressed cell growth of osteosarcoma cells was consistent with induced p21 protein expression,32 consistent with our findings. Moreover, the inhibition of p21 expression resulted in enhanced proliferation of osteosarcoma cells, thus promoting cell cycle progression.33 Our study suggests that the miR-140/USP22/LSD1/p21 axis regulates tumorigenesis in vivo. Overexpression of miR-140 decreased xenograft tumor volume and weight by downregulating USP22 and LSD1 and upregulating p21. Since decreased tumor volume and weight are associated with weakened tumorigenesis,34 we believed that miR-140 was able to curtail the osteosarcoma tumor growth.
The results of this study suggest that miR-140 is a potential therapeutic target for osteosarcoma, because it inhibits the expression of USP22 and reduces LSD1 protein level. This leads to elevated p21 expression and inhibition of cell cycle progression, proliferation, invasion, and migration in osteosarcoma cells. Although our results provide a framework for the use of miRNA-based technologies in the treatment of osteosarcoma, more studies are needed before this treatment could be translated into human use. Moreover, the significance of miR-140 in osteosarcoma patients should be explored in the clinical setting in the future.
Materials and methods
Ethical statement
The study protocol was ratified by the Ethics Committee of The First Hospital of Jilin University. Informed consents were obtained from all patients. All animal experiments were approved by the Animal Ethics Committee of The First Hospital of Jilin University.
Collection of clinical specimens
Sixty-five pairs of osteosarcoma specimens with detailed clinical data and adjacent normal tissues (away from osteosarcoma tissues >4 cm) were collected from osteosarcoma patients (40 males; 25 females; aged 10−42 years with a mean age of 21.29 ± 7.83 years). Patients were subjected to surgery in The First Hospital of Jilin University from January 2016 to December 2018, which was confirmed by pathological examination. None of the enrolled patients received chemoradiotherapy before surgery. There were 37 cases of patients ≤20 years old, 28 cases of patients >20 years old, 33 cases of tumor diameter ≤5 cm, and 32 cases of tumor diameter >5 cm.
Cell culture and transfection
All cell lines and culture medium used in this study were purchased from Cobioer (Nanjing, P.R. China). Human osteoblast cells hFOB1.19 (CBP60724) were cultured in a Dulbecco’s modified Eagle’s medium (DMEM) containing 0.3 mg/mL geneticin (G418) and 10% fetal bovine serum (FBS). A total of 5 osteosarcoma cell lines—U2OS (CBP60238), SaOS-2 (CB P60742), MG63 (CBP60233), HOS (CBP60787), and SJSA1 (CBP60236)—were cultured in differently conditioned medium. Specifically, U2OS was cultured in McCoy’s 5A modified medium (McCoy’s 5A) containing 10% FBS, SaOS-2 in McCoy’s 5A with 15% FBS, MG63 in minimum essential medium (MEM) with 10% FBS, and HOS and SJSA1 in Roswell Park Memorial Institute-1640 (RPMI-1640) medium with 10% FBS.
Osteosarcoma cells in logarithmic growth phase were transfected with miR-140 mimic and/or plasmid containing siRNA against USP22 (si-USP22), LSD1 overexpression vector (oe-LSD1), siRNA against LSD1 (si-LSD1), si-p21, and empty vector or relevant negative control (NC mimic; si-NC or oe-NC). All plasmids were synthesized by GenePharma (Shanghai, P.R. China). Cells were seeded in 6-well plates at a density of 3 × 10⁵ cells/well. Cells at 50% confluency were transfected with the aforesaid plasmids according to the Lipofectamine 2000 instructions (11668-019; Invitrogen, Carlsbad, CA, USA). Then, 4 μg target plasmid, 100 μM siRNA, and 10 μL Lipofectamine 2000 were each diluted with 250 μL serum-free Opti-MEM (51985042; Gibco, Gaithersburg, MD, USA), followed by mixture. After standing at room temperature for 5 min, the liquids were mixed evenly. After standing for 15 min, the mixture was added dropwise to the cell culture wells, shaken, and then placed in a 37°C, 5% CO2 incubator to continue culture, followed by the replacement of the medium after 6 h. After 48 h transfection, cells were collected for subsequent experiments.
Dual luciferase reporter gene assay
The USP22 3′ untranslated region (3′ UTR) fragment containing the miR-140 binding site was inserted into the pGL3 plasmid to construct the luciferase reporter vector. A USP22-3′ UTR-mutated (MUT) fragment, in which the binding site contained a MUT sequence, was also constructed and inserted into the pGL3 plasmid. Then, recombinant vectors pGL3-USP22-3′ UTR, pGL3-USP22-3′ UTR-MUT, and Renilla internal reference plasmid were co-transfected into HEK293T cells with miR-140 mimic or NC mimic, respectively, using Liposome transfection. After transfection for 48 h, the cells were collected and lysed. The luciferase detection kit (K801-200; BioVision Technologies, Milpitas CA, USA) and a dual luciferase reporter gene analysis system (Promega, Madison, WI, USA) were performed with Renilla luciferase as an internal reference. The activation of the target gene was compared according to the ratio of the Firefly luciferase relative light unit (RLU) to the Renilla luciferase RLU.
RNA isolation and quantification
Total RNA was extracted from tissues and cells using TRIzol reagent (16096020; Thermo Fisher Scientific, NY, USA) and reverse transcribed into complementary DNA (cDNA) following the instructions of the cDNA kit (5 μg; K1622; Fermentas, ON, Canada). qRT-PCR was performed by following the manual protocols provided by the TaqMan Gene Expression Assays Kit (Applied Biosystems, Foster City, CA, USA) with U6 or glyceraldehyde-3-phosphate dehydrogenase (GAPDH) as internal controls. The primers used are listed in Table 2, and the relative expression was measured using the 2ΔΔCT method.
Table 2.
Primer sequences for qRT-PCR
| Gene | Primer sequences |
|---|---|
| miR-140 | F 5′-GCGGCAGTGGTTTTACCCTATG-3′ |
| R 5′-CCAGTGCAGGGTCCGAGGT-3′ | |
| USP22 | F 5′-CCATTGATCTGATGTACGGAGG-3′ |
| R 5′-TCCTTGGCGATTATTTCCATGTC-3′ | |
| LSD1 | F 5′-GCTCGGGGCTCTTATTCCTA-3′ |
| R 5′-CCCAAAAACTGGTCTGCAAT-3′ | |
| p21 | F 5′-GTCCACTGGGCCGAAGAG-3′ |
| R 5′-TGCGTTCACAGGTGTTTCTG-3′ | |
| U6 | F 5′-GCTTGCTTCAGCAGCACATA-3′ |
| R 5′-AAAAACATGGAACTCTTCACG-3′ | |
| GAPDH | F 5′-AGAAGGCTGGGGCTCATTTG-3′ |
| R 5′-AGGGGCCATCCACAGTCTTC-3′ |
F, forward; R, reverse; USP22, ubiquitin-specific protease 22; LSD1, lysine-specific demethylase 1; GAPDH, glyceraldehyde-3-phosphate dehydrogenase; qRT-PCR, quantitative reverse transcription polymerase chain reaction.
Western blot
Total protein was extracted by the Radioimmunoprecipitation Assay (RIPA) Kit (R0010; Beijing Solarbio Technology, Beijing, P.R. China), and protein concentration was determined by the Bicinchoninic Acid (BCA) Protein Assay Kit (GBCBIO Technology, Guangzhou, P.R. China). A total of 40 μg samples were loaded and separated by 10% sodium dodecyl sulfate polyacrylamide gel electrophoresis, which was transferred onto a polyvinylidene fluoride membrane (Millipore, MA, USA). Membrane was blocked at room temperature with TBST solution containing 5% bovine serum albumin (BSA) and incubated with diluted primary rabbit anti-USP22 (1:2,000, ab195289; Abcam, Cambridge, UK), anti-LSD1 (1:1,000, ab17721; Abcam), anti-p21 (1:1,000, ab218311; Abcam), anti-Bcl2 (1:1,000, ab182858; Abcam), anti-Bax (1:1,000, ab182734; Abcam), anti-cleaved caspase-3 (1:500, ab32042; Abcam), anti-cleaved PARP (1:2,000, ab32064; Abcam), anti-E-cadherin (1:1,000, ab201499; Abcam), anti-N-cadherin (1:1,000, ab18203; Abcam), anti-vimentin (1:1,000, ab20346; Abcam), as well as GAPDH (1:1,000, ab128915; Abcam) overnight at 4°C. Subsequently, secondary antibody goat anti-rabbit immunoglobulin G (IgG) antibody (ab97051, 1:2,000; Abcam) or secondary antibody goat anti-mouse IgG antibody (ab205719, 1:2,000; Abcam) was added into the membrane, and membranes were incubated on a shaker at room temperature. The protein bands were developed using enhanced chemiluminescence in an Image Quant LAS 4000C gel imager (GE Healthcare, USA).
IHC
The paraffin sections of osteosarcoma tissues were placed in an oven at 60°C for 30 min, dewaxed, and hydrated with toluene I, xylene II, and gradient alcohol for 5 min each, successively. The antigens were retrieved using 1 mM Tris-ethylene diamine tetraacetic acid (pH 8.0) in a microwave and then cooled to room temperature. Endogenous peroxidase (POD) was blocked with 3% H2O2-methanol for 10 min at room temperature. Primary antibody against USP22 (1:500, ab195289; Abcam) was added into the sections, which were incubated overnight in a refrigerator at 4°C. On the next day, the sections were incubated with polymer enhancer (PV-9000; ZSGB-Bio, Beijing, P.R. China) at room temperature for 20 min. Enzyme-labeled anti-mouse/rabbit polymer (PV-9000; ZSGB-Bio) was dripped into sections, which were incubated for 30 min at room temperature and then developed with diaminobenzidine for 5 min. After the development was terminated by the addition of distilled water, sections were counterstained by hematoxylin and turned blue after differentiation. Finally, slides were dehydrated, permeabilized, mounted with neutral gum, and observed under an inverted microscope (CX41; Olympus, Tokyo, Japan).
CoIP
The osteosarcoma cells U2OS and HOS were transfected with si-NC or si-USP22 for 48 h and placed on ice. The cells were lysed with IP lysis buffer (Pierce Biotechnology, Rockford, IL, USA) for 30 min on ice, followed by centrifugation at 14,800 rpm at 4°C for 20 min, which was transferred into new Eppendorf tubes. Protein concentration was measured by the BCA method. Each sample tube was incubated with primary anti-LSD1 (1:1,000, ab129473, rabbit; Abcam) overnight at 4°C, whereas 20 μL protein A and G beads were added into the tubes the next morning. After incubation for 2 h, the impurities were eluted by IP lysis buffer for 5 times and centrifuged at 2,500 rpm, 4°C for 5 min. After the removal of supernatant, 20 μL 2× loading buffer was added to each well and denatured in a metal bath at 100°C for 5 min. IP-bound samples were immunoblotted with antibodies against USP22 (1:2,000, ab195289; Abcam).
ChIP
A ChIP assay was performed using the EZ-Magna ChIP Kit (EMD Millipore, MA, USA), according to the manufacturer’s protocol. Cells were fixed with 4% paraformaldehyde and incubated with glycine for 10 min to produce DNA-protein crosslinks. Then, cells were lysed with cell lysis buffer, as well as nuclear lysis buffer, and broken into chromatin fragments 200−300 bp in size using ultrasonication. Next, the lysate was immunoprecipitated with magnetic protein A beads bound to the antibodies. With rabbit IgG (ab171870; Abcam) as NC, antibodies against LSD1 (ab17721; Abcam) and H3K4me2 (ab8898; Abcam) were added into cells.
Analysis of protein stability
To determine the stability of USP22 and LSD1 proteins, osteosarcoma cells transfected with si-USP22 or miR-140-mimic were treated with RIPA lysate (P0013B; Beyotime Biotechnology, Shanghai, P.R. China), respectively. Then, after 36 h, the cells were treated with tunicamycin (654380; Sigma-Aldrich, St. Louis, MO, USA) and 20 μM cycloheximide (HY-12320; MCE) to inhibit protein synthesis, followed by the protein extraction at 0 h, 2 h, 4 h, and 6 h and detection of USP22 and LSD1 expression by western blot. The degradation curves of USP22 and LSD1 were plotted.
Colony-formation assay
HOS and U2OS cells were cultured in 6-well plates with 300 cells per well, followed by continuous culture in serum-free DMEM containing 10 μM TSC01131 and TSC01682. The growth of cells was observed during the culture. After 2 weeks, the culture was terminated when clones were observed by naked eye in the cultured dish. Cells were fixed by 5 mL methanol solution for 15 min, stained with Giemsa staining solution for 30 min, washed with running water, and air dried. Clones were counted using a transparent film with a grid.
Flow cytometry
After 48 h transfection, the cells were incubated with 0.5 mL of 0.25% trypsin until the cells falling off from the culture plate were observed under the microscope. The cells were gently resuspended in the previously collected medium and adjusted to a density of 1 × 10⁶ cells/mL. Meanwhile, 0.5 mL (5 × 10⁵) of cell suspension was transferred from the cell culture plate into a clean centrifuge tube and stained by staining solution. Cells were further resuspended using 0.5 mL pre-cooled 1 × binding buffer and then incubated with 5 μL Annexin V- fluorescein isothiocyanate (FITC) and 10 μL propidium iodide (PI) in the dark for 15 min. Cell apoptosis was detected by flow cytometry (FACSVerse/FACSCalibur/AriaIISORP; Becton Dickinson [BD], USA), and the experiment was repeated 3 times. The kits used in this experiment were obtained from Beyotime Biotechnology (Shanghai, P.R. China).
Cell cycle distribution was measured after preparing a single cell suspension for each condition using 0.25% trypsin. Cells were then fixed with 70% ethanol overnight at 4°C. The next day, cells were resuspended by shaking, centrifuged, and washed twice with pre-cooled PBS. The cells were resuspended in 100 μL of PBS, and the concentration of cells was adjusted to 1 mg/mL by the addition of RNase. Then, 30 min of water bath was conducted at 37°C, with cell final concentration adjusted to 50 μg/mL by PI staining for 40 min in the dark at 4°C. The DNA content of the cell cycle was determined at greater than 575 nm, and the cell cycle percentage was measured.
Transwell assay
Cells in logarithmic growth phase were starved for 24 h. The next day, cells were adjusted to a final concentration of 2 × 10⁵/mL. A total of 0.2 mL cell suspension was added into the apical Transwell chamber, while 700 μL DMEM culture solution containing 10% FBS was added to the basolateral chamber. Cells were cultured in an incubator at 5% CO2 and 37°C. After 24 h, the Transwell chambers were removed, and cells were fixed with methanol for 30 min, stained with 0.1% crystal violet staining solution for 20 min, air dried, observed, and photographed under an inverted microscope with 5 fields randomly selected to count the number of cells that crossed the membrane.
To detect cell invasion, 70 μL extracellular matrix (ECM) gel was added into Transwell chambers, which were incubated at 37°C for 0.5 h. The subsequent procedures were similar to the methods in the cell migration assay mentioned above. The experiment was repeated three times.
Xenograft tumors in nude mice
BALB/c nude mice (aged 4 weeks; weighing 18−25 g; n = 40; irrespective of gender) were commercially obtained from SJA Laboratory Animal (Hunan, P.R. China) and housed in a specific pathogen-free condition with 10 mice in each group. Each mouse was injected with 5 × 10³ HOS cells stably transfected with miR-140 mimic, sh-p21, or relevant NC (NC mimic or sh-NC). At day 5 after injection, tumor volume was measured every 5 days until 30 days postinjection. Mice were sacrificed by carbon dioxide asphyxiation after xenograft tumor assay.
TUNEL staining
Tumor tissues were fixed by 4% paraformaldehyde, paraffin embedded, and sectioned into a thickness of 5 μm. A total of 5 sections were incubated with 1% proteinase K diluent (50 μL) at 37°C for 30 min, and endogenous POD activity was removed by the addition of 0.3% H2O2 methanol solution at 37°C. Sections were incubated with TUNEL reaction solution and protected from light at 37°C for 1 h and 50 μL converter-POD at 37°C for 30 min. Color was developed using 2% DAB at room temperature for 15 min. Under the microscope, cells were brownish yellow nuclei counterstained by hematoxylin, conventionally dehydrated, and mounted using neutral gum. Sections were observed under a light microscope with 10 visual fields randomly chosen for each section. Apoptosis-positive cells were defined as those cells with brownish-yellow nuclei.
Statistical analysis
All statistical data were processed using SPSS 21.0 software (SPSS, Armonk, NY, USA). Measurement data were presented as mean ± standard deviation (SD). Comparison of osteosarcoma tissues with adjacent normal tissues was performed using paired t test. Other data between two groups were compared using unpaired t tests. Data among multiple groups were analyzed using one-way analysis of variance (ANOVA), whereas data at different time points were compared using repeated-measures ANOVA. The correlation between miR-140 and USP22 was analyzed by Pearson’s correlation coefficient. A p <0.05 was considered as statistically significant.
Acknowledgments
We acknowledge and appreciate our colleagues for their valuable suggestions and technical assistance for this study.
Author contributions
W.L. and D.W. conducted the experiments. L.W. and M.Y. collected the data. W.L. and L.W. designed the experiments. L.L. and M.Y. wrote the paper. All authors have read and approved the final submitted manuscript.
Declaration of interests
The authors declare no competing interests.
Footnotes
Supplemental information can be found online at https://doi.org/10.1016/j.omtn.2021.01.029.
Contributor Information
Lin Wang, Email: wanglinjdyy@jlu.edu.cn.
Ming Yan, Email: yanmingdr@163.com.
Supplemental information
References
- 1.Morrow J.J., Khanna C. Osteosarcoma Genetics and Epigenetics: Emerging Biology and Candidate Therapies. Crit. Rev. Oncog. 2015;20:173–197. doi: 10.1615/critrevoncog.2015013713. [DOI] [PMC free article] [PubMed] [Google Scholar]
- 2.Geller D.S., Gorlick R. Osteosarcoma: a review of diagnosis, management, and treatment strategies. Clin. Adv. Hematol. Oncol. 2010;8:705–718. [PubMed] [Google Scholar]
- 3.Moukengue B., Brown H.K., Charrier C., Battaglia S., Baud’huin M., Quillard T., Pham T.M., Pateras I.S., Gorgoulis V.G., Helleday T. TH1579, MTH1 inhibitor, delays tumour growth and inhibits metastases development in osteosarcoma model. EBioMedicine. 2020;53:102704. doi: 10.1016/j.ebiom.2020.102704. [DOI] [PMC free article] [PubMed] [Google Scholar]
- 4.Miwa S., Yamamoto N., Hayashi K., Takeuchi A., Igarashi K., Tsuchiya H. Therapeutic Targets for Bone and Soft-Tissue Sarcomas. Int. J. Mol. Sci. 2019;20:170. doi: 10.3390/ijms20010170. [DOI] [PMC free article] [PubMed] [Google Scholar]
- 5.Poos K., Smida J., Nathrath M., Maugg D., Baumhoer D., Korsching E. How microRNA and transcription factor co-regulatory networks affect osteosarcoma cell proliferation. PLoS Comput. Biol. 2013;9:e1003210. doi: 10.1371/journal.pcbi.1003210. [DOI] [PMC free article] [PubMed] [Google Scholar]
- 6.Lulla R.R., Costa F.F., Bischof J.M., Chou P.M., de F Bonaldo M., Vanin E.F., Soares M.B. Identification of Differentially Expressed MicroRNAs in Osteosarcoma. Sarcoma. 2011;2011:732690. doi: 10.1155/2011/732690. [DOI] [PMC free article] [PubMed] [Google Scholar]
- 7.Ma G., Zhang C., Luo W., Zhao J.L., Wang X., Qian Y. Construction of microRNA-messenger networks for human osteosarcoma. J. Cell. Physiol. 2019;234:14145–14153. doi: 10.1002/jcp.28107. [DOI] [PubMed] [Google Scholar]
- 8.Ji X., Wang E., Tian F. MicroRNA-140 suppresses osteosarcoma tumor growth by enhancing anti-tumor immune response and blocking mTOR signaling. Biochem. Biophys. Res. Commun. 2018;495:1342–1348. doi: 10.1016/j.bbrc.2017.11.120. [DOI] [PubMed] [Google Scholar]
- 9.Meng Y., Gao R., Ma J., Zhao J., Xu E., Wang C., Zhou X. MicroRNA-140-5p regulates osteosarcoma chemoresistance by targeting HMGN5 and autophagy. Sci. Rep. 2017;7:416. doi: 10.1038/s41598-017-00405-3. [DOI] [PMC free article] [PubMed] [Google Scholar]
- 10.Zhibo Q., Lianxin L. Ubiquitin-specific protease 22 is associated with poor prognosis in neuroblastoma. Adv. Clin. Exp. Med. 2020;29:295–300. doi: 10.17219/acem/115089. [DOI] [PubMed] [Google Scholar]
- 11.Zhang D., Jiang F., Wang X., Li G. Downregulation of Ubiquitin-Specific Protease 22 Inhibits Proliferation, Invasion, and Epithelial-Mesenchymal Transition in Osteosarcoma Cells. Oncol. Res. 2017;25:743–751. doi: 10.3727/096504016X14772395226335. [DOI] [PMC free article] [PubMed] [Google Scholar]
- 12.Niwa H., Sato S., Handa N., Sengoku T., Umehara T., Yokoyama S. Development and Structural Evaluation of N-Alkylated trans-2-Phenylcyclopropylamine-Based LSD1 Inhibitors. ChemMedChem. 2020;15:787–793. doi: 10.1002/cmdc.202000014. [DOI] [PubMed] [Google Scholar]
- 13.Gu F., Lin Y., Wang Z., Wu X., Ye Z., Wang Y., Lan H. Biological roles of LSD1 beyond its demethylase activity. Cell. Mol. Life Sci. 2020;77:3341–3350. doi: 10.1007/s00018-020-03489-9. [DOI] [PMC free article] [PubMed] [Google Scholar]
- 14.Yang L., Ge D., Chen X., Qiu J., Yin Z., Zheng S., Jiang C. FOXP4-AS1 participates in the development and progression of osteosarcoma by downregulating LATS1 via binding to LSD1 and EZH2. Biochem. Biophys. Res. Commun. 2018;502:493–500. doi: 10.1016/j.bbrc.2018.05.198. [DOI] [PubMed] [Google Scholar]
- 15.Liu Y.W., Xia R., Lu K., Xie M., Yang F., Sun M., De W., Wang C., Ji G. LincRNAFEZF1-AS1 represses p21 expression to promote gastric cancer proliferation through LSD1-Mediated H3K4me2 demethylation. Mol. Cancer. 2017;16:39. doi: 10.1186/s12943-017-0588-9. [DOI] [PMC free article] [PubMed] [Google Scholar]
- 16.Fujii R., Osaka E., Sato K., Tokuhashi Y. MiR-1 Suppresses Proliferation of Osteosarcoma Cells by Up-regulating p21 via PAX3. Cancer Genomics Proteomics. 2019;16:71–79. doi: 10.21873/cgp.20113. [DOI] [PMC free article] [PubMed] [Google Scholar]
- 17.Chang J., Yao M., Li Y., Zhao D., Hu S., Cui X., Liu G., Shi Q., Wang Y., Yang Y. MicroRNAs for osteosarcoma in the mouse: a meta-analysis. Oncotarget. 2016;7:85650–85674. doi: 10.18632/oncotarget.13333. [DOI] [PMC free article] [PubMed] [Google Scholar]
- 18.Zhu F., Li Q., Yang Y., Wang L., Wang J. Propofol Suppresses Proliferation, Migration, Invasion And Promotes Apoptosis By Upregulating microRNA-140-5p In Gastric Cancer Cells. OncoTargets Ther. 2019;12:10129–10138. doi: 10.2147/OTT.S225360. [DOI] [PMC free article] [PubMed] [Google Scholar] [Retracted]
- 19.Xiao Q., Huang L., Zhang Z., Chen X., Luo J., Zhang Z., Chen S., Shu Y., Han Z., Cao K. Overexpression of miR-140 Inhibits Proliferation of Osteosarcoma Cells via Suppression of Histone Deacetylase 4. Oncol. Res. 2017;25:267–275. doi: 10.3727/096504016X14732510786564. [DOI] [PMC free article] [PubMed] [Google Scholar]
- 20.Zhang R., Zhu J.C., Hu H., Lin Q.Y., Shao W., Ji T.H. MicroRNA-140-5p suppresses invasion and proliferation of glioma cells by targeting glutamate-ammonia ligase (GLUL) Neoplasma. 2020;67:371–378. doi: 10.4149/neo_2020_190514N432. [DOI] [PubMed] [Google Scholar]
- 21.Jiang W., Li T., Wang J., Jiao R., Shi X., Huang X., Ji G. miR-140-3p Suppresses Cell Growth And Induces Apoptosis In Colorectal Cancer By Targeting PD-L1. OncoTargets Ther. 2019;12:10275–10285. doi: 10.2147/OTT.S226465. [DOI] [PMC free article] [PubMed] [Google Scholar]
- 22.Zhao Z.Y., Zhao Y.C., Liu W. Long non-coding RNA TUG1 regulates the progression and metastasis of osteosarcoma cells via miR-140-5p/PFN2 axis. Eur. Rev. Med. Pharmacol. Sci. 2019;23:9781–9792. doi: 10.26355/eurrev_201911_19541. [DOI] [PubMed] [Google Scholar]
- 23.Wu L.Y., Enkhjargal B., Xie Z.Y., Travis Z.D., Sun C.M., Zhou K.R., Zhang T.Y., Zhu Q.Q., Hang C.H., Zhang J.H. Recombinant OX40 attenuates neuronal apoptosis through OX40-OX40L/PI3K/AKT signaling pathway following subarachnoid hemorrhage in rats. Exp. Neurol. 2020;326:113179. doi: 10.1016/j.expneurol.2020.113179. [DOI] [PubMed] [Google Scholar]
- 24.Won Y.S., Seo K.I. Sanggenol L promotes apoptotic cell death in melanoma skin cancer cells through activation of caspase cascades and apoptosis-inducing factor. Food Chem. Toxicol. 2020;138:111221. doi: 10.1016/j.fct.2020.111221. [DOI] [PubMed] [Google Scholar]
- 25.Liang W., Gao R., Yang M., Wang X., Cheng K., Shi X., He C., Li Y., Wu Y., Shi L. MARCKSL1 promotes the proliferation, migration and invasion of lung adenocarcinoma cells. Oncol. Lett. 2020;19:2272–2280. doi: 10.3892/ol.2020.11313. [DOI] [PMC free article] [PubMed] [Google Scholar]
- 26.Duan J., Shi J., Ma X., Xuan Y., Li P., Wang H., Fan Y., Gong H., Wang L., Pang Y. Esculetin inhibits proliferation, migration, and invasion of clear cell renal cell carcinoma cells. Biomed. Pharmacother. 2020;125:110031. doi: 10.1016/j.biopha.2020.110031. [DOI] [PubMed] [Google Scholar]
- 27.Yin R., Liu J., Zhao D., Wang F. Long Non-Coding RNA ASB16-AS1 Functions as a miR-760 Sponge to Facilitate the Malignant Phenotype of Osteosarcoma by Increasing HDGF Expression. OncoTargets Ther. 2020;13:2261–2274. doi: 10.2147/OTT.S240022. [DOI] [PMC free article] [PubMed] [Google Scholar] [Retracted]
- 28.Zhou A., Lin K., Zhang S., Chen Y., Zhang N., Xue J., Wang Z., Aldape K.D., Xie K., Woodgett J.R., Huang S. Nuclear GSK3β promotes tumorigenesis by phosphorylating KDM1A and inducing its deubiquitylation by USP22. Nat. Cell Biol. 2016;18:954–966. doi: 10.1038/ncb3396. [DOI] [PMC free article] [PubMed] [Google Scholar]
- 29.Yi X., Deng X., Zhao Y., Deng B., Deng J., Fan H., Du Y., Hao L. Ubiquitin-like protein FAT10 promotes osteosarcoma growth by modifying the ubiquitination and degradation of YAP1. Exp. Cell Res. 2020;387:111804. doi: 10.1016/j.yexcr.2019.111804. [DOI] [PubMed] [Google Scholar]
- 30.Bennani-Baiti I.M., Machado I., Llombart-Bosch A., Kovar H. Lysine-specific demethylase 1 (LSD1/KDM1A/AOF2/BHC110) is expressed and is an epigenetic drug target in chondrosarcoma, Ewing’s sarcoma, osteosarcoma, and rhabdomyosarcoma. Hum. Pathol. 2012;43:1300–1307. doi: 10.1016/j.humpath.2011.10.010. [DOI] [PubMed] [Google Scholar]
- 31.Su L., Guo W., Lou L., Nie S., Zhang Q., Liu Y., Chang Y., Zhang X., Li Y., Shen H. EGFR-ERK pathway regulates CSN6 to contribute to PD-L1 expression in glioblastoma. Mol. Carcinog. 2020;59:520–532. doi: 10.1002/mc.23176. [DOI] [PubMed] [Google Scholar]
- 32.Zhao X., Yang Y., Xu J., Luo Y., Xin Y., Wang Y. Downregulation of microRNA-95-3p suppresses cell growth of osteosarcoma via CDKN1A/p21 expression. Oncol. Rep. 2018;39:289–297. doi: 10.3892/or.2017.6065. [DOI] [PubMed] [Google Scholar]
- 33.He Y., Yu B. MicroRNA-93 promotes cell proliferation by directly targeting P21 in osteosarcoma cells. Exp. Ther. Med. 2017;13:2003–2011. doi: 10.3892/etm.2017.4204. [DOI] [PMC free article] [PubMed] [Google Scholar] [Retracted]
- 34.Zhang N., Liu F.L., Ma T.S., Zhang Z.Z.J. LncRNA SNHG1 contributes to tumorigenesis and mechanism by targeting miR-338-3p to regulate PLK4 in human neuroblastoma. Eur. Rev. Med. Pharmacol. Sci. 2019;23:8971–8983. doi: 10.26355/eurrev_201910_19296. [DOI] [PubMed] [Google Scholar]
Associated Data
This section collects any data citations, data availability statements, or supplementary materials included in this article.