

Summary
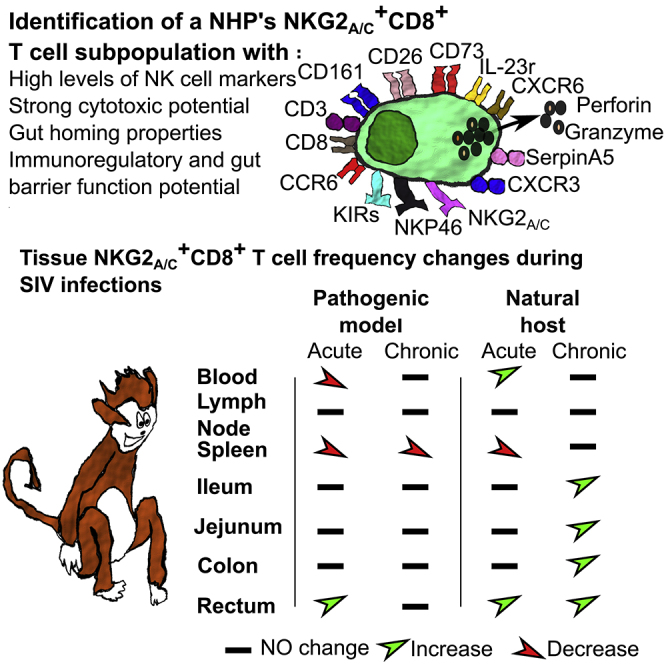
Some viruses have established an equilibrium with their host. African green monkeys (AGM) display persistent high viral replication in the blood and intestine during Simian immunodeficiency virus (SIV) infection but resolve systemic inflammation after acute infection and lack intestinal immune or tissue damage during chronic infection. We show that NKG2a/c+CD8+ T cells increase in the blood and intestine of AGM in response to SIVagm infection in contrast to SIVmac infection in macaques, the latter modeling HIV infection. NKG2a/c+CD8+ T cells were not expanded in lymph nodes, and CXCR5+NKG2a/c+CD8+ T cell frequencies further decreased after SIV infection. Genome-wide transcriptome analysis of NKG2a/c+CD8+ T cells from AGM revealed the expression of NK cell receptors, and of molecules with cytotoxic effector, gut homing, and immunoregulatory and gut barrier function, including CD73. NKG2a/c+CD8+ T cells correlated negatively with IL-23 in the intestine during SIVmac infection. The data suggest a potential regulatory role of NKG2a/c+CD8+ T cells in intestinal inflammation during SIV/HIV infections.
Subject Areas: Immunology, Viral Microbiology, Transcriptomics
Graphical abstract
Highlights
-
•
Molecular determination of NKG2a/c+CD8+ T cells in two species of nonhuman primates
-
•
Tissue distribution of NKG2a/c+CD8+ T cell is profoundly sculpted by SIV infections
-
•
Intestinal NKG2a/c+CD8+ T cells correlated negatively with IL-23 in SIV infection
-
•
NKG2a/c+CD8+ T cells might play a protective gut barrier function in HIV/SIV infection
Immunology ; Viral Microbiology ; Transcriptomics
Introduction
The implementation of combined antiretroviral therapy (ART) to treat HIV infection has been an incredible success and has saved millions of lives. Antiretroviral treatment reduces viremia to undetectable levels in the blood of people living with HIV (PLWH). However, a residual inflammation persists in most PLWH, despite virological suppression, in particular in those individuals who started ART in the chronic phase of infection, which still today is the case most often (Hunt et al., 2011). HIV-1 infection induces damages to the tissues, already at very early stages of infection. For instance, collagen deposition is observed in B cell follicles of the intestine and lymph nodes (LNs) already in HIV-1 primary infection causing fibrosis and a disruption of the follicular dendritic cell (FDC) network (Zeng et al., 2012). The integrity of the intestinal barrier is also damaged during HIV infection leading to microbial translocation in chronic infection, which most likely fuels systemic inflammation (Brenchley et al., 2010). ART initiated in chronic infection does not fully restore these tissue damages (Hunt et al., 2014). Antiretroviral treatment initiated in acute HIV infection can avoid follicle damage in the intestine and restore intestinal Th17 cell levels, but does not fully restore the functional activity of these cells (Schuetz et al., 2014).
CD8+ T cells are critical in the control of viral replication and tumor cells (Cao et al., 2018; Collins et al., 2020). However, CD8+ T cells are highly affected by a persistent antigenic stimulation and chronic inflammation. In such settings, CD8+ T cells up-regulate immune checkpoint inhibitors, such as PD-1, CTLA-4, Lag-3, or Tim-3 (Blackburn et al., 2008; Day et al., 2006; Kaufmann and Walker, 2009; Trautmann et al., 2006). Such inhibitory receptors are generally induced to dampen inflammation, for example, for the resolution of an infection-induced inflammation that otherwise would be harmful for the tissues (Thangamathesvaran et al., 2018). However, it facilitates T cell exhaustion and is hampering the antiviral efficacy of the cells (Odorizzi and Wherry, 2012).
Inhibitory natural killer (NK) cell receptors, such as NKG2A, can also be induced on CD8+ T cells (Mingari et al., 2019; Thimme et al., 2005; Vivier and Anfossi, 2004). The expression of NKG2A can be induced on human CD8+ T cells after T cell receptor (TCR) triggering and is differentially modulated by cytokines such as IL-6, IL-10, IL-21, IL-15, and TGF-β depending on the conditions (Bertone et al., 1999; Cho et al., 2011; Derre et al., 2002; Kim and Cantor, 2011; Maria et al., 1997; Mingari et al., 1998; Suvas et al., 2006). Commitment to expression of the inhibitory NKG2A generally is a clonal attribute restricted to a subset of memory/effector CD8+ T cells (Jabri et al., 2002). NKG2A marks a unique immune effector T CD8+ subset preferentially co-expressing tissue-resident markers, but not immune checkpoint inhibitors (Eugène et al., 2020; Sun et al., 2019). NKG2A has been implicated in the down-regulation of T cell function in various cancers and diminished responses against some viral infections, such as chronic hepatitis C virus infection (Mingari et al., 1995; van Montfoort et al., 2018; Moser et al., 2002; Nattermann et al., 2006; Noppen et al., 1998), By contrast, NKG2A+CD8+ T cells were also found in other infections to be more efficient at protecting against viral challenge than their counterparts. For example, NKG2A does not inhibit responses against LCMV and even optimizes CD8+ T cell responses during some viral infections, such as acute poxvirus infection (Byers et al., 2006; Miller et al., 2002; Rapaport et al., 2015),. A regulatory function of the NKG2a/c+ CD8+ T cells is also not excluded (Keynan et al., 2008). Dynamic changes in blood and intestinal NKG2A+ T cells can reflect immune responses mounted against intestinal injuries (Katsurada et al., 2012). In mice models it has been shown that NKG2A+ T cells can be expanded in the intestine to prevent tissue damages resulting from excessive immune responses (Katsurada et al., 2012). Human NKG2A+ T cells also exert immunoregulatory functions in some autoimmune disorders (Katsurada et al., 2012; Kim and Cantor, 2011). Thus, NKG2A+ T cells have immunoregulatory, and in most cases immunosuppressive, functions. These diminished responses might be harmful in the context of tumors and many infections, but could play an important, beneficial role in the context of inflammatory diseases, tissue grafts, and tissue injuries (Bhagat et al., 2008; Saito et al., 2003; Walsh et al., 2011). However, the disruption of NKG2A activity has also been shown to unleash CD8+ Treg cell activity, and in that case NKG2a/c+CD8+ T cells impaired the resolution of the autoimmune disease (Lu et al., 2008).
CD8+ T cells expressing NKG2A have been observed during HIV-1 infection, ranging between 2% and 18% in the peripheral blood of asymptomatic untreated PLWH (Maria et al., 1997). There is evidence that HIV-specific NKG2A+ CD8+ T cells display impaired cytolytic function (Maria et al., 1997; Wesch and Kabelitz, 2003). However, the percentage of NKG2A+ CD8+ T cells in the blood was lower in PLWH than in healthy donors (Zeddou et al., 2007). Within PLWH, the percentages were higher in PLWH controlling viremia than in viremic individuals (Zeddou et al., 2007). Based on these reports, one might speculate that the antiviral function of NKG2A+ CD8+ T cells is diminished, but that they might deliver some other benefit to the host. It cannot be excluded, though, that in viremic PLWH, these cells were decreased in the blood because they homed more intensively to the tissues. Immunization of macaques with a CMV-based vector expressing HIV-Gag induced a strong Simian immunodeficiency virus (SIV) control that was associated with major histocompatibility complex (MHC)-E-restricted CD8+ T cells (Hansen et al., 2016). The latter were in large majority CD8α/β+ and TCRγ/δ− cells not expressing NKG2a/c and thus recognized viral antigen presented by MHC-E via TCR and not NKG2A (Hansen et al., 2016).
The role of NKG2A+CD8+ T cells in HIV infection is thus not clearly understood. NKG2A+CD8+ T cells in PLWH have been mostly studied in blood, whereas they might be particularly important in tissues, in particular in the intestinal tissue. Animal models allow the analysis of immune responses in tissues. HIV originates from the SIV whose reservoir resides in African nonhuman primates (NHP). Natural hosts of SIV, such as African green monkeys (AGM), display high levels of replication in the blood and intestine, without inducing chronic inflammation (Raehtz et al., 2016). They maintain a normal intestinal architecture, including normal FDC networks and an intact epithelial barrier, and show no loss of intestinal Th17 cells (Favre et al., 2009; Gordon et al., 2010; Micci et al., 2012; Pallikkuth et al., 2013; Pandrea et al., 2007). This contrasts with Asian monkeys (macaques [MAC]) that do not carry SIV in their natural habitat and display the same physiopathology as HIV-1-infected humans (Garcia-Tellez et al., 2016). AGM infected by SIV therefore represent a good model to search for mechanisms that protect against chronic inflammation and tissue damage during a chronic viral infection. We raised the hypothesis that NKG2A+CD8+ T cells might be increased in tissues of AGM where the virus replicates (i.e., intestine) and contribute to tissue protection. We determined the genome-wide transcriptional profiles of these cells during SIVagm infection in AGM. We phenotyped and longitudinally followed NKG2a/c+CD8+ T cells in blood, LNs, and intestine during pathogenic SIVmac infection in macaques and nonpathogenic SIVagm infection in AGM. We evaluated the correlations with viremia profiles and level of inflammation in the intestine. Our study supports a role of NKG2a/c+CD8+ T cell in the protection against intestinal inflammation during SIV infection.
Results
NKG2a/c expression on T cells in healthy nonhuman primates defines a subset of CD8+ T cells mainly displaying an effector phenotype with effector tissue homing profile
We first performed a comparative analysis of the phenotype of NKG2a/c+ T cells in blood from six healthy AGM and six healthy cynomolgus MAC (CM). The data of peripheral blood-derived viable CD45+lin− lymphocytes were analyzed by dimensional reduction using viSNE algorithm (Figures 1A and 1B). On NHP cells, the available antibodies against NKG2A also recognize NKG2C. NKG2a/c showed elevated expression on a small cluster of CD3+ T cells. These clusters of NKG2a/c+CD3+ T cells were distinct from NK cells and were found close to or within the cluster of conventional CD8+ T cells (Figures 1A, 1B, and S1A). When the NKG2a/c+CD3+ T cells from AGM and MAC were analyzed together, they were found in the same cluster (Figure S1A). These results indicate that NKG2a/c can be used to define a subset of CD8+ T cells in NHP. We detected NKG2a/c expression also on CD4+ T cells. In both species, however, the vast majority, more than 75%, of the NKG2a/c+ T cells expressed CD8a showing that similar to humans, CD3+NKG2a/c+ cells are mainly composed of CD8+ T cells in the blood of healthy AGM and MAC (Figures 1C and 1D). NKG2a/c+CD8+ T cell numbers in blood were low compared with conventional CD8+ T or NK cells in both species and did not differ between species (Figures 1D, 1E, and S1B). Most of the NKG2a/c+CD8+ T cells were of the effector phenotype (Figure 1F) and expressed both IFN-γ and Perforin (Figure 1G).
Figure 1.

Identification and analysis of NKG2a/c+ T cells in the blood of healthy nonhuman primates. Analyses were performed on six monkeys per species
(A and B) Multidimensional viSNE analysis in blood cells of (A) AGM and (B) cynomolgus macaques (CM). Cells were stained with 16 markers and measured by flow cytometry. viSNE analysis was run on 60,000 live CD45+ single cells per sample using all surface markers.
(C) Gating of the NKG2a/c+ T cells based on CD45+ lin−CD3+NKG2a/c+ cells. The numbers in each quadrant represent the percentage among CD45+ Lin− cells in AGM (upper panel, blue) and CM (lower panel, orange). Each panel represents a distinct animal. Data from three representative animals per species are shown.
(D) Mean fluorescence intensity (MFI) of NKG2A/C at the surface of NKG2a/c+ T cells, NK cells, and conventional CD8a+ T cells (left). Frequency of CD8a among NKG2a/c+ T cells, NK cells, and conventional CD8a+ T cells (right).
(E) Absolute numbers of NKG2a/c+ T cells compared with NK and conventional CD8a+ T cells.
(F) Frequencies of naive, memory, and effector NKG2a/c+ T cells according to CD28 and CD95 expression. Dot plots with three representative animals per species are shown on the left.
(G) MFI of intracellular cytokine expression ex vivo in unstimulated cells.
(H) Frequency of cells expressing homing markers.
(I) Frequencies of cells expressing NK cell markers. A nonparametric Mann-Whitney U test was applied; ∗p < 0.05, ∗∗p < 0.005. Horizontal bars indicate median values, and error bars indicate interquartile range. Each symbol (triangles for AGM and rectangles for CM) represents a distinct animal.
We measured chemokine receptor expression to evaluate their tissue homing potential. The large majority of the NKG2a/c+ T cells expressed CXCR3 and CD62L in AGM and MAC (Figure 1H). Some of them also expressed CX3CR1, CCR7, and CXCR5 (Figure 1H). For instance, the median of CXCR5+ NKG2a/c+CD8+ T cells were 12.92% and 5.98% in, respectively, AGM and MAC (Figure 1H).
We then assessed the expression of other NK cell markers on NKG2a/c+ T cells. The NK cell receptors NKG2D and NKP30 were expressed as frequently as on NK cells (Figure 1I). NKG2a/c+ T cells positive for the other NK cell markers tested, i.e., CD16, NKp80, NKp46, and NKp44 could also always be detected to variable extents (Figure 1I). NKp44 marks NK cells that persist in the intestine (Sagebiel et al., 2019). Comparisons of the frequency and mean fluorescence intensity for each of these homing and NK cell markers expressed by NKG2a/c+ CD8+ T cells did not reveal any differences between AGM and MAC, with the exception of the frequencies of CXCR3+ and in particular NKP80+ NKG2a/c+CD8+T cells, which were higher in healthy AGM than in healthy MAC (Figures S1C–S1F).
Taken together, our data show the existence of NKG2a/c+ T cells in NHP peripheral blood mainly composed of CD8+ T cells with effector potential, expressing NK cell receptors and an inflammatory/effector tissue homing profile.
NKG2a/c+CD8+ T cells expand during primary SIVagm infection
We next deciphered the dynamics of NKG2a/c-expressing T cells in response to SIV infection. The cells were followed in blood of 12 SIVagm.sab92018-infected AGMs and nine SIVmac251-infected CM before infection, in acute infection (starting from day 2 post-infection [p.i.]) and in chronic infection until day 220 p.i. The viremia of all animals are described in Figure S2 and in Table S1. In concordance with previous studies, the viremia levels were as high in AGM than in the MAC Figure S2.
Analysis of NKG2a/c+CD8+ T cells after SIV infection showed that these cells continued to represent the vast majority of the NKG2a/c+ T cells (Figures 2A and 2B). During SIVagm infection, the NKG2a/c+CD8+ T cell subpopulation remained clearly detectable, whereas in SIVmac infection, NKG2a/c staining on CD3+ T cells sometimes failed to clearly define a population mainly due to a low number of positive cells. Indeed, in MAC, a transient decline of their absolute numbers in blood was observed at days 9 and 11 p.i. (Figure 2C). This decline thus occurred concomitantly to the viremia peak (Figure S2). In AGM, the cells expanded in primary infection and reached a peak at days 28 and 35 p.i. (Figure 2C).
Figure 2.

Dynamics of NKG2a/c+CD8+ T cells in blood during pathogenic SIVmac infection and non-pathogenic SIVagm infection
Nine animals per species were analyzed. AGM are represented in blue and CM in orange.
(A) Dot plots illustrating the dynamics of CD45+CD20−CD3+NKG2A/C+ cells during SIV infection in AGM (upper panel) and CM (lower panel). The days after SIV infection are indicated at the top of each dot plot. The dot plots show a representative animal for each species. The numbers in each quadrant indicate the percentage of NKG2A/C+ T cells among CD45+ cells.
(B) Frequency of CD8a+ cells among CD45+CD20−CD3+NKG2A/C+ cells during SIV infection in CM (left) and AGM (right).
(C) CD45+CD20−CD3+NKG2A/C+CD8+ cell dynamics in response to SIV infection. The dark line represents the median. Day 0 represents the median value from all the time points analyzed before infection.
(E–F) Dynamics of NKG2a/c+CD8+ T cells expressing homing markers. The cells were followed in blood before and during the time course of SIV infection in nine AGM (blue) and nine CM (orange). Each symbol represents an individual monkey, the black line the median values, and day 0 the median values of all time points before infection. dpi: days post-infection. ∗p < 0.05.
The differences observed in the dynamics of NKG2a/c+CD8+ T cells between pathogenic and non-pathogenic SIV infection could be a consequence of distinct tissue trafficking in response to infection. We longitudinally assessed the frequencies of NKG2a/c+CD8+ T cells expressing tissue homing markers in blood. In both species, the CCR7+NKG2a/c+CD8+ T cell frequencies did not show any significant changes in primary infection and remained low during chronic infection (Figure 2D). The frequencies of CD62L+, CX3CR1+, and CXCR3+ NKG2a/c+CD8+ T cells were strongly and rapidly decreased after SIV infections in both MAC and AGM (Figures 2E–2G). The levels of CXCR3+NKG2a/c+CD8+ T cells were partially recovered after day 80 p.i. Here we show that AGM displayed an expansion of NKG2a/c+CD8+ T cells in blood during primary infection. Both in pathogenic and non-pathogenic SIV infection, NKG2a/c+CD8+ T cells expressing CCR7, CD62L, CXC3CR1, and CXCR3 were low or decreased in blood in response to SIV infection. These decreases could either mean that these cells are constantly recruited into tissues and/or that NKG2a/c+CD8+ T cells further differentiate into an effector profile upon SIV infection.
SIV replication sustains proliferation and effector function of NKG2a/c+CD8+ T cells
In order to better understand the dynamics following SIV infection, we longitudinally evaluated the proliferative activity and effector profiles of NKG2a/c+CD8+ T cells. We examined the proliferative activity of these cells ex vivo by measuring the intracellular expression of Ki-67, a cell-cycle marker expressed by cycling or recently divided cells (Figure 3A). During SIVmac infection, NKG2a/c+CD8+ T cells displayed proliferative responses that were shorter in time when compared with conventional CD8+ T cells than in SIVagm infection. In AGM, the conventional CD8+ T cells did not show significant increases in proliferation, in line with the literature (Favre et al., 2009)(Raehtz et al., 2020) (Jacquelin et al., 2014), whereas NKG2a/c+CD3+CD8+ T cells showed a strong increase in proliferative capacity in acute infection (day 7 p.i.) (Figure 3A).
Figure 3.

Longitudinal analysis of NKG2a/c+ CD8+ T cell proliferation and functional phenotypes in blood and evaluation of correlation with viremia
(A–D) Longitudinal analyses. Orange symbols indicate CM (left) and blue symbols AGM (right). Each symbol corresponds to a distinct animal. (A) Cell proliferation as evaluated by intracellular staining of Ki-67+. (B–D) Ex vivo suppressor activity as evaluated by (B) surface staining of CD107a and intracellular staining (C) of Perforin and (D) TNF-α. Each symbol represents a distinct animal. dpi: days post-infection. A nonparametric Mann-Whitney U test was applied, bars indicate median values, and error bars indicate interquartile range ∗p < 0.05, ∗∗p < 0.005, ∗∗∗p < 0.0005.
(E–F) Correlation matrix of measures of viremia and NKG2a/c+ CD8+ T cell parameters. The Pearson correlation is shown. The matrix was built using the values obtained between day 0 and day 150 p.i from (E) 6 MAC and (F) 6 AGM.
To evaluate the functional activity of the NKG2a/c+CD8+ T cells, the surface expression of CD107a (a surrogate marker for cytolytic function [Alter et al., 2004]) was measured ex vivo on unstimulated cells (Figure 3B). In MAC, increases in the cytotoxic activity of both conventional and NKG2as/c+CD8+ T cells were detected in primary infection, and for the NKG2a/c+CD8+ T cells, also in chronic infection. In AGMs, cytotoxic activity was observed for NKG2a/c+CD8+ T cells in primary and chronic infection (days 4, 9, 21, and 150 p.i.) but was not increased on conventional CD8+ T cells (Figure 3B).
We also longitudinally measured Perforin and TNF-α expression levels by intracellular cytokine staining ex vivo in unstimulated cells. The data show the existence of NKG2a/c+CD8+ T cells with increased levels of Perforin and TNF-α expressions during primary SIV infection in both species and in both NKG2a/c+ and conventional CD8+ T cells (Figures 3C and 3D). In both species, the increases of Perforin and TNF-α in NKG2a/c+CD8+ T cells were observed as soon as days 7 and 2 p.i., respectively. In AGM, the increases of Perforin and TNF-α expressions seemed to be resolved earlier (days 14 and 28 p.i., respectively) than in MAC (days 35 and 80 p.i., respectively).
To analyze if these dynamics were associated with viral replication levels, a correlation matrix was generated between viremia levels and the different parameters measured for NKG2a/c+CD8+ T cells (Figures 3E and 3F). In both species, strong positive correlations were observed between viremia and Ki-67 or Perforin levels of NKG2a/c+CD8+ T cells, suggesting that viremia (i.e., antigen stimulation) was driving the proliferation and effector phenotype of these cells. Moreover, positive correlations were detected between Perforin and TNF-α levels for the NKG2a/c+CD8+ T cells. In summary, both AGM and CM showed increases in proliferation and cytotoxic phenotype of NKG2a/c+CD8+ T cells in response to SIV infection in blood, and these were associated with viremia levels.
No increases of total or CXCR5+NKG2a/c+CD8+ T cells in secondary lymphoid tissues during SIVagm and SIVmac infections
To address the question of whether NKG2a/c+CD8+ T cells home to the tissues during SIV infections, we examined their frequencies in tissues, first in secondary lymphoid tissues (SLT) from AGM and CM. We analyzed non-infected, acutely infected, and chronically infected animals. We did not find an enrichment of NKG2a/c+CD8+ T cells in spleen from chronically infected animals when compared with healthy animals independently of the type of SIV infection studied (Figure 4A). The longitudinal analysis of NKG2a/c+CD8+ T cells in peripheral LN (pLN) during the time course of SIV infection within each species also did not show changes over time in their frequencies (Figure 4B). Likewise, comparison of CD3+NKG2a/c+ T cell frequency between the two species in both spleen and pLN during the time course of infection did not reveal differences with the exception of days 14 and 80 p.i, where NKG2a/c+CD8+ T cells were more frequent in AGM' pLN than in MAC (Figure S3A). We analyzed the spleen of CM treated with combination antiretroviral therapy (cART) in chronic infection for 2 years (Table S1). In these cART-treated animals where viremia was suppressed also, no differences regarding the frequency of NKG2a/c+CD8+ T cells were observed when compared with viremic CM (Figure 4C). We also evaluated NKG2a/c+CD8+ T cell frequencies in rhesus MAC (RM) that spontaneously controlled SIV (SIV controllers [SIC]) (Table S1). The frequency of NKG2a/c+CD8+ T cells in LN of chronically infected SIC was similar to that in viremic RM, but significantly increased compared with that in healthy animals (Figure 4D). Thus, except for SIV controllers, NKG2a/c+CD8+ T cells were not increased in peripheral secondary lymphoid organs when compared with uninfected animals.
Figure 4.

Dynamics and functional phenotype of NKG2a/c+CD8+ T cells in secondary lymphoid organs and intestine from naive and SIV-infected monkeys
Each symbol corresponds to a distinct animal. Orange symbols indicate CM, blue symbols AGM, violet symbols ART-treated CM, and red symbols rhesus macaques (RM). Bars indicate median values.
(A) Frequencies of NKG2a/c+ CD8+ T cells among CD45+ cells in the spleen from CM (orange) and AGM (blue).
(B) Dynamics of NKG2a/c+CD8+ T cells during SIV infection in peripheral lymph nodes (pLN) from CM (orange) and AGM (blue). The black line indicates the median values.
(C) NKG2a/c+CD8+ T cells in the spleen of viremic and ART-treated virologically suppressed CM.
(D) NKG2a/c+CD8+ T cells in the pLN of naive, viremic, and virological controller (SIC) RM.
(E and F) Frequencies of NKG2a/c+CD8+ T cells expressing CXCR5 in (E) pLN and (F) spleen from CM (orange) and AGM (blue).
(G) NKG2a/c+CD8+ T cells expressing CXCR5 in spleen from viremic and ART-treated virologically suppressed CM.
(H) NKG2a/c+CD8+ T cells expressing CXCR5 in pLN from naive, viremic, and virological controller (SIC) RM.
(I) Dynamics of NKG2a/c+CD8+ T cells in rectal biopsies from CM (orange) and AGM (blue).
(J) Dynamics of NKG2a/c+ CD8+ T cells in distinct intestinal compartments from CM (orange) and AGM (blue).
(K–M) Lymphocytes were isolated from rectal biopsies and surface (CD107a) or intracellular stainings (IFN-γ and Perforin) were assessed ex vivo in unstimulated NKG2a/c+CD8+ T cells for CM (orange) and AGM (blue). dpi: days post-infection. ∗p < 0.05.
We next assessed if NKG2a/c+CD8+ T cells could access B cell follicles, the latter being described as a sanctuary for HIV/SIV replication in SLT (Bronnimann et al., 2018; Fukazawa et al., 2015), by evaluating CXCR5 expression on these cells. The median frequencies of NKG2a/c+CD8+ CXCR5+ T cells in SLT (LN, spleen) were low, including in SIV controllers (Figures 4E–4H). Furthermore, they decreased in the LN after SIV infection in both acutely and chronically infected CM as well as in chronically infected RM (Figures 4E and 4H). In AGM, the levels of NKG2a/c+CD8+ CXCR5+T cells in LN were also decreased in acute infection (Figure 4E). In the spleen, the median levels of CXCR5+ NKG2a/c+CD8+ T cells were similar to that in LN and also did not increase after SIV infection in CM nor AGM (Figure 4F). Additionally no difference was noticed regarding the frequency of NKG2a/c+CD8+CXCR5+ T cells when they were compared between the two species in both pLN and spleen (Figure S3). ART treatment did not change the frequency of NKG2a/c+CD8+ CXCR5+ T cells in the spleen of CM (Figure 4G). We cannot exclude that cART administered during primary infection would have restored the cells. Altogether, NKG2a/c+CD8+ T cells showed no signs of increased capacity to migrate into B follicles within SLT during SIV infection, neither in AGM nor in SIV controllers. The NKG2a/c+CD8+ CXCR5+ T cells were lower in LN than in blood before infection and further decreased upon SIV infection in both species.
Rapid expansion of cytotoxic NKG2a/c+CD8+ T cells during SIV infection in the gut
We then longitudinally followed up NKG2a/c+CD8+ T cells in the intestine (rectal biopsies). This revealed differences with respect to SLT and also between pathogenic and non-pathogenic SIV infection (Figures 4I and S3). In AGM, the NKG2a/c+CD8+ T cells increased during primary infection in the intestine after SIV infection and represented between 5% and 10% of the leukocytes between days 2 and 28 p.i. (Figure 4I). In CM, the levels never reached more than 5% (Figure 4I). The increases of NKG2a/c+CD8+ T cells also lasted longer in SIVagm than SIVmac infection (day 14 and day 2 p.i., respectively). In order to further comprehend the distribution of NKG2a/c+CD8+ T cells in the gut, we analyzed if their levels varied or not between distinct compartments of the intestine and analyzed the ileum, jejunum, and colon from healthy, acutely (day 9 p.i.) and chronically infected animals (between day 200 and 300 p.i.) (Figure 4J). The samples here have been analyzed in later stages of chronic infection than the rectal biopsies. In MAC, the NKG2a/c+CD8+ T cell levels did not change in the three intestinal compartments compared with uninfected animals, besides a trend for decrease in acute (day 9 p.i.) infection. In AGM, the NKG2a/c+CD8+ T cells showed significant increases in chronic infection when compared with before infection in colon (p = 0.0083), jejunum (p = 0.0228), and ileum (p = 0.0099). Thus, we observed in all intestinal compartments signs for stronger and more long-lasting increases of the NKG2a/c+CD8+ T cells in the gut during SIVagm than during SIVmac infection (Figure S3). Altogether, increases of NKG2a/c+CD8+ T cells were seen in the intestine during SIVagm infection in contrast to SLT.
We analyzed the functional phenotype of these intestinal NKG2a/c+CD8+T cells before and during SIV infection by measuring ex vivo cell surface CD107a as well as intracellular IFN-γ and Perforin in unstimulated cells (Figures 4K–4M). Perforin and CD107a expression were rapidly and strongly increased in NKG2a/c+CD8+ T cells from rectal biopsies of SIV-infected MAC and AGM starting from day 2 p.i. and throughout day 14 p.i. at least. The changes in IFN-γ expression were not significant (Figures 4I and S3). Altogether, the effector activity of NKG2a/c+ CD8+ T cells was mobilized in the intestine upon SIV infection in both MAC and AGM. This mobilization in the intestine occurred very early (day 2 p.i.) in both MAC and AGM. In both species, the cytotoxic markers were more up-regulated than IFN-γ. The functional profile of the cells in the gut was similar between the two types of infection, whereas the levels of NKG2a/c+ CD8+ T cells increased more in SIVagm than in SIVmac infection.
Transcriptional signatures in NKG2a/c+CD8+ T cells during SIVagm infection indicates cytotoxic effector concomitant with regulatory functions
The NKG2a/c+CD8+ T cells were therefore expanded in blood and intestine during non-pathogenic SIV infection. In order to define them in depth, we determined their genome-wide transcriptome. Three distinct CD8+ T cell subpopulations were sorted from blood of five chronically SIVagm-infected AGM: the NKG2a/c+CD8+ T cells as well as the conventional memory and effector CD8+ T cells. As shown in the heatmaps, the NKG2a/c+CD8+ T cells clustered clearly separately from both the memory and effector conventional CD8+ T cells (Figures 5A, 5B and S4). The analysis revealed differential expression for 298 genes when NKG2a/c+CD8+ T cells were compared with memory CD8+ T cells (Figure 5A) and 252 genes when compared with effector CD8+ T cells (Figure 5B). All up- and down-regulated genes are listed in Tables S2 and S3, also shown on Figures S4A and S4B. Among the up-regulated genes in the NKG2a/c+CD8+ T cells figured many NK cell receptors, such as NCR1 (NKp46), KIR2DL4, KIR3DL3, KIR2DL1, and both KLRC1 (NKG2A) and KLRC2 (NKG2C). Of note, NKG2A expression was more up-regulated (3.5–4.9 times, p < 10−9–10−5) than NKG2C (1.9–3.6 times, p < 10−5–10−2) compared with conventional memory/effector CD8+ T cells (Figures 5C and 5D and Tables S2 and S3). The NKG2a/c+CD8+ T cells also expressed higher levels of CXCR6 and IL23R compared with the conventional effector CD8+ T cells, suggesting a gut homing profile, in line with the data described earlier. Indeed, IL-23 is known to be expressed by intestinal myeloid cells, which is also the case of the CXCR6-ligand CXCL16, and CXCR6 can be expressed by intestinal activated lymphocytes (Diegelmann et al., 2010; Sato et al., 2005). The NKG2a/c+CD8+ T cells also expressed higher levels of IL12RB2 compared with memory CD8+ T cells. The expression of IL12RB2 is found to be associated with a number of inflammatory diseases, such as Crohn disease. The NKG2a/c+CD8+ T cells were also characterized by higher expression levels of cytolytic granules (i.e., Perforin, Granzyme A and B, NKG7) as well as of CCL4 (MIP1-b) and TBX21 (T-bet), whereas lower levels of the immune checkpoint molecule Lag-3 when compared with the conventional memory CD8+ T cells, in line with their effector phenotype (Tables S2 and S3). The molecular profiles also revealed lower expression of LAMTOR1 and higher levels of CREM, CD73 (NT5E), IGFBP3, CD26 (DPP4), SerpinA3 and SerpinA5 when compared with conventional effector memory CD8+ T cells (Figure S4 and Tables S2 and S3). These molecules are associated with cellular metabolism and with regulatory function of T cell activity (Miyagawa et al., 2017). CD73 is often expressed on regulatory T cells. CD26 is known to cleave chemokines and inhibit T cell trafficking (Hollande et al., 2019). SerpinA3 and SerpinA5 inhibit proteases, which protect some tissues, such as the lung mucosa, from damage caused by proteolytic enzymes (Kalsheker, 1996; Miyagawa et al., 2017),.
Figure 5.

Genome-wide transcriptome analysis of NKG2a/c+CD8+ T cells
NKG2a/c+CD8+ T cells, conventional memory CD8+ T cells (CD95+CD28+), and conventional effector CD8+ T cells (CD95+CD28-) were sorted from blood of five chronically SIVagm-infected AGM.
(A and B) Heatmaps of unsupervised hierarchical clustering showing differentially expressed genes (A) between NKG2a/c+CD8+ T cells and conventional memory CD8+ T cells and (B) between NKG2a/c+CD8+ T cells and conventional effector CD8+ T cells. A p value adjustment was performed to take into account multiple testing and control the false-positive rate to a chosen level. The level of controlled false-positive rate was set to Padj <0.05.
(C and D) Volcano plots that represent up- and down-regulated transcripts of NKG2a/c+CD8+ T cells when compared with (C) conventional memory CD8+ T cells (CD95+CD28+) (D) and conventional effector CD8+ T cells (CD95+CD28-). The position of each data point is calculated as -log10 (p value) × log2 (FC), with a p value cutoff < 0.05. The red (up-regulated) and green dots (down-regulated) represent differentially expressed genes with a log2 fold change higher than 2. The list of all transcripts is given in Tables S2 and S3.
(E–G) Graphs shows the enriched Gene Ontology (GO) terms for the genes that were (E) up-regulated in NKG2a/c+CD8+ T cells when compared with conventional memory CD8+ T cells (CD95+CD28+); (F) up-regulated in NKG2a/c+CD8+ T cells when compared with conventional effector CD8+ T cells (CD95+CD28+). No significant pathways were down-regulated when compared with conventional effector CD8+ T cells. The mRNAs were input for ClueGO plugged into Cytoscape for GO enrichment analysis. The “cellular component,” “biological process,” “molecular function,” and “immune system process” GO terms such as KEGG, Wiki pathways, and REACTOME were selected for this analysis. The two-sided hypergeometric test was used in the statistical inference. (G) Enriched GO terms for the genes that were down-regulated in NKG2a/c+CD8+ T cells when compared with conventional memory CD8+ T cells (CD95+CD28+). The adjusted p value threshold was set to 0.05. The term value corrected with the Bonferroni stepdown method was applied for p value correlation and indicated in the figure. Bars indicate the minus log of p-value. The list of the associated genes found for each term is given in Tables S4–S6.
Among all differentially regulated genes in NKG2a/c+CD8+ T cells, we also determined which ones were the same when compared with both memory and effector conventional CD8+ T cells together. As displayed in the Venn diagrams, 37 genes were commonly up-regulated and 4 commonly down-regulated (Figure S4C). Among the commonly up-regulated genes were KLRC1, IL23R, KLRC2, SerpinA5, CCL4, and KIR3DL3 (Figure S4D). One of the commonly down-regulated ones corresponded to Lag3.
We then analyzed the pathways that were involved. The Gene Ontology (GO) enrichment analysis focusing on genes showing a >2-fold change uncovered several pathways important at different levels for the functions of NKG2a/c+CD8+ T cells. Thus, pathways associated with cytotoxic activity and cell development such as “NK cell mediated immunity,” “NK cell mediated cytotoxicity,” “GEFs activate RhoA,B,C,″ “positive regulation of epithelial cell apoptotic process,” and “cell-cell-junction assembly” are found to be up-regulated in NKG2a/c+CD8+ T cells when compared with memory conventional CD8+ T cells. At the opposite, pathways involved in regulation of cellular proliferation (“SET1 complex trimethylates H3K4 at the MYC gene”) are down-regulated (Figures 5E and 5F and Tables S4 and S5). The same analysis when comparing NKG2a/c+CD8+ T cells with conventional effector CD8+ T cells demonstrated an up-regulation of pathways mostly involved in immune activity, such as “regulation of lymphocyte mediated immunity,” “positive regulation of defense response to virus by host,” and in particular “immunoregulatory interactions between a lymphoid and a non-lymphoid cell” (Figure 5G and Table S6). Together, these data demonstrate that the NKG2a/c+CD8+ T cells present during SIVagm infection have a transcriptional expression profile clearly distinct from other CD8+ T cell populations. They confirm the NK cell-like properties, the effector and cytotoxic profile, as well as the preferential gut homing profile. Furthermore, they support a regulatory function of these cells.
NKG2a/c+CD8+ T cells correlated negatively with IL-23 in the intestine during SIVmac infection
We next explored markers of intestinal inflammation and tissue stress. We therefore measured IL-23, IP-10 (CXCL10), and Hsp60. We chose IL-23 because the transcriptomic analysis revealed that NKG2a/c+CD8+ T cells expressed high levels of IL23R and because this pro-inflammatory cytokine is known to be expressed in the gut (Lim et al., 2020). IP-10 was selected because it was shown that it is increased in the gut during SIVmac infection (Ploquin et al., 2016). Furthermore, it is the ligand of CXCR3 that was expressed on the majority of NKG2a/c+CD8+ T cells at steady state (Figure 1). In addition, IP10 is the substrate of the peptidase CD26 that was up-regulated in the NKG2a/c+CD8+ T cells. HSP60 is a stress protein that has been shown to be an independent marker for inflammatory bowel disease (Cappello et al., 2019).
The plasma levels of IP-10 were increased already at day 2 p.i. in SIVagm infection, and not in SIVmac infection, as previously described (Figures 6A, 6B, and S5) (Jacquelin et al., 2009; Ploquin et al., 2016). At the opposite, plasma levels of soluble Hsp60 showed significant increases at days 2 p.i in SIVmac infection, but not in SIVmac infection (Figures 6A, 6B and S5). HSP60 levels correlated with NKG2a/c+CD8+ T cell counts in SIVagm infection (Figures 6C and 6D). We next investigated HSP60 levels in the intestine. Longitudinal analyses of Hsp60 protein in supernatants of rectal biopsies collected longitudinally showed high expression of HSP60 at day 2 p.i. (p = 0.05) and in chronic phase (day 80 p.i.) (p = 0.0045) of SIVmac infection, whereas no increase was observed after SIVagm infection (Figures 6E and 6F). IL-23 levels showed trends for increases in the gut at day 80 p.i. (p = 0.07). Intestinal IL-23 correlated negatively with NKG2a/c+CD8+ T cell levels during SIVmac infection (Figures 6G, 6H, and S5).
Figure 6.

Levels of systemic and intestinal inflammatory and cellular stress markers
Each symbol corresponds to a distinct animal. Orange symbols indicate CM and blue symbols AGM.
(A and B) Longitudinal IP-10 and Hsp60 concentrations in plasma during SIV infection in (A) CM and (B) AGM.
(C and D) IP-10 and Hsp60 plasma concentrations were plotted against NKG2a/c+CD8+ T cell counts in blood of (C) CM and (D) AGM.
(E and F) Longitudinal measurement of IL-23 and HSP60 concentrations produced by total rectal biopsy cells from (E) CM and (F) AGM. Horizontal bars indicate median values, and error bars indicate interquartile range.
(G and H) IL-23 and HSP60 levels from rectal biopsies were plotted against NKG2a/c+CD8+ T cells of (C) CM and (D) AGM. NKG2a/c+CD8+ T cells corresponded to the percentage among CD45+ measured in the respective rectal biopsy. The Spearman correlation is shown, and r and p values are indicated in each graph. ∗p < 0.05.
Altogether, the levels of Hsp60 in the intestine were increased in SIVmac but not in SIVagm infection. IL-23 in the gut correlated negatively with intestinal NKG2a/c+CD8+ T cell levels in SIVmac infection.
Discussion
We compared non-pathogenic SIVagm infection in the natural host (AGM) with pathogenic SIVmac infection in macaques, the latter modeling HIV infection. In both species, it is well known that the SIV virus replicates to high titers in blood and intestine throughout chronic infection. However, whereas this persistent infection induces intestinal damage during SIVmac infection in macaques, it does not in SIVagm-infected AGM (Brenchley et al., 2010). Protection against viral-induced tissue damage can generally be achieved either through strong pathogen control or through resilience strategies (Chovatiya and Medzhitov, 2014). The latter could include improved homeostatic mechanisms, improved wound healing, control of inflammation, and/or resistance to stress (Cohen et al., 2012). In this report, we provide novel insights into the potential role of NKG2a/c-expressing CD8+ T cells during SIV infection. We show that NKG2a/c+CD8+ T cells were expanded in the blood and intestine but not in the LNs of AGM in response to SIVagm infection and provide data suggesting that these cells play a role in the regulation of intestinal inflammation during SIV infection.
In both SIVagm and SIVmac infection, the NKG2a/c+CD8+ T cells showed an effector phenotype, similar to what has been described for human NKG2a/c+CD8+ T cells (Barbarin et al., 2017; Pereira et al., 2019). Cytotoxicity markers such as Perforin were up-regulated very strongly in the gut during both SIV infections. However, by performing longitudinal studies simultaneously in distinct tissues, we detected a more intense expansion of NKG2a/c+CD8+ T cells in the blood and intestine in response to SIVagm in AGM compared with SIVmac infection. In SIVmac infection, the NKG2a/c+CD8+ T cells were even decreased in blood. These data in the macaques are in line with PLWH, where the levels of NKG2a/c+CD8+ T cells were lower than in healthy donors (Zeddou et al., 2007). In both SIVagm and SIVmac infection, the expression of the cytotoxic marker (Perforin) was more up-regulated than IFN-γ, suggesting a more cytotoxic than pro-inflammatory activity of these cells in the intestine. Genome-wide transcriptome analysis of the NKG2a/c+CD8+ T cells in SIVagm infection demonstrated the cytotoxic effector function and gut homing profile of these cells and also revealed strong expression of several immunoregulatory molecules, such as CD73. Moreover, IL-23 levels in the intestine were negatively correlated with intestinal NKG2a/c+CD8+ T cell levels during SIVmac infection, whereas only low levels of IL-23 were observed concomitantly to a high frequency of NKG2a/c+CD8+ T cells in the gut during infection in the natural host. Together these results suggest that these cells rather contribute to inflammatory control in the gut than to control of viral replication during SIV infection.
The levels of NKG2a/c+CD8+ T cells were associated with viremia both in SIVagm and SIVmac infection, suggesting that antigenic stimulation was driving the expansions of these cells. NKG2A recognizes peptides presented via the non-classical MHC-E class I molecule. The peptides presented via MHC-E can also be recognized by the activatory NKG2C receptor as well as by the TCR. On NHP, the available antibodies cannot distinguish between the NKG2A and NKG2C, and thus a phenotypic analysis to discriminate between the expression of the inhibitory and activatory receptors was not possible. The transcriptome analyses, though, allowed the analysis of NKG2A and NKG2C mRNA expression levels. NKG2a/c+CD8+ T cells expressed both NKG2A and NKG2C mRNA. The expression levels of NKG2C in CD8+ T cells were, however, less up-regulated than those of NKG2A. Similarly, in humans, the proportion of CD8+ T cells expressing the activatory NKG2C receptor was similar between PLWH and healthy donors and also between viremic and non-viremic patients, suggesting that NKG2C regulation on these cells is not contributing to a control of HIV infection (Zeddou et al., 2007).
MHC-E displays a selective preference for peptides derived from the leader sequence of various MHC class I alleles. Binding of a peptide is needed to stabilize and increase MHC-E expression at the cell surface. MHC-E is expressed in almost all tissues, including on CD4+ T cells and also to high levels on intestinal epithelial cells. MHC-E has been described to be up-regulated during HIV-1 and SIVmac infections on CD4+ T cells, both on infected and un-infected CD4+ T cells, respectively, in vitro and in vivo (Nattermann et al., 2005; Wu et al., 2018),. The up-regulation on un-infected cells might be a consequence of stronger expression of classical MHC-I molecules in activated CD4+ T cells and of HIV proteins that directly modify the expression levels of MHC-E in infected cells (Nattermann et al., 2005; Takao et al., 2010). Among the small numbers of other cellular peptides that have been identified to bind to MHC-E and stimulate CD8+ T cells is a HSP60-derived peptide (Michaëlsson et al., 2002). Under stress conditions, Hsp60 is sufficiently processed and its peptide competes with the MHC-I-derived peptides for binding to MHC-E. Therefore changes in the level of the Hsp60 peptide presented by MHC-E during SIV infection, relative to the amount of MHC class I-derived peptides, may result in the modulation of NKG2a/c+CD8+ T cell activity toward these cells (Perera et al., 2007; Shao et al., 2005). We report here increased levels of Hsp60 protein in the intestine of SIVmac-infected MAC, whereas they were not increased in SIVagm infection. It could be that NKG2a/c+CD8+ T cells get activated by cells presenting the Hsp60 instead of MHC-I peptide. In that case, stressed cells might be more efficiently eliminated by NKG2A+CD8+ T cells in SIVagm infection allowing improved wound healing. Alternatively, NKG2A+CD8+ T cells in SIVagm infection might be more relevant for their immunoregulatory role, and because there are less stressed cells in SIVagm infection, this would avoid killing and thereby result in less tissue damage compared with SIVmac infection. An intervention study to prove the immunoregulatory role of these cells in the gut of SIV-infected animals could not be performed. Indeed, even if an NKG2A monoclonal antibody specific for NHP would be available, by targeting NKG2A, one would also inhibit NK cell responses in the animals, NKG2A being expressed on >80% of NK cells in NHP (Huot et al., 2020). In order to differentiate between NKG2A and TCR-mediated recognition, and to evaluate SIV-specific activity, it would be useful if pentamers would be available. A clonal expansion of these cells, similar to what has been described for these cells in other settings, is also not excluded (Warren et al., 2006). The expansion of SIV-specific NKG2a/c+CD8+ T cells could facilitate viral persistence, which is in line with the high level of viral replication observed in the intestine of natural host.
It is notable that the expression of NKG2A is known to be influenced by a number of cytokines, which are differentially expressed between non-pathogenic and pathogenic SIV infections, including IL-6, IL-10, IL-21, IL-23, and TGF-β (Cho et al., 2011) (Hong et al., 2017; Manickam et al., 2018; Micci et al., 2012; Ploquin et al., 2006). Differences in the tissue cytokine environment, in particular in the intestinal tissues, between SIVagm and SIVmac infection, as described (Favre et al., 2009; Maloy and Kullberg, 2008), could thus contribute to the differences we observed regarding the dynamics of the NKG2a/c+CD8+ T cells.
Previous studies on such cells in HIV infection were mostly limited to peripheral blood, although it is important to understand the function of the effector cells in tissues. We provide here important insights into differential tissue dynamics. We performed a large study, in multiple tissues, that were analyzed concomitantly, in animals followed transversally and longitudinally, including ex vivo analyses on functional profiles of unstimulated cells as well as a genome-wide transcriptomic study. Altogether we demonstrate that NKG2a/c+CD8+ T cells did not expand in LN but in the blood and intestine during non-pathogenic SIV infection. These cells displayed a strong cytotoxic and immunoregulatory function as indicated by the expression of genes such as CD73. We show that NKG2a/c+CD8+ T cell levels correlated negatively with intestinal inflammation. This study suggests that NKG2a/c+CD8+ T cells do not contribute to viral control but rather participate in the control of immunopathology in the intestine during SIV infection. They might thus contribute, together with other mechanisms (Brenchley et al., 2010), in the protection of the epithelial barrier integrity in SIVagm infection. Our study underlines the need to further analyze the role of these cells in HIV infection and also to gain more insight into their function and regulation in tissues during chronic viral infections.
Limitations of the study
Here we used established experimental infection models and performed high-dimensional RNA sequencing to efficiently analyze the NKG2a/c+CD8+ T cell subpopulation in a natural host of SIV infection. To further verify the function of this subpopulation, functional and cytotoxic assays could be very useful. However, this remains challenging to set up given the lack of pentamers for HLA-E and also given the many different functions (antiviral, immunoregulatory, gut barrier preservation) to assess. Therefore, we attributed the potential function of the cells to the expression of proteins with well-known mechanisms allowing future studies to explore these directions.
In this study, we have analyzed the genome-wide transcriptome of NKG2a/c+CD8+ T cells only in SIVagm infection and one tissue. Similar studies could be performed for analyses in SIVmac infection. We evaluated, though, a wide range of cell surface markers of the NKG2a/c+CD8+ T cells in macaques as well as their dynamics in tissues in response to SIVmac infection. Monoclonal antibodies for studying additional markers if made available should help to further define the heterogeneity in the NKG2a/c+ CD8+ T cells in these models.
Another interesting future challenge could be the tracking of the NKG2a/c+CD8+ T cells in order to search if a potential clonal expansion is underlying the increases in the gut seen in response to SIV infection.
Resource availability
Lead contact
Further information and requests for resources and reagents should be directed to and will be fulfilled by the lead contact Michaela Müller-Trutwin (mmuller@pasteur.fr).
Materials availability
Materials generated in this study will be made available on reasonable requests with a completed Materials Transfer Agreement. The authors declare that all other data supporting the findings of this study are available within the article and its Supplementary Information files or are available from the authors upon request.
Data and code availability
RNA sequencing data have been deposited in the ArrayExpress database ArrayExpress: E-MTAB-8664.
Methods
All methods can be found in the accompanying transparent methods supplemental file.
Acknowledgments
We are grateful for the excellent help from the veterinarians and staff at the IDMIT Center (Benoit Delache, Jean-Marie Helies, Raphaël Ho Tsong Fang, and Julie Morin). We thank M. Mietsch and M. Daskalaki for comprehensive veterinary support and S. Heine, J. Hampe, and N. Leuchte for excellent technical assistance. We also thank all the people who work on the Illumina Hiseq 2500 platform at the Institut Pasteur and specially R. Legendre and J. Y. Coppee. N.H. was a recipient of a post-doctoral fellowship from the Fondation Beytout and P.R. of a PhD fellowship from the University Paris Diderot, Sorbonne Paris Cité. We gratefully acknowledge grant support from the ANRS, the Fondation Jacqueline Beytout, and the Fondation Les Ailes to M.M.T. and from MSDAvenir to A.S.C. and M.M.T. We gratefully acknowledge the support from the ANRS for the SIVART cohort, from the French infrastructure investment through the ANR-11-INBS-0008 grant to the IDMIT center, and through the PIA grant ANR-10-EQPX-02-01 to the FlowCyTech facility at IDMIT. We gratefully acknowledge the UtechS Photonic BioImaging (Imagopole), C2RT, Institut Pasteur, supported by the French National Research Agency. (France BioImaging; ANR 10-INSB-04-01, Investments for the Future), for advice and access to the CV1000 system.
Author contribution
N.H., B.J., and M.M.-T. designed the experiments and the overall study; N.H., P.R., B.W., C.P., and B.J. performed the experiments; N.H. and N.T. performed the transcriptome big data analyses; N.H., P.R., B.J., A.S.C., and M.M.-T. analyzed the data; N.H. performed the statistical analyses; V.C., B.J., D.D., R.L.G., C.S.-H., and M.M.-T. coordinated the animal studies; C.S.H., C.P., and A.S.-C. provided samples; N.H. and M.M.-T. wrote the manuscript, and all co-authors reviewed it.
Declaration of interests
The authors declare no competing interests.
Published: April 23, 2021
Footnotes
Supplemental information can be found online at https://doi.org/10.1016/j.isci.2021.102314.
Supplemental information
References
- Alter G., Malenfant J.M., Altfeld M. CD107a as a functional marker for the identification of natural killer cell activity. J. Immunol. Methods. 2004;294:15–22. doi: 10.1016/j.jim.2004.08.008. [DOI] [PubMed] [Google Scholar]
- Barbarin A., Cayssials E., Jacomet F., Nunez N.G., Basbous S., Lefèvre L., Abdallah M., Piccirilli N., Morin B., Lavoue V. Phenotype of NK-like CD8(+) T cells with innate features in humans and their relevance in cancer diseases. Front. Immunol. 2017;8:316. doi: 10.3389/fimmu.2017.00316. [DOI] [PMC free article] [PubMed] [Google Scholar]
- Bertone S., Schiavetti F., Bellomo R., Vitale C., Ponte M., Moretta L., Mingari M.C. Transforming growth factor-β-induced expression of CD94/NKG2A inhibitory receptors in human T lymphocytes. Eur. J. Immunol. 1999;29:23–29. doi: 10.1002/(SICI)1521-4141(199901)29:01<23::AID-IMMU23>3.0.CO;2-Y. [DOI] [PubMed] [Google Scholar]
- Bhagat G., Naiyer A.J., Shah J.G., Harper J., Jabri B., Wang T.C., Green P.H.R., Manavalan J.S. Small intestinal CD8+TCRγδ+NKG2A+ intraepithelial lymphocytes have attributes of regulatory cells in patients with celiac disease. J. Clin. Invest. 2008;118:281–293. doi: 10.1172/JCI30989. [DOI] [PMC free article] [PubMed] [Google Scholar]
- Blackburn S.D., Shin H., Freeman G.J., Wherry E.J. Selective expansion of a subset of exhausted CD8 T cells by αPD-L1 blockade. Proc. Natl. Acad. Sci. 2008;105:15016–15021. doi: 10.1073/pnas.0801497105. [DOI] [PMC free article] [PubMed] [Google Scholar]
- Brenchley J.M., Silvestri G., Douek D.C. Nonprogressive and progressive primate immunodeficiency lentivirus infections. Immunity. 2010;32:737–742. doi: 10.1016/j.immuni.2010.06.004. [DOI] [PMC free article] [PubMed] [Google Scholar]
- Bronnimann M.P., Skinner P.J., Connick E. The B-cell follicle in HIV infection: barrier to a cure. Front. Immunol. 2018;9 doi: 10.3389/fimmu.2018.00020. [DOI] [PMC free article] [PubMed] [Google Scholar]
- Byers A.M., Andrews N.P., Lukacher A.E. CD94/NKG2A expression is associated with proliferative potential of CD8 T cells during persistent polyoma virus infection. J. Immunol. 2006;176:6121–6129. doi: 10.4049/jimmunol.176.10.6121. [DOI] [PubMed] [Google Scholar]
- Cao Y., Cartwright E.K., Silvestri G., Perelson A.S. CD8+ lymphocyte control of SIV infection during antiretroviral therapy. PLoS Pathog. 2018;14:e1007350. doi: 10.1371/journal.ppat.1007350. [DOI] [PMC free article] [PubMed] [Google Scholar]
- Cappello F., Mazzola M., Jurjus A., Zeenny M.-N., Jurjus R., Carini F., Leone A., Bonaventura G., Tomasello G., Bucchieri F. Hsp60 as a novel target in IBD management: a prospect. Front. Pharmacol. 2019;10:26. doi: 10.3389/fphar.2019.00026. [DOI] [PMC free article] [PubMed] [Google Scholar]
- Cho J.-H., Kim H.-O., Webster K., Palendira M., Hahm B., Kim K.-S., King C., Tangye S.G., Sprent J. Calcineurin-dependent negative regulation of CD94/NKG2A expression on naive CD8+ T cells. Blood. 2011;118:116–128. doi: 10.1182/blood-2010-11-317396. [DOI] [PubMed] [Google Scholar]
- Chovatiya R., Medzhitov R. Stress, inflammation, and defense of homeostasis. Mol. Cell. 2014;54:281–288. doi: 10.1016/j.molcel.2014.03.030. [DOI] [PMC free article] [PubMed] [Google Scholar]
- Cohen S., Janicki-Deverts D., Doyle W.J., Miller G.E., Frank E., Rabin B.S., Turner R.B. Chronic stress, glucocorticoid receptor resistance, inflammation, and disease risk. Proc. Natl. Acad. Sci. U S A. 2012;109:5995–5999. doi: 10.1073/pnas.1118355109. [DOI] [PMC free article] [PubMed] [Google Scholar]
- Collins D.R., Gaiha G.D., Walker B.D. CD8 + T cells in HIV control, cure and prevention. Nat. Rev. Immunol. 2020;20:471–482. doi: 10.1038/s41577-020-0274-9. [DOI] [PMC free article] [PubMed] [Google Scholar]
- Day C.L., Kaufmann D.E., Kiepiela P., Brown J.A., Moodley E.S., Reddy S., Mackey E.W., Miller J.D., Leslie A.J., DePierres C. PD-1 expression on HIV-specific T cells is associated with T-cell exhaustion and disease progression. Nature. 2006;443:350–354. doi: 10.1038/nature05115. [DOI] [PubMed] [Google Scholar]
- Derre L., Corvaisier M., Pandolfino M.-C., Diez E., Jotereau F., Gervois N. Expression of CD94/NKG2-A on human T lymphocytes is induced by IL-12: implications for adoptive immunotherapy. J. Immunol. 2002;168:4864–4870. doi: 10.4049/jimmunol.168.10.4864. [DOI] [PubMed] [Google Scholar]
- Diegelmann J., Seiderer J., Niess J.-H., Haller D., Göke B., Reinecker H.-C., Brand S. Expression and regulation of the chemokine CXCL16 in Crohn’s disease and models of intestinal inflammation. Inflamm. Bowel Dis. 2010;16:1871–1881. doi: 10.1002/ibd.21306. [DOI] [PMC free article] [PubMed] [Google Scholar]
- Eugène J., Jouand N., Ducoin K., Dansette D., Oger R., Deleine C., Leveque E., Meurette G., Podevin J., Matysiak T. The inhibitory receptor CD94/NKG2A on CD8 + tumor-infiltrating lymphocytes in colorectal cancer: a promising new druggable immune checkpoint in the context of HLAE/β2m overexpression. Mod. Pathol. 2020;33:468–482. doi: 10.1038/s41379-019-0322-9. [DOI] [PubMed] [Google Scholar]
- Favre D., Lederer S., Kanwar B., Ma Z.-M., Proll S., Kasakow Z., Mold J., Swainson L., Barbour J.D., Baskin C.R. Critical loss of the balance between Th17 and T regulatory cell populations in pathogenic SIV infection. PLoS Pathog. 2009;5:e1000295. doi: 10.1371/journal.ppat.1000295. [DOI] [PMC free article] [PubMed] [Google Scholar]
- Fukazawa Y., Lum R., Okoye A.A., Park H., Matsuda K., Bae J.Y., Hagen S.I., Shoemaker R., Deleage C., Lucero C. A B cell follicle sanctuary permits persistent productive SIV infection in elite controllers. Nat. Med. 2015;21:132–139. doi: 10.1038/nm.3781. [DOI] [PMC free article] [PubMed] [Google Scholar]
- Garcia-Tellez T., Huot N., Ploquin M.J., Rascle P., Jacquelin B., Müller-Trutwin M. Non-human primates in HIV research: achievements, limits and alternatives. Infect. Genet. Evol. 2016;46:324–332. doi: 10.1016/j.meegid.2016.07.012. [DOI] [PubMed] [Google Scholar]
- Gordon S.N., Cervasi B., Odorizzi P., Silverman R., Aberra F., Ginsberg G., Estes J.D., Paiardini M., Frank I., Silvestri G. Disruption of intestinal CD4+ T cell homeostasis is a key marker of systemic CD4+ T cell activation in HIV-infected individuals. J. Immunol. 2010;185:5169–5179. doi: 10.4049/jimmunol.1001801. [DOI] [PMC free article] [PubMed] [Google Scholar]
- Hansen S.G., Wu H.L., Burwitz B.J., Hughes C.M., Hammond K.B., Ventura A.B., Reed J.S., Gilbride R.M., Ainslie E., Morrow D.W. Broadly targeted CD8+ T cell responses restricted by major histocompatibility complex E. Science. 2016:714–720. doi: 10.1126/science.aac9475. [DOI] [PMC free article] [PubMed] [Google Scholar]
- Hollande C., Boussier J., Ziai J., Nozawa T., Bondet V., Phung W., Lu B., Duffy D., Paradis V., Mallet V. Inhibition of the dipeptidyl peptidase DPP4 (CD26) reveals IL-33-dependent eosinophil-mediated control of tumor growth. Nat. Immunol. 2019;20:257–264. doi: 10.1038/s41590-019-0321-5. [DOI] [PubMed] [Google Scholar]
- Hong J.J., Silveira E.L.V., Amancha P.K., Byrareddy S.N., Gumber S., Chang K.-T., Ansari A.A., Villinger F. Early initiation of antiretroviral treatment post SIV infection does not resolve lymphoid tissue activation. AIDS Lond. Engl. 2017;31:1819–1824. doi: 10.1097/QAD.0000000000001576. [DOI] [PMC free article] [PubMed] [Google Scholar]
- Hunt P.W., Landay A.L., Sinclair E., Martinson J.A., Hatano H., Emu B., Norris P.J., Busch M.P., Martin J.N., Brooks C. A low T regulatory cell response may contribute to both viral control and generalized immune activation in HIV controllers. PLoS One. 2011;6:e15924. doi: 10.1371/journal.pone.0015924. [DOI] [PMC free article] [PubMed] [Google Scholar]
- Hunt P.W., Sinclair E., Rodriguez B., Shive C., Clagett B., Funderburg N., Robinson J., Huang Y., Epling L., Martin J.N. Gut epithelial barrier dysfunction and innate immune activation predict mortality in treated HIV infection. J. Infect. Dis. 2014;210:1228–1238. doi: 10.1093/infdis/jiu238. [DOI] [PMC free article] [PubMed] [Google Scholar]
- Huot N., Rascle P., Petitdemange C., Contreras V., Palgen J.-L., Stahl-Hennig C., Le Grand R., Beignon A.-S., Jacquelin B., Müller-Trutwin M. Non-human primate determinants of NK cells in tissues at steady-state and during SIV infection. Front. Immunol. 2020;11:2134. doi: 10.3389/fimmu.2020.02134. [DOI] [PMC free article] [PubMed] [Google Scholar]
- Jabri B., Selby J.M., Negulescu H., Lee L., Roberts A.I., Beavis A., Lopez-Botet M., Ebert E.C., Winchester R.J. TCR specificity dictates CD94/NKG2A expression by human CTL. Immunity. 2002;17:487–499. doi: 10.1016/s1074-7613(02)00427-2. [DOI] [PubMed] [Google Scholar]
- Jacquelin B., Mayau V., Targat B., Liovat A.-S., Kunkel D., Petitjean G., Dillies M.-A., Roques P., Butor C., Silvestri G. Nonpathogenic SIV infection of African green monkeys induces a strong but rapidly controlled type I IFN response. J. Clin. Invest. 2009;119:3544–3555. doi: 10.1172/JCI40093. [DOI] [PMC free article] [PubMed] [Google Scholar]
- Jacquelin B., Petitjean G., Kunkel D., Liovat A.-S., Jochems S.P., Rogers K.A., Ploquin M.J., Madec Y., Barré-Sinoussi F., Dereuddre-Bosquet N. Innate immune responses and rapid control of inflammation in African green monkeys treated or not with interferon-alpha during primary SIVagm infection. Plos Pathog. 2014;10:e1004241. doi: 10.1371/journal.ppat.1004241. [DOI] [PMC free article] [PubMed] [Google Scholar]
- Kalsheker N.A. Alpha 1-antichymotrypsin. Int. J. Biochem. Cell Biol. 1996;28:961–964. doi: 10.1016/1357-2725(96)00032-5. [DOI] [PubMed] [Google Scholar]
- Katsurada T., Kobayashi W., Tomaru U., Baba T., Furukawa S., Ishizu A., Takeda K., Sakamoto N., Asaka M., Takeda H. Decrease of peripheral and intestinal NKG2A-positive T cells in patients with ulcerative colitis. PLoS One. 2012;7:e44113. doi: 10.1371/journal.pone.0044113. [DOI] [PMC free article] [PubMed] [Google Scholar]
- Kaufmann D., Walker B. PD-1 and CTLA-4 inhibitory cosignaling pathways in HIV infection and the potential for therapeutic intervention. J. Immunol. 2009;182:5891–5897. doi: 10.4049/jimmunol.0803771. [DOI] [PMC free article] [PubMed] [Google Scholar]
- Keynan Y., Card C., McLaren P., Dawood M., Kasper K., Fowke K. The role of regulatory T cells in chronic and acute viral infections. Clin. Infect. Dis. Off. Publ. Infect. Dis. Soc. Am. 2008;46:1046–1052. doi: 10.1086/529379. [DOI] [PubMed] [Google Scholar]
- Kim H.-J., Cantor H. Regulation of self-tolerance by Qa-1-restricted CD8+ regulatory T cells. Semin. Immunol. 2011;23:446–452. doi: 10.1016/j.smim.2011.06.001. [DOI] [PMC free article] [PubMed] [Google Scholar]
- Lim K.S., Yong Z.W.E., Wang H., Tan T.Z., Huang R.Y.-J., Yamamoto D., Inaki N., Hazawa M., Wong R.W., Oshima H. Inflammatory and mitogenic signals drive interleukin 23 subunit alpha (IL23A) secretion independent of IL12B in intestinal epithelial cells. J. Biol. Chem. 2020;295:6387–6400. doi: 10.1074/jbc.RA120.012943. [DOI] [PMC free article] [PubMed] [Google Scholar]
- Lu L., Kim H.-J., Werneck M.B.F., Cantor H. Regulation of CD8+ regulatory T cells: interruption of the NKG2A–Qa-1 interaction allows robust suppressive activity and resolution of autoimmune disease. Proc. Natl. Acad. Sci. 2008;105:19420–19425. doi: 10.1073/pnas.0810383105. [DOI] [PMC free article] [PubMed] [Google Scholar]
- Maloy K.J., Kullberg M.C. IL-23 and Th17 cytokines in intestinal homeostasis. Mucosal Immunol. 2008;1:339–349. doi: 10.1038/mi.2008.28. [DOI] [PubMed] [Google Scholar]
- Manickam C., Shah S.V., Lucar O., Ram D.R., Reeves R.K. Cytokine-mediated tissue injury in non-human primate models of viral infections. Front. Immunol. 2018;9:2862. doi: 10.3389/fimmu.2018.02862. [DOI] [PMC free article] [PubMed] [Google Scholar]
- Maria A.D., Ferraris A., Guastella M., Pilia S., Cantoni C., Polero L., Mingari M.C., Bassetti D., Fauci A.S., Moretta L. Expression of HLA class I-specific inhibitory natural killer cell receptors in HIV-specific cytolytic T lymphocytes: impairment of specific cytolytic functions. Proc. Natl. Acad. Sci. 1997;94:10285–10288. doi: 10.1073/pnas.94.19.10285. [DOI] [PMC free article] [PubMed] [Google Scholar]
- Micci L., Cervasi B., Ende Z.S., Iriele R.I., Reyes-Aviles E., Vinton C., Else J., Silvestri G., Ansari A.A., Villinger F. Paucity of IL-21-producing CD4(+) T cells is associated with Th17 cell depletion in SIV infection of rhesus macaques. Blood. 2012;120:3925–3935. doi: 10.1182/blood-2012-04-420240. [DOI] [PMC free article] [PubMed] [Google Scholar]
- Michaëlsson J., Teixeira de Matos C., Achour A., Lanier L.L., Kärre K., Söderström K. A signal peptide derived from hsp60 binds HLA-E and interferes with CD94/NKG2A recognition. J. Exp. Med. 2002;196:1403–1414. doi: 10.1084/jem.20020797. [DOI] [PMC free article] [PubMed] [Google Scholar]
- Miller J.D., Peters M., Oran A.E., Beresford G.W., Harrington L., Boss J.M., Altman J.D. CD94/NKG2 expression does not inhibit cytotoxic function of lymphocytic choriomeningitis virus-specific CD8+ T cells. J. Immunol. 2002;169:693–701. doi: 10.4049/jimmunol.169.2.693. [DOI] [PubMed] [Google Scholar]
- Mingari M.C., Vitale C., Cambiaggi A., Schiavetti F., Melioli G., Ferrini S., Poggi A. Cytolytic T lymphocytes displaying natural killer (NK)-like activity: expression of NK-related functional receptors for HLA class I molecules (p58 and CD94) and inhibitory effect on the TCR-mediated target cell lysis or lymphokine production. Int. Immunol. 1995;7:697–703. doi: 10.1093/intimm/7.4.697. [DOI] [PubMed] [Google Scholar]
- Mingari M.C., Ponte M., Bertone S., Schiavetti F., Vitale C., Bellomo R., Moretta A., Moretta L. HLA class I-specific inhibitory receptors in human T lymphocytes: interleukin 15-induced expression of CD94/NKG2A in superantigen- or alloantigen-activated CD8+ T cells. Proc. Natl. Acad. Sci. 1998;95:1172–1177. doi: 10.1073/pnas.95.3.1172. [DOI] [PMC free article] [PubMed] [Google Scholar]
- Mingari M.C., Pietra G., Moretta L. Immune checkpoint inhibitors: anti-NKG2A antibodies on board. Trends Immunol. 2019;40:83–85. doi: 10.1016/j.it.2018.12.009. [DOI] [PubMed] [Google Scholar]
- Miyagawa I., Nakayamada S., Nakano K., Yamagata K., Sakata K., Yamaoka K., Tanaka Y. Induction of regulatory T cells and its regulation with insulin-like growth factor/insulin-like growth factor binding protein-4 by human mesenchymal stem cells. J. Immunol. 2017;199:1616–1625. doi: 10.4049/jimmunol.1600230. [DOI] [PubMed] [Google Scholar]
- van Montfoort N., Borst L., Korrer M.J., Sluijter M., Marijt K.A., Santegoets S.J., van Ham V.J., Ehsan I., Charoentong P., André P. NKG2A blockade potentiates CD8 T cell immunity induced by cancer vaccines. Cell. 2018;175:1744–1755.e15. doi: 10.1016/j.cell.2018.10.028. [DOI] [PMC free article] [PubMed] [Google Scholar]
- Moser J.M., Gibbs J., Jensen P.E., Lukacher A.E. CD94-NKG2A receptors regulate antiviral CD8 + T cell responses. Nat. Immunol. 2002;3:189–195. doi: 10.1038/ni757. [DOI] [PubMed] [Google Scholar]
- Nattermann J., Nischalke H.D., Hofmeister V., Kupfer B., Ahlenstiel G., Feldmann G., Rockstroh J., Weiss E.H., Sauerbruch T., Spengler U. HIV-1 infection leads to increased HLA-E expression resulting in impaired function of natural killer cells. Antivir. Ther. 2005;10:95–107. doi: 10.1177/135965350501000107. [DOI] [PubMed] [Google Scholar]
- Nattermann J., Feldmann G., Ahlenstiel G., Langhans B., Sauerbruch T., Spengler U. Surface expression and cytolytic function of natural killer cell receptors is altered in chronic hepatitis C. Gut. 2006;55:869–877. doi: 10.1136/gut.2005.076463. [DOI] [PMC free article] [PubMed] [Google Scholar]
- Noppen C., Schaefer C., Zajac P., Schütz A., Kocher T., Kloth J., Heberer M., Colonna M., Libero G.D., Spagnoli G.C. C-type lectin-like receptors in peptide-specific HLA class I-restricted cytotoxic T lymphocytes: differential expression and modulation of effector functions in clones sharing identical TCR structure and epitope specificity. Eur. J. Immunol. 1998;28:1134–1142. doi: 10.1002/(SICI)1521-4141(199804)28:04<1134::AID-IMMU1134>3.0.CO;2-G. [DOI] [PubMed] [Google Scholar]
- Odorizzi P.M., Wherry E.J. Inhibitory receptors on lymphocytes: insights from infections. J. Immunol. 2012;188:2957–2965. doi: 10.4049/jimmunol.1100038. [DOI] [PMC free article] [PubMed] [Google Scholar]
- Pallikkuth S., Micci L., Ende Z.S., Iriele R.I., Cervasi B., Lawson B., McGary C.S., Rogers K.A., Else J.G., Silvestri G. Maintenance of intestinal Th17 cells and reduced microbial translocation in SIV-infected rhesus macaques treated with interleukin (IL)-21. PLoS Pathog. 2013;9:e1003471. doi: 10.1371/journal.ppat.1003471. [DOI] [PMC free article] [PubMed] [Google Scholar]
- Pandrea I.V., Gautam R., Ribeiro R.M., Brenchley J.M., Butler I.F., Pattison M., Rasmussen T., Marx P.A., Silvestri G., Lackner A.A. Acute loss of intestinal CD4+ T cells is not predictive of simian immunodeficiency virus virulence. J. Immunol. 2007;179:3035–3046. doi: 10.4049/jimmunol.179.5.3035. [DOI] [PMC free article] [PubMed] [Google Scholar]
- Pereira B.I., Devine O.P., Vukmanovic-Stejic M., Chambers E.S., Subramanian P., Patel N., Virasami A., Sebire N.J., Kinsler V., Valdovinos A. Senescent cells evade immune clearance via HLA-E-mediated NK and CD8 + T cell inhibition. Nat. Commun. 2019;10:2387. doi: 10.1038/s41467-019-10335-5. [DOI] [PMC free article] [PubMed] [Google Scholar]
- Perera L., Shao L., Patel A., Evans K., Meresse B., Blumberg R., Geraghty D., Groh V., Spies T., Jabri B. Expression of nonclassical class I molecules by intestinal epithelial cells. Inflamm. Bowel Dis. 2007;13:298–307. doi: 10.1002/ibd.20026. [DOI] [PubMed] [Google Scholar]
- Ploquin M.J., Madec Y., Casrouge A., Huot N., Passaes C., Lécuroux C., Essat A., Boufassa F., Jacquelin B., Jochems S.P. Elevated basal pre-infection CXCL10 in plasma and in the small intestine after infection are associated with more rapid HIV/SIV disease onset. PLoS Pathog. 2016;12:e1005774. doi: 10.1371/journal.ppat.1005774. [DOI] [PMC free article] [PubMed] [Google Scholar]
- Ploquin M.J.-Y., Desoutter J.-F., Santos P.R., Pandrea I., Diop O.M., Hosmalin A., Butor C., Barre-Sinoussi F., Müller-Trutwin M.C. Distinct expression profiles of TGF-β1 signaling mediators in pathogenic SIVmac and non-pathogenic SIVagm infections. Retrovirology. 2006;3:37. doi: 10.1186/1742-4690-3-37. [DOI] [PMC free article] [PubMed] [Google Scholar]
- Raehtz K., Pandrea I., Apetrei C. The well-tempered SIV infection: pathogenesis of SIV infection in natural hosts in the wild, with emphasis on virus transmission and early events post-infection that may contribute to protection from disease progression. Infect. Genet. Evol. 2016;46:308–323. doi: 10.1016/j.meegid.2016.07.006. [DOI] [PMC free article] [PubMed] [Google Scholar]
- Raehtz K.D., Barrenäs F., Xu C., Busman-Sahay K., Valentine A., Law L., Ma D., Policicchio B.B., Wijewardana V., Brocca-Cofano E. African green monkeys avoid SIV disease progression by preventing intestinal dysfunction and maintaining mucosal barrier integrity. PLoS Pathog. 2020;16:e1008333. doi: 10.1371/journal.ppat.1008333. [DOI] [PMC free article] [PubMed] [Google Scholar]
- Rapaport A.S., Schriewer J., Gilfillan S., Hembrador E., Crump R., Plougastel B.F., Wang Y., Le Friec G., Gao J., Cella M. The inhibitory receptor NKG2A sustains virus-specific CD8+ T cells in response to a lethal poxvirus infection. Immunity. 2015;43:1112–1124. doi: 10.1016/j.immuni.2015.11.005. [DOI] [PMC free article] [PubMed] [Google Scholar]
- Sagebiel A.F., Steinert F., Lunemann S., Körner C., Schreurs R.R.C.E., Altfeld M., Perez D., Reinshagen K., Bunders M.J. Tissue-resident Eomes+ NK cells are the major innate lymphoid cell population in human infant intestine. Nat. Commun. 2019;10:975. doi: 10.1038/s41467-018-08267-7. [DOI] [PMC free article] [PubMed] [Google Scholar]
- Saito M., Braud V.M., Goon P., Hanon E., Taylor G.P., Saito A., Eiraku N., Tanaka Y., Usuku K., Weber J.N. Low frequency of CD94/NKG2A+ T lymphocytes in patients with HTLV-1-associated myelopathy/tropical spastic paraparesis, but not in asymptomatic carriers. Blood. 2003;102:577–584. doi: 10.1182/blood-2002-09-2855. [DOI] [PubMed] [Google Scholar]
- Sato T., Thorlacius H., Johnston B., Staton T.L., Xiang W., Littman D.R., Butcher E.C. Role for CXCR6 in recruitment of activated CD8+ lymphocytes to inflamed liver. J. Immunol. 2005;174:277–283. doi: 10.4049/jimmunol.174.1.277. [DOI] [PubMed] [Google Scholar]
- Schuetz A., Deleage C., Sereti I., Rerknimitr R., Phanuphak N., Phuang-Ngern Y., Estes J.D., Sandler N.G., Sukhumvittaya S., Marovich M. Initiation of ART during early acute HIV infection preserves mucosal Th17 function and reverses HIV-related immune activation. PLoS Pathog. 2014;10:e1004543. doi: 10.1371/journal.ppat.1004543. [DOI] [PMC free article] [PubMed] [Google Scholar]
- Shao L., Kamalu O., Mayer L. Non-classical MHC class I molecules on intestinal epithelial cells: mediators of mucosal crosstalk. Immunol. Rev. 2005;206:160–176. doi: 10.1111/j.0105-2896.2005.00295.x. [DOI] [PubMed] [Google Scholar]
- Sun H., Sun C., Xiao W., Sun R. Tissue-resident lymphocytes: from adaptive to innate immunity. Cell. Mol. Immunol. 2019;16:205–215. doi: 10.1038/s41423-018-0192-y. [DOI] [PMC free article] [PubMed] [Google Scholar]
- Suvas S., Azkur A.K., Rouse B.T. Qa-1b and CD94-NKG2a interaction regulate cytolytic activity of herpes simplex virus-specific memory CD8+ T cells in the latently infected trigeminal ganglia. J. Immunol. 2006;176:1703–1711. doi: 10.4049/jimmunol.176.3.1703. [DOI] [PubMed] [Google Scholar]
- Takao S., Ishikawa T., Yamashita K., Uchiyama T. The rapid induction of HLA-E is essential for the survival of antigen-activated naive CD4 T cells from attack by NK cells. J. Immunol. 2010;185:6031–6040. doi: 10.4049/jimmunol.1000176. [DOI] [PubMed] [Google Scholar]
- Thangamathesvaran L., Shah R., Verma R., Mahmoud O. Immune checkpoint inhibitors and radiotherapy-concept and review of current literature. Ann. Transl. Med. 2018;6:155. doi: 10.21037/atm.2018.03.09. [DOI] [PMC free article] [PubMed] [Google Scholar]
- Thimme R., Appay V., Koschella M., Panther E., Roth E., Hislop A.D., Rickinson A.B., Rowland-Jones S.L., Blum H.E., Pircher H. Increased expression of the NK cell receptor KLRG1 by virus-specific CD8 T cells during persistent antigen stimulation. J. Virol. 2005;79:12112–12116. doi: 10.1128/JVI.79.18.12112-12116.2005. [DOI] [PMC free article] [PubMed] [Google Scholar]
- Trautmann L., Janbazian L., Chomont N., Said E.A., Gimmig S., Bessette B., Boulassel M.-R., Delwart E., Sepulveda H., Balderas R.S. Upregulation of PD-1 expression on HIV-specific CD8+ T cells leads to reversible immune dysfunction. Nat. Med. 2006;12:1198–1202. doi: 10.1038/nm1482. [DOI] [PubMed] [Google Scholar]
- Vivier E., Anfossi N. Inhibitory NK-cell receptors on T cells: witness of the past, actors of the future. Nat. Rev. Immunol. 2004;4:190–198. doi: 10.1038/nri1306. [DOI] [PubMed] [Google Scholar]
- Walsh C.E., Ryan E.J., O’Farrelly C., Golden-Mason L., FitzGerald O., Veale D.J., Bresnihan B., Fearon U. Differential expression of NK receptors CD94 and NKG2A by T cells in rheumatoid arthritis patients in remission compared to active disease. PLoS One. 2011;6:e27182. doi: 10.1371/journal.pone.0027182. [DOI] [PMC free article] [PubMed] [Google Scholar]
- Warren H.S., Rana P.M., Rieger D.T., Hewitt K.A., Dahlstrom J.E., Kent A.L. CD8 T cells expressing killer Ig-like receptors and NKG2A are present in cord blood and express a more naïve phenotype than their counterparts in adult blood. J. Leukoc. Biol. 2006;79:1252–1259. doi: 10.1189/jlb.0905536. [DOI] [PubMed] [Google Scholar]
- Wesch D., Kabelitz D. Differential expression of natural killer receptors on Vdelta1 gammadelta T cells in HIV-1-infected individuals. J. Acquir. Immune Defic. Syndr. 2003;33:420–425. doi: 10.1097/00126334-200308010-00002. [DOI] [PubMed] [Google Scholar]
- Wu H.L., Wiseman R.W., Hughes C.M., Webb G.M., Abdulhaqq S.A., Bimber B.N., Hammond K.B., Reed J.S., Gao L., Burwitz B.J. The role of MHC-E in T cell immunity is conserved among humans, rhesus macaques, and cynomolgus macaques. J. Immunol. 2018;200:49–60. doi: 10.4049/jimmunol.1700841. [DOI] [PMC free article] [PubMed] [Google Scholar]
- Zeddou M., Rahmouni S., Vandamme A., Jacobs N., Frippiat F., Leonard P., Schaaf-Lafontaine N., Vaira D., Boniver J., Moutschen M. Downregulation of CD94/NKG2A inhibitory receptors on CD8+T cells in HIV infection is more pronounced in subjects with detected viral load than in their aviraemic counterparts. Retrovirology. 2007;4:72. doi: 10.1186/1742-4690-4-72. [DOI] [PMC free article] [PubMed] [Google Scholar]
- Zeng M., Southern P.J., Reilly C.S., Beilman G.J., Chipman J.G., Schacker T.W., Haase A.T. Lymphoid tissue damage in HIV-1 infection depletes naïve T cells and limits T cell reconstitution after antiretroviral therapy. PLoS Pathog. 2012;8:e1002437. doi: 10.1371/journal.ppat.1002437. [DOI] [PMC free article] [PubMed] [Google Scholar]
Associated Data
This section collects any data citations, data availability statements, or supplementary materials included in this article.
Supplementary Materials
Data Availability Statement
RNA sequencing data have been deposited in the ArrayExpress database ArrayExpress: E-MTAB-8664.