

Abstract
Introduction
This study was designed to compare the BCRAT (Gail), IBIS (Tyrer-Cuzick), and BRCAPRO breast cancer risk assessment models using data from the Marin Women’s Study (MWS), a cohort of women within Marin County, California, with high rates of breast cancer, nulliparity, and delayed childbirth. Existing models have not been well-validated in these high risk populations.
Methods
Discrimination was assessed by AUC and calibration by estimating the ratio of expected to observed (E/O) cases. Models were assessed using data from 12,843 participants of whom 203 developed cancer in a 5-year period. All tests of statistical significance were two-sided.
Results
The IBIS model achieved an AUC of 0.65 (0.61–0.68 95% CI) compared to 0.62 (0.59–0.66 95% CI) for BCRAT and 0.60 (0.56–0.63 95% CI) for BRCAPRO. The estimated E/O ratios for the models were 1.08 (0.95–1.25 95% CI), 0.81 (0.71–0.93 95% CI), and 0.59 (0.52–0.68 95% CI) respectively. In women with age of first birth over 30, the AUC for the IBIS, BCRAT, and BRCAPRO models was 0.69 (0.62–0.75 95% CI), 0.63 (0.56–0.70 95% CI), and 0.62 (0.56–0.68 95% CI) and E/O ratios 1.15 (0.89–1.47 95% CI), 0.81 (0.63–1.05 95% CI), and 0.53 (0.41–0.68 95% CI) respectively.
Conclusions
The IBIS model was well calibrated for the high risk Marin mammography population, achieved the highest discrimination among the three models considered, and performed better in women with age first birth over 30. Both the BCRAT and BRCAPRO models had fair discriminatory ability but significantly underestimated risk for the Marin County mammography population.
Keywords: Breast cancer risk prediction, nulliparity, risk factors, calibration, discrimination
MICROABSTRACT
Breast cancer risk models have been found to be of limited value for women at high risk. We looked at three existing models in 12,843 women of the Marin Women’s Study where rates of nulliparity and delayed childbirth are very high. The IBIS model performed best, while the most widely used Gail model significantly underestimated risk in these women.
INTRODUCTION
Within the past two decades, growing interest in breast cancer risk prediction has stimulated the development of several risk models. These models are used to identify women at high risk of cancer who might benefit from targeted screening or chemoprevention, to estimate population burden, and to assist physicians and patients in clinical decision-making. Yet validation studies of these models have shown variability in calibration and discrimination when applied to differing populations. Many of the models have significantly underestimated risk in women who are nulliparous or whose first live birth was over the age of 30 as well as in other high-risk populations.[1–4] Risk models are best calibrated to the population on which they were developed, and are typically developed in general populations to enhance the applicability of the model to outside populations. Thus, the models may have lower performance in populations with high numbers of either high or low risk women.
The County of Marin, just north of San Francisco, has the highest rates of nulliparity and age at first birth over 30 of all California counties, and has for many years had among the highest breast cancer rates of any county in the United States.[5–8] It has been postulated that at least part of the explanation for these increased rates is the delayed childbirth seen in Marin women.[5,8] Of respondents in the Marin Women’s Study, a mammography-based study of women in Marin County, 57.6% have not had a child by the age of 30. According to a report by the CDC in 2009, the average age of first birth has increased from 21.4 to 24.0 in the United States during the period of 1970 to 2006, emphasizing the importance of accuracy of existing models in this population.[9] This trend is not just limited to the United States, and was seen in all developed countries studied, with the United States actually having the lowest age of first birth of all developed countries. According to a report from Pew Research, from 1990 to 2008 the percentage of children born to mothers 35+ has increased from 9 to 14%, and has tripled in women 40+.[10]
METHODS
This study was done as a retrospective cohort within the Marin Women’s Study (MWS), and all women without breast cancer as of January 1, 2003 were selected to compare performance of three different risk prediction models in a 5-year follow-up period. The performance of the risk prediction models was assessed using two criteria: calibration and discrimination. Calibration is a measure of the ability of a model to accurately predict the number of events in a population. Discrimination measures the model’s ability to discriminate at the individual level between women who will and will not develop breast cancer, and is measured by calculating the area under the receiver operating characteristic curve, or AUC. An AUC of 0.5 identifies a model whose discriminatory accuracy is no better than the toss of a coin, whereas an AUC of 1.0 identifies a model with perfect discriminatory accuracy.
Included in the current analysis are three of the most widely used models, the Breast Cancer Risk Assessment Tool (BCRAT, or Gail model),[11] BRCAPRO[12] and IBIS Breast Cancer Risk Evaluation Tool (Tyrer-Cuzick model).[13] These models are tested for calibration and discrimination in participants of the Marin Women’s Study to assess the performance of these models in women known to have high rates of nulliparity and delayed childbirth.
This study was approved by the Marin General Hospital Institutional Review Board, as well as the Kaiser Permanente Northern California Institutional Review Board, and all participants provided informed consent to fully participate in the study. MWS questionnaire data was collected between years 2006 and 2009, the reference baseline was set at the start of 2003, and the population of interest was restricted to women who were breast cancer free at this baseline. The outcome was defined as occurrence of any invasive breast cancer between 2003 and 2007 either reported by women on the questionnaire or included in the cancer registry data obtained from the SFMR.
Marin Women’s Study (MWS)
Funded by the Centers for Disease Control and Prevention (CDC), the Marin Women’s Study (MWS) was conducted in Marin County, California at all major screening centers in the county including those associated with Kaiser Permanente, Marin General Hospital, and Novato Community Hospitals. These mammography sites are included in the San Francisco Mammography Registry (SFMR), one of seven registries included in the National Cancer Institute Breast Cancer Surveillance Consortium. All women were asked to participate regardless of history, and in the period of enrollment from 2006–2009, the MWS enrolled 13,344 women living in Marin, which represented 21.5% of all women of mammography age in the county.[14] Comparison of risk factors of women in the MWS was made to the overall Marin population of similar ages using CHIS (California Health Interview Survey) and age of menarche, menopause, and BMI were very similar, but study women had slightly increased rates of nulliparity and age of first birth > 30. ??Is this CHIS statement necessary?
The MWS collected detailed risk factor information and saliva specimens from women obtaining mammograms at area facilities, as well as mammographic breast density (both BIRADS and SXA compositional density). Pathology and case status data was obtained from the San Francisco Mammography Registry, which collected data from the same women during the same time period.
All women enrolled in the MWS were asked to complete an in-depth 87-item questionnaire which included questions regarding reproductive history, use of exogenous hormones, life course alcohol intake, smoking history, and family history of breast cancer. Additional information collected included current and high school socioeconomic status, diet/nutrition, medications, environmental exposures, measures of stress, education level and work status, and years of residence in Marin County.
Secondary data is obtained by linkage with SFMR and includes compositional breast density (SXA), breast cancer case status, demographic data, body mass index (BMI), and family history (including history of breast cancer in first-degree female relatives and age at diagnosis).
The study population for the current analysis was defined as the subset of women in the Marin County mammography population who were breast cancer free at the beginning of the year 2003. A total of 501 were excluded based on this criterion, resulting in a subset of 12,843 MWS participants. Of these, 203 women developed invasive breast cancer in the subsequent 5-year follow-up period ending in 2007.
The three risk prediction models included in the analysis are described below, and the variables included in each model are illustrated in Table 1.
Table 1:
Comparison of risk factors used in breast cancer risk prediction models
| Breast cancer risk prediction models | ||||
|---|---|---|---|---|
| Risk Factor | Marin Women’s Study (MWS) | BCRAT (Gail) | BRCAPRO | IBIS (Tyrer-Cuzick) |
| Demographic Information | ||||
| Current age | Yes | Yes | Yes | Yes |
| Body mass index (BMI) | Yes | No | No | Yes |
| Alcohol intake | Yes | No | No | No |
| Reproduetive and hormonal factors | ||||
| Age at menarche | Yes | Yes | No | Yes |
| Age at first live birth | Yes | Yes | No | Yes |
| Age at menopause | Yes | No | No | Yes |
| Hormone replacement therapy use (HRT) | Yes | No | No | Yes |
| Oral contraceptive use (OCP) | Yes | No | No | No |
| Breastfeeding | Yes | No | No | No |
| Plasma estrogen level | No | No | No | No |
| Personal history of breast health | ||||
| Number of biopsies | Yes | Yes | No | No |
| Atypical hyperplasia | Yes | Yes | No | Yes |
| LCIS | Yes | Yes | Yes | Yes |
| DCIS | Yes | Yes | Yes | No |
| Breast density | Yes | No | No | No |
| Family pedigree | ||||
| 1st degree family history mother/sister/daughter) | Yes | Yes | Yes | Yes |
| 2nd degree family history | No | No | Yes | Yes |
| 3rd degree family history | No | No | No | No |
| Age of onset of breast cancer in relative | Yes | No | Yes | Yes |
| Bilateral breast cancer in relative | No | No | Yes | Yes |
| Ovarian cancer in 1st/2nd/3rd degree relatives | No | No | Yes | Yes |
| Male breast cancer in 1st/2nd/3rd degree relatives | No | No | Yes | No |
BCRAT (Gail):
The Gail model was the first breast cancer risk prediction model to be widely disseminated to both health care professionals for use in clinical settings and to the public. The model focuses on non-genetic risk factors, with limited information on family history. The Gail model is unique in that it has been validated in three large population-based databases, and has been shown to work best in general assessment clinics where family history is not the main reason for referral.[11,15,16] In a recent systematic review by Amir et al.,[1] it was reported that while the Gail model was well calibrated, it underestimated risk in women who were nulliparous or whose first live birth was after age 30.[2,17–20]
BRCAPRO:
The BRCAPRO models[12] were originally developed by Parmigiani and colleagues in 1997 to determine the likelihood of carrying a BRCA gene mutation based on family history. A computerized BRCAPRO model includes an extension software package that enables the calculation of breast cancer risk.[21] An advantage of the model is that it includes information on both affected and non-affected relatives. However, this model has a number of limitations, the biggest being that non-hereditary risk factors are not included in the model, and the model has been shown to underestimate risk in women with delayed childbirth.[3]
IBIS (Tyrer-Cuzick):
This model was derived in part from a dataset acquired from the International Breast Intervention Study (IBIS).[13] It includes the most comprehensive set of variables of all the models, and is unique in its inclusion of family history, exogenous and endogenous estrogen exposure, and benign breast disease. To date two studies have compared the predictive values of multiple breast cancer risk models (one prospectively, and one retrospectively), where the Gail, BRCAPRO and Tyrer-Cuzick models were tested. It was found that the Tyrer-Cuzick model was the most consistently accurate model for predicting risk of breast cancer.[2,22]
A few risk factors such as race and age of menarche are invariant to the reference year used in our study. Other risk factors such as age, menopausal status, and hormone replacement therapy (HRT) use and duration, were calculated for the reference year based on detailed questionnaire data collected including start and stop ages for HRT use. Baseline risk factors such as number of first-degree relatives with breast cancer and BMI were obtained at the time of the questionnaire and carried back to the reference year 2003 (i.e. assumed not to have changed between 2003 and the time of the questionnaire).
Current ages for mother, sister, and daughter are not available through the MWS questionnaire or SFMR, and have been set to missing for women who have no history of breast cancer. For mother/sisters/daughters with positive history of breast cancer, data were imputed using SFMR data, which includes information on whether the age at diagnosis was before age 50 for any mother/sister/daughter affected. For mother/sisters/daughters with positive breast cancer history, we set age at diagnosis to 45 if the woman was diagnosed before age 50, and set age at diagnosis to 65 for women who were not diagnosed before age 50. If data were missing on whether diagnosis occurred before age 50, diagnosis age was set to 61, the average age of breast cancer diagnosis in the United States for 2004–2008.[23]
Since number of biopsies and personal history of breast health are strong predictors for breast cancer, we subtracted one from the number of biopsies for women who reported invasive breast cancer on their questionnaire (i.e. we assumed that one biopsy would have occurred for the breast cancer diagnosis reported). The final variable for the number of biopsies had three levels (as used in the BCRAT model): no biopsy, 1 biopsy, and 2 or more biopsies.
Statistical Analysis
IBIS risk scores were calculated using the IBIS Breast Cancer Risk Evaluation Tool version 6.0.0 developed by Tyrer and Cuzick.[13] The IBIS risk evaluation tool calculates 10-year risk scores for breast cancer. To express the predicted risk in terms of the 5-year follow-up period, projections of absolute 10-year risk were divided by 2, assuming linearity of risk.
BRCAPRO, and BCRAT 5-year risk scores were obtained using CancerGene 5.1 developed by University of Texas Southwestern Medical Center. The software uses an R-package called BayesMendel[21] for producing BRCAPRO scores. The software also uses the Breast Cancer Risk Assessment Tool developed by the National Cancer Institute for obtaining the Gail scores.
Predicted risk during the follow-up period was compared with the observed numbers of breast cancer cases (database and cancer registry data). The expected number (E) of breast cancers within the cohort was calculated as the sum of these predicted risks given baseline covariates. E was then compared with the observed number (O) with breast cancer, and 95% confidence intervals of the ratio E/O were obtained with the use of the Poisson variance for the log of the observed number of cases: . We further divided study participants into deciles of predicted 5-year risk for each risk prediction model and compared E and O within the deciles using the Hosmer-Lemeshow χ2-goodness of fit statistic [Hosmer DW, Lemeshow S. Applied LogisticRegression. New York: Wiley and Sons, 2000].
The probability of developing cancer for the five year period at risk was calculated using the different models, and receiver operating characteristic (ROC) curves and the AUCs were generated. All tests of statistical significance were two-sided. Statistical analyses were performed in R version 2.13. AUCs were calculated using “verification” package in R which follows the process outlined in Mason and Graham (2002).[21,25]
RESULTS
Analysis of the study population was performed on data from 12,843 women who were breast cancer free at study baseline (beginning of 2003). During the course of the 5-year follow up period, 203 breast cancers were diagnosed. Table 2 shows the distribution of risk factors in participants.
Table 2:
Prevalence of risk factors in study population
| Risk Factor | Non-cases | Percentage | Cases | Percentage | Total |
|---|---|---|---|---|---|
| Demographic information | |||||
| All | 12,640 | (0.98) | 203 | (0.02) | 12,843 |
| Current age | |||||
| < 40 | 2,087 | (0.17) | 12 | (0.06) | 2,099 |
| 40–49 | 3,794 | (0.30) | 53 | (0.26) | 3,847 |
| 50–59 | 3,850 | (0.30) | 67 | (0.33) | 3,917 |
| 60–69 | 2,004 | (0.16) | 43 | (0.21) | 2,047 |
| 70–79 | 779 | (0.06) | 23 | (0.11) | 802 |
| 80+ | 126 | (0.01) | 5 | (0.02) | 131 |
| Body mass index (BMI) | |||||
| Underweight (<18.5) | 231 | (0.02) | 6 | (0.04) | 237 |
| Normal (18.5–24.9) | 5,942 | (0.47) | 88 | (0.45) | 6,030 |
| Overweight (25–29.9) | 2,279 | (0.18) | 37 | (0.19) | 2,347 |
| Obese (30+) | 1,152 | (0.09) | 30 | (0.15) | 1,182 |
| Missing | 2,918 | (0.23) | 34 | (0.17) | 2,952 |
| Reproductive and hormonal factors | |||||
| Age at menarche | |||||
| <12 years old | 2,253 | (0.18) | 34 | (0.17) | 2,287 |
| 12–13 years old | 7,303 | (0.58) | 119 | (0.59) | 7,422 |
| 14+ years old | 2,994 | (0.23) | 50 | (0.25) | 3,044 |
| Missing | 90 | (0.01) | 0 | (0.00) | 90 |
| Age at first live birth | |||||
| Nulliparous | 3,201 | (0.25) | 57 | (0.28) | 3,258 |
| < 30 years old | 5,118 | (0.40) | 78 | (0.38) | 5,195 |
| 30+ years old | 3,735 | (0.30) | 61 | (0.30) | 3,796 |
| Missing | 586 | (0.05) | 7 | (0.03) | 593 |
| Age at menopause | |||||
| premenopausal | 6,225 | (0.49) | 76 | (0.37) | 6,301 |
| Less than age 50 | 2,703 | (0.21) | 50 | (0.25) | 2,753 |
| 50+ | 3,272 | (0.26) | 69 | (0.34) | 3,341 |
| Missing | 440 | (0.03) | 8 | (0.04) | 448 |
| Hormone replacement therapy use (HRT) | |||||
| Never | 6,886 | (0.54) | 95 | (0.47) | 6,981 |
| Combination use (current) | 908 | (0.07) | 19 | (0.09) | 927 |
| Estrogen-only (current) | 956 | (0.08) | 21 | (0.10) | 977 |
| Other | 2,287 | (0.18) | 47 | (0.23) | 2,334 |
| Missing | 1,603 | (0.13) | 21 | (0.10) | 1,624 |
| Personal history of breast health | |||||
| Number of biopsies | |||||
| Never | 9,629 | (0.76) | 82 | (0.40) | 9,711 |
| 1+ | 2,880 | (0.23) | 114 | (0.56) | 2,994 |
| Missing | 131 | (0.01) | 7 | (0.03) | 138 |
| Atypical hyperplasia | |||||
| Yes | 58 | (0.00) | 7 | (0.03) | 65 |
| Family history breast cancer | |||||
| Mother | 1,405 | (0.11) | 27 | (0.13) | 1,432 |
| Sister | 588 | (0.05) | 16 | (0.08) | 604 |
| Daughter | 69 | (0.01) | 1 | (0.00) | 70 |
Calibration results are displayed in Table 3, which includes data on expected and observed number of cases in the MWS population for the BCRAT, BRCAPRO and IBIS models. The BCRAT model predicted 165 breast cancer cases while 203 were observed. With an E/O ratio of 0.81 (95%CI 0.71– 0.93), this model underestimated absolute risk in our population. The BRCAPRO model predicted only 121 breast cancers compared to the 203 observed, generating the lowest E/O ratio of 0.59 (95%CI 0.52 – 0.68). The IBIS model fared the best, predicting 221 cases, with an E/O ratio of 1.09, which was not significantly different from 1 (E/O=1.09, 95% CI=0.95–1.25), while the BCRAT and BRCAPRO models had ratios significantly less than one, indicating that on average these models underestimated absolute risk in the MWS population.
Table 3:
Calibration of breast cancer risk prediction models by risk decile
| n | Observed (O) | Expected (E) | E/O | 95% CI | ||||||||
| BCRAT (Gail) | 12843 | 203 | 165.18 | 0.81 | (0.71–0.93) | |||||||
| BRCAPRO | 12843 | 203 | 120.54 | 0.59 | (0.52–0.68) | |||||||
| IBIS (Tyrer-Cuzick) | 12843 | 203 | 220.92 | 1.09 | (0.95–1.25) | |||||||
| Deciles of predicted risk | ||||||||||||
| 1 | 2 | 3 | 4 | 5 | 6 | 7 | 8 | 9 | 10 | X2 | p | |
| BCRAT (Gail) | ||||||||||||
| Observed | 8 | 5 | 16 | 17 | 12 | 31 | 25 | 24 | 24 | 41 | 26.78 | 0.0015 |
| Expected | 4.41 | 7.73 | 10.27 | 12.28 | 14.21 | 16.02 | 18.16 | 20.51 | 24.27 | 37.31 | ||
| BRCAPRO | ||||||||||||
| Observed | 8 | 13 | 11 | 18 | 22 | 14 | 21 | 27 | 32 | 37 | 75.82 | ∼=0 |
| Expected | 4.07 | 6.93 | 9.67 | 11.99 | 12.84 | 12.84 | 12.84 | 12.84 | 12.84 | 23.68 | ||
| IBIS (Tyrer-Cuzick) | ||||||||||||
| Observed | 6 | 9 | 12 | 10 | 19 | 26 | 25 | 24 | 31 | 41 | 8.64 | 0.47 |
| Expected | 8.14 | 12.17 | 14.84 | 16.97 | 18.76 | 20.58 | 22.58 | 25.2 | 30.3 | 51.35 | ||
We then compared the expected and observed number of cases within deciles of predicted risk for each model, using a two-sided χ2-goodness of fit test with 9 degrees of freedom (Table 3). As with the overall test of calibration reported above, we fail to reject the null hypothesis that there is a significant difference between the expected and observed number of cases within deciles of predicted risk for the IBIS model (χ2=8.64, p-value=0.47), while this is not the case for the BCRAT and BRCAPRO models.
Figure 1 further illustrates the observed and the expected proportion of cases for each decile of predicted risk in the three models. From Figure 1 it can be seen that BCRAT appears to under-predict in women with slightly higher than median risk. On the other hand, BRCAPRO can be seen to most significantly under-predict in women in the highest deciles of risk. The IBIS model shows a relatively even prediction pattern across all deciles.
Figure 1.
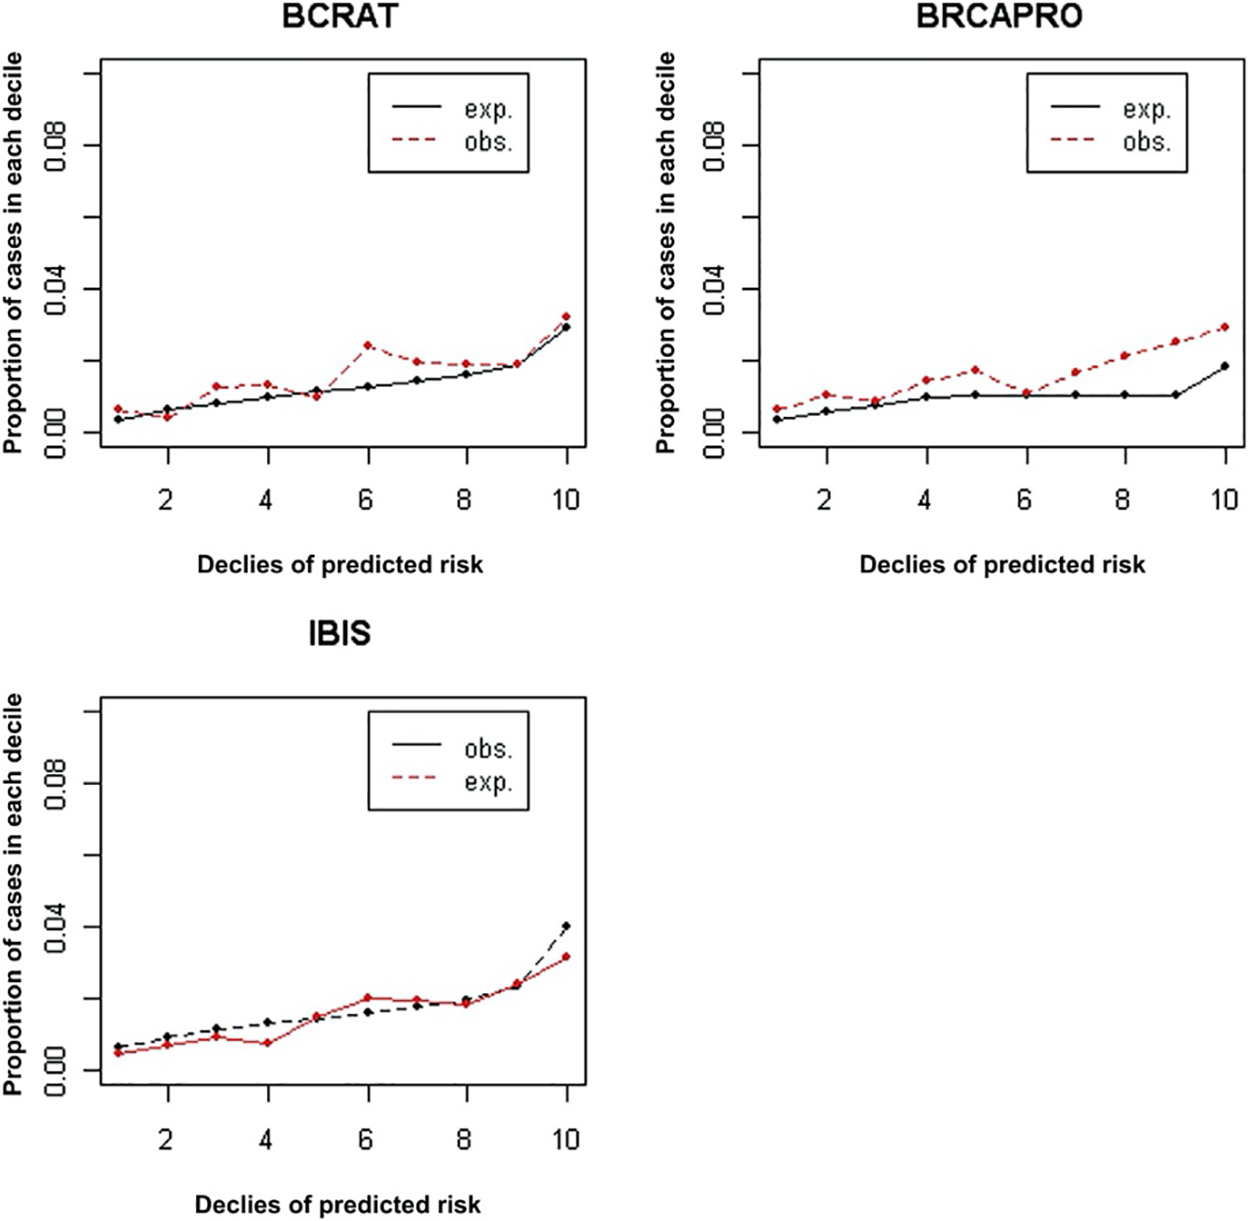
Comparison of Expected and Observed Cases for BCRAT (Gail), BRCAPRO, and IBIS (Tyrer-Cuzick) Models by Risk Decile Abbreviations: BCRAT = Breast Cancer Risk Assessment Tool; exp. = expected; IBIS = International Breast Intervention Study; obs. = observed.
Further analysis was conducted to calculate expected to observed ratios for subgroup categories defined by parity and age of first birth (Table 4). The results show that the BCRAT and BRCAPRO models underestimate risk to a greater degree for nulliparous women, with BCRAT having an E/O of 0.64 (95% CI 0.50–0.84) and BRCAPRO 0.48 (95% CI 0.37 −0.63), while the E/O for the IBIS model in nulliparous women was 0.98 (95% CI 0.75 – 1.27). Among parous women, all models performed worse in terms of calibration for women with an age at first birth over 30, although these differences were not statistically significant.
Table 4:
Expected and observed cancers for each model by parity and age of first birth
| BCRAT (Gail) | BRCAPRO | IBIS (Tyrer-Cuzick) | |||||||||
|---|---|---|---|---|---|---|---|---|---|---|---|
| Risk factors | n | O | E | E/O | 95% CI | E | E/O | 95% CI | E | E/O | 95% CI |
| Parity | |||||||||||
| Nulliparous | 3258 | 57 | 36.73 | 0.64 | (0.50–0.84) | 27.50 | 0.48 | (0.37–0.63) | 55.79 | 0.98 | (0.75–1.27) |
| Parous | 8992 | 139 | 122.61 | 0.88 | (0.75–1.04) | 88.08 | 0.62 | (0.52–0.73) | 156.51 | 1.13 | (0.95–1.33) |
| First live birth (among parous) | |||||||||||
| ≤30 years | 5196 | 78 | 72.98 | 0.94 | (0.75–1.17) | 55.26 | 0.71 | (0.57–0.88) | 86.56 | 1.11 | (0.89–1.39) |
| > 30 years | 3796 | 61 | 49.64 | 0.81 | (0.63–1.05) | 32.09 | 0.53 | (0.41–0.68) | 69.95 | 1.15 | (0.89–1.47) |
In terms of the discriminatory accuracy of the BCRAT, BRCAPRO and IBIS models in the overall MWS population, the highest AUC achieved was 0.65 (95% CI 0.61 – 0.68) by the IBIS model. The BCRAT (0.62, 95% CI 0.59 – 0.66) and BRCAPRO (0.60, 95% CI 0.56 – 0.63) models had slightly lower discrimination, but all showed an area under the curve significantly greater than 0.50, and overall the confidence intervals overlap for the three models. These results are displayed graphically in the ROC curves shown in Figure 2 (supplementary online figure).
When looking at the discriminatory performance of these models in nulliparous women, the IBIS model performed best with an AUC of 0.65 (95% CI 0.58 – 0.70), with the BCRAT having a slightly lower AUC of 0.65 (95% CI 0.62 – 0.72), and the BRCAPRO model an AUC of 0.60 (95% CI 0.54 – 0.65). Among parous women with age first birth over 30, the IBIS model had the highest AUC of 0.69 (95% CI 0.62 – 0.75), compared to BCRAT 0.63 (95% CI 0.56 – 0.70), and BRCAPRO 0.62 (95% CI 0.56 – 0.68).
DISCUSSION
We used data from the Marin County mammography population to examine the calibration and discrimination of three risk prediction models for invasive breast cancer: BCRAT, BRCAPRO, and IBIS. Until recently, only the BCRAT model had been independently validated in populations in the United States, and it has shown inconsistent performance in terms of calibration and discrimination. A 2012 study in the New York Breast Cancer Family Registry compared Gail and Tyrer-Cuzick models and found Tyrer-Cuzick demonstrated both better calibration and discrimination (25+). Gail was very poorly calibrated in their population in women who were nulliparous or who had age of first live birth >25. Furthermore, there is limited evidence that any of the existing risk assessment models have been adequately tested in high risk populations.
Although the IBIS model over-predicted risk by 9 percent (E/O = 1.09), it demonstrated better overall calibration than the other two models (BCRAT= 0.81 and BRCAPRO = 0.59). One reason for this may be that the IBIS model utilizes information on hormone replacement therapy, which is not utilized by the other two models. Combination hormone replacement therapy use in Marin County was shown to rank fourth highest of 41 California counties in 2001 and thus may be an important risk factor in the Marin population.[7] Based on our analysis, the BCRAT and BRCAPRO models were not well calibrated for the Marin County mammography population and underestimated risk for the given time period. Our results for calibration of the BCRAT model are contrary to some validation studies which have revealed good calibration of the model [26], yet poor calibration has been shown in many other studies.[2,19,27] Perhaps the largest study, done in the Women’s Health Initiative cohort, demonstrated a similar overall calibration of 0.79 (Chlebowski et al.). The BRCAPRO model may not have performed well in this population because we were lacking much of the family history data that serve as inputs for this model. Breast cancer history in second degree relatives, number of unaffected relatives, family history of ovarian cancer, history of bilateral breast cancer, or history of breast cancer in males could not be included for this model. In addition, the high prevalence of delayed childbirth in the Marin population is not reflected in the scores from this model.
Calibration of the models within strata of parity and age of first birth revealed a similar pattern to the overall calibration of the models. The BCRAT model was not well calibrated for nulliparous women (E/O = 0.64) and women with age of first birth after 30 (E/O = 0.81). The BRCAPRO model also consistently underestimated risk in the subgroups defined by parity and age of first birth. On the other hand, the IBIS model had the best calibration within these subgroups with none of the E/O ratios significantly different from 1. The results of the subgroup analysis suggest that the poor performance of these models may be that the populations used to construct the BCRAT and the BRCAPRO models differed significantly in terms of parity and age of first birth. Our results are consistent with a study in the United Kingdom which also found that the BCRAT and BRCAPRO models underestimated risk in women who are either nulliparous or whose first live birth occurred after the age of 30.[3] Breast cancer risk models are calibrated to the populations they were designed on, and both the BCRAT and BRCAPRO models were calibrated on US populations, while the IBIS model was calibrated to populations in England and Wales. According to the Office for National Statistics in the United Kingdom, age of first birth in England and Wales is much later than that in the United States, and in the year 2008 47.3% of parous women had an age of first birth over 30, which better approximates the Marin County population in which 44.2% of parous women in 2008 had an age of first birth over 30.
Some applications of risk assessment models such as deciding appropriate screening procedures or interventions require good discriminatory power. In term of discrimination, the IBIS model achieved the highest estimated AUC of 0.65, compared to BCRAT (0.62) and BRCAPRO (0.60). The apparently higher AUC estimate for the IBIS model is in agreement with the previously noted United Kingdom study evaluating the performance of breast cancer risk models.[3] However, the 95% confidence intervals obtained from bootstrap are wide and overlapping, and a larger sample is required for more precise conclusions. It should be pointed out that all of these models would be considered to have only fair discriminatory power, and further continuing efforts to improve the performance of these models are clearly needed.
It is surprising that the BRCAPRO model performed as well as it did with an AUC of 0.60 in this population, considering that it is based solely on basic family history data. This could be because of the high rate of positive family history in first degree relatives seen in the MWS cases (unpublished MWS analysis). In regards to discrimination, all models performed about the same in nulliparous and parous women, but among parous women the IBIS model performed best in women with age first birth over 30.
A potential limitation of the study is the possibility of selection bias in the mammography cohort. Women with a history of breast cancer may have been more likely to have chosen to participate in the study. The yearly incidence rate of breast cancer in this study was 316.1 per 100,000. Applying rates seen in Marin County as a whole in White non-Hispanic women obtained from SEER in the years 2003–07 to the age distribution in this study yields an expected rate of 280.6 per 100,000. Thus the rate seen is in our study is 12.6% higher than that expected in Marin overall for the age distribution of the study. This could have resulted in a lower calibration of the models, but would not be expected to have a differential effect.
An additional limitation of the study was that assumptions had to be made about baseline risk factors. Number of first-degree relatives with breast cancer and BMI are assumed to be the same as they were at the time of the questionnaire. It is unlikely that the number of first-degree relatives with breast cancer increased for many women during the period between the baseline (2003) and the time of the questionnaire (2007–8). And substituting a higher number of family relatives with breast cancer in 2007 for the number at baseline in 2003 into the models would result in an increase in estimation of 5-year risk by each of the models (assuming family history of breast cancer increases risk) and does not explain the underestimation of risk by the BCRAT and the BRCAPRO models. BMI was incorporated only into the IBIS model, and using BMI at the time of the questionnaire can result in a similar bias. However, if the average weight of the women in our population stayed the same between 2003 and the time of the questionnaire, the calibration of the IBIS model would not be affected. Data from the California Health Information Survey from 2005 reveals that Marin County has the lowest incidence of obesity of any county in California, as well as demonstrating only a minimal increase in BMI in its women over a 5-year time period, suggesting a minimal impact of this limitation. Women who are diagnosed with breast cancer are known to be more likely to gain than lose weight in the subsequent few year. However, the amount is relatively low and would not be expected to have a major effect on the risk scores assigned by the IBIS model, but certainly could have resulted in a slight positive bias in discrimination for this model.
CONCLUSION
Based on our comparison of the BCRAT, BRCAPRO, and IBIS models, it appears that the BCRAT and the BRCAPRO models significantly underestimate risk for the Marin County population, which has a high rate of nulliparity and late age of first live birth. The two models did better in terms of discriminatory ability, but also had a lower discriminatory ability than the IBIS model. With the trend in society towards delayed childbirth, further assessment of existing breast cancer risk models in populations similar to that of Marin County should be performed.
Since the IBIS model appeared to be best calibrated and had the best discriminatory capability in our population, it may be the preferred model for estimation of breast cancer risk in women with risk factor profiles similar to those of Marin County.
CLINICAL PRACTICE POINTS
Health professionals depend on accurate assessment of breast cancer risk to make decisions about potential interventions for women at very high risk, as well as determining optimum screening for individual women such as mammogram frequency and use of other tests such as Magnetic Resonance Imaging (MRI). Unfortunately existing models have limitations in their ability to accurately identify women at high risk, and have even less accuracy in populations that are different from those on which the model was initially developed.
Many women are delaying childbirth for personal, career, and financial reasons placing them at higher risk for breast cancer, and existing models have demonstrated uncertain accuracy in these women. Our study applies three existing models to a population with high rates of nulliparity and late age at first birth. The most commonly used model, the Gail model (BCRAT), underperformed the Tyrer-Cuzick model (IBIS) in the overall Marin County mammography population, and specifically performed more poorly in women with delayed childbirth, where it significantly underestimated breast cancer risk.
Clinicians need to be aware of the limitations of existing breast cancer risk models in women with delayed childbirth, and results from this retrospective cohort study support the consideration of using the Tyrer-Cuzick (IBIS) model if the model’s variables are available. Further advances in breast cancer risk modeling should address the current trends and changes in risk factor profiles.
Supplementary Material
Table 5:
AUC results and bootstrap confidence intervals for BCRAT, BRCAPRO, and IBIS models
| AUC | 95% CI | |
|---|---|---|
| BCRAT (Gail) | 0.62 | 0.59–0.66 |
| BRCAPRO | 0.60 | 0.56–0.63 |
| IBIS (Tyrer-Cuzick) | 0.65 | 0.61–0.68 |
Table 6:
AUC results and bootstrap confidence intervals by parity and age first birth
| Nulliparous women (n=3258) | ||
| AUC | 95% CI | |
| BCRAT (Gail) | 0.65 | 0.60–0.72 |
| BRCAPRO | 0.60 | 0.54–0.65 |
| IBIS (Tyrer-Cuzick) | 0.66 | 0.58–0.70 |
| First live birth < 30 (n=5196) | ||
| AUC | 95% CI | |
| BCRAT (Gail) | 0.59 | 0.52–0.64 |
| BRCAPRO | 0.60 | 0.55–0.65 |
| IBIS (Tyrer-Cuzick) | 0.61 | 0.54–0.67 |
| First live birth > 30 (n=3796) | ||
| AUC | 95% CI | |
| BCRAT (Gail) | 0.63 | 0.56–0.70 |
| BRCAPRO | 0.62 | 0.56–0.68 |
| IBIS (Tyrer-Cuzick) | 0.69 | 0.62–0.75 |
Acknowledgments
This work was supported by the Centers for Disease Control (grant numbers 1RO1-DP000217–01, 1H75-DP001730–01, 5H75DP001730–03); and the Avon Foundation for Women (grant number 02–2011-050).
ABBREVIATIONS
- CDC
Centers for Disease Control and Prevention
- AUC
Area under the curve
- BCRAT
Breast Cancer Risk Assessment Tool
- IBIS
International Breast Intervention Study
- MWS
Marin Women’s Study
- SFMR
San Francisco Mammography Registry
- BIRADS
Breast Imaging Reporting and Data System
- SXA
single x-ray absorptiometry
- BMI
body mass index
- HRT
hormone replacement therapy
- ROC
receiver operating characteristics
- CHIS
California Health Interview Survey
Footnotes
COMPETING INTERESTS
The authors declare that they have no competing interests.
References
- 1.Amir E, Freedman OC, Seruga B, Evans DG. Assessing women at high risk of breast cancer: a review of risk assessment models. J. Natl. Cancer Inst 2010; 102(10):680–691. [DOI] [PubMed] [Google Scholar]
- 2.Amir E, Evans DG, Shenton A, et al. Evaluation of breast cancer risk assessment packages in the family history evaluation and screening programme. J. Med. Genet 2003; 40(11):807–814. [DOI] [PMC free article] [PubMed] [Google Scholar]
- 3.Evans DGR, Howell A. Breast cancer risk-assessment models. Breast Cancer Res. 2007; 9(5):213. [DOI] [PMC free article] [PubMed] [Google Scholar]
- 4.Chun J, Pocock B, Joseph KA, El-Tamer M, Klein L, Schnabel F. Breast Cancer Risk factors in Younger and Older Women. Ann Surg Oncol. 2009. January; 16(1):96–9. Epub 2008 Nov 1. [DOI] [PubMed] [Google Scholar]
- 5.Clarke CA, Glaser SL, West DW, et al. Breast cancer incidence and mortality trends in an affluent population: Marin County, California, USA, 1990–1999. Breast Cancer Res. 2002; 4(6):R13. [DOI] [PMC free article] [PubMed] [Google Scholar]
- 6.Keegan THM, Chang ET, John EM, et al. Recent changes in breast cancer incidence and risk factor prevalence in San Francisco Bay area and California women: 1988 to 2004. Breast Cancer Res. 2007; 9(5):R62. [DOI] [PMC free article] [PubMed] [Google Scholar]
- 7.Ereman RR, Prebil LA, Mockus M, et al. Recent trends in hormone therapy utilization and breast cancer incidence rates in the high incidence population of Marin County, California. BMC Public Health. 2010; 10:228. [DOI] [PMC free article] [PubMed] [Google Scholar]
- 8.Prehn AW, West DW. Evaluating local differences in breast cancer incidence rates: A census-based methodology (United States). Cancer Causes Control. 1998. October; 9(5):511–7. [DOI] [PubMed] [Google Scholar]
- 9.Mathews TJ, Hamilton BE, Delayed childbearing: more women are having their first child later in life. NCHS Data Brief. Number 21, August 2009, Centers for Disease Control and Prevention. [PubMed] [Google Scholar]
- 10.Taylor P, Cohn D, Livingston G, Wang W, Dockterman D, The New Demography of American Motherhood, Pew Research Center, May 6, 2010. [Google Scholar]
- 11.Costantino JP, Gail MH, Pee D, et al. Validation studies for models projecting the risk of invasive and total breast cancer incidence. J. Natl. Cancer Inst 1999; 91(18):1541–1548. [DOI] [PubMed] [Google Scholar]
- 12.Parmigiani G, Berry D, Aguilar O. Determining carrier probabilities for breast cancer-susceptibility genes BRCA1 and BRCA2. Am. J. Hum. Genet 1998; 62(1):145–158. [DOI] [PMC free article] [PubMed] [Google Scholar]
- 13.Tyrer J, Duffy SW, Cuzick J. A breast cancer prediction model incorporating familial and personal risk factors. Stat Med 2004; 23(7):1111–1130. [DOI] [PubMed] [Google Scholar]
- 14.26. 2010 Census Interactive Population Search [Internet]. U.S. Census Bureau; 2010. [Cited Jun. 21, 2012.] Available from: http://2010.census.gov/2010census/popmap/ipmtext.php. [Google Scholar]
- 15.Gail MH, Brinton LA, Byar DP, et al. Projecting individualized probabilities of developing breast cancer for white females who are being examined annually. J. Natl. Cancer Inst 1989; 81(24):1879–1886. [DOI] [PubMed] [Google Scholar]
- 16.Spiegelman D, Colditz GA, Hunter D, Hertzmark E. Validation of the Gail et al. model for predicting individual breast cancer risk. J. Natl. Cancer Inst. 1994; 86(8):600–607. [DOI] [PubMed] [Google Scholar]
- 17.Bondy ML, Lustbader ED, Halabi S, Ross E, Vogel VG. Validation of a breast cancer risk assessment model in women with a positive family history. J. Natl. Cancer Inst 1994; 86(8):620–625. [DOI] [PubMed] [Google Scholar]
- 18.Cummings SR, Tice JA, Bauer S, et al. Prevention of breast cancer in postmenopausal women: approaches to estimating and reducing risk. J. Natl. Cancer Inst 2009; 101(6):384–398. [DOI] [PMC free article] [PubMed] [Google Scholar]
- 19.Rockhill B, Spiegelman D, Byrne C, Hunter DJ, Colditz GA. Validation of the Gail et al. model of breast cancer risk prediction and implications for chemoprevention. J. Natl. Cancer Inst 2001; 93(5):358–366. [DOI] [PubMed] [Google Scholar]
- 20.Rockhill B, Byrne C, Rosner B, Louie MM, Colditz G. Breast cancer risk prediction with a log-incidence model: evaluation of accuracy. J Clin Epidemiol. 2003; 56(9):856–861. [DOI] [PubMed] [Google Scholar]
- 21.Chen Sining, Wang Wenyi, Broman Karl, Katki Hormuzd A., Parmigiani Giovanni. BayesMendel: An R Environment for Mendelian Risk Prediction. Johns Hopkins University, Dept. of Biostatistics Working Papers. 2004; (Working Paper 39.). Available at: http://www.bepress.com/jhubiostat/paper39. [DOI] [PMC free article] [PubMed] [Google Scholar]
- 22.Jacobi CE, de Bock GH, Siegerink B, van Asperen CJ. Differences and similarities in breast cancer risk assessment models in clinical practice: which model to choose? Breast Cancer Res. Treat. 2009;115(2):381–390. [DOI] [PubMed] [Google Scholar]
- 23.Howlader N, Noone AM, Krapcho M, Neyman N, Aminou R, Altekruse SF, Kosary CL, Ruhl J, Tatalovich Z, Cho H, Mariotto A, Eisner MP, Lewis DR, Chen HS, Feuer EJ, Cronin KA (eds). SEER Cancer Statistics Review, 1975–2009 (Vintage 2009 Populations), National Cancer Institute. Bethesda, MD, http://seer.cancer.gov/csr/1975_2009_pops09/, based on November 2011 SEER data submission, posted to the SEER web site, 2012. [Google Scholar]
- 24.Hanley JA, McNeil BJ. The meaning and use of the area under a receiver operating characteristic (ROC) curve. Radiology. 1982;143(1):29–36. [DOI] [PubMed] [Google Scholar]
- 25.Meads C, Ahmed I, Riley RD. A systemic review of breast cancer incidence risk prediction models with met-analysis of their performance. Breast Cancer Res Treat. 2012. April;132(2):365–377. Epub 2011 Oct 22. [DOI] [PubMed] [Google Scholar]
- 26.Decarli A, Calza S, Masala G, Specchia C, Palli D, Gail MH. Gail model for prediction of absolute risk of invasive breast cancer: Independent evaluation in the Florence-European prospective investigation into cancer and nutrition cohort. JNCI (6 December 2006) 98(23): 1686–1693. [DOI] [PubMed] [Google Scholar]
Associated Data
This section collects any data citations, data availability statements, or supplementary materials included in this article.