

Abstract
Data on antimicrobial resistance (AMR) in zoonotic and indicator bacteria from humans, animals and food are collected annually by the EU Member States (MSs), jointly analysed by the EFSA and the ECDC and reported in a yearly EU Summary Report. The annual monitoring of AMR in animals and food within the EU is targeted at selected animal species corresponding to the reporting year. The 2018 monitoring specifically focussed on poultry and their derived carcases/meat, while the monitoring performed in 2019 specifically focused on pigs and calves under 1 year of age, as well as their derived carcases/meat. Monitoring and reporting of AMR in 2018/2019 included data regarding Salmonella, Campylobacter and indicator Escherichia coli isolates, as well as data obtained from the specific monitoring of presumptive ESBL‐/AmpC‐/carbapenemase‐producing E. coli isolates. Additionally, some MSs reported voluntary data on the occurrence of meticillin‐resistant Staphylococcus aureus in animals and food, with some countries also providing data on antimicrobial susceptibility. This report provides an overview of the main findings of the 2018/2019 harmonised AMR monitoring in the main food‐producing animal populations monitored, in related carcase/meat samples and in humans. Where available, data monitoring obtained from pigs, calves, broilers, laying hens and turkeys, as well as from carcase/meat samples and humans were combined and compared at the EU level, with particular emphasis on multidrug resistance, complete susceptibility and combined resistance patterns to critically important antimicrobials, as well as Salmonella and E. coli isolates possessing ESBL‐/AmpC‐/carbapenemase phenotypes. The outcome indicators for AMR in food‐producing animals such as complete susceptibility to the harmonised panel of antimicrobials in E. coli and the prevalence of ESBL‐/AmpC‐producing E. coli have been also specifically analysed over the period 2015–2019.
Keywords: antimicrobial resistance, zoonotic bacteria, indicator bacteria, ESBL, MRSA
Summary
In 2018–2019, data on antimicrobial resistance in zoonotic and indicator bacteria, submitted by 28 EU Member States (MSs), were jointly analysed by the EFSA and the ECDC. Resistance in zoonotic Salmonella and Campylobacter from humans, animals and food, as well as resistance in indicator Escherichia coli and meticillin‐resistant Staphylococcus aureus (MRSA) from animals and food were addressed. ‘Microbiological’ resistance was assessed using epidemiological cut‐off (ECOFF) values; for some countries, qualitative data on human isolates were interpreted in a way which corresponds closely to the ECOFF‐defined ‘microbiological’ resistance.
In Salmonella spp. from human cases in 2019, resistance to ampicillin, sulfonamides and tetracyclines was observed at overall high levels, while resistance to third‐generation cephalosporins was noted at overall low levels of 1.8% and 1.2% for cefotaxime and ceftazidime, respectively. A decline in resistance to ampicillin and tetracyclines in isolates from humans was observed in eight and 11 countries, respectively, over the period 2015–2019, particularly evident in S. Typhimurium and its monophasic variant, serovars commonly associated with pigs and calves. In Salmonella spp. and indicator E. coli isolates recovered from animals and food during the 2018–2019 routine monitoring, resistance to ampicillin, tetracyclines and sulfonamides was also frequently detected and resistance to third‐generation cephalosporins was uncommon; paralleling that observed in Salmonella isolates reported from human cases. Additionally, resistance to (fluoro)/quinolones was very high/high levels among Salmonella spp. and indicator E. coli isolates recovered from broilers, fattening turkeys and poultry carcases/meat in 2018. In Salmonella spp. isolates from human cases, a moderate occurrence of resistance to ciprofloxacin was observed in 2019 but among S. Kentucky isolates, extremely high prevalence of resistance at 82.1% was noted and in S. Enteritidis, increasing trends in resistance were observed in eight countries over the period 2015–2019, both serovars predominantly being associated with poultry.
The monitoring included assessment of the levels of presumptive extended‐spectrum beta‐lactamase (ESBL)‐/AmpC‐/carbapenemase‐producers among Salmonella spp. from human cases, food‐producing animals and animal carcases; as well as among indicator E. coli isolates from food‐producing animals. At the reporting MS group level, the proportion of presumptive ESBL or AmpC producers was low among all indicator E. coli isolates recovered from the animal sector (fattening pigs, calves, broilers and fattening turkeys) and very low to low among Salmonella spp. recovered from animals/carcases (broilers, laying hens, fattening turkeys, fattening pigs and carcases of broilers and fattening pigs) and from human cases, although higher in some Salmonella serovars. Within both the routine and specific monitoring (non‐selective and selective media, respectively), varying occurrence/prevalence rates of presumptive ESBL or AmpC producers were observed in different reporting countries. Carbapenemase‐producing E. coli were detected in five samples from fattening pigs in four MSs, in one sample from meat from pigs in one MS and one sample of meat from bovine animal in one non‐MSs in 2019 – findings are provisional as two strains need to be confirmed; while no presumptive or confirmed carbapenemase‐producing E. coli was detected from broilers and their derived meat in 2018. Only one Salmonella isolate was identified as cabapenemase‐producing from human cases in 2019 (a S. Typhimurium var. O5‐ carrying bla OXA‐48 isolated from a domestically acquired infection) compared with five in 2018.
Resistance to colistin was uncommon among Salmonella spp. and E. coli isolates recovered from food‐producing animals (fattening pigs, calves, Gallus gallus and fattening turkeys) and carcases/meat derived from these animals, although moderate resistance was notably observed in certain Salmonella serovars.
In Campylobacter from humans, food‐producing animals and poultry meat, the occurrence of resistance to ciprofloxacin and tetracycline generally ranged from high to extremely high, particularly in C. coli isolates from humans and from poultry and derived meat. Erythromycin resistance was much lower in C. jejuni but moderate in C. coli isolates from humans, turkeys and pigs. Ciprofloxacin resistance increased over the period 2015–2019 in C. jejuni from humans in nine countries, while erythromycin resistance decreased in five. Overall combined resistance to both ciprofloxacin and erythromycin, which are considered critically important for treatment of campylobacteriosis, was generally rare to low in C. jejuni from humans, poultry and calves, and low to moderate in C. coli from humans, poultry and pigs. Notably, moderate to high proportions of C. jejuni from poultry, moderate to high proportions of C. coli from poultry and pigs and high to extremely high proportions of C. coli from humans, were co‐resistant to ciprofloxacin and erythromycin in some countries.
Combined resistance to critically important antimicrobials in Salmonella and E. coli from both humans and animals was uncommon, although very high to extremely high occurrence of multidrug resistance was observed in certain Salmonella serovars. Notably, S. Infantis accounted for most of the multidrug‐resistant Salmonella spp. recovered from broilers and their derived carcases (79% and 75.3%, respectively), and monophasic S. Typhimurium accounted for 56.5% and 56.4% of the multidrug‐resistant Salmonella spp. recovered from fattening pigs and their derived carcases, respectively. Furthermore, Salmonella Kentucky accounted for most of the Salmonella isolates from both humans in 2019 and poultry in 2018, which exhibited high‐level resistance to ciprofloxacin (92/106 and 180/252 isolates, respectively), in addition to the detection of third‐generation cephalosporin resistance in some isolates.
The voluntary monitoring of MRSA from food and healthy animals in 2018–2019 revealed that most MRSA isolates, where typing data were available, were livestock‐associated (LA‐) MRSA (97.6% in 2018 and 98.2% in 2019). However, spa‐types classified as community‐associated (CA‐) and healthcare‐associated (HA‐) MRSA were also reported, as well as those carrying the mecC gene (a variant of the meticillin resistance gene, mecA). The occasional detection of lineages of CA‐ and HA‐MRSA primarily associated with humans is presumably due to the sporadic interchange of strains between humans and animals. A significant observation from the monitoring includes the detection of linezolid‐resistant strains harbouring the cfr gene from fattening pigs in 2019. Since linezolid is an important compound in human medicine for the treatment of MRSA, establishing whether linezolid resistance is widespread or more localised in distribution in MRSA in animals is highly relevant. The probable detection of CA‐MRSA USA300 from pig and cattle meat in 2019 is another important finding, as this strain can cause severe infections in humans and has a markedly different epidemiology from HA‐MRSA strains.
The outcome indicators for AMR in food‐producing animals, such as complete susceptibility to the harmonised panel of antimicrobials in E. coli and the prevalence of ESBL‐/AmpC‐producing E. coli have also been specifically analysed over the period 2015–2019. There are marked variations in both outcome indicators among reporting countries. A positive development manifested by statistically significant decreasing trends in the prevalence of ESBL‐/AmpC‐producing E. coli in food‐producing animals is observed in 14 countries (13 MSs and 1 non‐MS), which represents two additional MSs starting to record a decrease compared with the period 2015–2017. Statistically significant increasing trends in complete susceptibility in indicator E. coli from food‐producing animals is registered in 11 countries (9 MSs and 2 non‐MSs), which represents three additional MSs recording an increase in complete susceptibility compared with the period 2015–2017. These outcome indicators show that some encouraging progress has been registered in reducing AMR in food‐producing animals in several EU MSs over the last years.
1. Introduction
Legal basis
Monitoring of AMR in bacteria from food‐producing animals and derived meat
Regulation (EC) 178/2002 1 Article 33 establishes that EFSA is responsible for examining data on AMR collected from the Member States (MSs) in accordance with Directive 2003/99/EC and for preparing the EU Summary Report from the results
Directive 2003/99/EC 2 on the monitoring of zoonoses and zoonotic agents lays down the provisions for monitoring of AMR in zoonotic and indicator bacteria in food‐producing animals and derived meat. The Directive obliges EU MSs to collect relevant and, where applicable, comparable data on zoonoses, zoonotic agents, AMR and food‐borne outbreaks.
Implementing Decision 2013/652/EU 3 on the monitoring and reporting of antimicrobial resistance in zoonotic and commensal bacteria was adopted as part of the 2011–2016 European Commission action plan. It applies from 2014 to 2020 and sets up priorities for the monitoring of AMR from a public health perspective, drafts a list of combinations of bacterial species, food‐producing animal populations and foodstuffs and lays down detailed requirements on the harmonised monitoring and reporting of AMR in food‐producing animals and food.
Monitoring of AMR in bacteria from humans
Decision 2018/945/EU 4 on the communicable diseases and related special health issues to be covered by epidemiological surveillance as well as relevant case definitions came into force in July 2018, repealing Decision 2012/506/EU5. The new decision stipulates mandatory testing and reporting of a representative subset of isolates using methods and criteria specified in the EU protocol for harmonised monitoring of antimicrobial resistance in human Salmonella and Campylobacter isolates (ECDC, 2016).
The data collection on human diseases from MSs is conducted in accordance with Decision 1082/2013/EU 6 on serious cross‐border threats to health.
Terms of Reference
In accordance with the Zoonoses Directive 2003/99/EC, the EU MSs are required to assess trends and sources of zoonoses, zoonotic agents and AMR, as well as outbreaks in their territory, submitting an annual report each year by the end of May to the European Commission covering the data collected.
In accordance with Article 9 of Directive 2003/99/EC, the EFSA shall examine the submitted national reports of the MSs and publish a summary report on the trends and sources of zoonoses, zoonotic agents and AMR in the EU.
The ECDC has provided data on zoonotic infections in humans, as well as their analyses, for the EU Summary Reports since 2005. Since 2007, data on human cases have been reported from the European Surveillance System (TESSy), maintained by the ECDC.
The antimicrobial agents used in food‐producing animals and in human medicine in Europe are frequently the same or belong to the same classes. The route of administration and the administered quantities of antimicrobials may differ between humans and food‐producing animals and there are important variations between and within food‐producing animal populations, as well as between countries. However, the use of antimicrobials in both, humans and animals, might result in the development of AMR, which results from the continuous positive selection of resistant bacterial clones, whether these are pathogenic, commensal or even environmental bacteria. This will change the population structure of microbial communities with serious consequences for human and animal health.
Antimicrobial resistance
AMR is defined as the inability or reduced ability of an antimicrobial agent to inhibit the growth of a bacterium, which, in the case of a pathogenic organism, can lead to therapy failure. A bacterial strain can acquire resistance by mutation, by the uptake of exogenous genes by horizontal transfer from other bacterial strains or by the activation/triggering of a genetic cascade, thereby inducing the expression of resistance mechanisms (EMA and EFSA, 2017). Resistance development can be triggered by different factors such as inappropriate use of antimicrobials in human and veterinary medicine, poor hygiene conditions and practices in healthcare settings or in the food chain facilitating the transmission of resistant microorganisms. Over time, this makes antimicrobials less effective and ultimately useless.
Bacterial resistance to antimicrobials occurring in food‐producing animals can spread to humans via food‐borne routes, as has been observed for the zoonotic bacteria Campylobacter, Salmonella and some strains of Escherichia coli, by routes such as water or other environmental contamination, as well as through direct animal contact. Infections with antimicrobial resistant bacteria may result in treatment failures or the need of second‐line antimicrobials for therapy. The commensal bacterial flora can also form a reservoir of resistance genes, which may be transferred between bacterial species, including organisms capable of causing disease in both humans and animals (EFSA, 2008).
AMR monitoring in zoonotic and commensal bacteria in food‐producing animals and their food products entails specific and continuous data collection, analysis and reporting; enables to understand the development and diffusion of resistance, to follow temporal trends in the occurrence and distribution of AMR and the identification of emerging or specific resistance patterns, as well as provides relevant risk assessment data, and evaluates targeted interventions.
This EU Summary Report (EUSR) includes data related to the occurrence of AMR in isolates from animals and foodstuffs and in isolates from human cases, being a collaboration between EFSA and ECDC with the assistance of EFSA's contractors. The EU MSs, the European Commission and the relevant EU Reference Laboratory for antimicrobial resistance (EURL‐AR) are consulted, while preparing the report. The efforts made by the MSs and the other reporting countries are gratefully acknowledged.
Data on AMR collected by the EU MSs and compiled in the EUSR on AMR are also used to perform wider analyses, such as the joint report on consumption of antimicrobial agents (AMC) and AMR in animals, food and humans, produced by ECDC, EFSA and EMA, under a One Health approach on a regular basis (JIACRA I and II; ECDC, EFSA and EMA, 2015, 2017). This report provides evidence‐based analysis of the possible association between AMC and AMR in humans and food‐producing animals. The JIACRA III report should be issued by the Agencies in July 2021.
The current EU action plan against AMR
The European Commission adopted a new Action Plan to tackle AMR on 29 June 2017.7 The Action Plan is underpinned by a One Health approach that addresses resistance in both humans and animals. The key objectives of this plan are built on three main pillars:
Pillar 1: Making the EU a best practice region: as the evaluation of the 2011 action plan highlighted, this requires better evidence, better coordination and surveillance and better control measures. EU action will focus on key areas and help MSs in establishing, implementing and monitoring their own One Health action plans on AMR, which they agreed to develop at the 2015 World Health Assembly.
Pillar 2: Boosting research, development and innovation by closing current knowledge gaps, providing novel solutions and tools to prevent and treat infectious diseases and improving diagnosis in order to control the spread of AMR.
Pillar 3: Intensifying EU effort worldwide to shape the global agenda on AMR and the related risks in an increasingly interconnected world.
In particular, under the first pillar, EU actions will focus on the areas with the highest added value for MSs, e.g. promoting the prudent use of antimicrobials, enhancing cross‐sectoral work, improving infection prevention and consolidating surveillance of AMR and antimicrobial consumption. Examples of support include providing evidence‐based data with the support of EFSA, EMA and ECDC, updating EU implementing legislation on monitoring and reporting of AMR in zoonotic and commensal bacteria in farm animals and food, to take into account new scientific development and monitoring needs, enabling mutual learning, exchange of innovative ideas and consensus building and co‐fund activities in MSs to tackle AMR. The new plan includes more than 75 concrete actions with EU added value that the European Commission will develop and strengthen as appropriate in the coming years. All these important actions are also interdependent and need to be implemented in parallel to achieve the best outcome.
1.1. Monitoring and reporting of antimicrobial resistance in the EU8
1.1.1. Monitoring of antimicrobial resistance in animals and food
According to Commission Implementing Decision 2013/652/EU, which applied as of 1 January 2014 until December 2020, monitoring of AMR is mandatory in Salmonella, Campylobacter jejuni and indicator commensal E. coli in the major domestically produced animal populations and their derived meat, corresponding to different production types to collect data that could be combined with those on exposure to antimicrobials. Monitoring is performed on a rotating basis, targeting fattening pigs and bovine animals under 1 year of age and meat derived thereof in odd years and poultry populations and their derived meat in even years, as specified by the legislation. A specific monitoring of extended‐spectrum b‐lactamase (ESBL)‐, AmpC‐ and carbapenemase‐producing Salmonella and indicator commensal E. coli is also required.
The collection and reporting of data are performed at the isolate level, to enable analyses on the occurrence and traits of multidrug resistance (MDR). Representative random sampling is performed according to the legislation and the technical specifications issued by EFSA in 2014. Monitoring of AMR in food‐producing animals is performed in domestically produced animal populations, corresponding to different production types with the aim of collecting data that could be combined with those on exposure to antimicrobials. MSs may also performed complementary monitoring, such as that of MRSA, on a voluntary basis.
Microdilution methods for testing should be used and results should be interpreted by the application of European Committee on Antimicrobial Susceptibility Testing (EUCAST) epidemiological cut‐off (ECOFF) values9 for the interpretation of ‘microbiological’ resistance. The harmonised panels of antimicrobials used for Salmonella, Campylobacter and indicator E. coli include substances that either are important for human health, such as critically important antimicrobials (CIAs), or can provide clearer insight into the resistance mechanisms involved. The concentration ranges to be used embrace both the ECOFF and the clinical breakpoints (CBPs), as defined by EUCAST, allowing the comparability of results with human data. For Salmonella and E. coli, a supplementary panel of antimicrobials for testing isolates showing resistance to third‐generation cephalosporins or carbapenems in the first panel is also used. MSs may also perform complementary monitoring, such as that of MRSA, on a voluntary basis. The reporting of isolate‐based data also allows in‐depth phenotypic characterisation of certain mechanisms of resistance, for example, third‐generation cephalosporin resistance and carbapenem resistance can be further characterised.
External quality assurance is provided by the EURL‐AR, which distributes panels of well‐characterised organisms to all MSs for susceptibility testing, arranges proficiency tests (PTs) trials for the National Reference Laboratories for Antimicrobial Resistance (NRLs‐AR) of the MSs on a yearly basis, and, together with EFSA and the MSs, performs a reference testing exercise that includes retesting the antimicrobial susceptibility and whole genome sequencing (WGS) analysis of selected isolates (Annex A, Materials and methods).The EURL‐AR also provides a source of reference for MSs when there are issues or problems with the susceptibility test methodology.
1.1.2. Monitoring of antimicrobial resistance in humans
Together with its Food‐ and Waterborne Diseases and Zoonoses (FWD) network, ECDC has developed an EU protocol for harmonised monitoring of AMR in human Salmonella and Campylobacter isolates (ECDC, 2014, 2016). This document is intended for the National Public Health Reference Laboratories to guide the susceptibility testing required for EU surveillance and reporting to ECDC. Consultation was also sought from EFSA, EUCAST and the EU Reference Laboratory for antimicrobial resistance to facilitate comparison of data between countries and with results from the AMR monitoring performed in isolates from animals and from food products. The protocol is effective from 2014 and supports the implementation of the Commission Action Plan on AMR. One of the recommendations is that, for the purpose of the joint report with EFSA, human data should also be interpreted based on ECOFFs. As this requires quantitative data, ECDC introduced reporting of quantitative antimicrobial susceptibility testing (AST) results in the 2013 data collection and encourages countries to use it. As the EU protocol is not a legal document in itself, it is for each National Public Health Reference Laboratory to decide whether to adapt their practices to the protocol. Since the entry into force of Decision 2018/945/EU in July 2018; however, laboratories are obliged to report their AMR test results to ECDC according to the methods and criteria specified in the EU protocol. In 2018 and 2019, most laboratories had adopted the priority panel of antimicrobials suggested in the protocol with the exception of the last‐line antimicrobials, which were tested by fewer laboratories. The protocol also proposes a testing algorithm for screening and confirmation of ESBL‐producing Salmonella spp., including detection of AmpC. This has been implemented by some laboratories while others use a modification of the algorithm or test suspected isolates directly with polymerase chain reaction (PCR) or whole genome sequencing. Further testing for ESBL and AmpC was performed in 15 of 20 MSs with third‐generation cephalosporin resistance detected in Salmonella isolated from humans in 2018, and in 12 of 15 MSs in 2019.
External quality assessment to support laboratories in implementing the recommended test methods and antimicrobials and obtaining high‐quality AST results is provided by ECDC via a contract with Statens Serum Institute in Denmark.
1.2. Further harmonised monitoring of antimicrobial resistance
To facilitate the comparability of data, the methodology for AMR surveillance should be harmonised across countries as far as possible. The main issues when comparing AMR data originating from different countries are the use of different laboratory methods and different interpretive criteria of resistance. These issues have been addressed by the development of ECDC's protocol for harmonised monitoring and reporting of resistance in humans and by the legislation on harmonised monitoring in food‐producing animals and the food produced.
To respond effectively to the constantly evolving threat of AMR, further enhancements and specific adaptations will be regularly required on an ongoing basis. Under the new One Health action plan (2017), the European Commission is committed to review this legislation, to consider new scientific developments and data collection needs. EFSA received a mandate from the European Commission to provide recommendations on harmonised randomisation procedures for AMR monitoring. The new technical specifications were published in December 2020 (EFSA, 2020) and provide solid scientific advice to support amendments in the existing legislation (see text box below).
New legislation on the monitoring and reporting of AMR in animals and food
Commission Implementing Decision 2013/652/EU lays down rules, for the period 2014–2020, for the monitoring and reporting of antimicrobial resistance (AMR) in zoonotic and commensal bacteria in so far these bacteria present a threat to public health. Monitoring of AMR is essential to have comprehensive and reliable information on the development and spread of resistant bacteria and resistant determinant and as such, AMR data provide insights to inform decision‐making and facilitate the development of appropriate strategies and actions to manage AMR at the EU level. In its Communication of 29 June 2017 to the Council and the European Parliament — A European One Health Action Plan against AMR, the Commission committed to review EU implementing legislation, namely Decision 2013/652/EU, on monitoring AMR in zoonotic and commensal bacteria in food‐producing animals and food to take into account new scientific developments and data collection needs.
In 2020, based on the new technical specifications issued by EFSA, for implementing updated guidelines for further harmonised monitoring of AMR in food‐producing animals and derived meat in the EU and for ensuring continuity in following up further trends in AMR (EFSA, 2019). The European Commission has therefore proposed to lay down new technical requirements for AMR monitoring and reporting that will be applicable as from 1 January 2021 and to repeal, for the sake of clarity, Commission Implementing Decision 2013/652/EU. The new rules are based on the latest scientific opinions but also on the field experience acquired since 2014 by MSs in implementing Decision 2013/652/EU. They address known implementation issues while scientifically responding to the constantly evolving threat of AMR and ensuring continuity in assessing future trends in AMR after 2020. As AMR is a global threat that can easily spread across borders, it is important to improve coordination and gain knowledge to help reducing AMR impact globally. Therefore, the new rules also lay down harmonised AMR monitoring requirements for certain fresh meat imported into the European Union. Commission Implementing Decision 2020/1729 of 17 November 2020 lays down specific technical requirements, for the period 2021–2027, for AMR testing and reporting in representative isolates deriving from randomised sampling in food‐producing animals performed at farm and/or at slaughter and derived meat performed at retail and at border control posts.
Technical specifications on randomisation of sampling for monitoring AMR in food‐producing animals
EFSA issued new technical specifications in November 2020 for monitoring AMR in zoonotic and indicator bacteria from food‐producing animal population and meat thereof, under Decision 2020/1729. This scientific report provides a rationale and harmonised randomisation sampling procedures for AMR monitoring, in samples collected at different stages of the food production chain, yielding representative and comparable data (EFSA, 2020). The current monitoring performed on a biennial basis has been acknowledged as a good compromise between scientific needs and MSs capacities, for the sake of the continuity, the sampling will be performed consistently on a rotating basis. The simple and robust randomised sampling procedure currently in place, relying on a stratified sampling approach with proportional allocation of the sample numbers per strata, is reinforced. A generic proportionate stratified sampling process was proposed for the different sampling plans and numerical illustrations of proportional allocation were also provided. Samples/isolates will be collected according to different selection strategies ‘prospective sampling’ and ‘retrospective sampling’. The former involves collecting enough representative animal and fresh meat samples from which recovered isolates are tested for antimicrobial susceptibility; the latter involves selecting randomly Salmonella isolates from collections constituted within the framework of the national control programmes (NCP) of Salmonella in poultry flocks. Prospective and retrospective sampling plans for samples and isolates, respectively, were addressed and both collection strategies retained.
Stratified sampling of Salmonella isolates from poultry primary productions is proposed to be performed with proportional allocation to the size of the isolate collections available in official laboratories. An alternative approach would be a simple random sampling within the sampling frame of flocks positive for Salmonella. Regarding Campylobacter jejuni, Campylobacter coli, indicator E. coli and enterococci, stratified sampling of caecal content samples in the slaughterhouses, accounting for at least 60% of the national domestic production of the food‐producing animal populations monitored, with proportionate allocation to the slaughterhouse production, will allow the collection of representative isolates and the assessment of the prevalence of ESBL‐/AmpC‐/carbapenemase‐producing E. coli from the populations of broilers, fattening turkeys, fattening pigs and bovine animals under 1 year of age, domestically produced. Sampling of different chilled fresh meat categories at retail outlets serving the final consumer, with proportional allocation of the number of samples to the population of geographical areas accounting for at least 80% of the national population, will allow to test for the presence of ESBL‐/AmpC‐/carbapenemase‐producing E. coli. The monitoring of AMR in imported meat is introduced in 2021, and the year 2021 will allow to gain experience and knowledge on this topic. As such, the year 2021 should be considered as a transition year regarding this specific part of the harmonised monitoring of AMR. Stratified sampling of different imported fresh meat categories should be performed at border control posts, with proportional allocation of the number of samples to the number of consignments received per border control post and country of origin, to test Salmonella and indicator E. coli for antimicrobial susceptibility and to test for the presence of ESBL‐/AmpC‐/carbapenemase‐producing E. coli. As the sampling fractions and number of samples to be taken per consignment are indicative, MSs will also have the possibility to adapt them to their own situation, in particular, regarding pig meat and turkey meat.
1.3. The 2018–2019 EU Summary Report on AMR
Most data reported by the MSs comprise data collected in accordance with Commission Implementing Decision 2013/652/EU. The antimicrobial susceptibility data reported to EFSA for 2018 and 2019 for Campylobacter, Salmonella and indicator E. coli isolates from animals and food were analysed and all quantitative data were interpreted using ECOFFs. This report also includes results of phenotypic monitoring of resistance to third‐generation cephalosporins and/or carbapenems caused by ESBLs, AmpC b‐lactamases or carbapenemases in Salmonella and indicator E. coli, as well as the investigation at the EU level of the occurrence of complete susceptibility and MDR in data reported at the isolate level. All the information on the methodology applied, list of antimicrobials, criteria, etc. can be found in Annex A ‘Materials and methods’ available on the EFSA Knowledge Junction community on Zenodo at: https://doi.org/10.5281/zenodo.4557180. Additional information on the data reported in 2018 can also be found in EFSA and ECDC (2020).
The report also includes resistance in Salmonella and Campylobacter isolates from human cases of salmonellosis and campylobacteriosis, respectively. Results from phenotypic tests were reported by MSs to TESSy either as quantitative or categorical/qualitative data. In addition for 2019, categorical data from whole genome sequencing, where isolates had been categorised as either predicted wild type or predicted non‐wild type, corresponding to ECOFFs, were reported to TESSy for the first time. The quantitative phenotypic data were interpreted using EUCAST ECOFFs, where available. The qualitative phenotypic data had been interpreted using CBPs to guide medical treatment of the patient. The breakpoints for ‘clinical’ resistance are, in many cases, less sensitive than the ECOFF for a specific bacterium–drug combination resulting in higher levels of ‘microbiological’ resistance than ‘clinical’ resistance. By combining the categories of ‘clinically resistant’ (R) and ‘susceptible with increased exposure’ (I) into one category, however, close correspondence with the ECOFF was achieved. CBPs enable clinicians to choose the appropriate treatment based on information relevant to the individual patient. ECOFFs recognise that epidemiologists need to be aware of small changes in bacterial susceptibility, which may indicate emerging resistance and allow for appropriate control measures to be considered. ECOFFs, CBPs and related concepts on antimicrobial resistance/susceptibility are presented in detail in Annex A ‘Materials and methods’.
2. Antimicrobial resistance in Salmonella spp.10
Monitoring of non‐typhoidal salmonellas
Non‐typhoidal salmonellas (NTS) are the focus of this section, which summarises the occurrence and AMR patterns of isolates recovered from various food‐producing animal populations and their derived carcases. Whereas typhoidal salmonellas are human host‐adapted organisms that cause typhoid fever and paratyphoid fever; non‐typhoidal strains may be host generalists, infecting or colonising a broad range of animals, or tend to host specificity to particular animal species (Crump et al., 2015). Typhoidal salmonellas refer to Salmonella enterica subsp. enterica serovars Typhi, Paratyphi A, Paratyphi B (d‐tartrate negative) and Paratyphi C, while all other serovars within the subspecies enterica (including the d‐tartrate positive Paratyphi B variant Java) refer to non‐typhoidal salmonellas.
The World Health Organization states that transmission of bacterial infection from non‐human sources to humans, with the ability to cause disease, is more evident in particular bacteria (including non‐typhoidal Salmonella, Campylobacter spp. and E. coli) and comments that the potential for such transmission should be recognised (WHO, 2019). In 2019, salmonellosis was the second most common zoonosis in the European Union, with 87,923 confirmed human cases, as well as the most frequent cause of food‐borne outbreaks accounting for 17.9% of all food‐borne outbreaks reported in 2019 (EFSA and ECDC, 2021). A recent review inferred that multidrug‐resistant NTS infections may have more serious human health implications compared to those of pan‐susceptible strains (Parisi et al., 2018).
2.1. Data on AMR in Salmonella spp. addressed
Commission Implementing Decision 2013/652/EU stipulates detailed protocols for the harmonised monitoring and reporting of antimicrobial resistance (AMR) in zoonotic and commensal bacteria. The monitoring of AMR in Salmonella isolates recovered from carcases of broilers and fattening turkeys at slaughter was mandatory in 2018, in accordance with Regulation (EC) No 2073/2005; similarly, the monitoring of AMR in Salmonella isolates recovered from carcase swabs of fattening pigs and calves (under 1 year of age) at slaughter was mandatory in 2019. Additionally in 2018, the monitoring of AMR in Salmonella isolates recovered from faecal samples and/or environmental samples (boot swabs or dust) of broiler, laying hen and fattening turkey flocks was mandatory, in accordance with Regulation (EC) No 2160/2003, collected as part of National Control Programmes (NCPs) for Salmonella in poultry. In 2019, some MSs also reported Salmonella AMR data from fattening pigs and calves (under 1 year of age) at slaughter, where in general one representative sample of caecal contents was tested for Salmonella per epidemiological unit (i.e. the holding) to prevent clustering. The reporting of such data was not mandatory but was included for completeness.
The Salmonella spp. data include results for all serovars reported from the different carcase/animal origins, with one isolate per Salmonella serovar from the same epidemiological unit per year being tested for AMR (Decision 2013/652/EU). As the potential for acquiring or occurrence of AMR markedly varies between serovars, the relative contribution of different serovars to the total significantly influences overall resistance levels for Salmonella spp. data. Therefore, results have also been presented for selected serovars because of their importance and/or prevalence. Resistance profiles were also considered when less than 10 isolates were recovered from a given carcase/animal origin in a country, to account for the low prevalence of certain serovars, to prevent exclusion of emerging serovars and to ensure that the analysis included all relevant data. (Some graphical figures within this chapter, however, only present individual MS data where 10 or more Salmonella spp. were reported, although resistance at the MS group level includes all reported isolates.) The spread of particular resistant clones and the occurrence of resistance genes within these clones can be exacerbated by the use of antimicrobials in human and animal populations and the associated selective pressure. Other factors, such as foreign travel by humans, international food trade, animal movements, farming systems, animal husbandry and the pyramidal structure of some types of animal primary production, may also influence the spread of resistant Salmonella clones.
Variations in Salmonella prevalence
It is of note that countries reported Salmonella spp. data from the different origins according to their national situation. Notably, some MSs did not obtain any positive Salmonella isolates from the carcase and animal origins and, therefore, data are not presented for these countries. The number of countries reporting results for pig and broiler carcases was considerably higher than those for calf and turkey carcases, because the size of the veal calf and turkey sectors is relatively small in certain EU MSs, with production levels below the threshold at which mandatory monitoring is required. Additionally, the number of isolates reported by countries varied because of varying Salmonella prevalence, and these factors may introduce a source of variation to results when considering all reporting countries.
In both 2018 and 2019, data for Salmonella spp. from human cases were also reported. Section 2.2 presents data for 2019, since 2018 data on humans were published in the EU Summary report for 2017/2018 (EFSA and ECDC, 2020). The analysis of AMR in Salmonella isolates from human cases includes that of prevalent serovars corresponding to those occurring in animal species.
2.2. Antimicrobial resistance in Salmonella from humans
2.2.1. Data reported
For 2019, 24 MSs and two non‐MSs reported data on AMR in Salmonella isolates from human cases of non‐typhoidal salmonellosis. Seventeen countries provided data as measured values (quantitative data), seven as data interpreted with clinical breakpoints and two as predicted phenotypic resistance based on whole genome sequencing. Not all countries reported results for all antimicrobials in the harmonised panel (ECDC, 2016). The reported data represented 26.1% of the confirmed human cases with non‐typhoidal Salmonella reported in the EU/EEA in 2019.
2.2.2. Occurrence of resistance to commonly used antimicrobials in human and/or veterinary medicine
In 2019, high proportions of human Salmonella isolates were resistant to sulfonamides (29.0%), ampicillin (25.8%) and tetracyclines (25.6%) – see Figure 1 and Annex B, Table 1. By serovar, resistance to these compounds ranged from low (4.3–8.0%) in S. Enteritidis to extremely high (70.3–87.1%) in monophasic S. Typhimurium 1,4,[5],12:i:‐ and S. Kentucky. The variation in the proportion of resistance by country was large. For S. Enteritidis, an outlier in terms of high proportion of resistance was observed in Greece for sulfonamides (43.2% – see Annex B, Table 2). For S. Infantis, Slovakia reported a much higher resistance (63.2%) to ampicillin than the EU average (18.3%), although the number of isolates tested was low (N = 19), and France reported a much lower proportion of sulfonamide‐resistant isolates (10.9% – see Annex B, Table 5). For monophasic S. Typhimurium 1,4,[5],12:i:‐, two outliers were observed: Malta reported a much lower proportion of ampicillin resistance (64.3%) than other countries and Estonia reported a lower proportion of tetracycline resistance (58.6% – see Annex B, Table 4). Resistance to gentamicin was overall low (2.3% – see Annex B, Table 1), with the exception of S. Kentucky where it was high (51.6% – see Annex B, Table 7). Similarly, levels of trimethoprim resistance were overall low among Salmonella spp. (7.0% – see Annex B, Table 1), but moderate (14.6–18.6%) in S. Kentucky, S. Typhimurium and S. Infantis (Annex B, Tables 3, 5 and 7).
Figure 1.

Occurrence of resistance to selected antimicrobials in Salmonella spp. and selected serovars isolated from humans, 2019
2.2.3. Occurrence of resistance to the highest priority ‘critically important antimicrobials’
The proportion of Salmonella isolates resistant to the critically important antimicrobial (CIA) ciprofloxacin was overall 13.5% (see Figure 1 and Annex B, Table 1), with extremely high proportions being resistant in S. Kentucky isolates (82.1% – see Figure 1 and Annex B, Table 7). In both S. Enteritidis and S. Infantis, this proportion varied significantly between countries: ranging from 0.0% in Cyprus and Malta to 46.2–51.1% in Austria, Italy and Sweden for S. Enteritidis (EU average 18.9%), and from 0 to 0.3% in Malta and Germany to 73.7% in Slovakia for S. Infantis (EU average 25.8%) – see Figure 1 and Annex B, Tables 2 and 5. In Austria, the high proportion of ciprofloxacin resistance in S. Enteritidis was the result of a very large outbreak (400 cases) of a ciprofloxacin‐resistant strain originating from eggs from another EU country (Henszel et al., 2020). Similarly, an outbreak of 50 cases linked to a restaurant could explain the high proportion of ciprofloxacin resistance in S. Enteritidis in Sweden (SVA, 2019). Outliers with high ciprofloxacin resistance were also observed in Estonia (28.0%) and Spain (30.3%) for S. Typhimurium, in Estonia (31.0%) for monophasic S. Typhimurium and in Spain (13.3%) for S. Derby (Annex B, Tables 3, 4 and 5). The low ciprofloxacin resistance observed in Germany and Malta may partly be explained by the fact that both countries applied the Enterobacterales clinical breakpoint for ciprofloxacin, which is two dilutions higher than the Salmonella breakpoint. For the two antimicrobials cefotaxime and ceftazidime, representing third‐generation cephalosporins, another class of critically important antimicrobials for Salmonella, resistance levels were generally low among Salmonella spp. (1.8% and 1.2%, respectively – see Annex B, Table 1), with higher levels (4.7–6.9%) noted among S. Infantis and S. Kentucky isolates (see Annex B, Tables 5 and 7). Outliers for both cephalosporins were observed in Italy and the UK regarding S. Infantis (23.5–31.6% resistant to cefotaxime and/or ceftazidime – see Annex B, Table 5), in Spain regarding S. Derby (6.7% – see Annex B, Table 6), and for cefotaxime only in S. Typhimurium in Germany and Spain (7.2 and 9.1%, respectively – see Annex B, Table 3). Combined resistance to ciprofloxacin and cefotaxime was overall low in Salmonella spp. (0.5%), but significantly higher in S. Infantis (2.1%) and S. Kentucky (7.0%) with particularly high proportions of combined resistance noted among S. Infantis isolates from Italy (26.3%) and among S. Kentucky isolates from the Netherlands (20.0%) – see Figure 2 and Annex B, Tables 8, 12 and 14. In S. Typhimurium, combined resistance was overall very low (0.4%) but at a higher level in Spain (9.0%) – see Figure 2 and Annex B, Table 10.
Figure 2.

Spatial distribution of combined ‘microbiological’ resistance to ciprofloxacin and cefotaxime among (a) Salmonella spp., (b) S. Typhimurium, (c) S. Infantis and (d) S. Kentucky isolated from human cases, 2019 (pink indicates fewer than 10 isolates tested)
Only eight countries tested resistance to the last line antimicrobials azithromycin and tigecycline. Resistance was overall low among Salmonella spp. (0.8% and 1.1%, respectively), with Belgium reporting the highest proportions of resistance to these antimicrobials (2.1% and 4.9%, respectively – see Annex B, Table 1). Among the individual serovars, the highest proportion of isolates resistant to azithromycin and tigecycline was observed in S. Kentucky (3.2% and 6.5%, respectively – see Annex B, Table 7). Resistance to colistin was detected in 14.2% of Salmonella isolates, although 83.4% of these resistant isolates were either S. Enteritidis or S. Dublin; serovars belonging to group D Salmonella which tend to show a higher natural tolerance to colistin (Agersø et al., 2012; Ricci et al., 2020).
2.2.4. ESBL, AmpC and carbapenemase‐producing Salmonella
In 2019, 15 MSs and one non‐MS reported Salmonella isolates resistant/non‐wild type to cephalosporins, while all tested Salmonella isolates reported by nine MSs and one non‐MS were susceptible/wild type to cephalosporins. Three countries reporting cephalosporin‐resistant isolates did not provide further details on phenotypic/genotypic characterisation and, therefore, these isolates were excluded from the analysis and Table 1 below. Presumptive ESBL‐producing Salmonella were identified in 0.8% of the tested isolates, ranging by MS from 0.2% in Sweden to 2.7% in Malta (see Annex B, Table 15). AmpC was less frequent, identified in 0.1% of tested isolates, with the highest occurrence in Malta (1.8%). A few isolates (0.03%) were reported as both presumptive AmpC‐ and ESBL‐producing. ESBL was reported in 23 different serovars in 2019, most commonly in S. Anatum, S. Haifa, S. Infantis, S. Kentucky, S. Schwarzengrund and S. Uganda (ranging between 4.5% and 8.3% – see Table 1). Presumptive ESBL production was more frequent in S. Typhimurium (0.9%) than in monophasic S. Typhimurium 1,4,[5],12:i:‐ (0.4%) and S. Enteritidis (0.1%). AmpC‐type β‐lactamases were reported in 10 different serovars, most commonly in S. Bardo, S. Chincol and S. Heidelberg (ranging between 6.3% and 100%), although the high proportions observed were most likely an effect of the few isolates tested (N = 1–16).
Table 1.
ESBL, AmpC and carbapenemase phenotypes and genotypes in Salmonella spp. isolates from humans by serovar, 2019
| Serovar | Tested for CTX and/or CAZ | Res to CTX and/or CAZ | Resistance Phenotype | Genotype | |||||||
|---|---|---|---|---|---|---|---|---|---|---|---|
| ESBL | AmpC | AmpC + ESBL | Carbapenemase | ||||||||
| N | N | N | % | N | % | N | % | N | % | ||
| Anatum | 35 | 4 | 2 | 5.7 | SHV‐12 (2) | ||||||
| Bardo | 6 | 1 | 1 | 16.7 | CMY‐2 | ||||||
| Bovismorbificans | 126 | 3 | 2 | 1.6 | 1 | 0.8 | CTX‐M (2), CMY‐2 | ||||
| Braenderup | 78 | 2 | 1 | 1.3 | CTX‐M‐15 | ||||||
| Brandenburg | 123 | 2 | 1 | 0.8 | CTX‐M‐1 | ||||||
| Bredeney | 67 | 1 | 1 | 1.5 | CMY‐2 | ||||||
| Chincol | 1 | 1 | 1 | 100 | ACC‐1 | ||||||
| Choleraesuis | 46 | 1 | 1 | 2.2 | CTX‐M‐55 | ||||||
| Coeln | 167 | 1 | 1 | 0.6 | CTX‐M | ||||||
| Corvallis | 49 | 1 | 1 | 2.0 | CTX‐M‐55 | ||||||
| Derby | 338 | 8 | 8 | 2.4 | CTX‐M‐1 (4), CTX‐M | ||||||
| Enteritidis | 4,471 | 3 | 3 | 0.1 | CTX‐M‐15 (2), CTX‐M | ||||||
| Hadar | 143 | 1 | 1 | 0.7 | |||||||
| Haifa | 22 | 2 | 1 | 4.5 | CTX‐M‐14b | ||||||
| Heidelberg | 16 | 1 | 1 | 6.3 | CMY‐2 | ||||||
| Indiana | 89 | 1 | 1 | 1.1 | |||||||
| Infantis | 760 | 38 | 36 | 4.7 | 1 | 0.1 | 1 | 0.1 | CTX‐M‐65 (15), CTX‐M‐1 (10), CTX‐M (3),CTX‐M‐9 group (2), CTX‐M‐32 | ||
| Kentucky | 214 | 13 | 12 | 5.6 | 1 | 0.5 | 1 | 0.5 | CTX‐M‐14b (9), CTX‐M‐15 | ||
| London | 41 | 1 | 1 | 2.4 | CTX‐M‐1 | ||||||
| Monophasic Typhimurium 1,4,[5],12:i:‐ | 1,805 | 15 | 8 | 0.4 | 6 | 0.3 | 3 | 0.2 | AmpC1 (3), CMY‐2 (3), CTX‐M‐1 (3), CTX‐M, CTX‐M‐9, CTX‐M‐15, CTX‐M‐55, SHV‐12 | ||
| Muenchen | 66 | 1 | 1 | 1.5 | CTX‐M‐1 | ||||||
| Napoli | 107 | 2 | 2 | 1.9 | CTX‐M‐1, CTX‐M‐65 | ||||||
| Newport | 322 | 1 | 1 | 0.3 | |||||||
| Oranienburg | 46 | 1 | 1 | 2.2 | |||||||
| Schwarzengrund | 15 | 1 | 1 | 6.7 | CTX‐M‐55 | ||||||
| Typhimurium | 2,375 | 101 | 21 | 0.9 | 3 | 0.1 | 1 | 0.04 | CTX‐M‐1 (8), CTX‐M‐9 (5), CMY‐2 (2), CTX‐M‐14 (2), CTX‐M, CTX‐M‐15, CTX‐M‐55, OXA‐1, OXA‐48 | ||
| Uganda | 12 | 1 | 1 | 8.3 | CTX‐M‐55 | ||||||
| Virchow | 144 | 3 | 3 | 2.1 | SHV‐12 (2) | ||||||
CTX: cefotaxime; CAZ: ceftazidime; ESBL: extended‐spectrum beta‐lactamase.
Only one Salmonella isolate was reported as resistant to meropenem in 2019 compared with five in 2018. This was a S. Typhimurium var. O5‐ carrying bla OXA‐48 isolated from a domestically acquired infection in Spain. In seven of 23 reporting countries, meropenem results were interpreted using the EUCAST clinical breakpoint (CBP), which is substantially higher (+4 dilutions) than the EUCAST ECOFF.
2.2.5. Complete susceptibility and multidrug resistance (MDR)
MDR was high overall (25.4%) among Salmonella spp. reported from human cases in the EU (Figure 3 and Annex B, Table 16). For the investigated serovars, MDR was most frequently reported among monophasic S. Typhimurium 1,4,[5],12:i:‐ (73.8%) and S. Kentucky (73.7%), followed by S. Infantis (35.7%), S. Typhimurium (30.9%), S. Derby (11.8%) and lastly S. Enteritidis (3.2%) (Figure 3 and Annex B, Tables 17–22). These proportions are somewhat lower than compared to 2018. Eleven isolates (six S. Infantis, two S. Typhimurium, two monophasic S. Typhimurium and a single isolate of S. Indiana) were resistant to eight of the nine tested substances, only susceptible to meropenem.
Figure 3.

- The MDR analysis of human isolates included the following antimicrobials: ampicillin, cefotaxime/ceftazidime, chloramphenicol, ciprofloxacin/pefloxacin/nalidixic acid, gentamicin, meropenem, sulfonamides/sulfamethoxazole, tetracyclines and trimethoprim/trimethoprim‐sulfamethoxazole (co‐trimoxazole).
Complete susceptibility to the nine antimicrobial classes included in the MDR analysis was observed in 49.9% of Salmonella spp. isolates and most commonly among isolates of S. Enteritidis (60.4%) and S. Derby (58.4%) (Figure 3 and Annex B, Tables 16–17 and 21). The largest variation between countries in the proportion of completely susceptible isolates was observed in S. Infantis (ranging from 25.3% in Austria to 85.9% in France) and S. Derby (ranging from 44.0% in Italy to 100% in Denmark) (Annex B, Tables 20–21).
2.2.6. Temporal trends
Trends in resistance over the period 2015–2019 were assessed with logistic regression. Trends varied by country for the different serovars and antimicrobials (Table 2, Annex B, Figures 1–7). Increasing trends in resistance were more commonly observed than decreasing trends for ciprofloxacin/quinolones and tetracycline in S. Enteritidis and for ampicillin in S. Infantis. Decreasing trends in resistance were more commonly observed for ampicillin in S. Typhimurium (nine countries with decreasing trend) and for tetracycline in Salmonella spp. (11 countries observing decreasing trends), S. Typhimurium (nine countries), monophasic S. Typhimurium (six countries) and S. Infantis (two countries).
Table 2.
Number of countries with statistically significant (p < 0.05) increasing or decreasing trends in resistance to selected antimicrobials for Salmonella spp. and selected serovars in humans in 2015–2019*
| Serovar | Ampicillin | Cefotaxime | Ciprofloxacin/quinolones | Tetracyclines | ||||
|---|---|---|---|---|---|---|---|---|
| Incr. | Decr. | Incr. | Decr. | Incr. | Decr. | Incr. | Decr. | |
| Salmonella spp. (24 MSs + 2 non‐MS) | 6 (BE, EL, FI, PL, SI, SK) | 8 (DE, EE, FR, HU, IE, LT, PT, UK) | 3 (DE, PT, UK) | 2 (FI, PL) | 7 (AT, BE, DK, EL, IT, NO, SK) | 8 (CY, ES, HU, LU, NL, PL, PT, SI) | 5 (BE, EL, FI, SI, SK) | 11 (AT, DE, DK, EE, ES, FR, HU, IE, NO, PT, UK) |
| S. Enteritidis (23 MSs + 1 non‐MS) | 6 (AT, BE, ES, IT, NL, SK) | 5 (DE, FI, HU, IE, LT) | – | 1 (PL) | 8 (AT, BE, DE, EL, IT, NO, SI, SK) | 2 (ES, FR) | 6 (AT, BE, DE, NL, SI, SK) | 3 (FI, HU, LT) |
| S. Typhimurium (23 MSs + 2 non‐MS) | 1 (HU) | 9 (AT, CY, DE, EE, FR, IT, PT, SI, UK) | 2 (DE, ES) | – | 2 (DK, LT) | 4 (EE, HU, PT, SI) | 3 (DK, ES, FI) | 9 (AT, BE, DE, EE, FR, NO, PT, SI, UK) |
| Monophasic S. Typhimurium (12 MSs + 1 non‐MSs) | 1 (ES) | 2 (AT, NO) | 1 (PT) | 1 (BE) | – | 1 (ES) | – | 6 (AT, BE, ES, FR, IE, PT) |
| S. Infantis (11 MSs) | 4 (BE, LT, NL, SK) | – | 2 (DE, UK) | – | 2 (BE, SK) | 1 (AT) | – | 2 (AT, DE) |
| S. Derby (7 MSs) | 1 (BE) | – | – | – | – | – | – | 1 (LT) |
| S. Kentucky (7 MSs) | – | – | – | – | – | – | – | – |
Only countries reporting data for at least 10 isolates for a specific combination and for at least 3 years in the 5‐year period were included.
2.2.7. High ciprofloxacin resistance
In 2019, 2.8% (106/3,756) of Salmonella spp. expressed high‐level resistance to ciprofloxacin (minimum inhibitory concentration (MIC) ≥ 4 mg/L – see Table 3). Such isolates were reported from eight of the 10 countries reporting MIC values for ciprofloxacin. Among the 11 serovars reported with MICs of ≥ 4 mg/L, high‐level ciprofloxacin resistance was most frequently observed in S. Kentucky (in 80.7% of tested S. Kentucky) followed by S. Strathcona (4.5%).
Table 3.
Occurrence of high‐level resistance to ciprofloxacin (MIC ≥ 4 mg/L) in Salmonella serovars from human cases in 2019, 10 Mss
| Serovar | N | High‐Level Resistance to Ciprofloxacin (MIC ≥ 4 mg/L) | |
|---|---|---|---|
| n | % | ||
| S. Enteritidis | 803 | 2 | 0.2 |
| S. Heidelberg | 4 | 1 | NA |
| S. Indiana | 2 | 1 | NA |
| S. Infantis | 270 | 3 | 1.1 |
| S. Kentucky | 114 | 92 | 80.7 |
| S. Mbandaka | 3 | 1 | NA |
| S. Potsdam | 2 | 1 | NA |
| S. Strathcona | 22 | 1 | 4.5 |
| S. Tumodi | 1 | 1 | NA |
| S. Typhimurium | 522 | 3 | 0.6 |
| Other | 2,013 | 0 | 0 |
| Total (8 MSs) | 3,756 | 106 | 2.8 |
Additional data on certain resistance traits of Salmonella isolates from humans are provided hereafter and presented in parallel to corresponding data on Salmonella spp. from animals and food.
2.3. Occurrence of antimicrobial resistance in Salmonella from poultry, porcine and bovine populations, and carcases from these species
In 2018, AMR data for Salmonella isolates recovered from the mandatory carcase sampling of broilers and fattening turkeys at slaughter were reported by 19 MSs and two non‐MSs for broilers and nine MSs for turkeys; while in 2019, AMR data for Salmonella isolates recovered from the mandatory carcase swabbing of fattening pigs and calves (less than 1 year of age) at slaughter were reported by 26 MSs and one non‐MS for fattening pigs and seven MSs for calves. Additionally in 2018, 26 MSs and two non‐MSs reported mandatory AMR data for Salmonella isolates recovered from flocks of broilers, laying hens and fattening turkeys (boot swabs or dust samples), in accordance with Regulation (EC) No 2160/2003 and as part of National Control Programmes (NCPs) of Salmonella in poultry. Notably, some MSs did not obtain any positive Salmonella isolates from these carcase/animal origins and, therefore, data are not presented for these countries in corresponding results. In 2019, nine MSs also reported voluntary data on Salmonella isolates recovered from caecal contents of fattening pigs and calves (less than 1 year of age) at slaughter, where in general one representative sample of caecal contents was tested for Salmonella per epidemiological unit (i.e. the holding) to prevent clustering. The reporting of isolate‐based data enables the analysis of MDR patterns, detection of high‐level ciprofloxacin resistance and co‐resistance to ciprofloxacin and cefotaxime; first‐line agents critically important for treating human salmonellosis. Resistance levels were also reported by serovar for the different animal/carcase origins (see Appendix C), which allows detailed analysis and, as required by Decision 2013/652/EU, all MSs included information on serovars and production type. In line with this decision, streptomycin is no longer included in the specified test panels for the monitoring and reporting of AMR in Salmonella, which has an impact on how MDR patterns are interpreted.
Summary data on the occurrence of resistance to commonly used antimicrobials in veterinary medicine (ampicillin, sulfamethoxazole and tetracycline) as well as critically important antimicrobials (CIAs – represented by ciprofloxacin, cefotaxime and combined resistance to these two antimicrobials) are displayed in Figure 4 (a and b) for Salmonella isolates recovered from a) carcases and b) food‐producing animals, and are described in the forthcoming text. Annex B (available on the EFSA Knowledge Junction community on Zenodo at: https://doi.org/10.5281/zenodo.4557180) presents the occurrence of antimicrobial resistance (%) in Salmonella spp. from carcases of broilers, turkeys, pigs and calves, as well as from broilers, laying hens, turkeys, pigs and calves, at both the MS and MS group level.
Figure 4.

- AMP: ampicillin; SMX: sulfamethoxazole; TET: tetracycline; CIP: ciprofloxacin; CTX: cefotaxime; CIP/CTX: combined ‘microbiological’ resistance to ciprofloxacin and cefotaxime; N: total number of Salmonella spp. reported by MSs; blue diamond shows resistance at the reporting MS‐group level. Note: Only MSs reporting data for 10 or more isolates are shown in the graph; however, all isolates are included in the calculation of resistance at the reporting MS‐group level. As only two MSs reported data on 10 or more Salmonella isolates recovered from calves or their derived carcases, resistance levels for these origins are not presented in Figure 4 (a and b).
2.3.1. Occurrence of resistance to commonly used antimicrobials in veterinary medicine
Carcases of poultry
Antimicrobials such as ampicillin, sulfamethoxazole and tetracycline have been widely used for many years in veterinary medicine to treat infections in production animals. While ampicillin is categorised as a high priority, ‘critically important antimicrobial’ (CIA) by the World Health Organization; sulfamethoxazole and tetracycline are recognised as ‘highly important antimicrobials’ (WHO, 2019). Considering all MSs reporting Salmonella spp. data from poultry carcases in 2018, overall resistance to ampicillin, sulfamethoxazole and tetracycline ranged from moderate to very high11 (Figure 4a). Ampicillin resistance was observed at overall moderate levels in both broiler and turkey carcases (13.7% and 16.5%, respectively); sulfamethoxazole resistance was noted at an overall high level in broiler carcases and a moderate level in turkey carcases (33.9% and 13.7%, respectively); while tetracycline resistance was noted at an overall high level in broiler carcases and a very high level in turkey carcases (35.5% and 57.3%, respectively). Among Salmonella isolates recovered from turkey carcases, overall resistance levels were generally lower than those observed for broiler carcases with the exception of chloramphenicol, ampicillin and colistin resistance which were slightly higher than the values registered for broiler carcases. Notably, tetracycline resistance was reported at a much higher level among isolates from turkey carcases compared to that from broiler carcases considering all reporting MSs (57.3% and 35.5%, respectively).
Carcases of pigs and calves
Among Salmonella spp. recovered from carcase swabs of pigs and calves in 2019, the highest levels of resistance were noted to ampicillin, sulfamethoxazole and tetracycline considering all reporting MSs. High to extremely high levels of resistance to these antimicrobials were recorded in pig carcases by the majority of the MSs included in the analysis (Figure 4a); while resistance to these compounds generally ranged from high to very high among isolates from calf carcases (overall resistance in pig carcases: 48.9%, 52.1% and 52.7%, respectively; overall resistance in calf carcases: 22%, 31.9% and 41.8%, respectively). Among Salmonella isolates recovered from calf carcases, overall resistance levels were mostly lower than those observed for pig carcases, with the exception of tigecycline and colistin resistance (3.3% and 17.6%, respectively) which were higher than the values registered for pig carcases (0.9% and 1.8%, respectively); however, the total number of isolates from calf carcases (N = 91) was considerably lower than that from pig carcases (N = 1,088).
Food‐producing animals
Among Salmonella spp. recovered from fattening pigs and calves in 2019, as well as flocks of broilers and fattening turkeys in 2018, most MSs reported moderate or high to extremely high resistance to tetracyclines and sulfonamides. Resistance to these antimicrobials was generally observed at lower levels among laying hen flocks than broiler flocks in 2018, with most MSs registering low to high levels of resistance which did not exceed 37% in flocks of laying hens. Considering reporting MSs, resistance levels to ampicillin were generally observed at similar or slightly lower levels to those of tetracycline and sulfamethoxazole within all food‐producing animal origins; and overall resistance levels to these three antimicrobials were highest in isolates from pigs and turkeys (Figure 4b).
2.3.2. Occurrence of resistance to other ‘critically important antimicrobials’ (CIAs)
Use of ‘critically important antimicrobials’ (CIAs) for the treatment of salmonellosis
Fluoroquinolones and third‐generation cephalosporins are categorised as highest priority, critically important antimicrobials (CIA) in human medicine (WHO, 2019). Although fluoroquinolones may not be recommended for use in children, these CIAs often constitute first‐line treatment for invasive salmonellosis in humans and as such, the monitoring of resistance to these compounds in zoonotic bacteria, including Salmonella spp., originating from animals is of particular interest. These classes are represented by ciprofloxacin and cefotaxime/ceftazidime, respectively; compounds which are specified in the antimicrobial panels for the monitoring and reporting of AMR in Salmonella spp. The WHO also recognises tigecycline and azithromycin as CIAs. Additionally, colistin is considered as a highest priority CIA for the treatment of serious human infection with some Gram‐negative bacteria (WHO, 2019).
Carcases of poultry, fattening pigs and calves
As fluoro(quinolones) are highest priority, CIAs in human medicine, their use in food‐producing animals is subject to prudent use initiatives. Considering Salmonella spp. recovered from broiler carcases in 2018, resistance to the (fluoro)quinolone antimicrobial agents, ciprofloxacin and nalidixic acid, was reported at high to extremely high levels by many of the MSs included in the analysis (with overall resistance at 51.4% and 48.8%, respectively). Resistance levels to ciprofloxacin and nalidixic acid in isolates from turkey carcases ranged from low or not detected to extremely high among reporting MSs (overall, 32.4% and 23.7%, respectively). In certain Salmonella serovars recovered from carcases of pigs and poultry, isolates resistant to ciprofloxacin but not to nalidixic acid were observed; possibly indicating the occurrence of plasmid‐mediated quinolone resistance (PMQR) mechanisms – see text box below. This was particularly apparent among 13 S. Hadar isolates reported from turkey carcases by Romania in 2018, where all isolates displayed ciprofloxacin resistance, yet none showed resistance to nalidixic acid. Similarly, 15/65 monophasic S. Typhimurium isolates reported from pig carcases by Spain displayed ciprofloxacin resistance, yet only 12/65 isolates showed nalidixic acid resistance. Additionally, 3/15 S. Derby isolates and 3/15 S. Brandenburg isolates reported from pig carcases by Croatia and Italy, respectively, displayed ciprofloxacin resistance, without resistance to nalidixic acid.
Quinolone/fluoroquinolone resistance in Salmonella
Quinolone/fluoroquinolone (i.e. nalidixic acid/ciprofloxacin) resistance in Salmonella usually arises due to point mutations within the DNA gyrase (gyrA and gyrB) and topoisomerase IV (parC and parE) genes, at locations comprising the quinolone resistance‐determining regions (QRDR) of the bacterial chromosome. Additionally, plasmid‐mediated quinolone resistance (PMQR) mechanisms have also been recognised, including the action of efflux pumps (qepA and oqxAB genes), enzymatic modifications (aac(6′)Ib‐cr gene – also conferring resistance to kanamycin) and protection of the DNA gyrase (qnrA, qnrB, qnrC, qnrD, qnrS and qnrVC genes) (Li et al., 2013; Luk‐In et al., 2017).
The clinical breakpoint (CBP) for ciprofloxacin in Salmonella has been lowered by EUCAST from > 1 mg/L to > 0.06 mg/L, resulting in the CBP and ECOFF (microbiological breakpoint) for ciprofloxacin applying the same threshold (MIC > 0.064 mg/L). The presence of two point mutations in the QRDR will usually confer resistance to ciprofloxacin, with isolates typically exhibiting MICs of > 1 mg/L, as well as conferring resistance to nalidixic acid. In contrast, isolates harbouring only one point mutation in the QRDR will usually still display resistance to ciprofloxacin and nalidixic acid, but the degree of resistance to ciprofloxacin is reduced (MIC > 0.064 mg/L). Salmonella isolates causing systemic infections in humans and displaying MICs of > 0.064 mg/L but < 1 mg/L, have shown a poor response to treatment in some studies. This provides the rationale for setting the CBP at > 0.064 mg/L and it follows that monitoring of low‐level resistance to this compound is therefore indicated.
In the absence of other fluoroquinolone resistance mechanisms, the presence of PMQR determinants (i.e. primarily qnr genes) in a bacterium usually confers resistance to ciprofloxacin, with an MIC of > 0.064 mg/L, but the isolate remains susceptible to nalidixic acid. This contrasts with mutation in the QRDR regions of the bacterial chromosome, which confer resistance to both ciprofloxacin and nalidixic acid.
‘Microbiological’ resistance to third‐generation cephalosporins (cefotaxime and ceftazidime) in Salmonella spp. from carcases of these food‐producing animals was either not discerned or detected at low levels in most of the reporting MSs, with the exception of Portugal (N = 6) which reported resistance in 1/6 Salmonella spp. from broiler carcases, as well as Romania (N = 3) which reported resistance in 1/3 isolates from pig carcases. No reporting countries detected third‐generation cephalosporin resistance among Salmonella isolates from carcases of calves or turkeys. Section 2.3.6 provides further information on the phenotypic characterisation of third‐generation cephalosporin resistance among Salmonella isolates from pig and broiler carcases.
The Netherlands and Romania were the only countries to report combined ‘microbiological’ resistance to both ciprofloxacin and cefotaxime in single isolates from pig carcases (of serovars Heidelberg and Derby, respectively), while Portugal was the only country to report combined ‘microbiological’ resistance to these antimicrobial agents in an isolate from a broiler carcase (S. Paratyphi B var. Java). Therefore, considering all reporting MSs, ‘microbiological’ combined resistance to these agents among isolates from pig and broiler carcases was observed at overall very low levels (0.2% and 0.1%, respectively) – see Figure 4a. Notably, when clinical breakpoints (CBPs) were applied, only the single S. Paratyphi B var. Java isolate recovered from a broiler carcase by Portugal exhibited ‘clinical’ resistance to these compounds.
Resistance to azithromycin (a highest priority CIA) in Salmonella spp. from carcases of pigs, calves and poultry was generally low or not detected, although there were a couple of exceptions: Portugal reported a very high level of resistance to this compound among isolates from pig carcases (64.7%), as well as a moderate level of resistance among isolates from broiler carcases (16.7%), although data were provided for a low/very low number of isolates (N = 17 and N = 6, respectively).
Considering all reporting MSs, tigecycline resistance was reported at very low levels among isolates from turkey and pig carcases (0.6% and 0.9%, respectively), and at low levels from broiler and calf carcases (1.9% and 3.3%, respectively). Where countries reported resistance to this antimicrobial, generally low/very low levels were observed, with the exception of the Netherlands which reported a high level of resistance (21.7%) in 5/23 isolates recovered from pig carcases and a moderate level of resistance (19%) in 4/21 isolates recovered from broiler carcases. Similarly, Portugal reported a moderate level of resistance to tigecycline (16.7%) in 1/6 isolates recovered from broiler carcases; however, the small sample size should be considered when interpreting this result. Where tigecycline resistance was reported, multidrug resistance was often a feature; with all resistant isolates recovered from carcases of calves, broilers and turkeys (n = 3, n = 17 and n = 2) and 70% of those from pig carcases (n = 10) showing multiresistance.
Overall, colistin resistance was reported at very low/low levels among isolates from carcases of broilers, pigs and turkeys (1%, 1.8% and 2.5%, respectively), while a moderate level was noted among isolates from calf carcases (17.6%). With the exception of calf carcases, where countries reported resistance to this antimicrobial among isolates from the other carcase origins, generally very low or low levels were noted; however, there were a few exceptions. In pig carcases, a moderate level of resistance at 17.6% was noted by Portugal (N = 17), as well as a high level (22.2%) reported by the United Kingdom (N = 9). Additionally, a moderate level (16.7%) was noted by Portugal (N = 6) in broiler carcases, as well as a high level (38.5%) reported by Romania (N = 13) in turkey carcases. Notably, some of these countries provided data for a very low number of isolates; therefore, results may be subject to variation. The contribution of different serovars can influence these outputs, because of the occurrence of a degree of intrinsic resistance to colistin in Group D Salmonella isolates.
Food‐producing animals
Overall, very high/high levels of resistance to ciprofloxacin and nalidixic acid were observed in Salmonella spp. from broilers (51.8% and 48.8%, respectively) and turkeys (42.7% and 33.7%, respectively), compared with moderate levels recorded in Salmonella isolates from laying hens (16.2% and 14.9%, respectively) and moderate/low levels reported in isolates from calves (12.5% and 7.8%, respectively) and pigs (5.8% and 4.5%, respectively) – see Figure 4b. Salmonella isolates exhibiting ciprofloxacin resistance and nalidixic acid susceptibility were evident, possibly indicating the occurrence of PMQR mechanisms. This was particularly apparent among 39 S. Newport isolates reported from turkeys by Hungary, where all isolates displayed ciprofloxacin resistance, yet only 23/39 showed resistance to nalidixic acid. Similarly, 14/15 S. Livingstone isolates reported from broilers by Greece displayed ciprofloxacin resistance, yet only 5/15 isolates showed nalidixic acid resistance. The findings were therefore similar for ciprofloxacin and nalidixic acid resistance in Salmonella spp. from turkeys and broilers to those observed in isolates from their derived carcases.
Resistance to cefotaxime and ceftazidime in Salmonella isolates from these animal origins was either not discerned or detected at very low/low levels by reporting MSs, although there were a few exceptions. Among isolates from broilers, high levels of 24.8% were noted by Italy (N = 121), as well as moderate levels of 14.3% noted by the Netherlands which reported data on a low number of isolates (N = 7). Similarly, Italy (N = 49) reported high levels of third‐generation cephalosporin resistance at 26.5% from turkey isolates. The Republic of North Macedonia also reported resistance to third‐generation cephalosporins in 1/9 isolates from laying hens. No resistance to third‐generation cephalosporins was detected in calves, consistent with the result obtained for Salmonella spp. from calf carcases; however, only 64 calf isolates were obtained by three MSs in 2019, which was considerably lower than the total number of isolates reported for the other animal sectors. Section 2.3.6 provides further information on the phenotypic characterisation of third‐generation cephalosporin resistance among Salmonella isolates from the animal origins.
Where MSs reported combined ‘microbiological’ resistance to ciprofloxacin and cefotaxime in Salmonella isolates from pigs or broilers, laying hens or turkeys, this was observed at very low or low levels, although the same exceptions as above were noted. Among isolates from broilers, a high level of 24.8% was reported by Italy (30/121 isolates), as well as a moderate level of 14.3% reported by the Netherlands (1/7 isolates). The Republic of North Macedonia also reported a moderate level of combined ‘microbiological’ resistance to these compounds in 1/9 isolates from laying hens (11.1%). Among isolates from turkeys, Italy again reported a high level of combined ‘microbiological’ resistance to these antimicrobials at 26.5% (13/49 isolates). Nevertheless, when ciprofloxacin and cefotaxime resistance was interpreted using CBPs, only five isolates recovered from broilers (four from Malta and one from the Netherlands) and one from laying hens (Hungary) displayed ‘clinical’ resistance; these were all S. Kentucky. Combined ‘clinical’ resistance to these antimicrobials was not observed among isolates from pigs or turkeys.
Azithromycin resistance among Salmonella isolates from pigs, broilers and turkeys was either not detected or observed at low levels by reporting countries, resulting in overall very low levels considering all reporting MSs (0.3%, 0.3% and 0.5%, respectively). Resistance to azithromycin was not detected in Salmonella spp. recovered from calves or laying hens.
Overall, tigecycline resistance was reported at low levels among isolates from calves, broilers and turkeys (1.6%, 2.6% and 4.8%, respectively), and at very low levels in isolates from pigs and laying hens (0.3% and 0.3%, respectively). Where countries reported resistance to this antimicrobial among isolates from pigs, calves and laying hens, very low or low levels were noted. However, among isolates from broilers, moderate levels of resistance at 14.3% and 10.1% were noted by the Netherlands (N = 7) and Slovenia (N = 129), respectively; and a high level of 25.7% was reported by Cyprus (N = 35). Similarly, moderate/high levels of resistance at 20% and 20.6% were reported from turkey isolates by Slovakia (N = 5) and Hungary (N = 170), respectively. Notably, some of these countries provided data for a very low number of isolates from broilers or turkeys; therefore, results may be subject to variation. Where tigecycline‐resistant isolates were detected within the animal origins, the majority of isolates exhibited multidrug resistance (MDR among tigecycline‐resistant isolates were reported at levels of 66.7% in laying hens, 98.1% in broilers and 100% in pigs, calves and turkeys; although the total number of tigecycline‐resistant isolates reported from some origins was extremely low).
Considering all reporting MSs, colistin resistance was reported at overall low levels among isolates from turkeys, broilers, calves and laying hens (1.5%, 1.8%, 3.1% and 8.1%, respectively); while an overall very low level was noted among isolates from pigs (0.8%). Where countries reported resistance to this antimicrobial within each of the animal origins, generally very low or low levels were noted; however, there were a few exceptions. Moderate levels of resistance were noted by Czechia in broilers (10.3%, N = 116) and by Austria in turkeys (13.3%, N = 15), as well as moderate levels of 15% and 17.6% noted by Austria (N = 40) and Bulgaria (N = 34), respectively, in laying hens. Additionally, high levels of resistance were reported among isolates from laying hens by Germany (29.6%, N = 108) and the Netherlands (26.7%, N = 15). Notably, some of these countries provided data for a very low number of isolates; therefore, results may be subject to variation associated with small sample sizes.
Figure 4 (a and b) summarises the overall resistance to commonly used antimicrobials in veterinary medicine (ampicillin, sulfamethoxazole and tetracycline), as well as critically important antimicrobials (represented by ciprofloxacin, cefotaxime and combined resistance to these two antimicrobials) among Salmonella isolates recovered from a) carcases of broilers, turkeys and pigs and b) broilers, laying hens, fattening turkeys and fattening pigs.
2.3.3. Complete susceptibility (CS) and multidrug resistance (MDR)
Carcases of poultry, fattening pigs and calves
The levels of multidrug resistance (MDR),12 defined as resistance to three or more antimicrobial classes, among Salmonella isolates from carcases of the monitored food‐producing animals are shown in Figure 5. Overall, MDR was observed at high levels in Salmonella spp. recovered from carcases of pigs, broilers and calves (43.3%, 32.7% and 23.1%, respectively), and at a moderate level in Salmonella isolates recovered from turkey carcases (15.1%). Considering only countries reporting data for 10 or more Salmonella spp. (unless otherwise stated), MDR among isolates from broiler carcases ranged from not detected in the United Kingdom to extremely high in Austria and Slovenia (87.3% and 90.9%, respectively), and among isolates from turkey carcases between 0% in Romania to 52.9% in Poland. In pig carcases, MDR ranged from low in Malta (10%) to extremely high in Portugal (88.2%). Although seven MSs provided Salmonella spp. data for calf carcases, only two countries reported data on ten or more isolates; a moderate level of 18.8% was noted by Spain, while a high level of 27.9% was reported by France.
Figure 5.

- The MDR analysis of carcase isolates included the following antimicrobials: ampicillin, cefotaxime/ceftazidime, chloramphenicol, ciprofloxacin/nalidixic acid, gentamicin, meropenem, sulfamethoxazole, tetracycline, tigecycline and trimethoprim. MDR and complete susceptibility levels are also expressed as a percentage; N: total number of Salmonella spp. reported by MSs and non‐MSs
The levels of complete susceptibility (defined as susceptibility to each of the ten antimicrobial classes tested in the harmonised panel) also varied between reporting countries for most of the carcase origins (Figures 6 and 7). Considering only countries reporting data for ten or more Salmonella spp. (unless otherwise stated), the proportion of completely susceptible isolates recovered from broiler carcases ranged from not detected in Greece and Slovenia to extremely high in Czechia and the United Kingdom (71.4% and 99%, respectively), and for turkey carcases between 0% in Spain and Romania to 35.6% in France. Among isolates from pig carcases, complete susceptibility ranged from low in Portugal and Czechia (5.9% and 9.1%, respectively) to very high/extremely high in the Netherlands and Malta (52.2% and 80%, respectively). In calf carcases, only two countries reported data on ten or more Salmonella isolates, with complete susceptibility ranging from high in France (41.9%) to very high in Spain (53.1%). Differences in the prevalence of particular serovars and phage types of Salmonella in different countries and animal populations, and their associated patterns of resistance are likely to explain some of the differences in the levels of MDR and complete susceptibility. The proportions of isolates which were completely susceptible and MDR among particular Salmonella serovars within the carcases origins are presented in Appendix C.
Figure 6.

Spatial distributions of complete susceptibility to the panel of antimicrobials tested among Salmonella spp. from (a) broiler carcases and (b) fattening turkey carcases, using harmonised ECOFFs, 2018
Figure 7.

Spatial distributions of complete susceptibility to the panel of antimicrobials tested among Salmonella spp. from (a) fattening pig carcases and (b) calf carcases (less than 1 year of age), using harmonised ECOFFs, 2019
Food‐producing animals
The levels of MDR and complete susceptibility among Salmonella isolates recovered from the monitored food‐producing animal populations are shown in Figure 8. Overall, MDR was observed at high levels in isolates from turkeys, pigs, broilers and calves (38.8%, 38.4%, 38.2% and 35.9%, respectively), and at a low level in isolates from laying hens (6.5%). Considering only countries reporting data for ten or more Salmonella spp. (unless otherwise stated), MDR among isolates from broilers ranged from not detected in Ireland to 91.4% in Cyprus, and among isolates from turkeys between 4.7% in the United Kingdom to 68.8% in Hungary. Generally, MDR among isolates from laying hens spanned much lower levels; from not detected in Bulgaria, Denmark, Greece and the Netherlands to 36.4% in Slovenia. In pigs, MDR ranged from 30% in the Netherlands to 50% in Croatia. Among isolates recovered from calves, MDR ranged from moderate in Spain (16.7%) to extremely high in Italy (75%).
Figure 8.

- The MDR analysis of animal isolates included the following antimicrobials: ampicillin, cefotaxime/ceftazidime, chloramphenicol, ciprofloxacin/nalidixic acid, gentamicin, meropenem, sulfamethoxazole, tetracycline, tigecycline and trimethoprim. MDR and complete susceptibility are expressed as percentages; N: total number of Salmonella spp. reported by MSs and non‐MSs.
Considering the proportions of isolates exhibiting susceptibility to each of the ten antimicrobial classes tested in the harmonised panel, there was also a wide variation in the levels of complete susceptibility among the animal origins. Overall, 76.4%, 48.4%, 44.3%, 38.7% and 27.1% of the isolates reported from laying hens, calves, pigs, broilers and turkeys, respectively, were completely susceptible (Figure 8). Furthermore, the levels of complete susceptibility varied widely between reporting countries, particularly within the poultry populations, but this may reflect the greater number of countries reporting data from poultry in comparison to those reporting data from the 2019 monitoring of pigs and calves. Considering only countries reporting data for ten or more Salmonella spp. (unless otherwise stated), complete susceptibility among isolates recovered from pigs ranged from 35% in Croatia to 46.8% in Italy; and for isolates recovered from calves, from high in Italy (25%) to very high in Spain (58.3%). Among isolates recovered from poultry (Figure 9), the proportion of completely susceptible isolates from broilers ranged from 6.2% in Slovenia to 90.9% in Ireland, and for turkeys between 4.7% in Hungary to 70% in Czechia. Generally, complete susceptibility spanned higher levels among isolates from laying hens; ranging from 46.4% in Italy to 94.8% in France. However, as mentioned previously, the prevalence of particular serovars in different countries and animal populations, and their associated patterns of resistance, may account for the differences in the levels of MDR and complete susceptibility among Salmonella spp. data. Notably in laying hens, S. Enteritidis predominated (accounting for 30.6% of Salmonella isolates recovered from this poultry origin) with 83.3% of isolates exhibiting complete susceptibility. The proportions of isolates which were completely susceptible and MDR among particular Salmonella serovars within the animal origins are presented in Appendix C.
Figure 9.

Spatial distributions of complete susceptibility to the panel of antimicrobials tested among Salmonella spp. from (a) broilers, (b) laying hens and (c) fattening turkeys, using harmonised ECOFFs, 2018
2.3.4. High‐level resistance to ciprofloxacin (CIP) in Salmonella spp
High‐level resistance to ciprofloxacin [MIC ≥ 4 mg/L] was not observed in Salmonella spp. from pigs or calves, or calf carcases, and only one isolate recovered from a pig carcase displayed an MIC of ≥ 4 mg/L. Considering the total number of Salmonella isolates monitored from the different types of poultry by MSs in 2018, as well as pig carcases in 2019, the highest proportions of isolates displaying ciprofloxacin MICs of ≥ 4 mg/L were noted in broilers and turkeys; with levels of 0.1% (1/1,088), 1.3% (15/1,184), 2.5% (9/358), 5.6% (49/873), 6% (125/2,084) and 6.6% (54/815) reported from pig carcases, laying hens, turkey carcases, broiler carcases, broilers and turkeys, respectively.
Among Salmonella isolates displaying ciprofloxacin resistance, 49/449 (10.9%) isolates from broiler carcases, 9/116 (7.8%) isolates from turkey carcases and 1/88 (1.1%) isolates from pig carcases exhibited MICs of ≥ 4 mg/L. Considering the total number of CIP‐resistant isolates reported by MSs from flocks of broilers (n = 1,080), laying hens (n = 192) and turkeys (n = 348), most Salmonella isolates displaying high‐level ciprofloxacin resistance originated from broilers and turkeys (125 and 54 isolates, corresponding to levels of 11.6% and 15.5%, respectively). A lower proportion of CIP‐resistant isolates displayed MICs of ≥ 4 mg/L from laying hens (15/192 CIP‐resistant isolates, 7.8%).
The distribution of CIP‐resistant isolates displaying levels of ‘microbiological’ resistance or ‘clinical’ resistance or high‐level resistance to ciprofloxacin within each of the animal/carcase categories is illustrated in Figure 10. Notably, the distribution of MICs is provided only for CIP‐resistant isolates; the total number of Salmonella isolates monitored is provided in the legend.
Figure 10.

- n: Total number of Salmonella spp. exhibiting CIP resistance (MSs only); N: total number of Salmonella spp. reported by MSs. 1In accordance with breakpoints stated in Decision 2013/652/EU. The proportion of isolates showing high‐level resistance is not included with those exhibiting ‘clinical’ or ‘microbiological’ resistance; similarly, the proportion of isolates showing ‘clinical’ resistance is not included with those displaying ‘microbiological’ resistance. Figure 10 excludes one isolate reported from laying hens (by the Republic of North Macedonia), which was ‘microbiologically’ resistant to ciprofloxacin; as well as one isolate reported from pigs (by Switzerland), which showed ‘clinical’ resistance to ciprofloxacin.
The serovars which displayed high‐level resistance to fluoroquinolones are of interest from both epidemiological and public/animal health perspectives. A detailed analysis on the high‐level resistance to ciprofloxacin in S . Kentucky and other Salmonella serovars is presented in Appendix A.
2.3.5. Tigecycline and colistin resistance in Salmonella serovars
Tigecycline resistance in Salmonella serovars
Mechanisms of tigecycline resistance
The World Health Organization also recognises tigecycline as a CIA (WHO, 2019). Although tigecycline is not recommended for use in pregnant women or children, this CIA may be considered as a last resort for the treatment of serious infection in adults caused by MDR bacteria.
Several mechanisms of resistance to tigecycline in Salmonella and other members of the family Enterobacteriaceae have previously been described: increased activity of efflux pumps (AcrAB), mutation of the ribosomal protein S10 and modification of the Mla system involved in phospholipid transport in cell membranes (He et al., 2016).
Particular serovars displayed ‘microbiological’ resistance to tigecycline (MIC > 1 mg/L – see Annex A, ‘Materials and methods’), which may suggest clonal expansion of microbiologically‐resistant strains belonging to these serovars. Figure 11 shows the number of tigecycline‐resistant isolates where detected from the animal/carcase origins by reporting MSs, and the predominant serovars accounting for this resistance. All of the tigecycline‐resistant isolates recovered from calf carcases were S. Derby (n = 3), while S. Typhimurium accounted for 40% of those recovered from pig carcases. Serovar Infantis accounted for most of the resistant isolates recovered from broilers and their derived carcases (85.2% and 88.2%, respectively), while S. Bredeney accounted for most/all of the tigecycline‐resistant isolates recovered from turkeys and their derived carcases (71.8% and 100%, respectively). Additionally, S. Infantis accounted for all of tigecycline‐resistant isolates from laying hens (100%), although only three resistant isolates were reported in total.
Figure 11.

- n: Total number of tigecycline‐resistant isolates reported by the MSs; predominant serovars are also expressed as a percentage; * monophasic S. Typhimurium includes antigenic formulas; salmonellas in the legend are listed according to their predominance within all the animal/carcase origins.
Where tigecycline resistance was reported among certain serovars within the carcase/animal origins, multidrug resistance was often a feature. For instance, among broilers and their derived carcases, all tigecycline‐resistant S. Infantis isolates (n = 46 and n = 15, respectively) were multiresistant, with ciprofloxacin, nalidixic acid, sulfamethoxazole and tetracycline resistance being a feature of all MDR isolates; a pattern typical of recent MDR broiler clones of S. Infantis (Nógrády et al., 2012). Among turkeys and their derived carcases, all tigecycline‐resistant S. Bredeney isolates (n = 28 and n = 2, respectively) were multiresistant, with ampicillin, nalidixic acid and tetracycline resistance being a feature of all MDR isolates. Similarly among pig carcases, all tigecycline‐resistant S. Typhimurium isolates (n = 4) were multidrug resistant, showing resistance to ampicillin, sulfamethoxazole, trimethoprim and tetracycline; and among calf carcases, all tigecycline‐resistant S. Derby (n = 3) displayed resistance to chloramphenicol, sulfamethoxazole and tetracycline.
Considering individual countries reporting tigecycline resistance, certain features relating to resistance were also evident. For example, the Netherlands reported five of the ten resistant isolates recovered from pig carcases, while France reported all three of the resistant isolates recovered from calf carcases. Additionally, 35/39 tigecycline‐resistant isolates recovered from turkeys and 14/54 from broilers were reported by Hungary and Belgium, respectively. Notably, where tigecycline‐resistant isolates were detected among the carcase/animal origins, most displayed MICs just above the epidemiological cut‐off (ECOFF) of > 1 mg/L, with only a small proportion of isolates displaying ‘clinical’ resistance (MIC > 2 mg/L). Considering serovars in which markedly elevated tigecycline MICs were observed, a single S. Typhimurium isolate exhibiting a tigecycline MIC of 8 mg/L was reported from a pig carcase by the Netherlands in 2019.
Recent discovery of transferable plasmid‐mediated tigecycline resistance genes, tet (X3) and tet (X4), within Enterobacteriaceae
Tigecycline is structurally related to the tetracycline class of antibiotics and is active against Gram‐positive and Gram‐negative bacteria, as well as tetracycline‐resistant bacteria and some anaerobes (WHO, 2006). In a recent study, two transferable plasmid‐mediated tigecycline resistance genes, tet (X3) and tet (X4), were reported in numerous Enterobacteriaceae that were isolated from animals and meat (chicken and pork) in China, as well as from hospital patients from different cities around the country (He et al., 2019). Both genes were reported to confer high levels of tigecycline resistance, with isolates displaying MICs of ≥ 32 mg/L. Furthermore, in a subsequent investigation carried out by Bai et al. (2019), seven tet(X4) positive E. coli isolates were identified from retail pork samples in China (Bai et al., 2019). These isolates were all MDR and displayed tigecycline MICs ranging from 16 to 32 mg/L. The tet(X4) gene conferring such resistance in these isolates was located on various conjugative plasmids of diverse replicon types, indicating that the gene may be captured by a range of mobile genetic elements circulating among bacterial strains. The authors also comment that the occurrence of tet(X3) and tet(X4) in food‐producing animals could potentially lead to an increased risk of infection by strains harbouring these genes and treatment failure in humans (Bai et al., 2019).
The potential for other bacteria within the Enterobacteriaceae family (such as Salmonella) to acquire such transferable tigecycline resistance genes is therefore highlighted, and the importance of monitoring tigecycline resistance through determination of MICs or by molecular investigation such as WGS is further underlined.
Colistin resistance in Salmonella spp.
Mechanisms of colistin resistance
Colistin is an antimicrobial compound belonging to the polymyxin class, considered as a highest priority CIA and last resort for the treatment of serious human infection with some Gram‐negative bacteria (WHO, 2019). Although not frequently used in human medicine due to its nephrotoxic effects, colistin has been widely used in veterinary medicine for prophylactic/metaphylactic treatment (Kieffer et al., 2017). Various mechanisms of polymyxin resistance in Gram‐negative bacteria have been described (lipopolysaccharide modifications, efflux pumps, capsule formation and over‐expression of membrane protein ‐ Olaitan et al., 2014); and transferable mobile colistin resistance (mcr) genes have also been detected in Salmonella isolates (Campos et al., 2016; Carnevali et al., 2016; Skov and Monnet, 2016).
Among Salmonella isolates recovered from poultry in 2018, ‘microbiological/clinical’ resistance to colistin (MIC > 2 mg/L) was generally observed in S. Enteritidis isolates; this serovar accounting for 33.3%, 63.2% and 89.6% of the colistin‐resistant isolates recovered from broiler carcases, broilers and laying hens, respectively. A single colistin‐resistant S. Enteritidis isolate was also reported from turkeys. Considering the monitoring performed in 2019, both of the colistin‐resistant isolates reported from calves, as well as 6/16 colistin‐resistant isolates from calf carcases were serotyped as S. Dublin. A single colistin‐resistant S. Dublin isolate was also reported from pig carcases. Notably, both S. Enteritidis and S. Dublin are group D salmonellas (serogroup O9). Salmonella belonging to group D tend to show decreased susceptibility to colistin without having any known acquired or mutational colistin resistance mechanisms (Agersø et al., 2012; Ricci et al., 2020). This is exemplified by the proportion of colistin‐resistant isolates belonging to S. Enteritidis and S. Dublin in 2018 and 2019, respectively. Figure 12 presents the number of colistin‐resistant isolates where detected from the animal/carcase origins by reporting MSs, and the predominant serovars accounting for this resistance. Serovars Eastbourne, Kapemba, Napoli and Panama are also group D salmonellas; the other serovars listed in Figure 12 do not belong to group D (serogroup O9). A colistin‐resistant S. Kapemba isolate was reported from a pig and a S. Panama isolate displaying colistin resistance was reported from a pig carcase. Additionally, a colistin‐resistant S. Eastbourne isolate was reported from a broiler carcase, as well as single colistin‐resistant S. Napoli isolates recovered from broiler and laying hen flocks.
Figure 12.

- n: Total number of colistin‐resistant isolates reported by the MSs; predominant serovars are expressed as a percentage; * monophasic S. Typhimurium includes antigenic formulas; salmonellas in the legend are listed according to their predominance within all the animal/carcase origins.
S. Newport and S. Hadar accounted for 33.3% and 55.6% of the colistin‐resistant isolates from turkeys (n = 12) and their derived carcases (n = 9), respectively; while monophasic S. Typhimurium accounted for half of the colistin‐resistant isolates from pig carcases (n = 20). Among Salmonella isolates recovered from pigs, only three colistin‐resistant isolates were reported, of which S. Typhimurium and its monophasic variant accounted for 66.7% of these. A variety of different serovars from pig and calf carcases displayed colistin resistance (Bovismorbificans, Brandenburg, Bredeney, London, Montevideo, Paratyphi B var Java, Typhimurium and Welikade), including three S. Derby isolates from pig carcases. Additionally, colistin resistance was reported in a diverse range of serovars from poultry, including serovars Bardo, Bovismorbificans, Brandenburg, Bredeney, Chester, Coeln, Heidelberg, Infantis, Kedougou, Kentucky, Manhattan, Minnesota, Montevideo, Saintpaul, Thompson, Typhimurium and its monophasic variant.
Considering serovars in which markedly elevated colistin MICs were observed, a single S. Bredeney isolate exhibiting a colistin MIC of 16 mg/L was reported from turkeys by France in 2018.
2.3.6. Phenotypic characterisation of third‐generation cephalosporin and carbapenem resistance in Salmonella spp.
Further phenotypic characterisation of those Salmonella isolates that exhibited resistance to third‐generation cephalosporins within each of the animal categories and for Salmonella isolates from humans (Appendix B) was performed in 2018/2019 (Table B.1). Notably, no Salmonella isolates recovered from calves or their derived carcases, or turkey carcases exhibited resistance to third‐generation cephalosporins.
Table B.1.
Occurrence of resistance to third‐generation cephalosporins and fluoroquinolones in non‐typhoidal Salmonella spp. from food‐producing animals, animal carcases and humans, reported by MSs in 2018/2019
| Human/animal category | No. of MSs | N | Cefotaxime | Ceftazidime | Ciprofloxacin/pefloxacin | |||
|---|---|---|---|---|---|---|---|---|
| n | % | n | % | n | % | |||
| Humans – 2018* | See footnote below | – | 1.5%a | – | 1.2%b | – | 12.5%c | |
| Humans – 2019* | – | 1.8%d | – | 1.2%e | – | 13.5%f | ||
| Broiler carcases – 2018 | 19 MSs | 873 | 1 | 0.1% | 1 | 0.1% | 449 | 51.4% |
| Turkey carcases – 2018 | 9 MSs | 358 | 0 | 0% | 0 | 0% | 116 | 32.4% |
| Pig carcases – 2019 | 26 MSs | 1, 088 | 5 | 0.5% | 5 | 0.5% | 88 | 8.1% |
| Calf carcases (< 1 yr) – 2019 | 7 MSs | 91 | 0 | 0 | 0 | 0 | 2 | 2.2% |
| Broilers – 2018 | 25 MSs | 2,084 | 40 | 1.9% | 40 | 1.9% | 1,080 | 51.8% |
| Laying hens – 2018 | 24 MSs | 1,184 | 3 | 0.3% | 2 | 0.2% | 192 | 16.2% |
| Fattening turkeys – 2018 | 16 MSs | 815 | 21 | 2.6% | 15 | 1.8% | 348 | 42.7% |
| Fattening pigs – 2019 | 8 MSs | 359 | 4 | 1.1% | 4 | 1.1% | 21 | 5.8% |
| Calves (< 1 year) – 2019 | 3 MSs | 64 | 0 | 0 | 0 | 0 | 8 | 12.5% |
N: Total number of isolates tested/reported by MSs; n: Total number of isolates resistant; MSs: Member states.
In several countries, ciprofloxacin has been replaced by pefloxacin for screening for fluoroquinolone resistance with disk diffusion, as recommended by EUCAST.
N = 14,983, 23 MSs.
N = 13,668, 20 MSs.
N = 16,997, 23 MSs.
N = 16,414, 24 MSs.
N = 14,356, 20 MSs.
N = 18,397, 24 MSs.
Salmonella spp. from food‐producing animals and derived carcases
Considering only isolates from the animal sector, a low percentage (77/6,916, 1.1% of all Salmonella recovered from all animals/carcases in 2018/2019) demonstrated third‐generation cephalosporin resistance and were subjected to further phenotypic characterisation. The proportions of isolates exhibiting ESBL, AmpC or ESBL+AmpC phenotypes within the different animal species and production types are presented in Table 4. Given the total number of Salmonella isolates reported by the MSs within the animal categories, the percentage of presumptive ESBL, AmpC or ESBL+AmpC producers was similar, with the ESBL phenotype more frequently detected than the AmpC phenotype among pig carcases, broilers and turkeys. Considering the individual MSs reporting cephalosporin‐resistant isolates from pigs and poultry and related matrices, where presumptive ESBL, AmpC or ESBL+AmpC‐producers were identified, they were observed at very low or low levels, although there were a few exceptions. Italy reported the highest number of isolates from both broilers and turkeys, with 30 isolates from broilers and 13 isolates from turkeys exhibiting the ESBL phenotype (24.8% and 26.5% of all isolates tested by Italy, respectively). Although only single isolates were reported to exhibit an ESBL phenotype in broilers by the Netherlands and an ESBL+AmpC phenotype in broiler carcases by Portugal, these translate to moderate levels at the MS level (14.3% and 16.7%, respectively) due to a low number of isolates tested (N = 7 and N = 6, respectively). Similarly, only three Salmonella isolates were reported in total from pig carcases by Romania, with one identified as a presumptive ESBL‐producer (33.3% of all isolates tested by this MS).
Table 4.
Summary of phenotypic characterisation of third‐generation cephalosporin resistance in non‐typhoidal Salmonella spp. from food‐producing animals, animal carcases and humans, reported in 2018/2019
| Matrix | Presumptive ESBL and/or AmpC‐ producersa n (%R) | Presumptive ESBL‐producersb n (%R) | Presumptive AmpC‐producersc n (%R) | Presumptive ESBL + AmpC‐producersd n (%R) |
|---|---|---|---|---|
| Humans ‐ 2018 (N = 9,894, 15 MSs) | 91 (0.9) | 75 (0.8) | 16 (0.2) | 0 (0) |
| Humans – 2019 (N = 14,389, 21 MSs) | 128 (0.9) | 111 (0.8) | 17 (0.1) | 5 (0.03) |
| Broiler carcases (N = 873, 19 EU MSs) | 1 (0.1) | 1 (0.1) | 1 (0.1) | 1 (0.1) |
| Pig carcases (N = 1,088, 26 EU MSs) | 5 (0.5) | 3 (0.3) | 2 (0.2) | 0 (0) |
| Broilers (N = 2,084, 25 EU MSs) | 43 (2.1) | 40 (1.9) | 9 (0.4) | 6 (0.3) |
| Laying hens (N = 1,184, 24 EU MSs) | 2 (0.2) | 1 (0.1) | 1 (0.1) | 0 (0) |
| Fattening turkeys (N = 815, 16 EU MSs) | 21 (2.6) | 21 (2.6) | 3 (0.4) | 3 (0.4) |
| Fattening pigs (N = 359, 8 EU MSs) | 3 (0.8) | 1 (0.3) | 2 (0.6) | 0 (0) |
N: Total number of isolates reported by the MSs; n: number of the isolates resistant; %R: percentage of resistant isolates; ESBL: extended‐spectrum β‐lactamase.
Isolates exhibiting only ESBL‐ and/or only AmpC‐ and/or combined ESBL+AmpC phenotype.
Isolates exhibiting an ESBL‐ and/or combined ESBL+AmpC‐phenotype.
Isolates exhibiting an AmpC and/or combined ESBL+AmpC‐phenotype.
Isolates exhibiting a combined ESBL+AmpC phenotype.
Salmonella serovars from food producing animals and carcases
When assessing the 2019 data by serovar, the ESBL or AmpC phenotype was detected in four serovars among porcine isolates, these being: S. Derby, S. Heidelberg, S. Rissen and monophasic S. Typhimurium. Among Salmonella isolates from pig carcases, three displayed an ESBL phenotype (one S. Derby from Romania and two monophasic S. Typhimurium from Italy), and two displayed an AmpC phenotype (a monophasic S. Typhimurium from Czechia and S. Heidelberg from the Netherlands). In pigs, a single Salmonella isolate displayed an ESBL phenotype (monophasic S. Typhimurium from Italy) and two displayed an AmpC phenotype (single isolates of S. Rissen and monophasic S. Typhimurium from Italy).
Considering the 2018 data on poultry, the ESBL or AmpC phenotype was associated with multiple isolates belonging to certain serovars, suggesting the possible clonal expansion of particular strains: namely, S. Infantis, S. Kentucky, S. Bareilly and S. Bredeney. Among both broilers and turkeys, presumptive ESBL‐producing Salmonella were identified more frequently than presumptive AmpC‐producing Salmonella and encompassed a greater number of serovars. The ESBL phenotype was identified in four different serovars from broilers (Infantis, Kentucky, Livingstone and Rissen) and six different serovars from turkeys (Agona, Bareilly, Bredeney, Derby, Infantis and Typhimurium), while the AmpC phenotype was identified in only two different serovars from these origins (Infantis and Orion in broilers; Infantis and Derby in turkeys). Six of the AmpC‐carrying S. Infantis from broilers and two from turkeys, as well as the AmpC‐carrying S. Derby from turkeys, also expressed an ESBL phenotype. Where presumptive ESBL, AmpC or ESBL+AmpC‐producers were identified from broilers (43/2,084 isolates), most were attributed to S. Infantis (30 isolates reported by Italy and four by Hungary) and S. Kentucky (four isolates reported by Malta and one by the Netherlands). All 30 S. Infantis isolates reported by Italy displayed an ESBL phenotype, as well as an AmpC phenotype in six of these; while of the four S. Infantis isolates reported by Hungary, two presented with an ESBL phenotype and two with an AmpC phenotype. Conversely, only the ESBL phenotype was expressed in the five S. Kentucky isolates. Where presumptive ESBL, AmpC or ESBL+AmpC‐producers were identified from turkeys (21/815 isolates), most were attributed to S. Infantis (7 isolates reported by Italy), S. Bareilly (six isolates reported by Italy) and S. Bredeney (4 isolates reported by Spain). All seven S. Infantis isolates reported by Italy displayed an ESBL phenotype, as well as an AmpC phenotype in two of these; while the six S. Bareilly and four S. Bredeney (reported by Italy and Spain, respectively) presented with an ESBL phenotype only. Among laying hens, a single S. Infantis isolate reported by Italy was also identified as a presumptive ESBL‐producer, and a single S. Kentucky isolate reported by Hungary was identified as a presumptive AmpC‐producer. Additionally, both the ESBL and AmpC phenotype were detected in a single S. Paratyphi B var. Java isolate reported from a broiler carcase by Portugal.
2.3.7. Carbapenem resistance in Salmonella spp. from food‐producing animals and carcases
Carbapenems are recognised as CIAs (WHO, 2019) and include meropenem, a compound which is specified in the antimicrobial panels for the monitoring and reporting of AMR in Salmonella spp. (as stipulated by Decision 2013/652/EU). This class of antimicrobials are not therapeutically used in food‐producing animals but are reserved for use in humans.
In 2018 and 2019, none of the Salmonella isolates recovered from any of the animal or carcase origins exhibited ‘microbiological’ resistance to meropenem.
2.3.8. Resistance exhibited by dominant Salmonella serovars
The detailed reporting of results at the serovar level clearly demonstrated the major contribution of a few serovars to the observed overall occurrence of resistance when considering aggregated data for Salmonella spp. The patterns of resistance associated with these different serovars have a marked influence on the overall resistance levels in Salmonella spp., as the proportion of completely susceptible and MDR isolates may vary significantly among particular serovars recovered from each of the carcase origins/food‐producing animal populations studied. The analysis of antimicrobial resistance at the serovar level is presented in Appendix C.
2.4. Comparing resistance in Salmonella from humans and food‐producing animals
A further comparison of human Salmonella data by serovar to that in food‐producing animals for the years 2018/2019 was performed and is detailed in Appendix D. Comparable AMR data are presented for serovars S. Typhimurium and its monophasic variant, S. Derby, S. Infantis, S. Enteritidis and S. Kentucky, and are discussed in this corresponding Appendix. The prevalence of particular Salmonella serovars within countries and animal populations, and their associated patterns of resistance, may explain some of the observed differences in the occurrence of antimicrobial resistance and multidrug resistance. The spread of resistant clones and the presence of resistance genes within these clones can be exacerbated by the use of antimicrobials in human and animal populations and the associated selective pressure. However, it should be noted that relating the occurrence of AMR in human Salmonella isolates to that in isolates from food/food‐producing animals is complicated because other sources of Salmonella occur.
2.5. Discussion
In 2019, information on AMR in Salmonella isolates from human clinical cases was reported by 24 MSs and two non‐MSs. This compares to 23 MSs and one non‐Ms in 2018. In 2019, 17 countries provided data as measured values (quantitative data), seven as data interpreted with clinical breakpoints and two as predicted phenotypic resistance based on whole genome sequencing. In July 2018, the Commission Implementing Decision 2018/945/EU ‘on the communicable diseases and related special health issues to be covered by epidemiological surveillance as well as relevant case definitions,’ came into force. The Decision stipulates mandatory testing and reporting of a representative subset of Salmonella isolates using methods and criteria specified in the EU protocol for harmonised monitoring of antimicrobial resistance in human Salmonella and Campylobacter isolates (ECDC, 2016). The Decision is expected to result in an increase in the number of reporting countries from 2019 onwards.
In 2018, 26 MSs and 2 non‐MSs reported AMR data on Salmonella isolates recovered from carcases of broilers and/or fattening turkeys, as well as data obtained from National Control Plan samples of broiler, laying hen and fattening turkey flocks. In 2019, 26 MSs and 1 non‐MS reported AMR data on Salmonella from carcases of pigs (fatteners) and/or calves (under 1 year of age), in some cases with additional data obtained from the monitoring of caecal contents of pigs and calves. The numbers of MSs reporting data in 2018 and 2019 increased for broilers, laying hens, turkeys and their derived carcases, as well as carcases of pigs compared with 2016 and 2017; while an equal number of MSs reported data on isolates from broiler carcases, pigs and calf carcases. Considering data on calves, the number of reporting MSs decreased from 7 MSs in 2017 to 3 MSs in 2019. MSs which have a very low prevalence or zero prevalence of Salmonella in certain sectors only contribute data in years when Salmonella is detected in those sectors and this may result in fluctuations to the numbers of contributing MSs.
2.5.1.
Occurrence of resistance to commonly used antimicrobials in veterinary medicine
Moderate to very high levels of resistance to ampicillin, sulfamethoxazole and tetracycline were generally reported by MSs among Salmonella isolates from the animal/carcase origins (with the exception of laying hens). Overall, high levels were also noted in isolates from humans. In 2019, the highest resistance to these antimicrobials was recorded in isolates recovered from pigs and their derived carcases; the lowest resistance was reported in isolates from calf carcases. Among isolates from pigs and calves, as well as their derived carcases, resistance to ampicillin was generally observed at similar or slightly lower levels to those of tetracycline and sulfamethoxazole. An overall lower level of MDR among isolates from laying hens in comparison to those reported from broilers and turkeys most likely reflects in part the predominance of S. Enteritidis, which accounted for 30.6% of Salmonella isolates recovered from laying hens and where 83.3% of S. Enteritidis isolates exhibited complete susceptibility. Additionally, only a limited number of antimicrobial compounds are authorised for the treatment of laying hens in many EU countries, and this factor may also be reflected in the generally lower AMR levels in Salmonella isolates from this sector.
In some animal species and derived carcases, Salmonella serovars occur which tend to show limited or no resistance, for example S. Enteritidis in layers (as described above) and S. Dublin in calves, although the potential for such serovars to develop resistance is exemplified by the occurrence of MDR S. Dublin reported in North America (Mangat et al., 2019). The occurrence of resistance in some successful clones belonging to certain serovars is related to the presence of underlying genetic structures. These structures may carry combinations of resistance genes which are genetically‐linked and account for the common patterns of resistance observed in such clones. Considering individual serovars, monophasic S. Typhimurium (which in Europe frequently displays resistance to ampicillin, streptomycin, sulfamethoxazole and tetracycline) generally showed the highest resistance to these compounds (excluding streptomycin, which is not monitored) across most of the animal/carcase origins. The same observation was also noted among isolates from human cases, where overall extremely high levels of resistance to these antimicrobials were reported in monophasic S. Typhimurium in 2019, as well as S. Kentucky in 2018. A recent study of monophasic S. Typhimurium isolates from human, food and animal sources in Italy, Germany and Switzerland showed that a resistance region from an IncH1 plasmid carrying the genes conferring resistance to ampicillin, streptomycin, sulfamethoxazole and tetracycline had inserted into the bacterial chromosome in the region encoding the phase 2 flagellar antigens, thereby accounting for both the typically observed pattern of resistance to these four antimicrobials and the monophasic property of the clone (Garcia et al., 2016).
Occurrence of resistance to ‘critically important antimicrobials’ (CIAs)
From the monitoring of poultry in 2018, the highest levels of resistance were generally noted to ciprofloxacin/nalidixic acid, sulfamethoxazole and tetracycline. An exception was sulfamethoxazole resistance among turkey carcases where overall resistance to ampicillin exceeded that of sulfamethoxazole. Considering individual serovars, S. Infantis and S. Kentucky generally showed the highest resistance to ciprofloxacin and nalidixic acid across the poultry origins. This likely reflects the spread of resistant clones belonging to these serovars. From human data reported in 2018, S. Infantis and S. Kentucky also showed the highest resistance to these substances. Resistance to ciprofloxacin/nalidixic acid, sulfamethoxazole and tetracycline is typical of a clone of S. Infantis which is prevalent in Europe in broilers (Nógrády et al., 2012) and S. Infantis is a serovar commonly reported in the monitoring by some countries. Within each of the carcase origins and animal populations, overall resistance to ciprofloxacin and nalidixic acid was generally very similar. However, Salmonella isolates exhibiting ciprofloxacin resistance and nalidixic acid susceptibility were also evident, possibly indicating the occurrence of plasmid‐mediated quinolone resistance (PMQR) mechanisms (qepA, oqxAB, aac(6′)Ib‐cr, qnr genes).
Resistance13 to third‐generation cephalosporins, cefotaxime and ceftazidime, in Salmonella isolates recovered from the carcases and animal populations monitored was either not discerned, or was generally detected at very low/low levels in most of the reporting MSs. Considering the total number of Salmonella isolates recovered from all carcase/animal origins, a low percentage (77/6,916, 1.1%) demonstrated third‐generation cephalosporin resistance and were further characterised. Notably, no Salmonella isolates recovered from turkey carcases, or calves or their derived carcases, exhibited resistance to third‐generation cephalosporins.
Further characterisation revealed the presence of isolates with an ESBL, AmpC or combined ESBL+AmpC phenotype. Particularly among poultry, the ESBL or AmpC phenotype was associated with multiple isolates belonging to certain serovars, suggesting the possible clonal expansion of particular strains: namely, S. Infantis, S. Kentucky, S. Bareilly and S. Bredeney. Among both broilers and turkeys, presumptive ESBL‐producing Salmonella were identified more frequently than presumptive AmpC‐producing Salmonella and encompassed a greater number of serovars. With the exception of one MS, presumptive ESBL, AmpC or ESBL+AmpC‐producers were identified at very low or low levels. Italy, however, reported the ESBL phenotype in 24.8% of Salmonella spp. from broilers and 26.5% of Salmonella spp. from turkeys; of which S. Infantis accounted for all isolates from broilers (n = 30) and more than half from turkeys (7/13). Additionally, some of these isolates also possessed an AmpC phenotype. The proportion of presumptive ESBL/AmpC‐producers attributed to this serovar within broilers and turkeys in Italy suggests clonal expansion and spread among these animal populations and the occurrence of an ESBL‐producing clone of S. Infantis has been previously described in broilers in Italy (Franco et al., 2015). The findings in poultry are interesting because there are no authorised products for use in the poultry sector in the EU which include third‐generation cephalosporins and off‐label use of third‐generation cephalosporins in poultry is not permitted (Franco et al., 2015). Further characterisation of the presumptive ESBL‐producing S. Infantis reported from broilers and turkeys in Italy revealed the presence of genes encoding CTX‐M enzymes, although type(s) were not specified.
Multiresistant S. Infantis has frequently been reported from food‐producing animals and humans in Europe. A recent German study analysed 30 S. Infantis isolates originating from broiler farms over the last two decades (García‐Soto et al., 2020). While all isolates obtained from the 1990s were resistant to only sulfamethoxazole (N = 12), the majority of isolates from the 2010s were multidrug resistant to sulfamethoxazole, ciprofloxacin, tetracycline, nalidixic acid, and tigecycline (15/18). Genomic analysis confirmed that the 15 MDR isolates from the 2010s – unlike isolates from the 1990s – carried a pESI‐like megaplasmid with resistance and virulence gene patterns as detected in the S. Infantis clone harbouring a pESI megaplasmid first described from Israel (Aviv et al., 2014 – see Appendix C for further details on MDR S. Infantis and the pESI megaplasmid). Genotypic analysis revealed two sequence types (STs) among isolates collected from the 2010s, ST2283 (n = 13) and ST32 (n = 2); while those from the 1990s belonged to ST32 (n = 10) and ST1032 (n = 2). Furthermore, an S. Infantis clone harbouring a pESI‐like megaplasmid and carrying the bla CTX‐M-1 gene (mediating cefotaxime resistance), as well as other resistance genes, has often been detected from broilers in Italy, as previously mentioned (Franco et al., 2015).
From the monitoring of human S. Infantis cases in 2018, only Italy reported the ESBL bla CTX‐M-1; while in 2019, three countries (Denmark, Germany and Italy) reported Infantis with this ESBL. It is noteworthy that an S. Infantis clone carrying the ESBL gene bla CTX‐M-65 has been reported in the United States (Tate et al., 2017), as well as Switzerland (Hindermann et al., 2017). In the US, this Infantis clone with CTX‐M‐65has been associated with travel to South America (Tate et al., 2017; Brown et al., 2018). In 2019, six countries (Denmark, Germany, the Netherlands, Norway, Spain and Sweden) together reported 11 domestically acquired human cases of S. Infantis with bla CTX‐M-65, four with unknown travel and two related to travel. Both of the travel‐related cases had visited Vietnam. The spread of S. Infantis harbouring the pESI‐like megaplasmid appears to account for the parallel global evolution of multiple strains of MDR S. Infantis, which possess certain common characteristics associated with the pESI‐like megaplasmid, but which also reflect the ability of this plasmid to acquire different antimicrobial resistance genes (Aviv et al., 2014; Franco et al., 2015).
Considering the 2019 monitoring in food‐producing animals, the ESBL or AmpC phenotype was detected in four serovars among porcine isolates: namely, S. Derby, S. Heidelberg, S. Rissen and monophasic S. Typhimurium. Among isolates from pig carcases, three displayed an ESBL phenotype (one S. Derby from Romania and two monophasic S. Typhimurium from Italy), and two displayed an AmpC phenotype (a monophasic S. Typhimurium from Czechia and S. Heidelberg from the Netherlands; the latter genotypically confirmed to possess bla CMY‐2 and displaying ‘microbiological’ resistance to fluoroquinolones). Interestingly, a recent Dutch study detected bla CMY‐2, as well as ciprofloxacin resistance, among isolates of S. Heidelberg originating from imported broiler meat from South America (van den Berg et al., 2019). bla CMY‐2 is also the dominant beta‐lactamase gene in S. Heidelberg in Canada (Carson et al., 2019). In pigs, a single isolate displayed an ESBL phenotype (a monophasic S. Typhimurium from Italy reported with an SHV family enzyme, type not specified) and two displayed an AmpC phenotype (single isolates of S. Rissen and monophasic S. Typhimurium from Italy).
From human Salmonella cases reported in the EU/EEA, presumptive ESBL‐producing Salmonella were identified in 0.8% of the tested isolates in 2019, with the highest occurrence in Malta (2.7%). The AmpC phenotype was less frequent (0.1%) and only five isolates were identified with a combined AmpC‐ and ESBL phenotype. AmpC‐type β‐lactamases were reported in ten different serovars; most commonly in S. Bardo, S. Chincol and S. Heidelberg (ranging between 6.3% and 100%), although the high proportions observed were most likely an effect of the few isolates tested (N = 1–16). Of the 23 serovars reported with an ESBL phenotype from humans in 2019, this was most commonly found in S. Anatum, S. Infantis, S. Haifa, S. Kentucky, S. Schwarzengrund and S. Uganda (ranging between 4.5% and 8.3%). The proportion of S. Kentucky with an ESBL phenotype decreased from 20.3% in 2017 to 5.6% in 2019, with four countries (Germany, France, Malta and the Netherlands) reporting presumptive ESBL‐producing S. Kentucky in 2019. The introduction and spread of S. Kentucky with bla CTX‐M-14b in Europe has recently been described by Coipan et al. (2020). During this study, conducted over the period 2013‐2018, 78 human cases of S. Kentucky harbouring the bla CTX‐M-14b gene (as well as displaying gyrA and parC mutations associated with ciprofloxacin resistance) were identified in eight European countries (comprising the United Kingdom, Malta, the Netherlands, Germany, Belgium, Denmark, Norway and Ireland). The authors comment that compared to other S. Kentucky and non‐typhoidal Salmonella infections, these cases were more likely to occur in the elderly and to present with urinary‐tract infections. Geographical analyses indicated that this clone originated from North Africa (most likely Egypt) in 2005 with multiple introductions into Europe, where this clone may now be established. Furthermore, this study represents the first report of a chromosomally integrated bla CTX‐M-14b gene within human S. Kentucky isolates originating from Europe; previous investigations have identified similar genes on plasmids (Coipan et al., 2020). Notably, it would appear that S. Kentucky isolates harbouring this ESBL gene, originating from food‐producing animals, have not been described in Europe.
Third‐generation cephalosporins and fluoroquinolones are highest priority CIAs for the treatment of human invasive salmonellosis (WHO, 2019). This sets the rationale for monitoring combined resistance to these antimicrobial classes within food‐producing animals. No Salmonella isolates recovered from turkey carcases, or calves and their derived carcases, displayed combined resistance 1 to cefotaxime and ciprofloxacin; while in the other animal/carcase origins, combined resistance to these antimicrobial classes was detected at overall very low or low levels. Notably, where cefotaxime and ciprofloxacin MICs were interpreted using clinical breakpoints (CBPs), only a single isolate recovered from a broiler carcase by Portugal (S. Paratyphi B var. Java), five isolates recovered from broilers by Malta and the Netherlands (all S. Kentucky) and a single isolate recovered from laying hens by Hungary (S. Kentucky) exhibited ‘clinical’ resistance to these compounds. From human cases in 2019, combined resistance to cefotaxime and ciprofloxacin was very low overall but significantly higher in S. Infantis and S. Kentucky with particularly high proportions among S. Infantis isolates from Italy and S. Kentucky isolates from the Netherlands (Malta reported data on less than ten S. Kentucky isolates, therefore the proportion of combined resistance was not calculated). The emergence of a clonal lineage of MDR S. Infantis in broilers in Italy carrying the ESBL gene bla CTX‐M-1 and displaying resistance to tetracycline, sulfamethoxazole and trimethoprim, together with microbiological resistance to ciprofloxacin has already been noted (Franco et al. 2015).
From the monitoring of poultry in 2018, colistin resistance was generally observed in S. Enteritidis isolates. This serovar accounted for 33.3%, 63.2% and 89.6% of the colistin‐resistant isolates recovered from broiler carcases, broilers and laying hens, respectively. Considering the monitoring performed in 2019, all of the colistin‐resistant isolates reported from calves (n = 2) and six of the colistin‐resistant isolates from calf carcases (n = 16) were serotyped as S. Dublin. Both S. Enteritidis and S. Dublin are group D salmonellas (serogroup O9). This group tends to show decreased susceptibility to colistin without having any known acquired or mutational colistin resistance mechanisms and, therefore, show a degree of intrinsic resistance to colistin probably through the properties conferred by the group D O‐antigen epitopes (Agersø et al., 2012; Ricci et al., 2020). Considering other serovars, colistin‐resistance was most frequently reported among S. Newport in turkeys (33.5%), S. Hadar in turkey carcases (55.6%) and monophasic S. Typhimurium in pig carcases (50%). Only three colistin‐resistant isolates were reported from pigs, of which one was S. Typhimurium and one its monophasic variant. A variety of different serovars from pig and calf carcases displayed colistin resistance, including three S. Derby isolates from pig carcases. In an Italian study, Carnevali et al. (2016) detected mcr‐1 in a number of Salmonella serovars, of which monophasic S. Typhimurium was the most frequent (isolates from pigs, pork and man) and S. Derby was the second most frequently found (isolates from pigs). Further molecular characterisation of colistin‐resistant isolates obtained from the EU AMR monitoring, to determine the underlying genetic mechanisms, would assist in identifying the emergence and dissemination of colistin‐resistant Salmonella clones and also identify transferable colistin resistance occurring in Salmonella associated with livestock.
Where tigecycline resistance was reported among the carcase/animal origins, most isolates displayed MICs just above the epidemiological cut‐off, with only a small proportion of isolates displaying ‘clinical’ resistance. Certain serovars displayed ‘microbiological’ resistance to this antimicrobial, which may suggest clonal expansion of microbiologically resistant strains belonging to these serovars. Considering poultry, S. Infantis accounted for most of the tigecycline‐resistant isolates recovered from broilers and their derived carcases, as well as all three of the resistant isolates reported from laying hens. S. Bredeney accounted for most of the tigecycline‐resistant isolates recovered from turkeys, as well as both of the resistant isolates recovered from turkey carcases. Considering the monitoring performed in 2019, S. Typhimurium accounted for 40% of the tigecycline‐resistant isolates recovered from pig carcases (n = 10); while S. Derby accounted for all three of the resistant isolates reported from calf carcases. Multidrug resistance was often a feature of tigecycline‐resistant isolates. Determining the susceptibility to tigecycline is not straightforward as this compound can be inactivated by oxidation and exposure to light, which may lead to falsely‐elevated MIC values. Upregulation of normal cell pathways or processes may also contribute to the occurrence of elevated tigecycline MIC values at levels above the ECOFF in Enterobacteriaceae (He et al., 2016). Two transferable plasmid‐mediated tigecycline resistance genes, tet(X3) and tet(X4), conferring higher levels of tigecycline resistance (MICs of ≥ 16 mg/L), have recently been reported in numerous Enterobacteriaceae from animals and meat (chicken and pork) in China (He et al., 2019; Bai et al., 2019). The potential for Salmonella to acquire such transferable tigecycline resistance genes is therefore highlighted, and the importance of monitoring tigecycline resistance through determination of MICs or by molecular investigation such as WGS is further underlined. Considering serovars in which markedly elevated tigecycline MICs were observed from the monitoring of food‐producing animals and their derived carcases, a single S. Typhimurium isolate exhibiting a tigecycline MIC of 8 mg/L was reported from a pig carcase by the Netherlands in 2019.
High‐level resistance to ciprofloxacin
High‐level resistance to ciprofloxacin (MIC ≥ 4 mg/L) was not detected among Salmonella isolates from pigs or calves, or calf carcases, but was observed among isolates from poultry and in a single isolate from a pig carcase (see Appendix A). Considering the total number of Salmonella isolates monitored from the different types of poultry by MSs in 2018, as well as pig carcases in 2019, high‐level resistance to this compound ranged from 0.1% in pig carcases to 6.6% in turkeys. While many serovars (including Infantis) were noted to exhibit resistance by this definition among poultry, S. Kentucky accounted for most of the Salmonella isolates recovered from the poultry origins and pig carcases which exhibited ciprofloxacin MICs of ≥ 4 mg/L. The same finding was also noted among isolates from human cases in 2018, where high‐level ciprofloxacin resistance was most commonly found in S. Kentucky. S. Kentucky isolates exhibiting high‐level ciprofloxacin resistance are likely to belong to the multilocus sequence type (ST) 198 clone, which has shown epidemic spread in North Africa and the Middle East (Le Hello et al., 2011, 2013). Notably in 2018, the occurrence of this serovar exhibiting high‐level resistance was observed by many MSs from most parts of Europe, suggesting further clonal expansion (S. Kentucky ST198‐X1) within poultry populations. Furthermore, a very high proportion of the poultry/pig S. Kentucky isolates displaying ciprofloxacin MICs of ≥4 mg/L were also multiresistant, primarily showing resistance to ampicillin, gentamicin, nalidixic acid, sulfamethoxazole and tetracycline. The same observation was also noted among S. Kentucky isolates from human cases in 2018.
Carbapenem resistance
In both 2018 and 2019, no Salmonella spp. recovered from any of the carcase/animal origins were ‘microbiologically’ resistant to meropenem. In humans, however, meropenem resistance was detected via phenotypic screening in a single Salmonella isolate in 2019. This was a S. Typhimurium var. O5‐ carrying bla OXA‐48 isolated from a domestically acquired infection in Spain.
Prevalence of particular Salmonella serovars and associated MDR patterns
In summary, the prevalence of particular Salmonella serovars within countries and animal populations, and their associated patterns of resistance, are likely to explain many of the observed differences in the overall levels of antimicrobial resistance and multidrug resistance. The spread of resistant clones and the occurrence of resistance genes within these clones can be exacerbated by the use of antimicrobials in human and animal populations and the associated selective pressure. A more detailed analysis of antimicrobial resistance at the serovar level, including possible underlying genetic structures responsible for resistance, is presented in Appendix C. Within a given MS, any attempt to relate the occurrence of AMR in human Salmonella isolates to that in isolates from food/food‐producing animals is complicated (see Appendix D), as much of the food consumed in a MS may have originated from other MSs or non‐member countries and foods other than those derived from animals can also sometimes provide a source of human Salmonella infection. Salmonella infections can also be associated with foreign travel, other types of animal contact (such as pets, including reptiles) or the environment. Additionally, some human infections may result from human to human transmission. To improve investigation of these relationships, human isolates from cases notified as having been acquired during travel outside of the reporting country were excluded from the analysis.
3. Antimicrobial resistance in Campylobacter spp.14
3.1. Data on AMR in Campylobacter spp. addressed
In the framework of Commission Implementing Decision 2013/652/EU, the monitoring of AMR in Campylobacter spp. from food‐producing animals and food is focused15 on the species C. jejuni and C. coli. While the biennial monitoring and reporting of AMR in C. jejuni isolates recovered from caecal samples of broilers and fattening turkeys is mandatory (even years from 2014 to 2020), the monitoring of AMR in C. coli isolates recovered from food‐producing animals is performed on a voluntary basis. The main species responsible for human infections is C. jejuni, which is usually predominant in poultry, followed by C. coli (Jehanne et al., 2020) which is also frequently found in poultry, sometimes at higher rates than C. jejuni (Pergola et al., 2017), and in pigs. C. coli is more often resistant than C. jejuni to several important antimicrobials and may contain and transfer resistance genes to C. jejuni. Thus, MSs are encouraged to monitor AMR levels in C. coli.
Food‐producing animals are considered to be a major source of human campylobacteriosis through contamination of food products. However, wild birds, pets and environmental water may also play a role as potential modes of transmission (More et al., 2017; Szczepanska et al., 2017; EFSA et al., 2019).
While the monitoring of AMR in Campylobacter jejuni isolates recovered from caecal samples of broilers and fattening turkeys at slaughter was mandatory in 2018, the monitoring of AMR in Campylobacter isolates recovered from caecal samples of fattening pigs and calves (under 1 year of age) at slaughter was performed on a voluntary basis during 2019. However too few C. jejuni from pigs were reported, confirming the low prevalence of this species in pigs (Rossler et al., 2019), so they will not be included in this report. In addition, the voluntary monitoring of AMR in Campylobacter isolates recovered from meat samples (of broilers, turkeys, bovine and pigs) at retail, as well as C. coli isolates recovered from caecal samples of broilers and turkeys was performed by some MSs in 2018 and 2019.
In both 2018 and 2019, data for C. jejuni and C. coli from human cases were also reported. Only data for 2019 from humans are presented below as the 2018 data has been presented in the EU Summary report for 2017/2018 (EFSA and ECDC, 2020).
3.2. Occurrence of antimicrobial resistance in humans
3.2.1. Data reported
For 2019, 19 MSs and two non‐MS reported data on AMR in Campylobacter isolates from human cases of campylobacteriosis. Thirteen countries provided data as measured values (quantitative data) and eight as data interpreted with clinical breakpoints. Not all countries reported results for all antimicrobials in the harmonised panel (ECDC, 2016). The reported data represented 23.9% and 24.2% of the confirmed human cases with Campylobacter jejuni and Campylobacter coli, respectively, reported in the EU/EEA in 2019.
3.2.2. Occurrence of resistance
Occurrence of resistance
In 2019, very high to extremely high resistance levels to ciprofloxacin were reported in human Campylobacter jejuni isolates from all reporting countries with the exception of Bulgaria, Iceland, Norway and the United Kingdom, where high levels were reported (Figure 13 and Annex C, Table 1). For C. coli, 10 out of 14 countries reporting more than 10 isolates had levels of ciprofloxacin resistance of > 70–96.1% (Annex C, Table 2). The ciprofloxacin resistance at EU level was 61.5% and 61.2% for C. jejuni and C. coli, respectively. The proportion of human C. jejuni isolates resistant to erythromycin was low overall at 1.5% but markedly higher in C. coli, 12.9%, with high proportions (22.7–27.3%) of C. coli being resistant in 4 MSs and an extremely high proportion (73.1%) in one MS (Portugal). High (47.2%) and very high (66.9%) proportions of resistance to tetracycline were observed in C. jejuni and C. coli, respectively. Countries reported low resistance levels to gentamicin except Italy for C. coli (18.8%). Similarly, low levels of resistance were observed to co‐amoxiclav with some exceptions (Annex C, Tables 1 and 2).
Figure 13.

Occurrence of resistance to selected antimicrobials in C. jejuni and C. coli isolates from humans, 2019
Combined resistance to both ciprofloxacin and erythromycin, which are considered critically important for treatment of campylobacteriosis, was generally low (1.0%) in C. jejuni and moderate (10.4%) in C. coli for 2019 (Figure 13). The highest levels of combined resistance in C. jejuni was observed in Portugal (4.3%) and in C. coli, Estonia, Finland, Italy and the Netherlands reported high levels (> 20%) of combined resistance, and Portugal reported extremely high levels (> 70%) (Figure 14 and Annex C, Tables 3 and 4).
Figure 14.

- Note: For Finland, travel information was missing from the AMR data while from the case surveillance data, travel‐associated cases were known to account for 78% of Finnish Campylobacter infections in 2019.
Multidrug resistance (MDR) in isolates tested for four antimicrobial classes (fluoroquinolones, macrolides, tetracyclines and aminoglycosides) was overall low in C. jejuni but moderate in C. coli (Figure 15 and Annex C, Tables 5 and 6). The most common resistance pattern in both C. jejuni and C. coli was resistance to both ciprofloxacin and tetracycline, observed in 40.3% of C. jejuni isolates and 46.8% of C. coli isolates. The second most common pattern in C. jejuni (in 30.7% of isolates) was complete susceptibility to the four antimicrobial classes in the harmonised panel while in C. coli it was tetracycline resistance alone (19.0%).
Figure 15.

- N: Total number of isolates reported.
Temporal trends were analysed for countries reporting data for at least 3 years over the 5‐year period 2015–2019. Statistically significant (p < 0.05) increasing trends of fluoroquinolone resistance were observed in C. jejuni in eight MSs and one non‐MS and in C. coli in two, while a decreasing trend was observed in one MS in C. jejuni and three MSs in C. coli (Table 5). Similarly, tetracycline resistance increased significantly in six MS for C. jejuni and in two for C. coli, while four MSs observed a decrease in C. jejuni in the same period. Erythromycin resistance, on the other hand, decreased in four MSs and one non‐MS for C. jejuni and increased in one MS, while for C. coli, one MS observed a decreasing trend and two MSs reported an increasing trend. For country‐specific trend graphs, please see Annex C, Figures 1 and 2.
Table 5.
Number of countries with significantly increasing or decreasing trends in resistance to selected antimicrobials for Campylobacter jejuni and C. coli in humans, 2015–2019
| Species | Ciprofloxacin | Erythromycin | Tetracycline | |||
|---|---|---|---|---|---|---|
| Incr. | Decr. | Incr. | Decr. | Incr. | Decr. | |
| C. jejuni (18 MS+2 non‐MS) | 9 (DK, FI, IS, LT, MT, NL, SI, SK, UK) | 1 (FR) | 1 (SK) | 5 (DK, FI, LT, NO, UK) | 6 (AT, DK, LU, NL, SK, UK) | 4 (EE, FR, IT, LT) |
| C. coli (15 MSs) | 2 (NL, SK) | 3 (IT, LU, UK) | 2 (NL, PT) | 1 (ES) | 2 (FR, SK) | – |
High‐level resistance to erythromycin (MIC > 128 mg/L) was assessed as a possible indication for transferrable erythromycin resistance due to the presence of the erm(B) gene. In C. jejuni, 1.0% of the isolates (N = 2,185, 6 MSs) had MIC > 128 mg/L while in C. coli this proportion was higher, 9.1% (N = 287, 5 MSs) (Figure 16). Similarly, in 1.1% (N = 3,709, 7 MSs) of C. jejuni and 19.5% (N = 446, 7 MSs) of C. coli tested with disk diffusion no inhibition zone could be observed (6 mm zone equals the disk size), which corresponds to a MIC of ≥ 128 mg/L (EUCAST, 2020).
Figure 16.

Erythromycin MIC distribution in C. jejuni and C. coli isolates from humans, 2019
3.3. Occurrence of antimicrobial resistance in food‐producing animals, and meat thereof
3.3.1. Data reported
In 2018, 25 MSs and 4 non‐MSs reported mandatory data on C. jejuni isolates recovered from caecal samples of broilers, and 10 MS and 1 non‐MS reported data on C. jejuni isolates recovered from caecal samples of fattening turkeys (Annex C: Table 7). Additionally, some countries voluntary reported data on C. coli isolates recovered from caecal samples of broilers and fattening turkeys, and derived meat (Annex C: Tables 7, 12 and 13).
In 2019, four MSs (Croatia, Czechia, Finland and the Netherlands) voluntary reported data on C. jejuni isolates recovered from caecal samples of broilers (N = 501) and two MSs (Czechia and the Netherlands) also reported data on C. coli from caecal samples of broilers (N = 201) (Annex C: Table 7). These AMR monitoring data on Campylobacter in broilers are not included in the analysis of the present report, as the numbers of reporting MSs and/or of isolates are much lower than those reported in the context of routine 2018 AMR monitoring (Decision 2013/652/EU), and the results are globally similar to those of 2018. No AMR data on Campylobacter from turkeys have been reported in 2019. In the present report the 2018 resistance data on Campylobacter from poultry are considered for the comparison with the AMR data on Campylobacter isolates from pigs and calves reported in 2019. Although not shown in this chapter, the reported 2019 antimicrobial resistance data on Campylobacter isolates from poultry are presented in the summary tables available in zenodo ( https://doi.org/10.5281/zenodo.4557180).
Resistance data concerning meat samples of broilers reported in 2019 included 70 C. jejuni isolates of meat from broiler carcases from five MSs (Croatia, Luxembourg, The Netherlands, Portugal, Romania), 398 C. jejuni isolates from fresh broiler meat from six MSs (Austria, Belgium, Denmark, Luxembourg, the Netherlands, Portugal) and 53 C. jejuni isolates from broiler meat preparations from three MSs (Belgium, Luxembourg, The Netherlands) (Table 6). Only few resistance data were reported in 2019 on Campylobacter from turkey meat and are not presented in this report.
Table 6.
Occurrence of resistance (%) to selected antimicrobials in indicator Campylobacter jejuni from carcases, fresh meat and meat preparation from broilers, using harmonised ECOFFs, 8 EU MSs, 2019
| Categories | Number isolates | Reporting countries (N) | GEN | STR | NAL | CIP | ERY | TET |
|---|---|---|---|---|---|---|---|---|
| Broiler carcases | 70 | HR, LU, NL, PT, RO (5) | 0 | 7.1 | 88.6 | 90.0 | 0 | 42.9 |
| Fresh broiler meat | 398 | AT, BE, DK, LU, NL, PT (6) | 0 | 8.3 | 67.6 | 68.6 | 0.3 | 44.0 |
| Broiler meat preparations | 53 | BE, LU, NL (3) | 0 | 15.1 | 64.2 | 64.2 | 0 | 52.8 |
In 2019, eight MSs (Czechia, Estonia, Germany, Ireland, Luxembourg, Slovenia, Spain and Sweden) and three non‐MSs (Norway, Republic of North Macedonia and Switzerland) voluntarily reported AMR monitoring data on C. coli isolates recovered from caecal samples of fattening pigs (N = 1,655), and two MSs (Germany and Spain) reported other AMR monitoring data on C. coli from caecal samples of calves (N = 67). Four MSs (Denmark, Germany, Italy and Spain) reported other AMR monitoring data on C. jejuni from caecal samples of calves (N = 498). In addition, 14 isolates of C. jejuni from pigs were reported by three MS (Czechia, Germany and Spain), but the number was too low and not considered in the analysis.
The overview of the data reported in 2018 and 2019 is presented in Table 7 of Annex C. Additionally, in 2019 some countries voluntary reported data on isolates from non‐legislative categories including animals, milk, meat and vegetables (Annex C: Tables 8 and 9).
Resistance data concerning food‐producing animals and meat thereof reported in 2018 and 2019 are presented in the following sections when more than 50 isolates originating from at least two MSs had been reported (unless differently stated in the text, i.e. data used for trend analysis). Annex C is available as supporting documentation in zenodo ( https://doi.org/10.5281/zenodo.4557180).
3.3.2. Campylobacter from meat samples of broilers
The highest levels of resistance in broiler meat were noted for ciprofloxacin and nalidixic acid (overall percentages: 64–90%) and for tetracycline (overall percentages: 43–53%) considering the 521 isolates from all eight reporting MSs (Table 6). Generally, most MSs reported high to extremely high levels of resistance to these antimicrobials in Campylobacter isolates. Resistance to gentamicin in C. jejuni isolates recovered from poultry meat was not observed and resistance to erythromycin was detected in only one isolate from fresh meat. Resistance to streptomycin was globally observed at low levels in C. jejuni isolates from carcases and fresh meat, and at a moderate level in meat preparations.
3.3.3. Campylobacter from poultry, pigs and calves
Occurrence of resistance
Comparison of resistance levels between bacterial and animal species should be interpreted cautiously because of the dispersion of resistance rates between countries and because numbers of isolates and reporting countries vary, particularly for voluntary reporting.
Data on the occurrence of resistance in Campylobacter species from poultry, pigs and cattle are presented in Table 7 and Figure 17 (the detailed country‐level information on the occurrence of resistance is presented in Annex C, Tables 10–16).
Table 7.
Occurrence of resistance (%) to selected antimicrobials in Campylobacter coli and C. jejuni from broilers, turkeys, from cattle and pigs, using harmonised ECOFFs, 28 EU MSs, 2018 and 2019
| Animal category | Reporting year | No. isolates | Reporting countries (N) | GEN | STR | NAL | CIP | ERY | TET | CIP/ERY |
|---|---|---|---|---|---|---|---|---|---|---|
| Broilers | ||||||||||
| – C. coli | 2018 | 339 | AT, CZ, EE, ES NL, SI (6) | 2.1 | 15.6 | 86.7 | 86.7 | 6.5 | 61.4 | 6.5 |
| – C. jejuni | 2018 | 3,519 | All MS, except BE, LU, MT (25) | 0.3 | 8.7 | 70.5 | 73.5 | 1.3 | 55.4 | 1.2 |
| Turkey | ||||||||||
| – C. coli | 2018 | 302 | AT, DE, ES (3) | 1.3 | 18.9 | 89.4 | 89.4 | 16.9 | 91.1 | 16.6 |
| – C. jejuni | 2018 | 1,174 | AT, DE, ES, FR, HU, IT, PL, PT, TO, UK (10) | 0.1 | 6.4 | 66 | 71 | 1.1 | 56 | 1 |
| Cattle | ||||||||||
| – C. coli | 2019 | 67 | DE, ES (2) | 10.45 | 65.7 | 80.6 | 80.6 | 23.9 | 94.0 | 22.4 |
| – C. jejuni | 2019 | 498 | DK, DE, IT, ES (4) | 2.21 | 14.1 | 56.0 | 56.8 | 0 | 65.3 | 0 |
| Pigs | ||||||||||
| – C. coli | 2019 | 1,174 | CZ, DE, EE, ES, IE, LU, SI, SE (8) | 1.8 | 70.0 | 51.9 | 52.4 | 11.2 | 62.8 | 8 |
Figure 17.

- GEN: gentamicin, STR: streptomycin, TET: tetracycline CIP: ciprofloxacin, ERY: erythromycin, CIP/ERY: combined ‘microbiological’ resistance to ciprofloxacin and erythromycin. N: Total number of isolates reported by all Member States (MSs). Blue diamond: EU level.
Generally, tetracycline resistance ranged from high to extremely high in each of the animal species considered; overall, the highest level of resistance was noted in C. coli isolates recovered from cattle (94.0%, for 2 MSs only) and turkeys (91.1%, for 3 MSs), the overall levels of the other categories (C. jejuni from poultry and calves and C. coli from broilers and pigs) ranged from 55% to 65%. The highest levels of resistance to streptomycin were noted in C. coli isolates recovered from fattening pigs and calves (overall, 70.0% and 65.7%, respectively), whereas moderate levels were obtained for C. coli from broilers (15.6%) and C. jejuni from calves (14.1%) and the overall occurrence was lower than 10% in C. jejuni from poultry.
Resistance to gentamicin in Campylobacter isolates from these food‐producing animals was detected at very low levels in C. jejuni from broilers and turkeys. The overall levels were around 2% for C. jejuni from cattle and C. coli from pigs and broilers, and reached 10.5% for C. coli from cattle in the two MSs reporting for this category.
Overall resistance to ciprofloxacin and nalidixic acid was very high to extremely high in C. coli and C. jejuni isolates from broilers and turkeys and in C. coli from cattle (from 66.0% for nalidixic resistance in C. jejuni from turkeys to 86.7% for nalidixic acid and ciprofloxacin resistance of C. coli from broilers). Resistance levels to these antimicrobials were generally lower in C. coli isolates recovered from fattening pigs (52.4% for ciprofloxacin and 51.9% for nalidixic acid) and C. jejuni from calves (56.8% for ciprofloxacin and 56.0% for nalidixic acid).
Among C. jejuni from poultry and calves, erythromycin resistance was either not discerned (C. jejuni from cattle, 4 MSs) or detected at low levels by most reporting MSs (overall, 1.1% and 1.3% in turkeys and broilers, respectively). Generally, erythromycin resistance was observed at higher levels in C. coli isolates recovered from calves (overall, 23.9%), followed by turkeys (overall, 16.9%), fattening pigs (overall, 11.2%) and broilers (overall, 6.5%).
3.3.4. Combined resistance to ciprofloxacin and erythromycin
The occurrence of Campylobacter isolates displaying combined resistance to ciprofloxacin and erythromycin is of great importance to public health, since both compounds are recognised as critically important antimicrobials (CIA) for the treatment of Campylobacter infections in humans (WHO, 2019).
Overall combined resistance to these antimicrobials was detected in 22.4% of C. coli from calves (15/67), 8.0% of C. coli from pigs (94/1,174), 6.5% of C. coli isolates from broilers (22/339), 1.2% of C. jejuni isolates from broilers (42/3,519), 1.0% of C. jejuni isolates from turkeys (12/1,174) and 0% in C. jejuni isolates from calves (0/498).
Combined resistance to both ciprofloxacin and erythromycin in C. jejuni from broilers was detected in 6 out of 25 reporting MSs in 2018 and assessed at 1.2% (42/3519) in all reporting EU MSs (Figure 18a). Among those countries recording combined resistance to ciprofloxacin and erythromycin in C. jejuni from broilers, two groups can be observed: first, Bulgaria, Italy and Portugal, registering a combined resistance of 5.3%, 5.3% and 16.4%, respectively, and second, three MSs and 1 non‐MS (Czechia, Germany, Romania and Switzerland), reporting a combined resistance lower than 1.5%. Among the six MSs (Austria, Czechia, Estonia, the Netherlands, Slovenia and Spain) reporting on resistance in C. coli from broilers for 2018 on a voluntary basis (overall 339 isolates), four MSs (Austria, the Czechia, the Netherlands and Spain) reported combined resistance to both ciprofloxacin and erythromycin, at levels starting from 1.2% (Austria) to 14.3% (Spain) (Figure 19a). Where comparison of the levels of combined resistance to both ciprofloxacin and erythromycin is possible between C. jejuni and C. coli isolates from broilers, the levels in C. coli are greater than those observed in C. jejuni in Czechia, the Netherlands and Spain (these last two MSs reported no co‐resistance in C. jejuni isolates in 2018).
Figure 18.

Spatial distribution of combined resistance to ciprofloxacin and erythromycin in Campylobacter jejuni isolates from (a) broilers (29 EU/EEA MSs, 2018); (b) fattening turkeys (11 EU/EEA MSs, 2018)
Figure 19.

Spatial distribution of combined resistance to ciprofloxacin and erythromycin in Campylobacter coli isolates from (a) broilers (6 EU/EEA MSs, 2018); (b) fattening pigs (11 EU/EEA MSs, 2019)
Out of 10 reporting MSs in 2018, combined resistance to both ciprofloxacin and erythromycin in C. jejuni from fattening turkeys was detected in Spain, Italy and Portugal with resistance in 0.9%, 2.9% and 23.1% of the isolates tested, respectively (Figure 18b). The overall occurrence of combined resistance to ciprofloxacin and erythromycin in C. jejuni was 1.0%, when considering all reporting MSs.
Considering the four MS reporting data for a total of 498 C. jejuni from calves in 2019, no C. jejuni isolate was found to be resistant to the two important therapeutic compounds, erythromycin and ciprofloxacin. However, for C. coli isolated from calves, eight isolates from Germany (8/46, 17.4%) and seven isolates from Spain (7/21, 33.3%) were resistant to ciprofloxacin and erythromycin, Germany and Spain being the only two MSs reporting on C. coli from calves.
Considering the eight MSs and three non‐MSs reporting data on C. coli from pigs in 2019, 100 isolates out of 1655 (6.04%) had combined resistance to both ciprofloxacin and erythromycin, the highest rate being in Spain (57/119, 47.1%) (Figure 19b).
Maps (Figures 18 and 19) are presented only if data are reported by at least five countries.
Detailed data on combined resistance to ciprofloxacin and erythromycin in C. jejuni and C. coli isolates from food‐producing animals are presented in Annex C (Tables 17–22).
3.3.5. Complete susceptibility and multidrug resistance in reporting countries
Considering complete susceptibility to the four antimicrobial classes (ciprofloxacin/nalidixic acid, erythromycin, tetracycline and gentamicin), the highest proportions of isolates displaying complete susceptibility were noted among C. coli from pigs (8 MSs only, overall 21.21%; 8 MSs and 3 non‐MSs, overall 30.63%, ranging from 0% (0/119) in Spain, to 84.34% (210/249) in Norway) and C. jejuni from calves (4 MSs, overall 24.70%, ranging for 1.89% (2/106) in Italy to 73.68% (84/114) in Denmark). The proportions were in the same range for C. jejuni isolates from broilers and turkeys (21.3% and 21.6%, respectively) and below 10% for C. coli isolates from broilers (7.1%, 6 MS) and C. coli isolates from calves (1.49%, 2 MSs). Among poultry isolates, complete susceptibility was generally noted at slightly higher levels in C. jejuni isolates compared to those in C. coli isolates. Marked differences could be detected between countries with, for example percentages of complete susceptibility in C. jejuni from broilers ranging from < 5% in Cyprus, Latvia, Portugal and Lithuania to > 70% in Finland, Sweden, Iceland and Norway.
The complete susceptibility to the targeted antimicrobial classes and the levels of MDR, defined as resistance to three or more antimicrobial classes of the harmonised panel tested (ciprofloxacin, nalidixic acid, erythromycin, gentamicin, tetracycline), among Campylobacter isolates recovered from these food‐producing animals by MSs and non‐MSs is shown in Figure 20.
Figure 20.

- N: Total number of isolates reported by the EU MSs. Complete susceptibility is defined as susceptibility to ciprofloxacin/nalidixic acid, erythromycin, gentamicin and tetracycline. MDR is defined as resistance to at least three antimicrobial substances (panel of antimicrobial tested: ciprofloxacin, nalidixic acid, erythromycin, gentamicin, tetracycline).
Overall, MDR was observed at low levels in C. jejuni isolates recovered from calves (1.4%), broilers (1.3%) and fattening turkeys (1.2%). MDR was observed in around 7.8% of the C. coli isolates recovered from fattening pigs in 8 MS (5.9% if data from all 11 reporting countries, also including 3 non‐MS, were considered; ranging from 0% in Estonia, Sweden and Norway to 48.7% in Spain). MDR at level of 8.0% was also observed in C. coli isolates from broilers in 2018. The highest level of MDR was observed in C. coli recovered from calves (26.9%) for the two reporting MS (Germany and Spain).
Detailed data on complete susceptibility and MDR in C. jejuni and C. coli isolates from food‐producing animals are presented in Annex C (Tables 17–22).
3.3.6. Temporal trends
3.3.6.1. Temporal trends in resistance in C. jejuni and C. coli from broilers
Temporal trends in resistance in C. jejuni from broilers over the period 2009 to 2019 was analysed for 25 reporting EU MSs and 2 non‐MS (see Figure 21 and Table 8; see also Annex C, Table 23). Evaluation of temporal trends in resistance was performed only for countries who reported data for at least 3 years (three data points). A significant increase in resistance to ciprofloxacin was reported in 11 MSs (Austria, Croatia, Cyprus, Czechia, Denmark, Finland, France, Germany, the Netherlands, Romania and Sweden) and one non‐MS (Switzerland). An increase in resistance was also detected for streptomycin in nine MSs, and for tetracycline in 13 MSs and one non‐MS. A decrease in resistance was detected in erythromycin, streptomycin and tetracycline in five, seven and four MSs, respectively.
Figure 21.

- CIP: ciprofloxacin; ERY: erythromycin; STR: streptomycin; TET: tetracycline. Arrows indicate significant increasing (up) or decreasing (down) significant trend over the entire period. Please note that between‐year fluctuation in the occurrence resistance (%) may not be captured in the overall evaluation of the trend for the entire period (2009–2019).
Table 8.
Number of countries with significantly increasing or decreasing trends in resistance to selected antimicrobials for Campylobacter jejuni and C. coli in humans, 2015–2019, in broilers, 2009–2018, in turkeys 2009–2018 and in pig, 2009–2019
| Species | Ciprofloxacin | Erythromycin | Tetracyclines | ||||
|---|---|---|---|---|---|---|---|
| Incr. | Decr. | Incr. | Decr. | Incr. | Decr. | ||
| Human | C. jejuni (18 MS+2 non‐MS) | 9 (DK, FI, IS, LT, MT, NL, SI, SK, UK) | 1 (FR) | 1 (SK) | 5 (DK, FI, LT, NO, UK) | 6 (AT, DK, LU, NL, SK, UK) | 4 (EE, FR, IT, LT) |
| C. coli (15 MSs) | 2 (NL, SK) | 3 (IT, LU, UK) | 2 (NL, PT) | 1 (ES) | 2 (FR, SK) | ‐ | |
| Broilers | C. jejuni (24 MS + 1 non‐MS) | 12 (AT, HR, CY, CZ, DK, FI, FR, DE, NL, RO, SE, CH) | 5 (BG, CY, ES, RO, SK) | 14 (AT, BE, HR, CZ, DK, FR, DE, IE, LV, LT, NL, SK, SE, CH) | 4 (BG, FI, IT, NL, SI) | ||
| C. coli (8 MS) | 3 (HR, DE, NL) | 1 (HU) | 1 (CZ) | 3 (AT, DE, NL) | 4 (CZ, DE, HR, NL) | 1 (HU) | |
| Turkeys | C. jejuni (9 MS) | 3 (DE, PO, PT) | 2 (HU, ES) | 2 (DE, ES) | 5 (DE, ES, FR, HU, UK) | ||
| Pigs | C. coli (7 MS + 2 non‐MS) | 3 (DE, NO, CH) | 4 (HR, ES, NL, CH) | 1 (CH) | 1 (HR) | ||
Trends in C. coli from broilers were evaluated in only nine MSs (Austria, Croatia, Czechia, France, Germany, Hungary, the Netherlands, Slovenia, Spain) and one non‐MS (Switzerland). Increases of resistance were observed for ciprofloxacin (3 MSs), erythromycin (1 MS), streptomycin (2 MS) and tetracycline (4 MSs), whereas decreases were observed for ciprofloxacin (1 MS), erythromycin (3 MSs) and streptomycin (3 MSs).
It is important to note that between‐year fluctuations in the occurrence resistance (%) may not be captured in the evaluation of the trend for the entire time period (2009–2019) and that very recent decreasing or increasing trends may therefore be masked by the overall trend.
Temporal trends in resistance in C . jejuni from turkeys
No data have been reported for C. jejuni in turkeys in 2019. Thus, the comparison of resistance in C. jejuni isolates from fattening turkeys referred to the period of 2014–2018 (Figure 22 and Table 8; see also Annex C, Table 23). Significant increasing trends in resistance to ciprofloxacin between 2014 and 2018 were detected in Germany, Poland and Portugal, whereas a significant decreasing trend was recorded in Hungary and Spain. For resistance to tetracyclines, significant decreasing trends were observed in France, Germany, Hungary, Spain and the United Kingdom. Resistance to erythromycin showed a decreasing trend in Germany and Spain, and resistance to streptomycin displayed an increasing trend in Austria and Poland. These trends are based only on 3‐year data points and thus, for a more robust evaluation, need further follow up in the future.
Figure 22.

Trends in streptomycin (STR), ciprofloxacin (CIP), erythromycin (ERY) and tetracycline (TET) resistance in C. jejuni from turkeys, reporting EU MSs, 2014–2018
Temporal trends in resistance in C. coli from pigs 2009–2019
Trends in C. coli from pigs were evaluated for seven MSs and two non‐MSs who reported at least three data points (minimum 10 isolates per year) (Figure 23 and Table 8; see also Annex C, Table 23). Countries that reported only data for years before 2015 were not considered in the analysis because the evaluation of trend was not considered informative of the recent situation. Increases of resistance were observed for ciprofloxacin (Germany, Norway and Switzerland), streptomycin (Croatia, Norway and Switzerland) and tetracycline (Switzerland), whereas decreases were observed for erythromycin (Croatia, the Netherlands, Spain and Switzerland), tetracycline (Croatia) and streptomycin (Czechia and Sweden).
Figure 23.

Trends in ciprofloxacin (CIP), erythromycin (ERY), streptomycin (STR) and tetracycline (TET) resistance in C. coli from pigs, reporting EU MSs, 2009–2019
High‐level resistance to erythromycin
While erythromycin resistance was reported overall at very low, low and moderate levels in Campylobacter spp. recovered from caecal samples of the food‐producing animals, isolates displaying MICs > 128 mg/L were detected (Figure 24). Notably, an erythromycin MIC of > 128 mg/L exceeds the highest concentration tested, in accordance with the harmonised method set out in Decision 2013/652/EU. Figure 25 illustrates the proportion of isolates reported by MSs and non‐MSs solely displaying ‘microbiological/clinical’ resistance (C. jejuni: MIC > 4 mg/L; C. coli: MIC > 8 mg/L) in comparison to those displaying high‐level resistance (MICs > 128 mg/L) to this antimicrobial within each of the animal categories. Interestingly, 111 out of 140 (79.3%) of C. coli isolates from 8 MSs and 3 non‐MSs displaying erythromycin resistance from pigs exhibited a MIC of > 128 mg/L in 2019, while 69.2% and 52.9% of erythromycin‐resistant C. jejuni isolates from turkeys (N = 13) and broilers (N = 51), respectively, exhibited a MIC of > 128 mg/L in 2018. In pigs, 48.7% of the high‐level erythromycin‐resistant C. coli isolates were reported by Spain. In broilers and turkeys, 70% and 89% of the high‐level erythromycin‐resistant C. jejuni strains reported were isolated in Portugal and Italy, respectively. A high level of erythromycin resistance (MIC > 128 mg/L) was also reported in 15 C. coli isolates from calves out of 16 isolates exhibiting erythromycin resistance reported by Germany and Spain.
Figure 24.

MICs of Campylobacter jejuni isolates exhibiting erythromycin resistance in, broilers and turkeys (a), and C. coli in fattening pigs and calves (b) in reporting EU MSs and non‐EU MSs, 2018/2019
Figure 25.

- N: Total number of C. jejuni or C. coli isolates exhibiting erythromycin resistance. ERY: erythromycin. ERY resistance in C. jejuni isolates: 4 mg/L < MIC < 128 mg/L. ERY resistance in C. coli isolates: 8 mg/L < MIC < 128 mg/L.
A high‐level of resistance to macrolides, lincosamides and/or streptogramin B antibiotics in Campylobacter may be associated with the erm(B) gene encoding an rRNA methylase, as described first in a C. coli isolated from a swine in China (Qin et al., 2014). erm(B) is detected more frequently in C. coli than in C. jejuni, but it may also be found on C. jejuni from poultry resistant to all clinically important antimicrobial agents (Liu et al., 2019). In Europe, erm(B) has been reported in C. coli from broilers and turkeys in Spain and from a broiler isolate in Belgium (Florez‐Cuadrado et al., 2017; Elhadidy et al., 2019). It was also detected in Australia, in faecal samples from two travellers returning from Southeast Asia (Wallace et al., 2020). Importantly, in Campylobacter, the erm(B) gene is carried on plasmids, or more frequently on multidrug resistance islands (MDRI) which often contain genes coding for resistances to other families such as tetracycline and aminoglycosides (Florez‐Cuadrado et al., 2017). The erm(B) gene can be transferred by natural transformation between strains of Campylobacter (Wang et al., 2014). The presence of transferable resistance genes, on either plasmids or MDRI in Campylobacter, represents a main hazard, as acquisition of such genetic structures will confer multidrug resistance to isolates, which can be co‐selected and lead to therapeutic issues. Thus, to better detect the emergence of erm(B) in Campylobacter, and because erm(B) is more frequently reported among C. coli rather than C. jejuni in many published studies, C. coli was included in the future monitoring programs (EFSA, 2019, Decision 2020/1729/EU16). An increase of the tested concentrations of erythromycin (up to 512 mg/L instead of 128 mg/L) is also foreseen (EFSA, 2019, Decision 20/1729); this modification should lead to a better screening of isolates which may carry erm(B), as it will enable to differentiate isolates with a MIC < 128 mg/L, which have probably only mutations in target genes, from those with a higher MIC (≥ 512 mg/L) and therefore have an erythromycin resistance phenotype consistent with either possession of transferable erm(B) or mutational resistance (Wang et al., 2014).
3.4. Comparison of human and animal data on Campylobacter spp.
In 2018/2019, quantitative human data were interpreted using EUCAST ECOFF values (EUCAST, 2019, 2020), where available, in the same way as for the animal and food data. Figure 26 presents the CBPs and ECOFFs used to interpret the MIC data reported for Campylobacter spp. from humans, animals or food. In the absence of CBPs from EUCAST (i.e. gentamicin), CBPs from the French Society for Microbiology (CA‐SFM) were applied (Société Française de Microbiologie, 2020). Notably, there is concordance across interpretive categories, with the exception of the EUCAST CBP for tetracycline in C. jejuni which is one dilution above the EUCAST ECOFF.
Figure 26.

Comparison of clinical breakpoints (CBPs) and epidemiological cut‐off values (ECOFFs) used to interpret MIC data reported for Campylobacter spp. from humans, animals or food
Considering all data submitted from MSs, resistance to ciprofloxacin among C. jejuni isolates reported in 2018/2019 was detected in 59.3% (2018) and 61.5% (2019) of human isolates, 73.5% of isolates from broilers (2018), 71.0% of isolates from fattening turkeys and 56.8% of isolates from calves. Overall resistance to erythromycin was reported at 1.8% (2018) and 1.5% (2019) in isolates from humans, 1.3% in isolates from broilers, 1.1% in isolates from fattening turkeys and not detected in isolates from calves. Combined resistance to ciprofloxacin and erythromycin was reported at 1.1% (2018) and 1.0% (2019) in isolates from humans, and 1.2%, 1.0% and 0% in isolates from broilers, turkeys and calves, respectively (excluding non‐MSs). Considering MSs reported information on the four antimicrobials (ciprofloxacin/nalidixic acid, erythromycin, tetracycline and gentamicin), complete susceptibility was reported at levels of 33.9% (2018) and 30.7% (2019) in isolates from humans, and 21.3%, 21.6% and 24.7% in isolates from broilers (25 MSs), turkeys (10 MSs) and calves (4 MSs), respectively. However, it must be noted that all countries used EUCAST ECOFFs (MIC > 1 mg/L) to determine resistance to tetracycline in C. jejuni isolates from animals, whereas some countries used clinical breakpoints (MIC > 2 mg/L) to determine resistance to tetracycline in C. jejuni isolates from humans.
Assessing C. jejuni AMR data at the country level revealed significant differences in ciprofloxacin resistance among isolates from animals and humans, with a higher occurrence of ciprofloxacin resistance in humans in 2019 than for broilers in Finland (2018 and 2019), Denmark (2018), turkeys in UK (2018) and cattle in Denmark (2019) and Spain (2019). In Denmark, the increase in ciprofloxacin resistance in human C. jejuni in 2019 was due to a large outbreak caused by a ciprofloxacin‐ and tetracycline‐resistant clone related to domestic poultry (DANMAP, 2019). Lower ciprofloxacin resistance percentages were observed for humans in 2019 compared to broilers in Bulgaria and Poland and to turkeys in Poland in 2018. For erythromycin, significant differences were noted in Portugal (higher erythromycin resistance percentages of isolates from broilers and turkeys in 2018 compared to human ones in 2019) and Netherlands (higher erythromycin resistance percentages of isolates from humans in 2019 compared to broilers in 2018 and 2019).
Combined resistance to ciprofloxacin and erythromycin among C. jejuni isolates was significantly more frequent in 2018 broiler and turkey isolates compared to 2019 human isolates in Portugal. More isolates of human origin in 2019 were found susceptible to the four classes of antimicrobials compared to isolates from broilers in France and in Italy in 2018, and cattle in Spain in 2019, but the percentage of complete susceptibility was lower in humans in 2019 compared to broilers (2018) and cattle (2019) in Denmark.
Considering all reports from MSs, resistance to ciprofloxacin among C. coli isolates was reported in 65.2% (2018) and 61.2% (2019) of isolates from humans, 52.4% of isolates from fattening pigs (8 MSs) and 86.7% of isolates from broilers (6 MSs). Overall, resistance to erythromycin was reported in 14.3% (2018) and 12.9% (2019, PWA) of isolates from humans, and 11.2% and 6.5% of isolates from fattening pigs and broilers were resistant. Combined resistance to ciprofloxacin and erythromycin was reported overall at 11.0% (2018) and 10.4% (2019) in isolates from humans and at 8.0% in isolates from fattening pigs (excluding non‐MSs), and at 6.5% in isolates from broilers. In view of the reporting countries (excluding non‐MSs), complete susceptibility to the four antimicrobial classes was reported at levels of 11.4% (2018) and 12.6% (2019) for humans and 21.2%, and 7.1% in isolates from fattening pigs and broilers, respectively.
Considering the countries reporting information on C. coli isolates originating from both fattening pigs (2019), broilers (2018 or 2019) and humans (2019), significant differences in ciprofloxacin resistance were noted in Estonia with significantly higher percentages of resistance in isolates from humans compared to isolates from pigs. For erythromycin, the percentages of resistance were also significantly higher for human isolates compared to pig isolates in Estonia (where no resistant isolates from pigs were reported), but the opposite finding was observed in Spain. In the Netherlands, the human isolates were more frequently resistant to erythromycin compared to those from broilers in 2018 and 2019. Combined resistance to ciprofloxacin and erythromycin was also significantly more frequent in isolates from humans compared to pig isolates in Estonia and to broilers isolates in Netherlands but the opposite finding was observed in Spain. In Estonia, isolates from pigs were significantly more often susceptible to the four antimicrobial classes, compared to human ones.
Comparison of trends in resistance to ciprofloxacin, erythromycin and tetracyclines for isolates from humans (2015–2019) and broilers (2009–2019) was possible for 10 MSs and one non‐MS regarding C. jejuni and four MSs regarding C. coli. The results show various situations. For example, similar increasing trends for resistance to ciprofloxacin were observed for C. jejuni from humans and from broilers in Denmark, Finland and the Netherlands, or for C. coli from humans and from broilers in Netherlands. Resistance to tetracycline showed an increasing trend in C. jejuni isolates of humans and broilers in Austria, Denmark and Slovakia. Conversely, in France, resistance to ciprofloxacin decreased in C. jejuni from humans but increased in broilers, and similarly in France and in Lithuania, resistance to tetracycline showed a decreasing trend in humans but an increasing one in broilers. Differences in the time periods studied may explain these discrepancies.
3.5. Discussion
Campylobacter is a major food‐borne zoonotic agent. In the frame of Commission Implementing Decision 2013/652/EU), the monitoring of AMR in Campylobacter of animal origins provides comparable data on the occurrence and enables to assess the trends of AMR in this bacterial genus in animal productions.
Globally, the data obtained from Campylobacter jejuni and C. coli from human and animal origins in 2018–2019, showed very high to extremely high levels of resistance to fluoroquinolones, which are critically important antimicrobials (CIA) for the treatment of Campylobacter infections in humans. Resistance to quinolones and fluoroquinolones is most usually due to the C257T mutation on the gyrA gene (DTU, 2018). Modifications in the expression of the efflux pump CmeABC may also result in higher MICs of various antimicrobials including ciprofloxacin. Recently highly resistant isolates bearing a transferrable ‘super’ efflux pump variant of CmeABC (RE‐CmeABC) were described in China (Yao et al., 2016), and their MICs of ciprofloxacin, and also of florfenicol, chloramphenicol, erythromycin and tetracycline, were increased.
An increasing trend in ciprofloxacin resistance in C. jejuni was observed in nine countries in humans and 12 MSs in broilers and three in turkeys. An increasing trend was also observed for C. coli for two MSs in humans, three for broilers and two for pigs. However, a decreasing trend in ciprofloxacin resistance was detected for C. jejuni and C. coli in humans in one and three MSs, respectively. Such decreasing trend were rarely noted for C. jejuni or C. coli from animals, but the time periods studied were different, with a longer period of time studied for animals which may partly mask the very recent trend. It is worth mentioning that decreasing trends for resistance to fluoroquinolones are reported for the indicator species E. coli (EFSA, 2019). The contrasting effects of changes of antibiotic use in animal productions on resistance in the diverse bacteria may be explained by co‐selection or fitness of resistant strains (Perrin‐Guyomard et al., 2020).
Macrolides are another important family of antibiotics for treatment of human campylobacteriosis. Resistance to erythromycin was detected at low levels in C. jejuni from humans and animals. C. coli isolates displayed higher rates of resistance to erythromycin, with large dispersion between reporting MSs in both human and animals. Mutations in one or several copies of the ribosomal RNA genes, such as A2074G, A2074C and A2075G, or in the ribosomal proteins L4 and L22 are common mechanisms of resistance to macrolides (Luangtongkum et al., 2009). Additionally, the transferable erm(B) gene encoding an rRNA methylase, usually present on multidrug resistance islands (MDRGI) or plasmids, may confer a high level of resistance to macrolides, lincosamides and/or streptogramin B antibiotics (Wang et al., 2014). Initially described in Asia, this emerging resistance mechanism has now also been detected in animal isolates in Europe (Florez‐Cuadrado et al., 2017; Elhadidy et al., 2019). [see text box].
An increasing trend in C. jejuni resistance to erythromycin was detected in only one MS (Slovakia) and only in humans, whereas decreases were observed in five MSs for humans, five MSs in broilers and two for turkeys. Concerning resistance to erythromycin in C. coli, decreasing trends were observed for human isolates in one MS, in three for broilers and four for pigs.
Differences in occurrence or trends of resistance from animals were observed between countries. These differences are probably mainly associated to differences in the use of antimicrobials (EMA and EFSA, 2017). For human isolates, the differences observed between countries may partly result from the origins of reported data, according to local medical and diagnostic practices, which may result in the reporting of various clinical or regional subsets of isolates or of proportions of travel‐associated cases or outbreaks. Another source of variation between countries is associated with the proportions of the different sources of human contamination, which may differ according to eating, leisure or hygiene habits, as revealed by recent attribution studies (Jehanne et al., 2020; Rosner et al., 2017; Thepault et al., 2017). Within a given MS, significant differences between rates and trends of resistance in isolates of humans and animals may be explained by the fact that much of the food consumed in a MS may have originated from other MSs or third countries. Moreover, human contamination from sources other than food animals– such as wild birds, pets and environmental water or person‐to‐person transmission, including sexual transmission– should also be considered as potential modes of transmission (More et al., 2017; Szczepanska et al., 2017; Greninger et al., 2020). Still, recent source attribution studies concluded that, besides chickens, ruminants play an important role in human Campylobacter cases (Thepault et al., 2017; Mossong et al., 2016). A better knowledge of the resistance levels of Campylobacter jejuni and C. coli, not only in poultry, but also in pigs and ruminants, is necessary, and mandatory monitoring of C. jejuni and C. coli in the different animal productions will be implemented as of 2021 (EFSA et al., 2019, Decision 2020/1729). The new Decision will also enable a better detection of the emerging and threatening resistance mechanisms already mentioned (RE‐CmeABC, ermB), and other ones such as the cfr(C) gene, borne on a conjugative plasmid and conferring resistance to phenicols, lincosamides, pleuromutilins and oxazolidinones (Tang et al., 2017). These mechanisms (efflux pumps) and/or their genetic support (plasmids, MDRGI) confer resistance to one or several families of antimicrobials of major importance for therapy (macrolides, fluoroquinolones or aminoglycosides) and could favour co‐selection of resistant clones or plasmids. An enlargement of the range of concentrations tested for erythromycin and ciprofloxacin and evaluation of the susceptibilities of additional molecules, such as phenicols is therefore foreseen (Decision 2020/1729). Finally, whole genome sequencing of isolates with multidrug resistance, high‐level resistance to erythromycin or ciprofloxacin or resistance to gentamicin is strongly encouraged to evidence the involved genes, detect resistant clones and compare animal to human isolates.
4. Antimicrobial resistance in indicator E. coli 17
4.1. Data on AMR in indicator E. coli addressed
Throughout 2018 and 2019, AMR was monitored in indicator E. coli isolates obtained from caecal samples of the most relevant food‐producing animals at slaughter in accordance with Commission Implementing Decision 2013/652/EU. In 2018, the mandatory monitoring covered E. coli isolates from broilers and fattening turkeys and in 2019, isolates from fattening pigs and bovine animals (calves) under 1 year of age. The specific monitoring of ESBL‐/AmpC‐/carbapenemase‐producing E. coli recovered from caecal samples of broilers, fattening turkeys, fattening pigs and bovine animals (calves) under 1 year of age, as well as from fresh meat samples of broilers, pigs and bovines, was also mandatory over these reporting years (see Section 5 ESBL).
Studying phenotypic AMR of commensal ‘indicator’ E. coli from the intestinal flora of healthy food‐producing animals and from food derived from these animals provides information on the reservoirs of resistant bacteria that could potentially be transferred between animal populations and between animals and humans. It also provides indirect information on the reservoirs in animals and food of resistance genes that could be transferred to bacteria that are pathogenic for humans and/or animals. Such monitoring, therefore, has relevance to both public and animal health. The occurrence of resistance in indicator E. coli is likely to depend on a number of factors including: the selective pressure exerted by the use of antimicrobials in various food‐producing animal populations; clonal spread of resistant organisms; dissemination of particular genetic elements, such as resistance plasmids; and the effects of co‐selection in bacteria exhibiting multi drug resistance (MDR).
4.2. Antimicrobial resistance in poultry, porcine and bovine populations
In 2018, 28 MSs and 4 non‐MSs reported quantitative AMR data on indicator E. coli isolates from broilers and 11 MSs and 1 non‐MSs data on isolates from fattening turkeys. In 2019, 28 MSs and 4 non‐MSs reported data on isolates from fattening pigs and 9 MSs and 3 non‐MSs data on isolates from bovine animals under 1 year of age (calves).
4.2.1. Occurrence of resistance
Resistance to ampicillin, sulfamethoxazole, trimethoprim and tetracycline were the most common resistance traits observed. Median levels of resistance to those antimicrobials were ‘high’ or ‘very high’ in all four animal populations, with large differences observed between countries (Figure 27 and Annex D). Whereas some countries reported ‘extremely high’ levels in one or more animal population, others reported ‘moderate’ or ‘low’ levels. Also, resistance to ciprofloxacin and nalidixic acid was common in poultry, where median levels of ciprofloxacin resistance were ‘extremely high’ in broilers and ‘very high’ in turkeys and median levels for nalidixic acid resistance were ‘very high’ in broilers and ‘high’ in turkeys (Figure 27 and Annex D). In contrast, in pigs and calves median levels of resistance to these antimicrobials were ‘low’ and ‘moderate’, respectively. For both ciprofloxacin and nalidixic acid resistance, there were large differences between reporting countries. Most countries reported nalidixic acid resistance at lower levels than ciprofloxacin resistance. This was most notable in pigs where the total level of resistance to nalidixic acid (5.8%) at the MS‐group level was only about of half that for ciprofloxacin (11.8%).
Figure 27.

- N: Total number of isolates reported by Member States (MSs) and non‐Member States (non‐MSs); AMP: ampicillin, SMX: sulfamethoxazole, TET: tetracycline, CIP: ciprofloxacin, CTX: cefotaxime, CIP/CTX: combined ‘microbiological’ resistance to ciprofloxacin and cefotaxime; blue diamond: EU level of resistance; horizontal line in the box plot: the median.
The median level of chloramphenicol resistance was ‘moderate’ in pigs, calves, and broilers and ‘high’ in turkeys, although ‘high’, ‘very high’ and for turkeys even ‘extremely high’ levels were recorded in some countries (Annex D). Median levels of resistance to gentamicin, cefotaxime, ceftazidime, colistin and azithromycin were ‘rare’, ‘very low’ or ‘low’ in all four animal categories although higher levels were reported by single countries (Annex D). Meropenem resistance was not detected in any isolate of indicator E. coli and tigecycline resistance in only three isolates from Belgium (2 broilers; 1 pig), and three isolates from Malta (pigs).
Resistance to ‘critically important antimicrobials’
Among the antimicrobials tested in the mandatory monitoring, ciprofloxacin (fluoroquinolones), cefotaxime and ceftazidime (third‐generation cephalosporins), colistin (polymyxins) and azithromycin (macrolides) are categorised by the WHO as critically important antimicrobials (CIA) and among substances of the highest priority (WHO, 2019).
Median levels of colistin and azithromycin resistance were ‘low’ to ‘very low’, and in many countries, resistance to these antimicrobials was not observed. In contrast, at the MS‐group level, ‘very high’ or ‘extremely high’ levels of resistance to fluoroquinolones/quinolones were recorded in isolates from broilers (median: ciprofloxacin 73.5%; nalidixic acid 64.1%), and ‘very high’ or ‘high’ levels in isolates from turkeys (median ciprofloxacin 56.5%; median nalidixic acid 34.8%) (Annex D). Resistance to ciprofloxacin and nalidixic acid were reported at much lower levels in isolates from pigs (median 11.2% and 4.1%, respectively) and calves (median 7.7% and 5.7%, respectively). Large variations were however registered between reporting countries for each of the animal populations (Figure 27 and Annex D). In non‐MSs, resistance to fluoroquinolones/quinolones was either not detected or found at ‘moderate’, ‘low’ or ‘very low’ levels in all four animal populations, with the exceptions of Switzerland, which registered ‘high’ levels of resistance to both ciprofloxacin (45.3%) and nalidixic acid (45.8%) in isolates from broilers, and the Republic of North Macedonia, which reported a ‘high’ level of resistance to ciprofloxacin (21.1%) in isolates from pigs.
In all animal populations monitored, resistance to third‐generation cephalosporins (cefotaxime or ceftazidime) was either not observed or detected at ‘low’ to ‘very low’ levels in some countries (Figure 27 and Annex D). Both exceptions were Lithuania and Belgium, where ‘high’ (30.1%) and ‘moderate’ (14.8–16.2%) levels of resistance were, respectively, reported in isolates from broilers. At the MS‐group level, median resistance levels to cefotaxime and ceftazidime were similar in all four animal populations, at 1.1% vs. 1.1% in isolates from pigs, 0.6% vs. 0.6% in isolates from calves, 1.4% vs. 1.4% in isolates from broilers and 1.2% vs. 1.2% in isolates from turkeys. Non‐MSs did not report resistance to third‐generation cephalosporins in isolates from pigs, broilers and turkeys but the Republic of North Macedonia, Switzerland and Norway each detected single resistant isolates in calves.
Combined resistance to ciprofloxacin and cefotaxime
In most reporting countries, ‘microbiological’ combined resistance to ciprofloxacin and cefotaxime was either not observed or detected at ‘low’ to ‘very low’ levels in all four of the animal populations monitored (Figure 28). Lithuania still reported ‘high’ level resistance (26.9%) in isolates from broilers. Considering all reporting countries, ‘microbiological’ combined resistance was ‘very low’ in pigs and calves and ‘low’ in broilers and turkeys, whereas ‘clinical’ combined resistance was ‘very low’ in all four animal populations monitored (Table 9).
Figure 28.

Spatial distribution of combined ‘microbiological’ resistance to cefotaxime and ciprofloxacin in indicator Escherichia coli. (a) fattening pigs, 28 MSs and 4 non‐MSs 2019, (b) calves under 1 year of age, 9 MSs and 3 non‐MSs 2019, (c) broilers, 27 MSs and 4 non‐MSs 2018, (d) fattening turkeys, 11 MSs and 1 non‐MSs 2018
Table 9.
Combined resistance to ciprofloxacin and cefotaxime, applying ECOFFs and clinical breakpoints, as issued by EUCAST
| Food‐producing animal population | ‘Microbiological’ combined resistance to CIP & CTX (using ECOFFs) | ‘Clinical’ combined resistance to CIP & CTX (using clinical breakpoints) | ||||
|---|---|---|---|---|---|---|
| No. of isolates | % Resistance | 95% CI | No. of isolates | % Resistance | 95% CI | |
| Fattening pigs (2019, N = 4,802, 28 MSs, 4 non‐MSs) | 25 | 0.5% | 0.4–0.8 | 6 | 0.1% | 0.1–0.3 |
| Calves < 1 year (2019, N = 2,136, 9 MSs, 3 non‐MSs) | 13 | 0.6% | 0.3–1.0 | 3 | 0.2% | 0.0–0.5 |
| Broilers (2018, N = 4,739, 28 MSs, 4 non‐MSs) | 100 | 2.1% | 1.7–2.6 | 40 | 0.8% | 0.6–1.1 |
| Fattening turkeys (2018, N = 1,810, 11 MSs, 1 non‐MSs) | 28 | 1.5% | 1.0–2.2 | 12 | 0.7% | 0.3–1.2 |
N: total number of E. coli isolates reported by MSs and non‐MSs; CIP: ciprofloxacin; CTX; cefotaxime.
4.2.2. Temporal trends in resistance among indicator E. coli
For those countries having provided data on indicator E. coli from fattening pigs, bovine animals under 1 year of age, broilers or fattening turkeys for 3 years or more over the period 2009–2019, trends in resistance to ampicillin, ciprofloxacin, cefotaxime and tetracycline are presented below. Ampicillin and tetracycline resistance trends are considered because those antimicrobials have been the most used in food‐producing animals in Europe (EMA, 2020) and statistically significant decreasing trends in resistance to those antimicrobials are believed to primarily reflect changes in usage. Resistance trends in the highly prioritised CIAs ciprofloxacin and cefotaxime have also been specifically addressed, as resistance in food‐producing animals might impact human health care. The statistical significance (p ≤ 0.05) of trends was tested by logistic regression (see Annex A).
Fattening pigs
Trends in resistance in isolates from fattening pigs were analysed for 30 countries (27 MSs, 3 non‐MSs) (Figure 29). Resistance to ampicillin has decreased in five countries (Cyprus, Germany, Netherlands, Portugal and Switzerland) and increased in nine countries (Austria, Belgium, Denmark, France, Ireland, Poland, Romania, Slovakia and Spain). Ciprofloxacin resistance has decreased in three countries (Bulgaria, Cyprus and Netherlands) and increased in eight countries (Belgium, Denmark, Italy, Malta, Poland, Romania, Slovenia, Spain). Resistance to cefotaxime has decreased in four countries (Cyprus, Denmark, Greece and the Netherlands) and increased in three countries (Belgium, Romania and the United Kingdom). Tetracycline resistance has decreased in 15 countries (Austria, Belgium, Czechia, Finland, France, Germany, Hungary, Latvia, Lithuania, Netherlands, Norway, Romania, Spain, Switzerland and the United Kingdom) and increased in two countries (Poland and Slovakia).
Figure 29.

- (↑)/(↓): indicates statistically significant trends over the period 2015–2019.
Overall, in the 30 countries, there were 27 decreasing and 22 increasing trends. In 13 countries, there were only decreasing trends, notably in the Netherlands for all four antimicrobials and in Cyprus to three of the substances. In contrast, in six countries there were only increasing trends, in Poland for three antimicrobials. In seven countries both decreasing and increasing trends were observed and in four countries, there were no statistically significant trends in resistance. At the MS‐group level, there was a statistically significant decrease in tetracycline resistance over the period 2009–2019.
Bovine animals (calves) under 1 year of age
Trends in resistance in isolates from bovine animals under 1 year of age (calves) were analysed for 11 countries (9 MSs, 2 non‐MSs) (Figure 30). Resistance to ampicillin has decreased in three countries (France, Germany and the Netherlands) and increased in four countries (Belgium, Denmark, Spain and Switzerland). Ciprofloxacin resistance has decreased in three countries (France, Germany, Netherlands) and increased in three countries (Belgium, Spain and Switzerland). Resistance to cefotaxime has decreased in three countries (France, Germany and Netherlands) and increased in one country (Belgium). Tetracycline resistance has decreased in four countries (France, Germany, the Netherlands and Portugal) and increased in two countries (Belgium, Switzerland).
Figure 30.

- (↑)/(↓): indicates statistically significant trends over the period 2015–2019. Data from Croatia was not included in the calculation of the Total (MSs) as data for calves (<1 year) was not reported for the year 2015.
Overall, in the nine countries, there were 13 decreasing and 10 increasing trends over the period. In four countries (France, Germany, Netherlands, Portugal), there were only decreasing trends and, notably, resistance to all four antimicrobials has decreased in France, Germany and the Netherlands. In contrast, in four countries, there were only increasing trends, in Belgium to all four antimicrobials considered. In three countries, no trend in resistance was observed. At the MS‐group level there were no statistically significant trends in resistance to any antimicrobial in the period 2009–2019.
Broilers
Trends in resistance in isolates from broilers were analysed for 29 countries (27 EU MSs, 2 non‐EU MSs) over the period 2009–2019 (Figure 31). Resistance to ampicillin has decreased in 13 countries (Bulgaria, Croatia, Estonia, France, Germany, Ireland, Italy, Latvia, Netherlands, Norway, Romania, Spain, United Kingdom) and increased in five countries (Belgium, Finland, Greece, Malta, Poland). Ciprofloxacin resistance has decreased in 12 countries (Austria, Belgium, Bulgaria, Ireland, Italy, Latvia, Lithuania, Malta, Netherlands, Portugal, Sweden, United Kingdom) and increased in six countries (Denmark, Finland, Hungary, Norway, Poland, Switzerland). Resistance to cefotaxime has decreased in 13 countries (Croatia, Cyprus, Estonia, France, Germany, Latvia, Lithuania, Netherlands, Poland, Slovakia, Slovenia, Spain, Switzerland) and increased in four countries (Belgium, Bulgaria, Romania, United Kingdom). Tetracycline resistance has decreased in 13 countries (Bulgaria, Cyprus, France, Germany, Ireland, Italy, Latvia, Netherlands, Norway, Romania, Spain, Switzerland, United Kingdom) and increased in two countries (Belgium, Poland).
Figure 31.

- (↑)/(↓): indicates statistically significant trends over the period 2015–2019.
Overall, in the 29 countries, 51 decreasing and 17 increasing trends were recorded as statistically significant over the study period. In 16 countries, there were only decreasing trends to one or more of the antimicrobials. Notably, in Latvia and the Netherlands, resistance has decreased for all four antimicrobials and in France, Germany, Italy, Ireland and Spain for three antimicrobials. In contrast, in four countries, only increasing trends were observed. For eight countries, there were both increasing and decreasing trends and in one country, no statistically significant trends in resistance were detected over the study period. At the MS‐group level, resistance to all four antimicrobials has decreased with statistical significance over the period 2009–2019.
Fattening turkeys
Temporal trends in AMR in isolates from fattening turkeys were analysed for 11 reporting EU MSs (Figure 32). Decreasing trends were observed for ampicillin in four countries (Austria, Sweden, Spain and the UK), for ciprofloxacin in four countries (Austria, Romania, Spain and the UK) and for tetracyclines in seven countries (France, Hungary, Poland, Portugal, Spain, Sweden and the UK), notably in France, Spain and the UK. Resistance to all these three antimicrobials has decreased also at the overall MS‐group level. Over the period evaluated, resistance to cefotaxime has remained stable at low to very low levels in all 11 countries reporting.
Figure 32.

- (↑)/(↓): indicates statistically significant trends over the period 2015–2019.
Overall, in the 11 reporting countries, 15 decreasing trends were recorded, while no increasing trend was discerned, over the 2014–2018 study period. Decreasing trends were observed in nine countries. In two countries (Spain and the United Kingdom), there were decreasing trends for three antimicrobials, in two countries to two antimicrobials and in five countries, to one antimicrobial. At the MS‐group level, statistically significant decreasing trends were registered for ampicillin, ciprofloxacin and tetracycline over the period 2014–2018.
4.2.3. Phenotypic characterisation of third‐generation cephalosporin and carbapenem resistance in indicator E. coli from caecal samples
A low number of indicator E. coli isolates from caecal samples from pigs and calves under 1 year of age in 2019 and from broilers and fattening turkeys in 2018 were phenotypically resistant to third‐generation cephalosporins (cefotaxime or ceftazidime) on initial testing on panel 1 (Table 10). Further phenotypic characterisation of these isolates for presumptive production of ESBL‐ and/or AmpC‐enzymes on panel 2 showed that the total number of presumptive ESBL‐ and/or AmpC‐producers was ‘low’ in all four animal categories but that occurrence was higher in isolates from broilers and turkeys than in isolates from pigs and calves (Table 11). Presumptive ESBL‐ and/or AmpC‐producing isolates were reported from pigs by 20 of 28 MSs, from calves by 5 of 9 MSs, from broilers by 21 of 28 MSs and from turkeys by 8 of 11 MSs. None of the non‐MSs reported presumptive ESBL‐ and/or AmpC‐producing isolates from pigs, broilers and turkeys but all 3 non‐MSs reporting data for calves reported such isolates.
Table 10.
Occurrence of resistance to third‐generation cephalosporins in indicator E. coli isolates from fattening pigs, calves under 1 year of age, broilers and fattening turkeys. EU MSs and non‐MSs, 2018/2019
| Animal category | No. of MSs/non‐MSs | N | Cefotaxime | Ceftazidime | ||
|---|---|---|---|---|---|---|
| n | % | n | % | |||
| Fattening pigs – 2019 | 28/4 | 4,802 | 61 | 1.3% | 57 | 1.2% |
| Calves, < 1 year – 2019 | 9/3 | 2,136 | 25 | 1.2% | 23 | 1.1% |
| Broilers – 2018 | 28/4 | 4,739 | 125 | 2.6% | 116 | 2.4% |
| Fattening turkeys – 2018 | 11/4 | 1,810 | 36 | 2.0% | 34 | 1.9% |
N: Total number of isolates tested by MSs and non‐MSs; n: Total number of isolates resistant.
Table 11.
Phenotypes of presumptive ESBL‐, AmpC‐ or CP‐ producing indicator E. coli subjected to supplementary testing (panel 2). EU MSs and non‐MSs, 2018/2019
| Animal category | ESBL and/or AmpC n (% R) | ESBLa n (% R) | AmpCb n (% R) | ESBL + AmpCc n (% R) | CPd n (%R) |
|---|---|---|---|---|---|
| Fattening pigs, 2019 | 58 (1.2) | 44 (0.8) | 14 (0.3) | 0 | 0 |
| Calves < 1 year, 2019 | 22 (1.0) | 20 (0.9) | 2 (0.1) | 0 | 0 |
| Broilers, 2018 | 115 (2.4) | 82 (1.7) | 38 (0.8) | 5 (0.1) | 0 |
| Fattening turkeys, 2018 | 35 (1.9) | 31 (1.7) | 5 (0.3) | 1 (0.1) | 0 |
ESBL: extended‐spectrum β‐lactamase; CP: carbapenemase; N: Total number of isolates reported by MSs and non‐MSs; n: number of isolates with this phenotype; % R: percentage of isolates from the total tested; ESBL; extended‐spectrum β‐lactamase.
All isolates showing clavulanate synergy with cefotaxime, ceftazidime or with both compounds, suggesting the presence of an ESBL (independently of the presence of other mechanisms).
Isolates with microbiological resistance to cefoxitin, suggesting the presence of an AmpC enzyme (independently of the presence of other mechanisms).
Isolates showing synergy with cefotaxime or ceftazidime and with microbiological resistance to cefoxitin, suggesting the presence of ESBL and AmpC enzymes in the same isolate. These isolates are also included in the ESBL and AmpC columns.
Isolates with microbiological meropenem resistance.
In countries reporting presumptive ESBL‐ and/or AmpC‐producing isolates occurrence was generally ‘very low’ or ‘low’, ranging from 0.6% to 5.9% in isolates from pigs, from 0.3% to 5.6% in isolates from calves and from 0.6% to 7.1%% in isolates from turkeys. Occurrence was generally ‘very low’ or ‘low’ also in broilers and in 19 of the MSs ranged from 0.6% to 7.9% but was moderate in Belgium (cefotaxime 15.1%; ceftazidime 13.7%) and high in Lithuania (30.1%). Presumptive ESBL‐producers were more common than AmpC‐producers in all animal categories and isolates with a combined phenotype (ESBL+AmpC) were uncommon (Table 11). No isolate of indicator E. coli recovered from caecal samples by MSs and non‐MSs from the four animal categories in 2018/2019 showed microbiological resistance to carbapenems (meropenem) on initial testing on panel 1.
4.2.4. Multidrug resistance and complete susceptibility in indicator E. coli
Multidrug resistance
Multidrug resistance (MDR), defined as ‘microbiological’ resistance to three or more antimicrobial classes of the harmonised panel tested, was observed in 34.2% of indicator E. coli isolates from pigs, in 26.8% from calves, in 42.2% from broilers and in 43.5% from turkeys. Large variations between reporting countries were observed, and MDR ranged between 2.8 and 85.3% in pigs, 0.3–73.4% in calves, 0.4–86.5% in broilers and 0–78.0% in turkeys (Annex D).
MDR patterns
A wide variety of resistance patterns were observed in MDR isolates. The antimicrobials most often represented in the patterns of isolates from pigs and calves were tetracycline, ampicillin, sulfamethoxazole and trimethoprim. Considering all reporting countries, about half of the MDR isolates from pigs (52.3%) and calves (48.3%) were resistant to all these four antimicrobials and often also to other substances. These antimicrobials, alone or in combination with other substances, were also common in resistance patterns of MDR isolates from broilers (43.4%) and turkeys (45.7%). MDR patterns of isolates from poultry often included quinolones at 78.9% for broilers and 71.7% for turkeys. In contrast, quinolones were less often included in the patterns of MDR isolates from pigs (27.3%) and calves (39.5%).
Colistin was uncommon in the patterns of MDR isolates, at 1.5% in pigs, 1.6% in calves, 1.3% in broilers and 6.5% in turkeys. Also, resistance to third‐generation cephalosporins was uncommon at 3.0% in pigs, 3.7% in calves, 6.2% in broilers and 4.3% in turkeys.
Completely susceptible isolates
The occurrence of resistance can also be addressed by considering the proportion of indicator E. coli isolates exhibiting susceptibility to all the 14 antimicrobials tested, using epidemiological cut‐off values for interpretation. Considering all reporting countries, 39.8% (median 38.8%) of isolates from pigs, 57.6% (median 53.9%) from calves, 27.8% (median 14.1%) from broilers and 27.8% (median 21.4%) from turkeys exhibited complete susceptibility (Annex D). For all animal populations, complete susceptibility varied widely between individual countries (Figure 33). Complete susceptibility in isolates from pigs ranged from 0% in Cyprus to 91.2% in Norway, and among isolates from calves, from 14.8% in Italy to 93.6% in Norway. Likewise, the proportion of completely susceptible isolates from broilers varied between 1.8% in Greece and over 90% in Norway and Finland and in isolates from turkeys, between 7.6% in Portugal and 80.3% in Sweden (Annex D, Figure 33). Typically, the highest levels of complete susceptibility in all four animal populations were observed in isolates from the Nordic countries, with levels generally decreasing in a north to south gradient and to a lesser extent, in an east to west gradient.
Figure 33.

Spatial distribution of complete susceptibility to the antimicrobials tested in indicator E. coli. (a) fattening pigs, 28 MSs, 4 non‐MSs, 2019; (b) calves < 1 year of age, 9 MSs, 3 non‐MSs, 2019; (c) broilers, 28 MSs, 4 non‐MSs, 2018; (d) fattening turkeys, 11 MSs, 1 non‐MSs, 2018
Changes in complete susceptibility
In pigs, at the MS‐group level, no statistically significant difference in the level of complete susceptibility was observed between 2015 and 2019 (Figure 34a). In seven countries (Estonia, Finland, Germany, Lithuania, Spain, Norway and Switzerland), the level of completely susceptible isolates has however increased significantly, whereas it has decreased in two countries (Poland and Slovakia). In calves, the level of complete susceptibility has also remained stable at the MS‐group level, but a statistically significant increase was observed in three countries (France, Portugal, Switzerland) over the study period (Figure 34b).
Figure 34.

- (↑)/(↓): indicates statistically significant trends over the period 2015–2019. The upper bounds of the 95% confidence interval of the occurrence of complete susceptibility are also indicated.
For broilers, at the MS‐group level, complete susceptibility has increased between 2015 and 2019, as well as in eleven individual countries (Austria, Bulgaria, France, Ireland, Italy, Latvia, Lithuania, Netherlands, Romania, Slovakia, United Kingdom) and decreased in two countries (Denmark, Germany) (Figure 35a). The level of complete susceptibility has increased significantly at the MS‐group level also for turkeys as well as in seven individual countries (France, Hungary, Italy, Romania, Spain, Sweden, the United Kingdom) (Figure 35b).
Figure 35.

- (↑)/(↓): indicates statistically significant trends over the period 2014–2018. The upper bounds of the 95% CI are also shown.
Key Outcome Indicator of complete susceptibility
The proportion of fully susceptible indicator E. coli isolates, weighted by the size of the populations of the most important production animals (broilers, fattening turkeys, fattening pigs, calves) is used as a key outcome indicator (KOICS) for the overall AMR situation in food‐producing animals. The KOICS accounts for differences in the relative size of food animal populations in a country and is therefore relevant in evaluation of risks related to resistance in food animals.
Indicator E. coli is selected as the reporting organism instead of zoonotic organisms because it is expected to better represent the overall AMR situation, including resistance due to plasmid‐mediated AMR genes. Plasmid‐mediated AMR genes are considered to be a more significant part of resistance that can be transferred from the agricultural sector to human health care than most antimicrobial‐resistant zoonotic pathogens (Hammerum et al., 2014). An abundant commensal bacterial species is therefore more relevant than less abundant zoonotic species in representing the overall AMR situation.
The KOICS can be used to assess the development of AMR in relation to the total use of antimicrobials in food‐producing animals (Queenan et al., 2016; ECDC, EFSA and EMA, 2017). The assumption underlying the choice of this specific indicator is that only E. coli that is rarely, if ever, exposed to antimicrobials will be fully susceptible (Martinez, 2014). Therefore, it is to be expected that a reduction of the use of antimicrobials in food‐producing animals would result in a noticeable improvement of this indicator.
The populations of food‐producing animals differ in size within and between European countries. The relative size of those varying populations may influence resistance issues related to the overall food animal production at the country level as well as on the European level. This makes it difficult to evaluate overall trends and to assess the overall magnitude of resistance in food‐producing animals within and between countries. To account for differences in the relative size of food animal populations in a country, the KOICS was calculated as the weighted mean of the proportions of completely susceptible indicator E. coli isolates in each of the four animal populations monitored (fattening pigs, calves under 1 year of age, broilers, fattening turkeys). For calculation of the KOICS, the value for each population was weighted in relation to the relative size of the populations within a country using the ‘population correction unit’ (PCU). Regarding cattle, only calves under 1 year of age were included in calculation of the PCU. PCU is a technical unit of measurement used as an indicator of animal population size and was developed by the EMA, primarily to estimate sales of antimicrobials corrected by the animal population in individual countries. The data sources and methodology for the calculation of PCU are comprehensively described in EMA's report ‘Sales of veterinary antimicrobial agents in 31 European countries in 2017’ (EMA 2020).
For each country, KOICS was calculated using data reported for 2 consecutive years. Thus, values for 2014–2015 were calculated from data for broilers and fattening turkeys reported in 2014 and on data for fattening pigs and calves under 1 year of age reported in 2015. Likewise, the values for 2015–2016 were calculated from data reported for pigs and calves in 2015 and on data for broilers and fattening turkeys reported in 2016 and so on. For each value of KOICS calculated for a single country, data for broilers and pigs were included. However, since all countries have not reported data for calves and turkeys regularly, all calculations did not include data for these categories.
KOICS for the 28 MSs and 3 non‐MSs reporting data on resistance in 2014 to 2019, are presented in Figure 36. There were marked variations in KOICS between countries: in ten countries levels of KOICS were < 20%, in 13 countries 20–40%, in seven countries 40–60%, in four countries 60–80% and in one country (Norway) > 80%. The lowest KOICS were generally observed in countries in eastern and southern Europe and the highest in countries in the northern part. For some countries KOICS have been stable at a high level over the period and in others at a low level. Statistically significant increasing trends were registered in 12 countries and decreasing trends in three countries.
Notably, the relative contribution from the data submitted for the different animal populations by the individual countries and the relative size of those animal populations have an impact on the calculation of KOICS. In nine of the 16 countries with a positive or negative trend in KOICS, this was concurrent with a similar trend in levels of complete susceptibility of isolates from pigs (Figure 36). Conversely, in all these nine countries a positive or negative trend in complete susceptibility in isolates from pigs was reflected in a similar trend in KOICS. However, for example, in Germany, a negative trend in complete susceptibility in isolates from broilers was outweighed by a positive trend in pigs, resulting in a positive trend in KOICS. Conversely, in France and Italy, increasing trends in complete susceptibility in isolates from broilers and turkeys were masked by the lack of significant changes in complete susceptibility in isolates from pigs and calves. Likewise, in Slovakia a positive trend in isolates from broilers was masked by a decreasing trend in isolates from pigs. Thus, if KOICS is used as sole indicator of the AMR situation, positive or negative trends in one animal category of small relative size within a country may go unnoticed. Data on resistance/complete susceptibility should therefore also be evaluated at the level of the individual animal population to fully appreciate the situation within a country.
Figure 36.

Changes in weighted key outcome indicator of complete susceptibility (KOICS) in 28 EU MSs and 3 non‐MSs
4.2.5. Colistin resistance in indicator E. coli
Colistin (polymyxin E) is an antimicrobial of the polymyxin group that has been used extensively in farm animals all over the world, including Europe. In human medicine, use of colistin has historically been limited. In recent years, an increased usage has been recorded in human medicine to account for the need of last resort antimicrobials to treat infections caused by multidrug‐resistant Gram‐negative bacteria. Consequently, polymyxins are now among the five antimicrobials listed by WHO as critically important and of highest priority for human medicine. The discovery of transferable genetic elements (e.g. mcr‐ genes) conferring resistance to colistin, further underlines the importance of monitoring such resistance in food animals.
The majority of countries did not detect colistin resistance in indicator E. coli and occurrence of resistance was generally uncommon. At the MS‐group level, colistin resistance was recorded as ‘very low’ in isolates from fattening pigs (mean 0.6%, median 0%), bovine animals under 1 year of age (mean 0.6%, median 0.5%) and 0.7% broilers (mean 0.7%, median 0%), and as ‘low’ in isolates from fattening turkeys (mean 3.2%, median 0%) (Annex D).
Colistin resistance was most commonly observed in isolates from calves and turkeys. About half of the countries (5/9 MSs, 0/3 non‐MSs) reported resistant isolates from calves, at levels up to 2.3% in Belgium. Also, half of the countries (5/11 MSs, 1/1 non‐MSs) reported colistin resistance in isolates from fattening turkeys at levels up to 9.0% in Germany and 17.4% in Portugal. Colistin resistance was less common in isolates from pigs and broilers. Smaller proportions of the countries reported resistant isolates from pigs (6/28 MSs, 0/4 non‐MSs) and broilers (8/28 MSs, 0/3 non‐MSs). For pigs, levels ranged up to 9.0% in Portugal and for broilers up to 4.7% in Germany and Romania.
The statistical significance (p ≤ 0.05) of trends in colistin resistance was tested by logistic regression for countries reporting data for 3 years or more in the period 2014–2019 (see Annex A for details on methodology). At the MS‐group level, there are decreasing trends in isolates from broilers and turkeys and no trends for pigs and calves (Appendix E and Figure 37). In individual countries, the level of resistance has decreased for pigs in one MS (Germany) and increased in four MSs (France, Greece, Malta, Portugal) (Appendix E). For calves resistance has increased in one MS (Portugal) and for broilers resistance has decreased in one MS (Romania) (Appendix E). In isolates from turkeys, colistin resistance has decreased in two MSs (Italy, Spain) (Figure 37).
Figure 37.

Temporal trends in resistance to colistin in indicator E. coli from fattening turkeys, 2014–2018 (11 MSs). Statistically significant increase (↑) or decrease (↓) indicated (p ≤ 0.05)
The mandatory monitoring according to Decision 2013/652/EU is based on phenotypic susceptibility and does not discriminate between different resistance mechanisms. Therefore, molecular testing is required for inference regarding the underlying mechanisms of resistance and the presence of mcr‐genes.
4.2.6. Discussion
Studying AMR in commensal ‘indicator’ E. coli from caecal content of healthy food‐producing animals provides information on the reservoirs of resistant bacteria that could potentially be transferred between animals and between animals and humans. Such monitoring is therefore relevant for both animal and public health. AMR exhibited by indicator E. coli is likely to depend on several factors, such as the selective pressure from the use of antimicrobials in food‐producing animals, co‐selection of bacteria with multiple resistance, clonal spread of resistant bacteria and dissemination of genetic elements, such as plasmids, between bacteria.
Representative monitoring
The data on AMR in indicator E. coli used in the present report were collected over the years 2014 to 2019 in accordance with Commission Implementing. Decision 2013/652/EU. Those data are therefore harmonised with respect to sampling design, laboratory methodology, reporting and interpretation of resistance. Data collected previously may, however, be impacted by certain slight differences in methodology. Between 2014 and 2019, AMR data on indicator E. coli from fattening pigs and broilers were reported by nearly all MSs and can therefore be considered representative at the EU level. Over the same period, 10 MSs reported data for bovine animals under 1 year of age in 2015 and 2017 and 9 MSs in 2019. Eleven MSs reported data for turkeys in 2014, 2016 and 2018. As the MSs which are the main producers of meat derived from calves and turkeys in the EU are among the reporting MSs, those data can still be considered representative at the MS‐group level.
In this report, levels of resistance for each antimicrobial tested are presented as the percentage of resistant isolates for each reporting country. For the MS‐group, and or for the group of all reporting countries, levels are presented as the percentage of resistance in all isolates tested and as the median in each group. This makes it possible to appreciate the occurrence of resistance in food animal sectors in individual countries and the variation between reporting countries. However, they are poor indicators of the ‘true’ occurrence of resistance in a food animal sector at the EU‐level. A better estimate is a weighted mean based on the levels of resistance in individual countries weighted by the size of production relative to the production in EU. This accounts for differences in the size of production between MSs according to the same principle as used for the key outcome indicator, KOICS, within a MS (see Key outcome indicator of complete susceptibility). To appreciate the impact of the relative size of the production in MSs on the percentage of resistance in the MS‐group, weighted means were calculated for resistance in isolates of indicator E. coli from pigs (Annex D). The calculation showed that for ampicillin, tetracycline, sulfamethoxazole, chloramphenicol, ciprofloxacin and nalidixic acid the levels of resistance measured as percentage of resistance of all isolates tested were lower than the ‘weighted mean’ by 2.3‐6.3% (Annex D). For colistin, tigecycline, meropenem, azithromycin, ceftazidime, cefotaxime and gentamicin, the difference between the total and weighted mean values were less than 0.4 %.
General observations
At the MS‐group level, resistance to ampicillin, sulfamethoxazole, trimethoprim and tetracycline was common in indicator E. coli and reported by most MSs at ‘high’ or ‘very high’ levels in pigs and calves in 2019 and in broilers and turkeys in 2018. In poultry, resistance to ciprofloxacin and nalidixic acid was also common and several MSs reported ‘very high’ or ‘extremely high’ levels in both broilers and fattening turkeys. The common occurrence of resistance to those substances probably reflects a widespread past and present use of these antimicrobials in food‐producing animals in a number of MSs.
There were notable spatial differences in the levels of resistance to most antimicrobials as well as in occurrence of MDR, complete susceptibility and for the summary index KOICS. Regarding pigs and broilers, the situation was generally more favourable in northern than in southern and eastern Europe. The limited number of countries reporting data for calves and turkeys precludes valid conclusions on spatial differences, but the available data for turkeys indicate a similar spatial distribution as for pigs and broilers. For calves, the picture was more complex and although the most favourable situation was reported by the Nordic countries (Norway, Denmark), countries in southern (Portugal, Croatia) and central Europe (Switzerland) also reported favourable situations in comparison to neighbouring countries in these regions.
Overall, in several countries, there appear to be trends towards reduction of resistance in indicator E. coli, notably in broilers and turkeys. The positive trends in several countries are possibly to some extent due to the overall decline in sales of antimicrobials for use in animals since 2011, as noted in the recent ESVAC report (EMA, 2020). It should however be noted that in some countries, levels of resistance to individual antimicrobials, complete susceptibility and OICS were consistently stable at low levels and major changes cannot be expected.
Of the 13,487 isolates of indicator E. coli from pigs, calves, broilers and turkeys phenotypically tested in 2018 and 2019, resistance to carbapenems (meropenem) was not detected. This is a strong indication that carbapenem resistance is infrequent in E. coli from these food‐producing animals in Europe. Further information on carbapenem resistance is found in Section 5 ESBL.
Comparison of resistance in fattening pigs, bovine animals under 1 year of age, broilers and fattening turkeys at the EU MS‐group level
At the EU MS‐group level, there were no major differences in levels of resistance to gentamicin, cefotaxime, ceftazidime, meropenem, tigecycline, azithromycin and colistin between the four animal categories and median levels were ‘rare’, ‘very low’ or ‘low’ in all four animal categories, although individual countries reported considerably higher levels for some antimicrobials in some animal categories. Also, for sulfamethoxazole and trimethoprim were there no major differences and median levels were ‘high’ in all four animal categories.
In contrast, levels of resistance to some antimicrobials in MSs were higher in poultry than in pigs and calves. Thus, median levels of ampicillin resistance were ‘very high’ in broilers (55.0%) and turkeys (66.8%) but ‘high’ in pigs (36.0%) and calves (21.8%). Likewise, median levels of ciprofloxacin and nalidixic acid resistance were much higher in broilers (73.5%/64.1%) and turkeys (56.5%/34.8%) than in pigs (11.0%/3.9%) and calves (7.1%/5.5%). Additionally, median levels of chloramphenicol resistance were higher in turkeys (23.5%) than in pigs, calves and broilers (12.6–14.1%) and median levels of tetracycline resistance were higher in turkeys (61.2%) than in pigs, broilers and calves (43.2–50.6%). The data on occurrence of MDR and completely susceptible isolates also indicate that resistance was more common in isolates from poultry than in isolates from pigs and calves (see below).
The observed differences between animal species likely reflect a difference in the quantity of antimicrobials used in the different animal categories, but possibly also the mode of administration. In poultry, flock treatment is almost exclusively practised, whereas pigs and calves often are in some countries mainly treated individually.
Complete susceptibility and multidrug resistance in all reporting countries
Considering all reporting countries, the occurrence of E. coli isolates susceptible to all antimicrobial classes tested was lower in broilers (median 14.1%) and turkeys (21.4%) than in pigs (38.8%) and calves (53.9%). Conversely, MDR isolates were more common in broilers (median 45.7%) and turkeys (median 49.0%) than in pigs (median 30.6%) and calves (23.3%). In all animal populations, there were marked differences in levels of complete susceptibility, as well as in MDR, between countries. Generally, completely susceptible isolates from pigs, broilers and turkeys were more common in northern than in southern and eastern Europe whereas the converse situation was observed for MDR. For calves, there was no obvious spatial pattern, and a favourable situation was reported from the Nordic countries (Norway, Denmark) as well as in countries in southern and central Europe (Austria, Portugal, Croatia).
Tetracycline, ampicillin, sulfamethoxazole and trimethoprim were the antimicrobials most often represented in the patterns of MDR isolates, often in combination with other substances. About half of the MDR isolates from pigs (48.5%) and calves (54.5%) were resistant to all these antimicrobials and they were common also in MDR isolates from broilers (43.4% and turkeys (45.7%). Additionally, quinolone resistance was common in MDR isolates from broilers (78.9%) and turkeys (71.7%) but less common in isolates from pigs (24.8%) and calves (28.9%). The frequent occurrence of these substances as a core component of MDR patterns presumably reflects an extensive usage in several countries over many years and that genes conferring resistance to these substances often are linked on mobile genetic elements, resulting in co‐selection.
Key outcome indicator of complete susceptibility
The key outcome indicator KOICS accounts for differences in the relative size of food animal populations in a country in the evaluation of risks related to resistance. There were marked variations in KOICS between countries: in ten countries, levels of KOICS were < 20%, in 13 countries 20–40%, in seven countries 40–60%, in four countries 60–80% and in one country (Norway) > 80%. Lower KOICS were generally observed in countries in eastern and southern Europe and the highest in countries in the northern part.
Temporal trends in resistance
Statistical analyses of trends in resistance to ampicillin, ciprofloxacin, cefotaxime and tetracycline as well to levels of colistin resistance, levels of complete susceptibility and the key outcome indicator of complete susceptibility, KOICS, reveal a progress towards lower levels of resistance in several countries and also at the EU MS‐group level.
Considering all animal categories and reporting countries, there were 106 decreasing and 49 increasing trends in resistance to ampicillin, ciprofloxacin, cefotaxime or tetracycline in the period 2009–2019. For all four antimicrobials there were more decreasing than increasing trends. Notably, for turkeys, there were 15 decreasing but no increasing trends in the 11 countries evaluated. For tetracycline there were 39 decreasing and six increasing trends and at the MS‐group level resistance to this antimicrobial has decreased significantly in pigs, broilers and turkeys. At the MS‐group level there were also decreasing trends in resistance to ampicillin and ciprofloxacin in broilers and turkeys. Notably, in the Netherlands, resistance has decreased to all four antimicrobials in pigs, broilers and calves. Also, at the MS‐group level resistance to colistin has decreased in broilers and turkeys but increased in pigs.
For levels of complete susceptibility, there were 28 increasing and four decreasing trends in the reporting countries in the period 2014–2019. Levels of complete susceptibility in isolates from pigs have increased in seven of the 29 reporting countries and decreased in two countries. For calves, the level has increased in three of the 11 reporting countries and decreased in no country and for broilers, the level has increased in 11 of the 30 reporting countries and decreased in two countries and in turkeys the level has increased in seven countries and decreased in no country. At the MS‐group level there were increasing trends in complete susceptibility for both broilers and turkeys.
The summary indicator KOICS, has in most countries been stable at a high or a low level. In 12 countries there were however significant trends towards a higher KOICS whereas in 3 countries there were trends towards decreasing values. Trends in complete susceptibility of isolates from pigs was usually reflected in KOICS whereas trends in isolates from calves, broilers and turkeys had smaller impact and were not always mirrored in the summary index.
Resistance to critically important antimicrobials (CIA)
Of the antimicrobials tested in the mandatory monitoring of indicator E. coli from caecal content, ciprofloxacin (fluoroquinolones), cefotaxime and ceftazidime (third‐generation cephalosporins), colistin (polymyxin E) and azithromycin (macrolides) are categorised by the WHO as CIA and among substances of the highest priority (WHO, 2019). Bacteria resistant to these antimicrobials in food‐producing animals is therefore of particular interest due to the risk of spread to humans along the food chain.
Median levels of phenotypic resistance to third‐generation cephalosporins (cefotaxime and ceftazidime) at the MS‐group level were overall ‘low’ in pigs, broilers and turkeys and ‘very low’ in calves. For each animal category, about two‐thirds of the countries reported isolates at levels up to at most 5.9% in pigs, 5.6% in calves, 7.1% in turkeys and 30.1% in broilers. Within the mandatory monitoring, samples of caecal content are also cultured on selective media to specifically detect the presence of E. coli resistant to third‐generation cephalosporins. The results of these analyses are presented in Section 5 ESBL.
Nalidixic acid resistance in isolates from pigs and calves were recorded at ‘low’ or ‘moderate’ median levels at the MS‐group level. In contrast, median levels of ciprofloxacin resistance were ‘extremely high’ in broilers and ‘very high’ in turkeys and levels of nalidixic acid resistance was ‘very high’ in broilers and ‘high’ in turkeys. At the MS‐group level there are decreasing trends in resistance to ciprofloxacin in E. coli isolates from broilers and turkeys. Notably, a substantial proportion of isolates from all animal categories were resistant to ciprofloxacin but not to nalidixic acid which indicates presence of transmissible genes mediating quinolone resistance.
‘Microbiological’ resistance to both ciprofloxacin and third‐generation cephalosporins was observed in only 168 of the 13,487 E. coli isolates tested in 2018 and 2019, 70 of these isolates also showed ‘clinical’ resistance to both substances. The levels of ‘microbiological’ co‐resistance were higher in broilers (2.1%) and turkeys (1.5%) than in pigs (0.5%) and calves (06%).
Median levels of azithromycin resistance in MSs were ‘very low’ in calves and ‘low’ in pigs, broilers and turkeys. Most countries reported no azithromycin resistance or single isolates only, but a few countries reported higher levels, up to about 10% for broilers and turkeys and up to 16.2% for pigs. Azithromycin is an azalide antimicrobial, a subgroup of the macrolides, not used in animals. Possibly, selection pressure exerted by use of other macrolides, e.g. tylosin, in food‐producing animals, may have favoured emergence of azithromycin resistance.
Altogether only 137 of the 13,598 isolates tested in 2018 and 2019 showed phenotypic resistance to colistin. Median levels of colistin resistance in the MS‐group were 0% for pigs, broilers and turkeys and 0.6% in calves. Higher levels were however reported in individual countries, up to 17.4% in turkeys, 4.7% in broilers, 3.4% in pigs and 2.4% in calves. In the MS group, there are statistically significant decreasing trends in resistance in E. coli isolates from broilers and turkeys whereas levels in pigs have increased. Colistin resistance is likely due to selection from use of colistin in animal production and the high occurrence in some animal categories in individual countries indicates large differences in the usage of colistin in Europe, as documented in the ESVAC report (EMA, 2020).
5. Extended‐spectrum β‐lactamase (ESBL)‐, AmpC‐ and/or carbapenemase‐producing Salmonella and Escherichia coli 18
All ESBL‐, AmpC‐ or carbapenemase‐producers prevalence and occurrence Tables from the 2018 and 2019 monitoring, as well as the tables on occurrence of resistance (panel 1 and panel 2) mentioned in this chapter can be found in the Annex E and the Salmonella spp. E. coli or ESBL Microsoft Excel documents available on Zenodo at: https://doi.org/10.5281/zenodo.4557180. Materials and methods are included in the Annex A and can be found under the same link.
The occurrence of ESBL, AmpC or carbapenemase‐producing bacteria in the intestinal flora of animals is undesirable, as it might lead to dissemination of resistant bacteria from animals and food to humans. Bacteria from animals with such resistance should also be considered as a reservoir of resistance genes which may be transferable to other bacteria including food‐borne zoonoses, such as Salmonella spp., further adding to the potential public health consequences. The epidemiology of ESBL‐, AmpC‐ and carbapenemase‐producing E. coli is complex and the performance of a harmonised monitoring to specifically investigate their prevalence in healthy animals and food derived thereof provides additional information to the data already available in different countries.
As outlined in Commission Implementing Decision 2013/652/EU, the specific monitoring of ESBL‐/AmpC‐/carbapenemase‐producing E. coli in caecal samples of fattening pigs and bovine animals under 1 year of age, as well as pig meat and bovine meat gathered at retail was mandatory in 2019, whereas the specific monitoring in caecal samples of broilers, fattening turkeys and fresh broiler meat sampled at retail was mandatory in 2018. In 2019, the specific monitoring was carried out by 28 MSs and four non‐MSs for meat from bovine animals, by 28 MSs and three non‐MSs for fattening pigs and meat from pigs and by nine MSs and two non‐MSs for bovine animals under 1 year of age. In 2018, the monitoring was performed by 28 MSs and four non‐MSs for broiler meat, 28 MSs and three non‐MSs for broilers and 11 MSs and one non‐MS for fattening turkeys.
The classification of isolates as being ESBL‐, AmpC‐ or carbapenemase‐producing is based on the phenotype of the isolates (done according to criteria described in Materials and Methods, Annex A). Most, but not all, isolates resistant to extended spectrum cephalosporins (ESC) are therefore classified into these categories. However, not all classified isolates, in particular those exhibiting an AmpC phenotype, do necessarily carry any transferrable genes.
5.1. Routine antimicrobial resistance monitoring in food‐producing animals and derived meat: presumptive ESBL/AmpC/CP producers
In 2018 and 2019, third‐generation cephalosporin resistance was identified in Salmonella spp. from broilers, fattening turkeys and laying hens and from carcases (meat) of broilers, pigs and bovine animals under 1 year of age, as well as in indicator E. coli isolates from broilers, fattening turkeys, fattening pigs and bovine animals under 1 year of age, within the framework of the routine monitoring.19
5.1.1. ESC resistance and ESBL/AmpC phenotypes in Salmonella spp.
The proportion of ESC resistant Salmonella spp. isolates (tested with panel 2) collected within the routine monitoring was generally low in 2018 and 2019 (ranging between 0 and 2.6% of the investigated isolates, depending on the animal population, Annexes B.2 and B.3). The occurrence of ESC‐resistant Salmonella isolates from a specific animal population can be largely affected by the particular situation in certain countries. As an example, 70% of the Salmonella isolates from broilers derived from one single MS in 2018 (see Section 2, Salmonella for further details). At the reporting MS‐group level, the occurrence of presumptive ESBL, AmpC or ESBL+AmpC‐producing Salmonella spp. was 2.1% in broilers, 2.6% in turkeys, 0.2% in laying hens, 0.4% in fattening pigs and 0% in bovine animals under 1 year of age (Table 12). In broilers and turkeys, the occurrence of the ESBL phenotype was greater than that of the AmpC phenotype. Detailed data per country and matrix can be found in Annex E.2 and E.3.
Table 12.
Summary of presumptive ESBL‐/AmpC‐producing Salmonella spp. from animals and meat (carcases) and indicator E. coli from caecal samples collected within the routine monitoring, EU MSs 2018/2019
| Matrix | Presumptive ESBL and/or AmpC producersa n (%R) | Presumptive ESBL producersa, b n (%R) | Presumptive AmpC producersa, c n (%R) | Presumptive ESBL + AmpC producersa, d n (%R) | Presumptive CP producerse n (%R) |
|---|---|---|---|---|---|
| Salmonella | |||||
| Broiler meat (N = 873, 19 MSs) | 1 (0.1) | 1 (0.1) | 1 (0.1) | 1 (0.1) | 0 |
| Broilers (N = 2,084, 24 MSs) | 43 (2.1) | 40 (1.9) | 9 (0.4) | 6 (0.3) | 0 |
| Fattening turkeys (N = 815, 16 MSs) | 21 (2.6) | 21 (2.6) | 3 (0.4) | 3 (0.4) | 0 |
| Laying hens (N = 1,184, 24 MSs) | 2 (0.2) | 1 (0.1) | 1 (0.1) | 0 | 0 |
| Pig meat (N = 1,088, 26 MSs) | 4 (0.4) | 2 (0.2) | 1 (0.1) | 0 | 0 |
| Bovine meat (N = 91, 7 MS) | 0 | 0 | 0 | 0 | 0 |
| E. coli | |||||
| Broilers (N = 4,165, 28 MSs) | 115 (2.8) | 82 (2.0) | 38 (0.9) | 5 (0.1) | 0 |
| Fattening turkeys (N = 1,674, 11 MSs) | 35 (2.1) | 31 (1.9) | 5 (0.3) | 1 (0.1) | 0 |
| Fattening pigs (N = 4,296, 28 MSs) | 57 (1.3) | 43 (1.0) | 15 (0.3) | 1 (< 0.1) | 0 |
| Bovines, < 1 year (N = 1,712, 9 MSs) | 19 (1.1) | 17 (1.0) | 2 (0.1) | 0 | 0 |
N: total of isolates reported for this monitoring by the MSs; n: number of the isolates resistant; %R: percentage of resistant isolates; ESBL: extended‐spectrum b‐lactamase; MSs: EU Member States.
According to EUCAST Guidelines (EUCAST, 2017), only isolates showing an MIC > 1 mg/L for cefotaxime and/or ceftazidime (screening breakpoint) were considered (see Annex A, Materials and methods).
All isolates showing clavulanate synergy with cefotaxime, ceftazidime or with both compounds, suggesting the presence of an ESBL (independently of the presence of other mechanisms).
Isolates with microbiological resistance to cefoxitin, suggesting the presence of an AmpC enzyme (independently of the presence of other mechanisms).
Isolates showing synergy with cefotaxime or ceftazidime and with microbiological resistance to cefoxitin, suggesting the presence of ESBL and AmpC enzymes in the same isolate. These isolates are also included in the ESBL and AmpC columns.
Isolates with microbiological meropenem resistance.
5.1.2. ESC resistance and ESBL/AmpC phenotypes in indicator E. coli
The proportion of ESC‐resistant indicator E. coli isolates (tested with panel 2) collected within the routine monitoring was generally low in 2018 and 2019 (ranging between 1.2 and 2.8% of the investigated isolates, depending on the animal population (Annex D). Among the reporting MSs, the occurrence of ESC resistance varied from 0% to 5.9% in fattening pigs, from 0% to 4.1% in bovines under 1 year of age, from 0% to 30.1% in broilers and from 0% to 7.1% in fattening turkeys (see chapter 4, E. coli, for further details). When only considering the isolates of indicator E. coli with ESBL/AmpC‐production, similar variations in occurrences are observed. At the MS‐group level, the occurrence of presumptive ESBL, AmpC or ESBL+AmpC‐producers in indicator E. coli was 2.8% in broilers, 2.1% in turkeys, 1.3% in fattening pigs and 1.1% in bovine animals under 1 year of age (Table 12). For all matrices, the ESBL phenotype was more frequent than the AmpC phenotype. Detailed data per matrix and country can be found in Annex E.2. and E.3.
5.2. Specific monitoring of ESBL/AmpC‐producing E. coli in food‐producing animals and derived meat
5.2.1. Prevalence and occurrence of presumptive ESBL/AmpC/CP producers
The specific monitoring20 of ESBL and AmpC producers employs culture of samples on selective media (containing cefotaxime at 1 mg/L, as recommended by EUCAST), which can detect very low numbers of resistant isolates present within a sample. The occurrence and prevalence of E. coli exhibiting ESBL, AmpC or ESBL+AmpC phenotypes from the food‐producing animal populations and derived meat, assessed at the reporting MS‐group level, are presented in Table 13. The prevalence of presumptive ESBL or AmpC‐producing E. coli for all matrices tested in 2018 and 2019 are shown in Figure 38. Detailed prevalence and occurrence data per country and matrix can be found in Annex E.2 and E.3.
Table 13.
Summary of presumptive ESBL‐/AmpC‐producing E. coli from food‐producing animals and derived meat, specific monitoring, EU MSs, 2018/2019
| Matrix | Presumptive ESBL and/or AmpC producersa | Presumptive ESBL producersb | Presumptive AmpC producersc | Presumptive ESBL and AmpC producers | |||||||
|---|---|---|---|---|---|---|---|---|---|---|---|
| n | Prev % | N | Occ % | Prev % | n | Occ % | Prev % | n | Occ % | Prev % | |
| Pig meat – 2019 (28 MSs, Ns = 6,793, N = 444) | 443 | 6.8 | 361 | 81.3 | 5.6 | 97 | 21.8 | 1.5 | 15 | 3.4 | 0.2 |
| Bovine meat – 2019 (28 MSs, Ns = 6,308, N = 292) | 292 | 5.2 | 255 | 87.3 | 4.5 | 43 | 14.7 | 0.8 | 6 | 2.1 | 0.1 |
| Broiler meat – 2018 (28 MSs, Ns = 7,424, N = 2,970) | 2,943 | 39.8 | 1,896 | 63.8 | 25.7 | 1,190 | 40.1 | 16.1 | 143 | 4.8 | 1.9 |
| Pigs – 2019 (28 MSs, Ns = 6,792, N = 2,923) | 2,899 | 42.7 | 2,318 | 79.3 | 34.1 | 661 | 22.6 | 9.7 | 79 | 2.7 | 1.2 |
| Bovines < 1 year – 2019 (9 MSs, Ns = 2,688, N = 1,215) | 1,205 | 46.4 | 1,123 | 92.4 | 43 | 120 | 9.9 | 4.6 | 38 | 1.4 | 1.1 |
| Broilers – 2018 (28 MSs, Ns = 9,049, N = 4,037) | 3,982 | 48.3 | 2,628 | 65.1 | 31.9 | 1,558 | 38.6 | 18.9 | 204 | 5.1 | 2.5 |
| Turkeys – 2018 (11 MSs, Ns = 2,926, N = 1,082) | 1,072 | 39.3 | 925 | 85.5 | 33.9 | 215 | 19.9 | 7.9 | 68 | 6.3 | 2.5 |
Ns: Number of animal/meat samples; N: Number of isolates tested; n: Number of resistant isolates; % Occ: Percentage of cephalosporin‐resistant isolates presenting a presumptive phenotype; % Prev: Percentage of samples harbouring a presumptive ESBL/AmpC‐producing E. coli; ESBL; extended‐spectrum β‐lactamase.
Isolates exhibiting only ESBL‐ and/or only AmpC‐ and/or ESBL+AmpC‐phenotype.
Isolates exhibiting an ESBL‐ and/or ESBL+AmpC‐phenotype.
Isolates exhibiting an AmpC and/or ESBL+AmpC‐phenotype.
Figure 38.

- Blue diamonds show the assessed prevalence at the MS‐group level.
Regarding food‐producing animals, marked variations in the prevalence of presumptive E. coli ESBL and/or AmpC‐producers21 were observed among the MSs, as it ranged from 2.1% (Cyprus) to 99.2% (Italy) in fattening pigs, from 7.8% (Denmark) to 99.6% (Italy) in bovine animals under 1 year of age, from 10.3% (United Kingdom) to 100% (Malta) in broilers and from 0% (Sweden) to 91% (Spain) in fattening turkeys (Figures 40 and 42, Annex E.2 and E.3). Important differences among the reporting countries were also evident when assessing the prevalence of ESBL or AmpC producers separately (Annex E.2 and E.3).
Figure 40.

Spatial distribution of the prevalence of presumptive ESBL and/or AmpC‐producing E. coli from (a) broilers in 2018, (b) fattening turkeys in 2018, (c) fattening pigs in 2019 and (d) bovines under 1 year of age in 2019, EU MSs and non‐ MSs, 2018/2019
Figure 42.

- The upper bounds of the 95% confidence interval of the prevalence of ESBL‐ and/or AmpC‐producing E. coli are also indicated. Please note the different scales used for the x‐axis in the sub‐figures to improve the visibility of the variations among countries.
Regarding meat, the prevalence of presumptive E. coli ESBL and/or AmpC‐producers3 in meat from broilers varied markedly among the MSs, ranging from 11.6% (Malta) to 78.0% (Spain), whereas the prevalence recorded in meat from pigs and bovine animals was less diverse, ranging from 0% (Finland and the Netherlands) to 24.4% (Portugal) for pig meat and from 0.3% (United Kingdom) to 24.0% (Bulgaria) for bovine meat (Figures 39 and 41, Annex E.2 and E.3). The differences among reporting countries withstands also when assessing the prevalence of ESBL or AmpC producers separately (Annex E.2 and E.3).
Figure 39.

Spatial distribution of the prevalence of presumptive ESBL and/or AmpC‐producing E. coli from (a) meat from broilers in 2018, (b) meat from pigs in 2019 and (c) meat from bovines in 2019, EU MSs and non‐ MSs, 2018/2019
Figure 41.

- The upper bounds of the 95% confidence interval of the prevalence of ESBL‐ and/or AmpC‐producing E. coli are also indicated.
5.2.2. Relative abundance of presumptive ESBL/AmpC producers
As only one isolate per sample is to be further investigated, the relative abundance of E. coli with an ESBL or AmpC phenotype present in the sample influences the probability of detecting either phenotype. In the animal populations/food matrices monitored, at the reporting MS‐group level and in the majority of the countries, the detection of presumptive ESBL E. coli exceeded that of presumptive AmpC E. coli (Figures 39 , –41 and Annex E). Nevertheless, the occurrence of the different phenotypes varied considerably among the MSs. After excluding the MSs with less than 10 isolates tested, the occurrence of the ESBL phenotype ranged from 20.5% (Sweden) to 97.5% (Bulgaria) in fattening pigs; from 52% (Denmark) to 98.5% (Italy) in bovines under 1 year of age; from 13.2% (Finland) to 93.4% (Latvia) in broilers; from 40.8% (Hungary) to 96.9% (Spain) in fattening turkeys, from 41.7% (Denmark) to 100% (Bulgaria and Greece) in meat from pigs; from 66.7% (Denmark and Poland) to 100% (Portugal, Slovakia and Spain) in meat from bovine; and from 19.6% (Finland) to 96.4% (Luxembourg) in meat from broilers (Annex E.2 and E.3).
Figure 43.
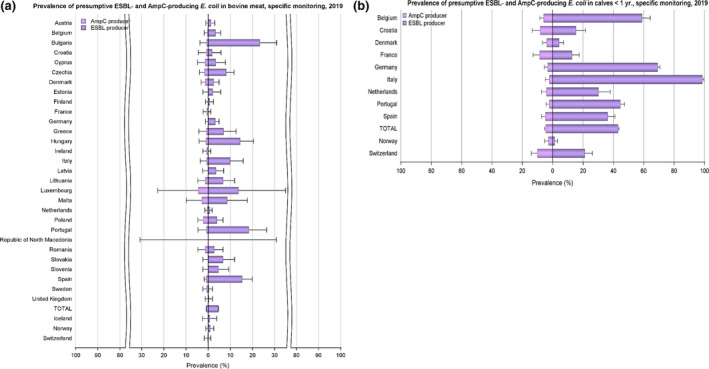
- The upper bounds of the 95% confidence interval of the prevalence of ESBL‐ and/or AmpC‐producing E. coli are also indicated. Please note the different scales used for the x‐axis in the sub‐figures to improve the visibility of the variations among countries.
5.2.3. Temporal trends in prevalence of presumptive ESBL/AmpC/CP producers
The temporal trend in prevalence of presumptive ESBL and AmpC‐producing E. coli in each separate animal population and meat category since the start of the harmonised monitoring is presented at both reporting country and MS‐group levels in Figures 44 and 45.
Figure 44.

- The upper bounds of the 95% confidence interval of the prevalence of ESBL‐ and/or AmpC‐producing E. coli are also indicated. Please note the different scales used for the x‐axis in the sub‐figures to improve the visibility of the variations among countries (a, 0–100%; b‐c, 0–30%). (↑)/(↓): indicates statistically significant decreasing/increasing trends over the 2015–2019 period. Rates of change are shown only for the statistically significant decreasing/increasing trends observed.
Figure 45.

- The upper bounds of the 95% confidence interval of the prevalence of ESBL‐ and/or AmpC‐producing E. coli are also indicated. (↑)/(↓): indicates statistically significant decreasing/increasing trends over the 2015–2019 period. Rates of change are shown only for the statistically significant decreasing/increasing trends observed.
The prevalence of presumptive ESBL‐, AmpC‐ or ESBL+AmpC‐producing E. coli assessed in fattening pigs (42.7%), bovine animals under 1 year of age (36.4%), meat from pigs (6.7%) and meat from bovine animals (4.9%) in 2019 is comparable with that assessed in the same animal populations and meat in the previous years (i.e. 2015 and 2017). Likewise, the prevalence of presumptive ESBL‐, AmpC‐ or ESBL+AmpC‐producing E. coli assessed in broilers (48.3%) and fattening turkeys (39.3%) in 2018 is similar to that assessed in the same poultry populations in 2016. Notably, the prevalence in meat from broilers in 2018 (39.8%) is markedly lower than that assessed in 2016 (57.4%). This decrease was also evident when only those MSs having reported consistently for both these years are included in the comparison (from 57.4% to 41.9%).
However, the situation overall regarding ESBL, AmpC or ESBL+AmpC producing E. coli are slightly improving at the MS‐group level. Statistically significant decreasing trends are demonstrated in two of four animal populations (broilers and turkeys) and all three meat categories when only those MSs having reported consistently for all years are included in the comparison. In bovine animals under 1 year of age, no statistically significant trend is discerned. Furthermore, in fattening pigs, an increasing trend is detected.
Concordantly, it is worth noting that the slight decreases at the reporting MS‐group level may mask more important decreases registered in several MSs. A decreasing trend in prevalence is observed in many of the reporting countries, and certain MSs report a considerable improvement over the study period. The improvement is however not uniform and some MSs have reported consistently high or very high prevalence.
Detailed information of the prevalence obtained by country and matrix for 2019 and 2018 monitoring can be found in Annex E. For 2015–2017, detailed data can be found in EFSA and ECDC, 2017, 2019a, 2019b, respectively.
5.2.4. Key Outcome Indicator of prevalence of ESBL and/or AmpC producers
The proportion of samples from broilers, fattening turkeys, fattening pigs and bovines under 1 year of age, weighted by PCU, that are identified as positive for presumptive ESBL and/or AmpC‐producing indicator E. coli in the framework of the specific monitoring for ESBL‐/AmpC‐/carbapenemase‐producing indicator E. coli according to Commission Implementing Decision 2013/652/EU has been retained as a summary indicator. Resistance to 3rd‐ and 4th‐generation cephalosporins can provide insight on the selection for ESBL encoding plasmids due to veterinary antimicrobial usage and on abundance of AmpC‐expressing isolates.
One of the most medically relevant forms of AMR is mediated by plasmid‐encoded ESBL genes (EFSA BIOHAZ Panel, 2011; Maslikowska et al., 2016). In contrast, the AmpC β‐lactamases in E. coli are often chromosomally encoded and upregulated by overexpression of existing AmpC genes (Handel et al., 2014). Genes for AmpC can also be located on plasmids and transferred between strains.
There are many different enzymes that can destroy the β‐lactam ring (Pimenta et al., 2014), with a corresponding variety of genes and plasmids (Chong et al., 2011). The observation that ESBL‐carrying isolates from humans are often more related to chicken isolates than are susceptible isolates indicates that a proportion of ESBL and/or AmpC‐encoding isolates from agricultural settings may be of importance in human health care situations (Torneke et al., 2015). Plasmids carrying ESBL encoding genes can be transferred rapidly between E. coli strains (Handel et al., 2015) and selection can be driven by the use of many β‐lactam antimicrobials (Cavaco et al., 2008).
To account for differences in the relative size of food animal populations in a country, a weighted Key Outcome Indicator of the prevalence of ESBL‐ and/or AmpC‐producing E. coli (KOIESC) was calculated. The indicator is the weighted mean of the prevalence of ESBL‐ and/or AmpC‐producing E. coli in each of the four animal populations monitored. For the calculation of the mean, the value for each population was weighted in relation to the relative size of the populations within a country using the ‘population correction unit’ (PCU). PCU is a technical unit of measurement used as an indicator of animal population size and was developed by the EMA, primarily to estimate sales of antimicrobials corrected by the animal population in individual countries. The data sources and methodology for the calculation of PCU are comprehensively described in EMA's report ‘Sales of veterinary antimicrobial agents in 31 European countries in 2017’ (EMA, 2019). For each country, KOIESC was calculated using data reported for 2 consecutive years. Thus, values for 2015–2016 were calculated from data reported for fattening pigs and bovines under 1 year of age in 2015 and on data for broilers and fattening turkeys reported in 2016. Likewise, values for 2016–2017 were calculated from data for broilers and fattening turkeys reported in 2016 and on data for fattening pigs and bovines under 1 year of age reported in 2017 and so on.
Assessed on the reporting MS‐group level, the KOIESC for 2018–2019 was high at 45.2% but has decreased slightly by 8%, still in a statistically significant manner, since 2015–2016 (Figure 46 and Annex E.4). The KOIESC differs greatly among countries and ranged from 6.1% in Finland to 88.9% in Italy. Furthermore, although eight countries (5 MSs and 3 non‐MSs) have an KOIESC on a moderate or lower level, fifteen countries (all MSs) have an KOIESC on a very high or extremely high level. A positive development manifested by a decreasing trend in the KOIESC is seen in fourteen countries (13 MSs and 1 non‐MS). Still, in seven of these countries (all MSs), some decreases are observed starting from very high or extremely high levels, and one country (Spain) still has an KOIESC on an extremely high level despite a decreasing trend. For 10 MSs, the KOIESC has remained stable, with no statistically significant trend discerned in any direction, over the period of study. Still, five MSs show an increasing trend in their KOIESC and all of these on at least a high level.
Figure 46.

Changes in Outcome Indicator of ESBL‐ and/or AmpC producing E. coli (OIESC), 28 EU MSs and 3 non‐MSs, 2015–2019
5.2.5. Summary and discussion
As the classification of isolates as being ESBL‐, AmpC‐ or ESBL+AmpC‐producing is based on the phenotype of the isolates, not all classified isolates, in particular those exhibiting an AmpC phenotype, do necessarily carry any transferrable genes. Molecular investigations would be needed to show whether the isolates carry any transferrable genes encoding resistance to ESC. Such investigations are however not mandatory.
Overall, the specific monitoring highlighted that presumptive ESBL‐, AmpC‐ or ESBL+AmpC‐producing E. coli were frequently observed in caecal samples of all investigated animal populations monitored. The prevalence varies among the animal populations. However, as not all countries report data on turkeys and bovines under 1 year of age the difference should be interpreted with caution (according to the Commission Implementing Decision, monitoring of those animal populations is mandatory only in those countries with a production greater than 10,000 tonnes slaughtered per year).
In all monitored animal populations/food matrices, the ESBL‐producing phenotype was more common than the AmpC‐producing phenotype at the reporting MS‐group level and in the majority of the reporting countries. The occurrence of the different phenotypes did however vary considerably among the MSs and in some countries the AmpC phenotype dominated. Also, as only one isolate per sample is to be further investigated the relative abundance of bacteria with an ESBL and/or AmpC phenotype present in the sample will influence the probability of detecting either phenotype.
The prevalence of presumptive ESBL‐, AmpC‐ or ESBL+AmpC‐producing E. coli in broiler meat was slightly lower but still comparable to that reported in broilers at slaughter. Conversely, the prevalence of ESBL, AmpC or ESBL+AmpC‐producing E. coli in meat of pigs and bovine animals was much lower than that assessed in fattening pigs and bovines under 1 year of age at slaughter. The range in prevalence of these phenotypes in pig and bovine meat by different MSs also tended to be narrower than that observed in the caecum of these animals at slaughter. The findings suggest that many of these animals are carrying ESBL, AmpC or ESBL+AmpC‐producing E. coli in their intestinal content, but that the bacteria do not contaminate the carcases during the slaughter process, alternatively that the bacteria do contaminate the carcases but are somehow removed later in the process. This may be impacted by differences in the slaughter process applied to broilers compared with those applied to pigs and bovine animals. Furthermore, it is worth noting that there may be several potential sources for bacteria on meat, including the animals from which the meat was derived, other cross‐contaminating products, machinery and the environment, as well as those workers who are handling the meat. Even if the origin of the isolates does not affect the risk for public health, this is of importance when elaborating on effective risk management strategies.
5.3. Monitoring of carbapenemase‐producing E. coli
5.3.1. Mandatory E. coli ESBL/AmpcC/Carbapenemase‐producers monitoring
The specific monitoring of ESBL/AmpC‐producing E. coli on selective media (including cefotaxime) also enables the detection of isolates with some mechanisms of carbapenem resistance. In 2019, one isolate with carbapenemase phenotype from a caecal sample collected at slaughter from pigs (Spain) and one isolate from meat from bovines (Republic of North Macedonia) were detected. These isolates are all pending confirmation. Isolates with carbapenemase phenotype and producing VIM‐1 from pig caecal samples were reported by Germany in both 2015 and 2017. Those isolates belonged to different genetic types which indicate that the occurrence of the bla‐VIM‐1 gene is not restricted to a specific type of E. coli (EFSA and ECDC, 2017).
Within the 2018 mandatory ESBL/AmpC monitoring, no isolates of carbapenem‐resistant E. coli were detected. In 2016, isolates of suspected carbapenem‐resistant E. coli were detected in broiler meat samples from Cyprus. However, further analysis of the isolates did not confirm these suspicions.
5.3.2. Voluntary specific carbapenemase‐producers monitoring
In 2018 and 2019, specific monitoring of carbapenemase‐producing microorganisms using selective media for carbapenemase producers, in accordance with a protocol developed by the EURL on AMR,22 , 23 was performed on a voluntary basis by a number of countries (Annex E.4.; see Annex A, materials and methods). Together during the 2 years, 20 countries (18 MSs and 2 non‐MSs) investigated 5,712 samples from fattening pigs; 1,778 samples from bovines under 1 year of age; 6,168 samples from broilers; 2,419 samples from fattening turkeys, 3,721 samples of meat from pigs, 2,729 samples of meat from bovines and 4,615 samples of meat from broilers giving a grand total of 27,142 samples. Among those, suspected carbapenemase‐producing E. coli was detected in one sample of meat from pigs (Germany) and two samples from fattening pigs (one from Italy and one from Romania; Annex E.5.). Moreover, using additional voluntary sampling on farms, Germany detected two additional suspected carbapenemase‐producing E. coli from fattening pigs. The three isolates from Germany have been confirmed to carry bla VIM‐1 (pig meat), bla OXA‐48 (fattening pig) and bla GES‐5 (fattening pig), respectively (Irrgang et al., 2020; Pauly et al., 2021). The remaining isolates are pending confirmation. The results are generally in accordance with the results of the voluntary monitoring performed in 2015–2017. In these years, a total of 6,751 (2015), 11,935 (2016) and 16,296 (2017) samples, respectively, were investigated and only 5 of these samples generated suspected carbapenemase‐producing E. coli. Three of these, two from broilers and one from meat from broilers, isolated by Romania have been confirmed as bla OXA‐162 (bla oxa‐48‐like) carriers. The other two isolates, one isolate from broiler meat and one from broiler, reported in 2016 by Cyprus, were not confirmed as CP‐producers.
For 2018 and 2019, the Netherlands also reported data on additional specific monitoring of carbapenemase‐producing E. coli in broilers, fattening pigs and bovines under 1 year of age using a different isolation protocol (EFSA and ECDC 2019 EUSR 2018). All these samples (n = 1,814) were negative.
5.3.3. Summary and discussion
Among all samples and isolates investigated within the harmonised monitoring in 2018 and 2019, seven E. coli with elevated MIC to meropenem were detected (one from a fattening pig and one from meat from bovines within the specific monitoring of ESBL/AmpC‐producing E. coli on selective media, and one from pig meat and four from fattening pigs not within the specific voluntary monitoring of carbapenemase‐producing microorganisms using selective media for carbapenemase producers).
As the total number of suspected carbapenemase‐producing E. coli isolated within the monitoring is still low it is difficult to say whether the higher number of isolates in 2019 compared to previous years is the beginning of an increasing trend or just a coincident. Regardless, the occurrence of carbapenemase‐producing E. coli among farm animals and meat derived thereof in several countries are of concern. Due to the public health importance of carbapenemase‐producing E. coli and/or Salmonella, both as pathogens and as vectors for resistance mechanisms there is a need to follow further developments in this area for farm animals and food derived thereof. Especially as carbapenemase‐producing Enterobacteriaceae has been reported, not only in farm animals and food derived thereof but also from vegetables from many parts of the world including Europe (Zurfluh et al., 2015; Touati et al., 2017; Brouwer et al., 2018; Köck et al., 2018; Liu et al., 2018; Irrgang et al., 2019, 2020). In addition, a number of closely related but not identical plasmids carrying the carbapenem resistance gene bla VIM‐1 have been found in isolates from livestock in Germany (Pauly et al., 2021). However, as carbapenemase‐producing E. coli is probably still rare among the investigated animal species in Europe, potential actions to preserve this situation can hopefully still be effective ensuring that farm animals do not become an important source of such bacteria for humans.
Furthermore, it should be noted that there are several potential sources for bacteria on meat, including the animals from which the meat was derived, other cross‐contaminating products, machinery and the environment, as well as those workers who are handling the meat product. Even if the origin of the isolates does not affect the risk for public health, it is of importance when elaborating on effective risk management strategies.
6. Antimicrobial resistance in meticillin‐resistant Staphylococcus aureus 24
Monitoring of meticillin‐resistant Staphylococcus aureus (MRSA) in food‐producing animals, particularly those intensively reared, carried out periodically in conjunction with systematic surveillance of MRSA in humans, allows trends in the diffusion and evolution of zoonotically acquired MRSA in humans to be identified (EFSA, 2009a,b, 2012). Isolates representative of various animal and food origins should therefore optimally be analysed for determination of lineage, antimicrobial susceptibility and virulence‐associated traits. The monitoring of MRSA in animals and food is currently voluntary and only a limited number of countries reported MRSA occurrence data in 2018 and 2019, with some countries additionally reporting data on spa and/or sequence type and antimicrobial susceptibility. Such monitoring may provide an early indication of the occurrence of types of MRSA in animals which have previously not been recognised in animal populations. Furthermore, monitoring of other non‐food animal species, with which certain types of MRSA can be associated, provides additional useful information.
MRSA has been recognised for decades as a serious cause of infections in humans. Strains of MRSA that cause infections in humans can be divided into three broad categories: community‐associated (CA‐), healthcare‐associated (HA‐) and livestock‐associated (LA‐)MRSA. Strains assigned to these different categories of MRSA differ in their epidemiology, although distinctions between types can be blurred. LA‐MRSA has been detected in pigs, poultry and veal calves, as well as in other farm animal species, companion animals and horses in many countries worldwide. LA‐MRSA isolates in Europe predominantly belong to clonal complex (CC) 398, although other livestock‐associated clonal lineages have been reported. HA‐MRSA and CA‐MRSA comprise strains that predominantly affect humans, and these strains are much less frequently reported from food‐producing animals. LA‐MRSA may be carried by humans, especially those persons who have repeated occupational contact with colonised livestock or their derived carcases (Graveland et al., 2010; Boost et al., 2013). The severity of LA‐MRSA infection in humans has been shown to be generally similar to that of other MRSA strains. Indeed, public health surveillance in the Netherlands (2003–2014) and Denmark (1999–2011) detected distinct LA‐MRSA strains disseminating into the community (the Netherlands) or capable of transmission in the community in the absence of livestock contact (Denmark; Kinross et al., 2017).
A variant of the meticillin resistance gene mecA, termed mecC, was identified in 2011 in MRSA from humans and cattle in Europe (García‐Álvarez et al., 2011; Shore et al., 2011), and has subsequently been detected in ruminants, pigs and companion animals, with increasing reports from wild animals (Paterson et al., 2014; Bengtsson et al., 2017). Although first identified in 2011, mecC‐MRSA isolates have now been found dating back to 1975 (Petersen et al., 2013), with the mecC gene sharing 70% identity with mecA at the DNA level (García‐Álvarez et al., 2011). Petersen et al. (2013) demonstrated that mecC‐MRSA infections in humans were primarily community acquired, typically affecting people living in rural areas and older than was typical for CA‐mecA‐MRSA patients. Although our understanding of the epidemiology of mecC‐MRSA is incomplete, studies have indicated that animal contact and zoonotic transmission are likely to be important. Paterson et al. (2014) reported that when tested, mecC‐MRSA strains have been negative for Panton‐Valentine leucocidin (PVL) toxin – a virulence feature typically associated with CA‐MRSA – and negative for human immune evasion cluster (IEC) genes, chp (chemotaxis inhibitor protein), sak (staphylokinase) and scn (encoding the staphylococcal complement protein inhibitor). Carriage of these IEC genes is considered an adaptation to enable S. aureus colonisation and infection of humans, and is not usually a feature of animal S. aureus strains (Cuny et al., 2015a).
Antimicrobial susceptibility in European invasive Staphylococcus aureus isolates from humans is reported by the MSs to the European Antimicrobial Resistance Surveillance Network (EARS‐Net) hosted by ECDC. MRSA typing data are not reported and, therefore, when there may be possible links to the animal reservoir of LA‐MRSA, these cannot easily be detected with current monitoring procedures, at least at the European level. The EU/EEA population‐weighted mean proportion of MRSA among invasive S. aureus infections reported to EARS‐Net decreased significantly from 19.0% in 2015 to 15.5% in 2019, with significantly decreasing trends reported by 40% of the individual reporting EU/EEA countries. Nevertheless, MRSA remains an important human pathogen in the EU/EEA, as the levels of MRSA were still high in several countries and combined resistance to another antimicrobial group was common (ECDC, 2020).
6.1. MRSA in food and animals
LA‐MRSA isolates are the main focus of this section, which summarises the occurrence of MRSA and its susceptibility to antimicrobials in various food categories (including meat samples from various species) and food‐producing animals (including horses) reported by six MSs and two non‐MSs in 2018 and in 2019. This chapter also summarises MRSA occurrence data reported from clinical investigations of food‐producing and companion animals in 2018/2019. Two appendices related to MRSA have been included at the end of this report: Appendix F on the surveillance and control of LA‐MRSA in the Norwegian pig population; and Appendix G that provides a detailed overview of the reported MRSA spa‐types in 2018 and 2019. Additional tables on MRSA in food and food‐producing animals have been included in Annex F that is available as supporting documentation in zenodo ( https://doi.org/10.5281/zenodo.4557180).
The methods for the isolation of MRSA from food and animals are not yet harmonised at the EU level and, therefore, the methods used by individual reporting MSs may differ in sensitivity. Similarly, the sampling strategies used by reporting MSs are not harmonised at the EU level and these may also influence the results obtained.
6.1.1. Monitoring of MRSA in food
In both 2018 and 2019, a low number of countries reported data on the occurrence of MRSA in food (N = 5 and N = 4, respectively). Slovakia examined a range of food products in 2018, with no samples testing positive for MRSA (see Tables 1a and b, Annex F). In 2018, MRSA was reported in poultry meat by four countries (broiler meat: Austria, Germany, the Netherlands and Switzerland; turkey meat: Austria, Germany and the Netherlands), as well as meat from cattle and pigs by one country (the Netherlands). In 2019, MRSA was reported in meat from cattle and pigs by three countries (Austria, the Netherlands and Switzerland), as well as poultry meat by one country (the Netherlands) and raw cow's milk by one country (Germany). Over 2018/2019, the reported prevalence of MRSA ranged from very low to moderate in pig meat (0.3% to 15.7%), very low to low in meat from cattle (0.6% to 3.8%), very low to high in broiler meat (1.0% to 20.2%), high to extremely high in turkey meat (42.7% to 100%) and at a low level in raw cow's milk from Germany (7.7%). Notably in 2018, the Netherlands tested a very low number of samples from turkey meat (N = 3), which all proved positive for MRSA resulting in the extremely high prevalence recorded (100%). Similarly, Austria tested a single sample of turkey meat in 2018 and following the detection of MRSA, the result of which was reported (100% prevalence). However, MRSA is not generally considered to be transmitted by food‐borne routes to humans, and detection often involves selective culture techniques which may detect very low levels of contamination.
In summary, MRSA was reported in meat from cattle, pigs, broilers or turkeys in 2018/2019, although the prevalence varied between meats of different origins. Additionally, MRSA was detected in samples of raw cow's milk in 2019 (Figure 47).
Figure 47.

- N: Total number of sample units tested; AT: Austria; CH: Switzerland; DE: Germany; NL: the Netherlands. * spa‐types not reported. 1: spa‐types: t008 ST8 (1 isolate), t011 (2), t127 ST1 (2), t2346 (1). The t008 isolate was PVL‐positive; the two t127 isolates were PVL‐negative. 2: spa‐types were not reported; however, both isolates were confirmed to belong to CC398 using the sau1‐hsdS1 CC398 PCR reaction (Stegger et al., 2011). 3: spa‐types: t002 ST5 (1 isolate), t003 ST3944 (1), t008 ST8 (1), t011 (22), t011 ST398 (1), t034 (12), t127 ST1 (2), t321 ST5050 (1), t843 ST130 (1), t899 (5), t1451 (2), t1456 (1). The t002 and t008 isolates were PVL‐positive. The two t127 isolates, as well as the single t003 and t321 isolates were PVL‐negative. The t843 isolate was reported to carry the mecC gene. 4: spa‐type was not reported; however, the isolate was confirmed to belong to CC398 using the sau1‐hsdS1 CC398 PCR reaction (Stegger et al., 2011). 5: spa‐types: t011 (2 isolates), t034 (1). 6: spa‐types: t034 CC398 (1 isolate), t1430 (1), t571 CC398 (1), t13177 (1). 7: spa‐type : t011 (1 isolate).
In 2018, molecular typing data were reported for only 8 of 345 MRSA isolates recovered from meat, with Austria and Switzerland providing information on spa‐type for isolates recovered from poultry meat. In 2019, molecular characterisation was reported for 59 of 173 MRSA isolates recovered from meat; Austria was the only country to report spa‐type for 56 isolates recovered from pig and cattle meat, while Switzerland provided information on clonal complex for three MRSA isolates recovered from pig and cattle meat.
In 2018, all reported spa‐types were those associated with LA‐MRSA (8/8) – see Figure 48a. These included four MRSA isolates recovered from broiler and turkey meat by Austria which were spa‐types commonly associated with CC398 (spa‐types t011 and t034), the predominant LA‐MRSA lineage occurring in Europe. Switzerland also reported four spa‐types associated with the livestock‐associated lineages CC398 (spa‐types t034 and t571) and CC9 (t1430 and t13177) from the monitoring of broiler meat in 2018. MRSA belonging to CC9 represent a further LA‐MRSA lineage which is disseminated worldwide, although particularly prevalent among various species of livestock in Asia (Cuny et al., 2015b).
Figure 48.

- Inferred MRSA types in (a) were recovered from broiler meat (7 isolates) and turkey meat (1 isolate); inferred MRSA types in (b) were recovered from cattle meat (8 isolates) and pig meat (51 isolates).
Where typing data were available in 2019, most MRSA isolates were considered to represent livestock‐associated lineages (53/59) – see Figure 48b. Switzerland did not report corresponding spa‐type for two isolates recovered from cattle meat and a single isolate from pig meat in 2019, however, all three isolates were confirmed to belong to CC398 using the sau1‐hsdS1 CC398 PCR reaction (Stegger et al., 2011). Of the other 50 MRSA isolates considered to represent LA‐MRSA in 2019, these included five isolates of spa‐type t899 reported by Austria from batches of pig meat, as well as four isolates of spa‐type t127 reported by Austria from batches of cattle and pig meat. Notably, LA‐MRSA spa‐types t011 and t034 were also frequently reported from the monitoring of food in 2019 (25 and 12 isolates, respectively).
-
–
spa‐type t899 can be associated with different clonal lineages, including CC398 and CC9. LA‐MRSA CC9/CC398 displaying spa‐type t899 is a mosaic strain, consisting of a CC398 chromosomal backbone having acquired the CC9 region containing the staphylococcal protein A gene (Guardabassi et al., 2009; Larsen et al., 2016; Tegegne et al., 2021).
-
–
Austria confirmed the isolates of spa‐type t127 belonged to ST1 and were SCCmec type IVa (2B) from whole genome sequence (WGS) data. Additionally, these isolates were reported to be PVL‐negative and harbour the human immune evasion cluster (IEC) genes, sak and scn. While the t127‐ST1 genotype is generally considered a CA‐MRSA (regardless of PVL status) in humans, these isolates were considered most likely to represent LA‐MRSA, because of their origin and the reported establishment of spa‐type t127 (ST1) within livestock in some European countries (Alba et al., 2015).
MRSA spa‐types which were not attributed to LA‐MRSA in 2019 (six MRSA isolates recovered from cattle and pig meat by Austria) are summarised below (Figure 48b):
-
–
spa‐type t002 was reported from pig meat by Austria; the isolate was confirmed to belong to ST5 and contain SCCmec type IVc (2B) from WGS data. As the isolate was reported to be PVL‐positive, it was considered most likely to represent a community‐associated lineage, as CA‐MRSA frequently possess the PVL toxin. Additionally, the isolate was reported to harbour the IEC genes, sak and scn.
-
–
spa‐type t003 was recovered from pig meat by Austria; the isolate was confirmed to belong to ST3944 (CC5) and contain SCCmec type II (2A) from WGS data. The isolate was considered most likely to represent a HA‐MRSA due to its PVL‐negative status, as well as SCCmec element type. Additionally, the isolate was reported to harbour the IEC genes, sak and scn.
-
–
Austria reported spa‐type t008 from a batch of pig meat, as well as a batch of cattle meat. Both isolates were confirmed to belong to ST8 and were SCCmec type IVa (2B) from WGS data. This spa‐type and sequence type combination is seen in isolates of the globally significant CA‐MRSA USA300 strain, which is PVL‐positive and frequently possesses the arginine catabolic mobile element (ACME). Austria confirmed that these isolates were PVL‐positive and the ACME was detected. Additionally, these isolates were reported to harbour the IEC genes, sak and scn.
-
–
spa‐type t321 was recovered from pig meat by Austria; the isolate was confirmed to belong to ST5050 (CC1) and contain SCCmec type IVa (2B) from WGS data. While the t321 isolate was reported to be PVL‐negative, the t321‐CC1 genotype is predominantly regarded as a CA‐MRSA (Huang et al., 2014; Boswihi et al., 2016).
-
–
mecC‐MRSA spa‐type t843 was reported by Austria from pig meat. The isolate was confirmed to belong to ST130 (CC130), contain the SCCmec element type XI (8E) and carry the mecC gene.
Overall, where molecular typing data were available for MRSA isolates recovered from food in 2018/19, all/most were considered to represent LA‐MRSA – see Figure 48 (a and b).
6.1.2. Monitoring of MRSA in animals
6.1.2.1. Monitoring of MRSA in healthy food‐producing animals (including horses)
MRSA occurrence data from food‐producing animals (including horses) were reported by four countries in 2018 and seven countries in 2019. The voluntary monitoring performed over 2018/2019 examined cattle, pigs and chickens, including different production types, as well as horses. Additionally, meat production/fattening turkeys and farmed mink were surveyed in 2018 (see Tables 2a and b, Annex F). MRSA was detected in most of the animal populations, with the exception of pig herds by Norway in 2018, meat production turkeys by Denmark in 2018, and broilers by Denmark in 2019. Figure 49 presents MRSA occurrence for the animal origins where positive samples were obtained.
Figure 49.

- N: Total number of sample units tested; BE: Belgium; CH: Switzerland; DE: Germany; DK: Denmark; NL: the Netherlands; NO: Norway; PT: Portugal. CHC: controlled housing conditions. * spa‐types not reported. † These comprised multiplier herds. 1: spa‐types were not reported; however, all 11 isolates were confirmed to belong to CC398 using the sau1‐hsdS1 CC398 PCR reaction (Stegger et al., 2011). 2: spa‐types: t011 CC398 (1 isolate), t034 CC398 (8), t779 CC398 (1), t1580 CC398 (1). 3: spa‐types: t011 CC398 (65 isolates), t034 CC398 (8), t1451 CC398 (1), t1580 CC398 (2), t3423 CC398 (1), t3479 CC398 (1), t9433 CC398 (1). 4: spa‐types: t011 CC398 (5 isolates), t1451 CC398 (1), t223 (2), t223 ST22 (1). All three t223 isolates were PVL‐negative. One t223 isolate was confirmed to belong to ST22, harbour the tst gene and IEC genes (chp, sak and scn) from WGS data. 5: spa‐types: t127 CC1 (1 isolate), t843 CC130 (1). The t127 isolate was PVL‐negative, as well as negative for the human IEC gene scn. spa‐type t843 was confirmed to carry the mecC gene. 6: spa‐types: t034 (7 isolates), t267 CC97 (1). 7: spa‐types: t011 CC398 (8 isolates), t034 CC398 (1), t223 (3), t1257 (1). The t223 isolates were PVL‐negative; TSST status was not determined. The PVL status of the t1257 isolate was not reported. 8: spa‐types: t011 CC398 (3), unspecified (168). 9: spa‐type: t034 CC398 (1 isolate). 10: spa‐types were not reported; however, 159/160 isolates were confirmed to belong to CC398 using the sau1‐hsdS1 CC398 PCR reaction (Stegger et al., 2011). The remaining isolate did not survive cryo‐conservation; therefore, typing could not be performed. 11: spa‐types: t011 CC398 (67 isolates), t034 CC398 (11), t1451 CC398 (2), t1457 CC398 (1), t2346 CC398 (1), t2370 CC398 (2), t2383 CC398 (1), t3041 CC398 (1), t3119 CC398 (1), unspecified (18). 12: spa‐types: t011 CC398 (22 isolates), t034 CC398 (85), t571 CC398 (3), t898 CC398 (1), t2383 CC398 (1), t2974 CC398 (1), t3423 CC398 (1), t4652 CC398 (1), t9266 CC398 (1). 13: spa‐types: t011 CC398 (4 isolates), t034 CC398 (15), t588 CC398 (1), t1456 CC398 (1). 14: spa‐types: t011 CC398 (57 isolates), t034 CC398 (18), t108 CC398 (2), t779 CC398 (1), t2346 CC398 (1), t2582 CC398 (1), t2922 CC398 (1), t3119 CC398 (2). 15: spa‐types: t011 CC398 (10 isolates), t034 CC398 (57), t1928 CC398 (1), t4652 CC398 (1). 16: spa‐types: t011 CC398 (6 isolates), t034 CC398 (24), t1250 CC398 (2), t1793 CC398 (1), t3171 CC398 (1). 17: spa‐types: t011 CC398 (4 isolates), t034 CC398 (6), t1451 CC398 (1), t843 CC130 (1), t3256 CC130 (1). spa‐types t843 and t3256 were confirmed to carry the mecC gene. 18: spa‐types: t011 CC398 (3 isolates), t034 CC398 (6), t843 CC130 (1). spa‐type t843 was confirmed to carry the mecC gene. 19: spa‐types: t011 CC398 (2 isolates), t034 CC398 (2). 20: spa‐types: t011 CC398 (6 isolates), t034 CC398 (19), t571 CC398 (1), t588 CC398 (1), t1456 CC398 (1), t1457 CC398 (2), t13790 CC1 (1).
From the monitoring of cattle in 2018, Belgium reported a moderate MRSA prevalence among herds of dairy cows and a low prevalence in herds of meat production animals (14.0% and 8.7%, respectively), while a very high prevalence was reported by Belgium among veal calf herds (54.5%). As part of a national survey in 2018 and 2019, Denmark reported a low MRSA prevalence in herds of dairy cows (6.1% and 1.5%, respectively); MRSA prevalence was observed at a slightly higher level among herds of veal calves in Denmark in 2019 (9.6%). At the animal level, MRSA prevalence in Swiss calves at slaughter (under 1 year of age) in 2019 was reported at 3.7%.
There was also a large degree of variation between reporting countries in the occurrence of MRSA in pigs, with 0% to 89.2% of pig herds testing positive in 2018 and 0.1% to 100% of animals/herds/holdings/slaughter batches testing positive in 2019. This variation highlights the success of Norwegian eradication programmes (no pig herds testing positive in 2018 and 0.1% prevalence in 2019), but also likely reflects the differences in sampling protocols performed in 2019, for example whether testing individual or batches of pigs, or holdings, and whether animals were sampled at slaughter or on farm. Additionally, there was variation within and across production/herd types. Further details on the Norwegian eradication programme are available in Appendix F.
Interestingly in 2018, Denmark sampled herds of fattening pigs, both raised under controlled housing conditions (CHC, N = 130) and not raised under CHC (N = 104), with MRSA herd prevalence reported at levels of 89.2% and 20.2%, respectively. Notably, the pigs raised under CHC represented conventional indoor fattening pig herds, whilst those not raised under these conditions represented free‐range fattening pig herds including organic production herds (DANMAP, 2018).
Additionally, Denmark sampled multiplier pig herds in 2019 with MRSA prevalence reported at the extremely high level of 94.5%. Similarly, an extremely high level of MRSA prevalence (100%) was reported among batches of Portuguese fattening pigs at slaughter in 2019.
Considering the monitoring of poultry flocks, a low MRSA prevalence was reported among laying hen flocks by Denmark in 2018 (3.2%), while a moderate level was reported among fattening turkey flocks by Germany in 2018 (17.2%); no flocks of meat production turkeys (N = 19) or broilers (N = 83) tested by Denmark in 2018 and 2019, respectively, proved positive for MRSA. In 2018/2019, Denmark also tested horses at the premises (stable) level, as well as mink farms in 2018. MRSA prevalence among horse premises was reported at a low level in 2018 and a moderate level in 2019 (8.1% and 10.8%, respectively); while a high level was reported from mink farms in 2018 (25.4%).
In 2018, spa‐typing data were reported for 325 MRSA isolates recovered from pigs, cattle, laying hens, mink and horses at the herd/flock/farm/stable level, with additional sequence typing data available for most of these isolates. In 2019, molecular typing data were reported for 439 MRSA isolates recovered pigs, cattle and horses at the animal/herd/slaughter batch/stable level; Belgium, Denmark, Norway and Portugal reported corresponding spa‐type and clonal complex for 269 isolates recovered from pigs, cattle and horses, while Switzerland provided information on only clonal complex for 11 isolates from calves and 159 isolates from fattening pigs (one isolate did not survive cryo‐conservation; therefore, molecular typing could not be performed).
In 2018, most reported spa‐types were considered to represent livestock‐associated lineages (317/325) – see Figure 50a. These included spa‐type t267 which was reported from a dairy cow herd in Denmark, as well as spa‐type t13790 which was reported from farmed mink in Denmark. Notably, of the 317 MRSA isolates considered to represent LA‐MRSA, most of these comprised spa‐types t011 and t034 (90.9%).
-
–
Although spa‐type t267 has been associated with CC80 and CC97, Denmark confirmed the isolate belonged to CC97. CC97 MRSA has been detected in pigs and cattle in Europe and is considered a livestock‐associated MRSA lineage; spa‐type t267 was detected in cattle in Italy in 2011 (Feltrin et al., 2016). While MRSA isolates belonging to this clonal lineage have also been reported from humans as community‐associated clones (Monecke et al., 2011; Spoor et al., 2013; Egea et al., 2014), this isolate was considered a LA‐MRSA.
-
–
Denmark reported that spa‐type t13790 recovered from a mink farm belonged to CC1. LA‐MRSA in mink has been considered to originate from contaminated pig by‐products used in the production of mink feed (Hansen et al., 2017; Fertner et al., 2019) and MRSA belonging to CC1 has been detected in breeding pigs and in pork in Denmark (DANMAP, 2016). The occurrence of LA‐MRSA CC1 in pigs and pork in Denmark may therefore account for the detection in mink, and while MRSA isolates belonging to CC1 may be regarded as either a CA‐ or LA‐MRSA, the isolate was considered most likely to represent a LA‐MRSA. Additionally, Denmark reported that the t13790 isolate was negative for the human immune evasion cluster gene scn, which may also suggest a link to animals.
Figure 50.

- Inferred MRSA types in (a) 2018 were recovered from pigs (171 isolates), cattle (109 isolates), laying hens (4 isolates), mink (31 isolates) and horses (10 isolates) at the herd/flock/farm/stable level; inferred MRSA types in (b) 2019 were recovered from pigs (243 isolates), cattle (13 isolates) and horses (13 isolates) at the herd/slaughter batch/stable level, as well as individual fattening pigs (159 isolates) and calves at slaughter (11 isolates).
MRSA spa‐types which were not attributed to LA‐MRSA in 2018 (recovered from cattle herds and an equine premises) are summarised below:
-
–
Belgium reported spa‐type t223 from three dairy cow herds and three meat production cattle herds. All isolates were PVL negative. spa‐type t223 is associated with ST22 (CC22), a dominant sequence type and spa‐type combination of HA‐MRSA; and Belgium confirmed that one isolate from meat production cattle belonged to sequence type (ST) 22 and was SCCmec type IV (2B)/IVa (2B) from whole genome sequence (WGS) data. Additionally, this isolate was reported to harbour the tst gene encoding for toxic shock syndrome toxin 1 (TSST‐1) and the human IEC genes (chp, sak and scn). All six bovine t223 isolates were therefore categorised as HA‐MRSA.
-
–
spa‐type t1257 was also reported from a dairy cow herd in Belgium. This spa‐type has been associated with sequence types within CC8 (ST239 and ST612), but appears to be more frequently associated with sequence type ST612. While the t1257‐ST612 genotype may be regarded as either a CA‐ or HA‐MRSA, the t1257 isolate from a dairy herd was not categorised to a particular lineage; further typing (including PVL testing) would aid such characterisation.
-
–
Denmark reported spa‐type t843 from an equine premises. The isolate was confirmed to belong to CC130 and carry the mecC gene.
Where molecular typing data were reported in 2019, most MRSA isolates were again considered to represent livestock‐associated lineages (436/439) – see Figure 50 (b). While Switzerland did not report corresponding spa‐type for the 11 isolates recovered from calves and 160 isolates from pigs, all isolates from calves and 159/160 from fattening pigs were confirmed to belong to CC398 using the sau1‐hsdS1 CC398 PCR reaction (Stegger et al., 2011). Of the remaining 266 MRSA isolates considered to represent LA‐MRSA in 2019, these included spa‐type t127 which was reported from a dairy cow herd in Denmark. Notably, LA‐MRSA spa‐types t011 and t034 were again frequently reported from the monitoring of food‐producing animals in 2019 (142 and 101 isolates, respectively).
-
–
Denmark reported that the t127 isolate belonged to CC1 and was PVL‐negative. While the t127‐CC1 genotype is generally considered a CA‐MRSA (regardless of PVL status), the isolate was considered most likely to represent a LA‐MRSA, due to the establishment of spa‐type t127 (CC1) within livestock in some countries. Additionally, Denmark reported that the t127 isolate was negative for the human IEC gene scn, which may also suggest a link to animals.
MRSA spa‐types which were not attributed to LA‐MRSA in 2019 (recovered from a dairy cow herd and equine premises by Denmark) are summarised below:
-
–
Denmark reported spa‐types t843 and t3256 from two equine premises, as well as t843 from a dairy cow herd. All three isolates were confirmed to belong to CC130 and carry the mecC gene.
Overall, where molecular typing data were available for MRSA isolates recovered from these food‐producing animals (including horses) in 2018/19, most were considered to represent LA‐MRSA ‐ see Figure 50 (a and b).
6.1.2.2. Monitoring of MRSA in animals following clinical investigations
Typically, clinical investigations differ from monitoring studies in food‐producing animals; as selective culture methods may not be used, the number of units tested may be low and the sample may involve a biased sample population. Although these data do not allow prevalence to be inferred and cannot be extrapolated at the population level, it is still considered relevant to report the range of animal species/populations which were affected and the lineages of MRSA detected, where reported.
In food‐producing animals: Slovakia was the only country to report data following clinical investigations for MRSA in various food‐producing animals (cattle, broilers, goats and sheep) in 2018. While in most cases, sample sizes were small, no animals proved positive for MRSA – see Table 3 (Annex F). No countries reported data in 2019.
In companion animals: The Netherlands reported data on MRSA in companion animals following clinical investigations in 2018/2019, as well as Slovakia in 2018 (Tables 4a and b, Annex F). Slovakia reported data on a very small number of cats, guinea pigs, rabbits and horses, as well as more than 60 dogs; no animals proved positive for MRSA. In 2018 and 2019, the Netherlands tested more than 250 cats, dogs and horses; with MRSA occurrence ranging from very low to moderate among these species. Corresponding spa‐typing data were not reported.
6.2. Temporal trends of MRSA prevalence in various types of meat and food‐producing animals (excluding clinical investigations)
Isolation of MRSA from food‐producing animals and the farm environment
In 2018, the European Union Reference Laboratory‐Antimicrobial Resistance (EURL‐AR) published revised recommendations for the isolation of MRSA from food‐producing animals and the farm environment, which omit the use of a second enrichment step with cefoxitin and aztreonam (EURL, 2018). Prior to this, the recommended method for the detection of MRSA comprised a pre‐enrichment step and a selective enrichment step (known as the 2‐S method).
The revised recommendations followed a study of Danish and Norwegian pig herds which evaluated the sensitivity of the 2‐S method by comparison with an alternative 1‐S method (whereby the selective enrichment step was bypassed), with results confirming that the 1‐S method resulted in a lower proportion of false‐negative results than the 2‐S method (Larsen et al., 2017). The authors urged caution in extrapolating the results to animals other than pigs and commented that previous studies in Belgium in poultry and cattle did not find significant differences between the performance of the two methods.
Notably, changes to the recommended method of isolation may impact longitudinal studies, since direct comparison of the data obtained using the different protocols should be performed with caution.
In 2018, occurrence data was obtained using the 1‐S isolation method by 2/4 reporting countries in food‐producing animals and by 2/5 reporting countries in food; while in 2019, occurrence data was obtained using the 1‐S method by 5/7 reporting countries in food‐producing animals and 3/4 reporting countries in food (the remaining countries used the 2‐S method in 2018 and 2019).
Considering the monitoring performed in 2018/2019 and for previous years, comparable longitudinal porcine data were available for Belgium, Denmark, Germany, Norway and Switzerland, with 2/4 countries using the 1‐S method of isolation in 2019 (Belgium and Germany used the 2‐S method), as well as two countries in 2018. Where longitudinal data are comparable with the monitoring carried out in 2018/2019, these temporal data of MRSA prevalence in various types of meat and food‐producing animals are presented in Tables 5 and 6 of Annex F. It is important to note that, due to the limited data reported on MRSA, the temporal trends have been only descriptively evaluated (‘trend watching’) and no statistical analysis of the trends has been performed.
Temporal trends of MRSA prevalence in various types of meat
In view of the monitoring of food performed in 2018/2019, comparable longitudinal data were available for two countries in meat from cattle, pigs and turkeys, as well as three countries for broiler meat (see Figure 5). Considering pig meat, the Netherlands reported MRSA prevalence data for 2018 and 2019. Although in both years, prevalence was low, a slight increase was observed from 2018 to 2019 (5.9% in 2018 to 8.4% in 2019). While a relatively high number of units were tested in both years, more than double the number of samples were analysed in 2019 (N = 296) compared with 2018 (N = 135). Regarding poultry meat, Germany reported MRSA prevalence data for fresh broiler meat in 2011, 2013, 2016 and 2018 (Figure 51), with more than 400 samples tested throughout all years. While prevalence remained at a similar high level in 2011 and 2013 (26.5% and 24.2%, respectively), this fell to a moderate level in 2016 (13.0%), increasing slightly in 2018 (16.4%). MRSA prevalence data from fresh broiler meat were also reported by the Netherlands in 2018 and 2019 (Figure 51), with levels declining slightly from a high level in 2018 (20.2%) to a moderate level in 2019 (17.3%). Longitudinal data were also available for fresh turkey meat in Germany, for years 2012, 2014, 2016 and 2018 (Figure 51), with more than 300 samples tested throughout all years. Although MRSA prevalence increased slightly from 2012 to 2016 and showed a slight decline in 2018, similar high levels were reported throughout (37.7%, 42.5%, 44.5% and 42.7%, respectively). The Netherlands also reported MRSA prevalence data for fresh turkey meat in 2018 and 2019 (Figure 51). Although extremely high and very high prevalence levels were reported in 2018 and 2019 (100% and 64.3%), the low number of units tested in these years and inherent variability associated with small sample sizes should be noted when assessing trends (N = 3 and N = 14, respectively).
Figure 51.

- CH: Switzerland; DE: Germany; NL: the Netherlands. The 2‐S method of isolation was used by CH and DE from 2011–2018; while the 1‐S method was used by the NL from 2018–2019, as well as CH in 2019. * spa‐types not reported. 1: In 2019, spa‐types were not reported; however, both isolates were confirmed to belong to CC398 using the sau1‐hsdS1 CC398 PCR reaction (Stegger et al., 2011). 2: In 2017, spa‐type: t011 (1 isolate), t002 (1). PVL status of the t002 isolate was not reported. In 2019, spa‐type was not reported; however, the isolate was confirmed to belong to CC398 using the sau1‐hsdS1 CC398 PCR reaction (Stegger et al., 2011). 3: In 2016, spa‐types: t034 (3 isolates), t153 (1), t1430 (3), t2123 (2). PVL status of the t153 isolate was not reported. In 2018, spa‐types: t034 CC398 (1 isolate), t1430 (1), t571 CC398 (1), t13177 (1).
Temporal trends of MRSA prevalence in various types of food‐producing animals (including horses)
Considering the monitoring of food‐producing animals in 2018/2019, comparable longitudinal data were available for five countries in pigs, three countries in cattle, one country in turkeys and one country in horses (see Figures 52 and 53 for trends in cattle and pigs; see Table 6 in Annex F for trends in turkeys and horses).
Figure 52.

- BE: Belgium; CH: Switzerland; DK: Denmark. The 2‐S method of isolation was used by BE and CH from 2012–2018; while the 1‐S method was used by DK from 2018–2019, as well as CH in 2019. * spa‐types not reported. 1: In 2012, spa‐types: t011 (40 isolates), t1451 (3), t1456 (1), t1985 (3), t3423 (1), untypable (1). In 2015, spa‐types: t011 (64 isolates), t034 (15), t037 (8), t044 (3), t1451 (3), t1580 (7), t1985 (8), t2287 (2), t3423 (5), untypable (1). The t044 isolates were PVL‐negative. In 2018, spa‐types: t011 CC398 (65 isolates), t034 CC398 (8), t1451 CC398 (1), t1580 CC398 (2), t3423 CC398 (1), t3479 CC398 (1), t9433 CC398 (1). 2: In 2015, spa‐types: t011 (11 isolates), t034 (6) and t008 (2). The t008 isolates were PVL‐positive. In 2017, spa‐types: t011 (14 isolates), t034 (7), t127 (1), t17339 (2). PVL status of the t127 isolate was not reported. In 2019, spa‐types were not reported; however, all 11 isolates were confirmed to belong to CC398 using the sau1‐hsdS1 CC398 PCR reaction (Stegger et al., 2011). 3: In 2012, spa‐types: t011 (8 isolates), t037 (1), t388 (1), t1456 (1), t6228 (2), untypable (1). In 2015, t011 (4 isolates), t034 (1), t1580 (1), t1985 (2), t2383 (1), untypable (1). In 2018, spa‐types: t011 CC398 (8 isolates), t034 CC398 (1), t223 (3), t1257 (1). The t223 isolates were PVL‐negative; TSST status was not determined. The PVL status of the t1257 isolate was not reported. 4: In 2018, spa‐types: t034 (7 isolates), t267 CC97 (1). In 2019, spa‐types: t127 CC1 (1 isolate), t843 CC130 (1). The t127 isolate was PVL‐negative, as well as negative for the human IEC gene scn. spa‐type t843 was confirmed to carry the mecC gene. 5: In 2012, spa‐types: t011 (16 isolates), t121 (1), t1456 (1), t1985 (1). In 2015, spa‐types: t011 (9 isolates), t034 (2), t1451 (1), t1580 (2), t2287 (1), t3423 (1). In 2018, spa‐types: t011 CC398 (5 isolates), t1451 CC398 (1), t223 (2), t223 ST22 (1). All three t223 isolates were PVL‐negative. One t223 isolate was confirmed to belong to ST22, harbour the tst gene and IEC genes (chp, sak and scn) from WGS data.
Figure 53.

- BE: Belgium; CH: Switzerland; DE: Germany; DK: Denmark; NO: Norway. The 2‐S method of isolation was used by BE and DE from 2016–2019, as well as DK in 2016, CH from 2010–2017 and NO from 2014–2017. The 1‐S method was used by CH in 2019 and DK in 2018, as well as NO from 2018–2019. * spa‐types not reported. † Prevalence data for fattening pig herds (not raised under controlled housing conditions) from 2018 are not included. 1: In 2010, spa‐types: t034 ST398 (17 isolates), t011 ST398 (1), t208 ST49 (5). In 2011, spa‐types: t034 ST398 (19 isolates), t011 ST398 (1), t208 ST49 (1), t2279 ST1 (1). In 2012, spa‐types: t034 CC398 (61 isolates), t011 CC398 (9), t208 ST49 (2). In 2013, spa‐types: t034 (63 isolates), t011 (10). In 2014, spa‐types: t034 (57 isolates), t011 (19), t208 (1), t899 (1), t2741 (1). In 2015, spa‐types: t034 (48 isolates), t011 (23), t032 (1), t571 (1), t899 (1), t1145 (1), t1250 (1), t4475 (1). In 2017, spa‐types: t034 (63 isolates), t011 (61), t899 (2), t1451 (3), t2330 (1), t2876 (1). In 2019, spa‐types were not reported; however, 159/160 isolates were confirmed to belong to CC398 using the sau1‐hsdS1 CC398 PCR reaction (Stegger et al., 2011). The remaining isolate did not survive cryo‐conservation, therefore typing could not be performed. 2: In 2016, spa‐types: t011 CC398 (71 isolates), t1451 (1), t1456 (1), t1456 CC398 (1), t1580 (5), t1985 (8), t1985 CC398 (3), t034 (7), t034 CC398 (2), t037 (1), t898 (1), unspecified (11). In 2019, spa‐types: t011 CC398 (67 isolates), t034 CC398 (11), t1451 CC398 (2), t1457 CC398 (1), t2346 CC398 (1), t2370 CC398 (2), t2383 CC398 (1), t3041 CC398 (1), t3119 CC398 (1), unspecified (18). 3: In 2016, spa‐types not reported. In 2018, spa‐types: t011 CC398 (22 isolates), t034 CC398 (85), t571 CC398 (3), t898 CC398 (1), t2383 CC398 (1), t2974 CC398 (1), t3423 CC398 (1), t4652 CC398 (1), t9266 CC398 (1). 4: In 2016, spa‐types: t011 CC398 (55 isolates), t1451 (2), t1456 (1), t1456 CC398 (3), t1580 (1), t1985 (5), t1985 CC398 (1), t034 (1), t034 CC398 (4), t4659 CC398 (1), unspecified (17). In 2019, spa‐types: t011 CC398 (57 isolates), t034 CC398 (18), t108 CC398 (2), t779 CC398 (1), t2346 CC398 (1), t2582 CC398 (1), t2922 CC398 (1), t3119 CC398 (2). 5: In 2016, spa‐types not reported. In 2018, spa‐types: t011 CC398 (6 isolates), t034 CC398 (24), t1250 CC398 (2), t1793 CC398 (1), t3171 CC398 (1). 6: In 2014, spa‐type: t011 CC398 (1). In 2015, spa‐type: t034 CC398 (2), t177 CC1 (2). In 2016, spa‐type: t034 CC398 (1). In 2017, spa‐types: t091 CC7 (1 isolate), t843 CC130 (1), t6292 CC425 (1). The t091 isolate was PVL‐negative, spa‐types t843 and t6292 were confirmed to carry the mecC gene. In 2019, spa‐type: t034 CC398 (1).
Regarding the monitoring of cattle, longitudinal data were available for herds of calves, dairy cows and meat production animals in Belgium for years 2012, 2015 and 2018 (Figure 52), with a similar number of herds tested within each production type. In herds of calves (under 1 year of age), MRSA prevalence increased sharply from a high level in 2012 to an extremely high level in 2015 (47.1% to 78.9%, respectively), and then declined to a very high level in 2018 (54.5%). Most isolates were spa‐types associated with CC398 (LA‐MRSA), with the exception of spa‐types t037 and t044 detected in 2015. In 2018 and 2019, Denmark also reported annual results on MRSA prevalence in dairy cow herds (Figure 52), with a similar number of herds tested in both years. Although prevalence remained at low levels over these years, a slight decrease was observed from 2018 to 2019 (6.1% to 1.5%, respectively).
Considering the monitoring of pigs (Figure 53), MRSA prevalence data for Swiss fattening pigs at slaughter were reported from 2010 to 2015, as well as in 2017 and 2019. Generally, prevalence has increased annually, rising from 5.9% in 2010 to 52.8% in 2019; and from 2015 to 2017, a marked increase was observed from 25.7% to 44.0%, respectively. Notably, spa‐types associated with CC398 have shown a steady increase in prevalence; and where molecular typing data were available, all isolates in 2017 and 2019 were those associated with CC398 (with most belonging to spa‐types t011 and t034 in 2017, only information on clonal complex were provided for isolates recovered in 2019). It should be noted however, that from 2010 to 2017, the 2‐S method of isolation was used in comparison to the 1‐S method in 2019.
MRSA prevalence data from Belgian fattening pig herds was reported in 2016 and 2019 (Figure 53), with a similar number of herds tested in both years. While prevalence remained at a very high level throughout, a slight decline was noted from 2016 (63.3%) to 2019 (58.3%). Considering breeding pigs, Belgium reported MRSA prevalence data from breeding pig herds in 2016 and 2019 (Figure 53), with an apparent decline noted from 2016 to 2019 (59.5% to 46.4%, respectively). All MRSA isolates recovered from these production types over these years were spa‐types associated with CC398 (LA‐MRSA), with the exception of a single isolate of spa‐type t037 reported from fattening pigs in 2016 (categorised as HA‐MRSA) in Belgium. As part of a national survey, Denmark also reported annual results on the prevalence of MRSA in breeding pig herds in 2016 and 2018 (Figure 53). Although in 2016, the 2‐S method of isolation was used in comparison to the 1‐S in 2018, prevalence declined over these years from 100% to 82.9%, respectively. This apparent decline is likely to reflect in part the differences in sample size; notably in 2016, Denmark tested a very low number of breeding herds (N = 6) resulting in the extremely high prevalence (100%), while in 2018 a larger number of breeding herds were tested (N = 41). Corresponding spa‐typing data were not reported in 2016, however, all reported spa‐types in 2018 were those associated with CC398 (LA‐MRSA).
Since 2014, Norway has reported annual data on MRSA prevalence among pig herds as part of a national surveillance programme (Figure 53). From 2014 to 2017, similar very low levels of prevalence were recorded (0.1%, 0.5%, 0.1% and 0.4%, respectively), with no pig herds testing positive for MRSA in 2018 and a very low level also reported in 2019 (0.1%). Notably in 2018 and 2019, Norway used the 1‐S method of isolation in comparison to the 2‐S method from 2014 to 2017. These trends highlight the favourable impact of the Norwegian programme in eradicating and maintaining freedom of MRSA from most pig herds (further details on the Norwegian eradication programme are available in Appendix F).
MRSA prevalence data obtained from horse premises in Denmark were reported in 2018 and 2019, with levels increasingly slightly from a low level in 2018 (8.1%) to a moderate level in 2019 (10.8%). In both years, most isolates were spa‐types associated with LA‐MRSA, with the exception of t843 in 2018/2019 and t3256 in 2019; all three isolates were confirmed to belong to CC130 and carry the mecC gene. Germany reported annual results on MRSA prevalence in fattening turkey flocks in 2012, 2014 and 2018, with sample size remaining high throughout. Interestingly, prevalence increased from a moderate level in 2012 to a high level in 2014 (12.8–21.9%, respectively), and then declined slightly to a moderate level in 2018 (17.2%). Comparable trends for turkeys and horses are presented in Table 6 of Annex F.
6.3. Summary data on the occurrence and susceptibility of MRSA
Determination of the susceptibility of MRSA isolates to antimicrobials, including those of particular medical importance, such as linezolid and vancomycin, provides valuable information on the MRSA situation in animals and food. The importance of monitoring AMR patterns among different lineages is underlined by the potential for multiple resistance genes harboured by less virulent strains to spread to other S. aureus strains (Sahibzada et al., 2017).
In 2018/2019, data on the antimicrobial susceptibility of MRSA isolates were reported by Austria, Belgium and Switzerland, as well as Portugal in 2019 [see Tables 7a and b, Annex F]. All countries used a broth dilution method and applied EUCAST epidemiological cut‐offs (ECOFFs) to determine the susceptibility of isolates, and as expected, all MRSA isolates were resistant to penicillin and cefoxitin. In 2019, Austria also reported antimicrobial susceptibility and molecular typing data for four isolates (spa‐types t011, t012 and t034) recovered from additional ad hoc sampling of some batches of pig meat.
Susceptibility data of MRSA isolates obtained from meat and food‐producing animals (excluding clinical investigations)
In 2018/2019, tetracycline resistance was extremely high (at 100%) in MRSA isolates from Belgian calf herds, Swiss calves and Belgian fattening and breeding pig herds, as well as meat from cattle and poultry reported by Switzerland and Austria, respectively. Where molecular typing data were provided, all isolates were attributed to LA‐MRSA (CC398); this was expected as livestock‐associated MRSA isolates belonging to CC398 are usually tetracycline resistant (Crombé et al., 2013). Additionally, where susceptibility data were reported for 119 MRSA isolates recovered from batches of Portuguese fattening pigs at slaughter, all isolates exhibited tetracycline resistance; corresponding susceptibility data was not reported for a further 52 isolates recovered from this origin.
An extremely high level of resistance to trimethoprim was noted among MRSA isolates recovered from Belgian fattening and breeding pig herds in 2019 (93.1% and 89.2%, respectively), as well as an extremely high level of tiamulin resistance in isolates from batches of Portuguese fattening pigs at slaughter in 2019 (79.8%). Additionally, an extremely high level of trimethoprim resistance was noted among MRSA isolates recovered from Belgian calf herds in 2018 (97.5%). Considering the MRSA isolates reported from Belgian fattening pig herds in 2019, lincosamide and macrolide resistance were reported at very high (58.6%) and high levels (44.8%), respectively. This pattern was also noted among Belgian breeding pig herds in 2019, where clindamycin and erythromycin resistance were reported at levels of 55.4% and 37.3%, respectively. MRSA isolates from slaughter batches of Portuguese fattening pigs in 2019 showed resistance in one or more isolates to all antimicrobials tested (with the exception of vancomycin). Again clindamycin resistance was observed at a higher level when compared to erythromycin (87.4% and 64.7%, respectively). This finding was also apparent among Swiss fattening pigs in 2019 (CLI: 28.3%; ERY: 15.7%) and Belgian calf herds in 2018 (CLI: 88.6%; ERY: 84.8%). Among the MRSA isolates reported from Swiss calves in 2019, lincosamide and macrolide resistance was reported at an equal very high level (54.6%). An equal high level of resistance to these antimicrobials (33.3%) was also observed among isolates from Belgian meat production cattle herds in 2018. Figures 54, 55 and 56 present the overall resistance to selected antimicrobials within the meat and food‐producing animal origins.
Figure 54.

- N: Number of MRSA isolates reported/tested; AT: Austria; CH: Switzerland. *Susceptibility data are also included for four isolates recovered from additional ad hoc sampling. All isolates were tested against GEN: gentamicin; KAN: kanamycin; STR: streptomycin; CHL: chloramphenicol; RIF: rifampicin; CIP: ciprofloxacin; ERY: erythromycin; CLI: clindamycin; Q/D: quinupristin/dalfopristin; TIA: tiamulin; MUP: mupirocin; FUS: fusidic acid; SMX: sulfamethoxazole; TMP: trimethoprim; TET: tetracycline. All MRSA isolates were resistant to penicillin and cefoxitin, as expected. All isolates were susceptible to vancomycin and linezolid.
Figure 55.

- N: Number of MRSA isolates reported/tested; SHM: slaughterhouse monitoring; BE: Belgium; CH: Switzerland. All isolates were tested against GEN: gentamicin; KAN: kanamycin; STR: streptomycin; CHL: chloramphenicol; RIF: rifampicin; CIP: ciprofloxacin; ERY: erythromycin; CLI: clindamycin; Q/D: quinupristin/dalfopristin; TIA: tiamulin; MUP: mupirocin; FUS: fusidic acid; SMX: sulfamethoxazole; TMP: trimethoprim; TET: tetracycline. All MRSA isolates were resistant to penicillin and cefoxitin, as expected. All isolates were susceptible to vancomycin and linezolid.
Figure 56.
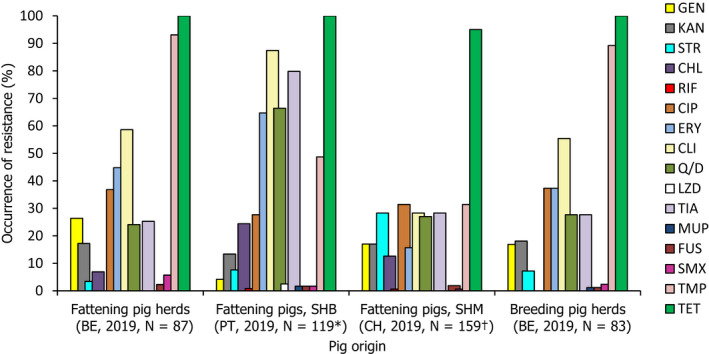
- N: Number of MRSA isolates reported/tested; SHB: slaughterhouse batch; SHM: slaughterhouse monitoring; BE: Belgium; CH: Switzerland; PT: Portugal. *Susceptibility data for a further 52 isolates recovered from batches of fattening pigs at slaughter were not reported. †Susceptibility data for one isolate recovered from a fattening pig was not available; the isolate did not survive cryo‐conservation. All isolates were tested against GEN: gentamicin; KAN: kanamycin; STR: streptomycin; CHL: chloramphenicol; RIF: rifampicin; CIP: ciprofloxacin; ERY: erythromycin; CLI: clindamycin; Q/D: quinupristin/dalfopristin; LZD: linezolid; TIA: tiamulin; MUP: mupirocin; FUS: fusidic acid; SMX: sulfamethoxazole; TMP: trimethoprim; TET: tetracycline. All MRSA isolates were resistant to penicillin and cefoxitin, as expected. All isolates were susceptible to vancomycin.
Linezolid and vancomycin are antimicrobials of last resort for treating S. aureus infections in humans. In 2018/19, all countries reporting susceptibility data tested isolates for linezolid and vancomycin susceptibility. All isolates proved susceptible to vancomycin – which was as expected, since resistance to vancomycin is currently extremely rare in S. aureus – however, linezolid resistance was detected in three isolates from Portuguese fattening pigs at slaughter in 2019. These three isolates were reported as spa‐type t011, clonal complex 398. Two of these isolates showed an identical resistance pattern to the panel of antimicrobials tested, displaying resistance to chloramphenicol, clindamycin, erythromycin, quinupristin/dalfopristin, tetracycline, tiamulin and trimethoprim (Table 14, Isolates 1 and 2), and the third isolate showed a similar resistance pattern to that noted of the other two isolates, with the exception of erythromycin and trimethoprim susceptibility (Table 14, Isolate 3). Notably, the pattern of resistance to linezolid, tiamulin, clindamycin and chloramphenicol is typical of possession of the cfr gene, whose presence was confirmed in all three isolates by Portugal.
Table 14.
Antimicrobial susceptibility of the three linezolid‐resistant isolates reported from batches of Portuguese fattening pigs at slaughter, 2019
| Antibiotic | EUCAST ECOFF used (mg/L) | Isolate 1 | Isolate 2 | Isolate 3 | |||
|---|---|---|---|---|---|---|---|
| spa‐type t011, CC398 | spa‐type t011, CC398 | spa‐type t011, CC398 | |||||
| MIC (mg/L) | S or R | MIC (mg/L) | S or R | MIC (mg/L) | S or R | ||
| Cefoxitin | 4 | 16 | R | 8 | R | 16 | R |
| Chloramphenicol | 16 | > 64 | R | > 64 | R | > 64 | R |
| Ciprofloxacin | 1 | ≤ 0.25 | S | ≤ 0.25 | S | ≤ 0.25 | S |
| Clindamycin | 0.25 | > 4 | R | > 4 | R | > 4 | R |
| Erythromycin | 1 | > 8 | R | > 8 | R | 0.5 | S |
| Fusidic acid | 0.5 | ≤ 0.5 | S | ≤ 0.5 | S | ≤ 0.5 | S |
| Gentamicin | 2 | ≤ 1 | S | ≤ 1 | S | ≤ 1 | S |
| Kanamycin | 8 | 8 | S | ≤ 4 | S | ≤ 4 | S |
| Linezolid | 4 | 8 | R | 8 | R | 8 | R |
| Mupirocin | 1 | ≤ 0.5 | S | ≤ 0.5 | S | ≤ 0.5 | S |
| Penicillin | 0.12 | > 2 | R | > 2 | R | > 2 | R |
| Quinupristin/Dalfopristin | 1 | 4 | R | 4 | R | 4 | R |
| Rifampicin | 0.03 | ≤ 0.016 | S | ≤ 0.016 | S | ≤ 0.016 | S |
| Streptomycin | 16 | 8 | S | 8 | S | ≤ 4 | S |
| Sulfamethoxazole | 128 | ≤ 64 | S | ≤ 64 | S | ≤ 64 | S |
| Tetracycline | 1 | > 16 | R | > 16 | R | > 16 | R |
| Tiamulin | 2 | > 4 | R | > 4 | R | > 4 | R |
| Trimethoprim | 2 | > 32 | R | > 32 | R | ≤ 2 | S |
| Vancomycin | 2 | ≤ 1 | S | ≤ 1 | S | ≤ 1 | S |
S: Susceptible; R: Resistant. Grey shading: The pattern of resistance to linezolid, tiamulin, clindamycin and chloramphenicol is typical of possession of the cfr gene. Linezolid is one of the last‐resort antimicrobials for the treatment of highly‐resistant MRSA infections in humans and, therefore, the importance of monitoring resistance to this agent is underlined.
6.4. Discussion
The monitoring of MRSA in animals and food was voluntary in 2018/2019 and only a limited number of countries reported data on the occurrence of MRSA, with some countries additionally reporting data on spa‐type/clonal complex and antimicrobial susceptibility. The monitoring of food in 2018/2019 comprised investigations of various food products including meat derived from different animal sources. The monitoring of MRSA in various food products performed by MSs consistently indicates that MRSA can be detected, quite frequently, in different types of food. Such food included meat from cattle, pigs and poultry, as well as raw cow's milk in 2019. It should be underlined that the laboratory techniques used to detect MRSA employ selective bacterial culture and therefore, very low levels of contamination can be detected. Cross‐contamination between carcases on slaughterhouse lines or during production processes may also result in a higher prevalence in meat produced from animals than in the animals themselves. LA‐MRSA is considered a poor coloniser of humans and occurs uncommonly in persons without direct or indirect contact with livestock or their carcases (Graveland et al., 2010; Boost et al., 2013). Although a previous report has cautiously suggested that some strains of LA‐MRSA may be adapted to colonise and infect humans and implicate poultry meat as a possible source for humans (Larsen et al., 2016), food is not generally considered to be a significant source of MRSA infection or colonisation of humans (EFSA, 2009b). A recent risk assessment published by the UK Food Standards Agency reached the same conclusion (FSA, 2017).
The molecular typing and susceptibility data reported in 2018/2019 provided useful information in categorising MRSA isolates; and where spa‐typing data were reported from food‐producing animals, corresponding information on sequence type/clonal complex (ST/CC) was provided for most isolates in 2018 (98.2%) and all isolates in 2019 (100%). However, further typing data would in many cases provide extremely useful additional information to aid classification and help assess the origin and significance of the MRSA isolates. For example, possession of the IEC genes (chp, sak and scn) is considered an adaptation facilitating colonisation and infection of humans and is not usually a feature of animal strains (Cuny et al., 2015a; Larsen et al., 2016). Similarly, the presence of the PVL toxin is a virulence feature typically associated with most CA‐MRSA strains; other genetic factors can be associated with particular strains or may suggest a particular host preference (e.g. lukM has been associated with certain animal strains, particularly those affecting ruminants).
Monitoring of MRSA in food and healthy food‐producing animals (including horses)
In 2018 and 2019, molecular typing data were available for 8/345 and 59/173 MRSA isolates recovered from food, respectively. Considering the three broad categories of MRSA – community‐associated (CA), healthcare‐associated (HA) and livestock‐associated (LA) – all reported spa‐types in 2018 (8/8) and most of the isolates where typing data were available in 2019 (53/59) were considered to represent livestock‐associated lineages.
Considering food‐producing animals, spa‐types associated with LA‐ and HA‐MRSA were reported in 2018, while only livestock‐associated lineages were identified in 2019; as well as mecC‐MRSA in both 2018 and 2019. In total, molecular typing data were available for 325 MRSA isolates reported in 2018 and 439 isolates reported in 2019, with most isolates considered to represent LA‐MRSA (317/325 isolates in 2018 and 436/439 isolates in 2019).
A detailed discussion of MRSA spa‐types reported from the monitoring of food and food‐producing animals in 2018 and 2019 (including four isolates recovered from additional ad hoc sampling of some batches of pig meat by Austria in 2019) is available in Appendix G, and includes a graphical summary of the genetic diversity of MRSA isolates where typing data were available.
Temporal trends of MRSA prevalence in various types of meat and food‐producing animals
In 2018, the recommended method for the isolation of MRSA was revised by the EURL‐AR from the 2‐S method (which comprised a pre‐enrichment step and a selective enrichment step) to the 1‐S method (whereby the selective enrichment step is omitted). Therefore, direct comparisons of longitudinal data obtained using different protocols should be performed with caution.
Considering MRSA prevalence data obtained from Swiss fattening pigs at slaughter, generally prevalence has increased annually from 2010 to 2019, with a more marked increase noted from 2015 to 2017. This increase most likely represents the dissemination of particular livestock‐associated spa‐types in Swiss fattening pig populations; and where molecular typing data were available, all isolates in 2017 and 2019 were those associated with CC398, with most belonging to spa‐types t011 and t034 in 2017. A longitudinal study carried out by Kraemer et al. (2017) also supports these trends, in which MRSA prevalence of pig farms in Western Switzerland were reported to increase from 7.3% in 2008 to 31% in 2015. The complete epidemiological data should however be considered when evaluating trends apparent in this chapter, because the summary data reported to EFSA may not include full details of any methodological or other changes to monitoring procedures. A detailed longitudinal study illustrated that pigs are intermittently and repeatedly colonised, and that colonisation may also occur during transportation and while in the lairage (Bangerter et al., 2016). The detection of intermittent, repeated colonisation suggests that the number of animals sampled as part of a batch, including whether individual animals are sampled to represent a herd or batch, is likely to influence the batch or herd prevalence obtained. These factors should therefore be taken into consideration when comparing trends, as the Swiss annual MRSA monitoring examines a single pig from a herd at slaughter.
Regarding longitudinal data available for other countries, a decline in MRSA prevalence was noted in Belgian breeding and fattening pig herds from 2016 to 2019, as well as broiler meat reported by Germany from 2011 to 2018. The reasons for these declines were not apparent and could possibly reflect sampling variability; however findings are interesting because, generally, MRSA prevalence in animals and food has shown a progressive increase, where longitudinal studies have been performed. It is possible that measures imposed to control notifiable disease (African swine fever) in wild boar in 2018 and 2019 in Belgium may have also had an effect on the occurrence of MRSA in domestic pigs.
A relevant observation from the monitoring of Danish fattening pig herds in 2018 is the considerable difference in MRSA prevalence among differing herd types. Prevalence was reported at a substantially lower level among free‐range production type herds (including organic production) in comparison to conventional indoor production herds (20.2% and 89.2%, respectively); corroborating findings from the DANMAP (2016) report, which concludes that MRSA is less well maintained in free‐range pig herds compared to conventional pig herds. The movement and trade of live pigs have been reported as important routes for the spread of LA‐MRSA among pig herds (Broens et al., 2011; Schulz et al., 2019), and therefore, the MRSA situation at the top of the breeding pyramid, might be reflected among populations further down the pyramid. Notably in 2019, MRSA prevalence was reported at the extremely high level of 94.5% in Danish multiplier pig herds.
Susceptibility testing of MRSA isolates obtained from meat and food‐producing animals
The extremely high level of resistance to trimethoprim in MRSA isolates from Belgian fattening and breeding pig herds in 2019, as well as the extremely high level of resistance to tiamulin in isolates from batches of Portuguese fattening pigs at slaughter in 2019, presumably reflects the relatively common usage of these compounds in pig medicine in many European countries. Lincosamide resistance and macrolide susceptibility is an unusual phenotype which may be conferred by lnu genes. In a study of Finnish fattening pigs at slaughter, this unusual phenotype was observed among some CC398 isolates, and was associated with isolates lacking ermB, but harbouring lnuB (Heikinheimo et al., 2016). Considering the susceptibility of MRSA isolates to clindamycin and erythromycin, there was an equal occurrence of resistance to both compounds in Swiss calves in 2019 and Belgian meat production cattle herds in 2018. Conversely, clindamycin resistance exceeded that of erythromycin in Belgian fattening and breeding pig herds, slaughter batches of Portuguese fattening pigs and Swiss fattening pigs in 2019, as well as Belgian calf herds in 2018; this phenotype suggesting the possible presence of lnu genes.
cfr gene conferring resistance to linezolid in 2019
Linezolid is one of the last‐resort antimicrobial agents for the treatment of highly‐resistant MRSA infections in human and can be administered both orally and parenterally; resistance levels are low, with global surveillance studies reporting the prevalence of linezolid resistance in S. aureus to be < 1% (Gu et al., 2013). Resistance to linezolid was previously reported in MRSA spa‐type t011 from breeding pigs in Belgium in the EU Summary Report on AMR for 2013 and 2016, with three further LA‐MRSA isolates reported from fattening pigs in Portugal in 2019. All three isolates from Portugal were spa‐type t011, sequence type CC398 and showed a similar resistance pattern (Table 14), including resistance to linezolid, tiamulin, clindamycin and chloramphenicol. The presence of the cfr gene, which typically confers this pattern of resistance, was subsequently confirmed in all three isolates by Portugal.
The detection of cfr in MRSA spa‐type t011 from fattening pigs is significant because of the importance of linezolid in treating highly‐resistant MRSA infections in man. The number of countries which have reported susceptibility data on MRSA in animals is low; more widespread testing would indicate whether the occurrence of cfr is a localised phenomenon or the gene occurs more widely in LA‐MRSA in the animal population. The presence of the cfr gene may confer linezolid MICs of 4 mg/L determined by broth microdilution (Li et al., 2015 – wild‐type by the EUCAST linezolid ECOFF of ≤ 4 mg/L), although resistance to the other compounds typically conferred by cfr (CLI‐CHL‐TIA) was consistently noted in both the EFSA monitoring and by Li et al. (2015). For optimal detection of the cfr gene therefore, it is recommended that all isolates exhibiting resistance to CLI‐CHL‐TIA and displaying linezolid MICs of ≥ 4 mg/L, are screened for the cfr gene.
The findings also have wider significance because coagulase‐negative staphylococci can also harbour cfr resistance and may form a reservoir of this resistance gene, which can subsequently be transferred to S. aureus (Shen et al., 2013). A comprehensive monitoring programme covering MRSA in animals might therefore also need to include an assessment of the occurrence of cfr resistance in coagulase‐negative staphylococci. Shen et al. (2013) also documented that plasmids carrying the cfr gene, especially in staphylococci, frequently harbour additional resistance genes.
Main findings
-
–
The monitoring of MRSA in 2018 and 2019 provided extremely useful information on the occurrence of MRSA in livestock and food. The situation continues to develop and evolve and there is a clear requirement for the continued monitoring and appropriate molecular characterisation of MRSA isolates recovered from livestock and food.
-
–
Molecular characterisation is becoming increasingly necessary to fully evaluate the significance of MRSA isolates and there are limitations to the analyses which can be performed when spa‐typing is used as the only technique to characterise isolates. Conversely, the presence of the PVL toxin may not always be indicative of CA‐MRSA, highlighted in 2019 by the genotypes t012‐CC30 and t321‐CC1, which were considered most likely to represent community‐associated lineages yet lacked PVL.
-
–
Notably, the movement of live animals, as well as human travel, are important contributing factors to the spread of MRSA between countries, and therefore the occurrence data contained in this report may reflect such circumstances. Similarly, the occurrence of MRSA among meat samples reported by certain countries may not reflect the situation in corresponding animal populations for that country, as the summary data reported to EFSA does not include details of whether such meats were imported.
-
–
A significant observation from the 2019 monitoring includes the detection of linezolid‐resistant strains harbouring the cfr gene from pigs. Only a few reporting countries provided susceptibility data for MRSA isolates recovered in 2018/2019, and since linezolid is an important compound in human medicine for the treatment of MRSA, establishing whether linezolid resistance is widespread or more localised in distribution in MRSA in animals is highly relevant. Furthermore, as the cfr gene may confer linezolid MICs of 4 mg/L (using broth microdilution), it is recommended that all isolates displaying linezolid MICs of ≥ 4 mg/L and exhibiting resistance to the other compounds typically conferred by cfr, are screened for this gene.
-
–
The probable detection of CA‐MRSA USA300 from pig and cattle meat by Austria in 2019 is another important finding, as this strain can cause severe infections in humans and has a markedly different epidemiology from HA‐MRSA strains (Tenover and Goering, 2009).
-
–
Another noteworthy observation from the monitoring includes the considerable difference in MRSA prevalence reported from free‐range pig herds in comparison to that reported among conventional pig herds in Denmark in 2018.
-
–
Where typing data were available, most MRSA isolates were those associated with LA‐MRSA in both reporting years. However, spa‐types associated with CA‐ and HA‐MRSA were also reported, as well as mecC‐MRSA. The occasional detection of lineages of CA‐ and HA‐MRSA primarily associated with humans is perhaps not surprising, since the sporadic interchange of strains between humans and animals may be expected. Figure G.1 within Appendix G illustrates the genetic diversity of MRSA isolates recovered from food and healthy animals in 2018/2019. While the monitoring of MRSA is voluntary and not all countries contribute data, Figure G.1 (Appendix G) provides a summary of all reported findings in 2018/2019, against which changes in the reported occurrence of different MRSA lineages may be assessed in future.
Figure G.1.

- Note: this graph includes four isolates recovered from additional ad hoc sampling carried out by Austria in 2019.
Abbreviations
- %
percentage of resistant isolates per category of susceptibility or multiple resistance
- % f
percentage frequency of isolates tested
- % Res
percentage of resistant isolates
- –
no data reported
- AMR
antimicrobial resistance
- ARM
At‐retail monitoring
- AST
antimicrobial susceptibility testing
- BIOHAZ
EFSA Panel on Biological Hazards
- CA‐SFM
French Society for Microbiology
- CBP
clinical breakpoints
- CC
clonal complex
- CLSI
Clinical and Laboratory Standards Institute
- CP
carbapenemase producer
- CTX‐M
cefotaxime
- DD
disc diffusion method
- DIN
Deutsches Institut für Normung
- DL
dilution/dilution method
- EARS‐Net
European Antimicrobial Resistance Surveillance Network
- ECDC
European Centre for Disease Prevention and Control
- ECOFF
epidemiological cut‐off value
- EEA
European Economic Area
- ESBL
extended spectrum beta‐lactamase
- EUCAST
European Committee on Antimicrobial Susceptibility Testing
- EURL‐AR
EU Reference Laboratory for Antimicrobial Resistance ( www.crl-ar.eu)
- FWD
food‐ and waterborne diseases and zoonoses
- I
intermediate
- MDR
multidrug resistance
- MDRGI
multidrug‐resistant genomic island
- MIC
minimum inhibitory concentration
- MRSA
meticillin‐resistant Staphylococcus aureus
- MS
Member State
- NA
not applicable/not available
- PMQR
plasmid‐mediated quinolone resistance
- PVL
Panton‐Valentine leukocidin
- Q
quantitative
- QRDR
quinolone resistance‐determining regions
- R
resistant
- S
susceptible
- SIR
susceptible, intermediate, resistant
- ST
sequence type
- TESSy
The European Surveillance System
- WGS
whole genome sequencing
- WHO
World Health Organization
Antimicrobial substances
- AMC
amoxicillin/clavulanate
- AMP
ampicillin
- AZM
azithromycin
- CAZ
ceftazidime
- CHL
chloramphenicol
- CIP
ciprofloxacin
- CLA
clavulanate
- CLI
clindamycin
- CST
colistin
- CTX
cefotaxime
- ERY
erythromycin
- FUS
fusidic acid
- GEN
gentamicin
- KAN
kanamycin
- LZD
linezolid
- MEM/MER
meropenem
- MUP
mupirocin
- NAL
nalidixic acid
- QD
quinupristin/dalfopristin
- RIF
rifampicin
- SUL
sulfonamides
- STR
streptomycin
- SXT
sulfamethoxazole
- TGC
tigecycline
- TIA
tiamulin
- TET
tetracycline
- TMP
trimethoprim
MSs of the EU and other reporting countries
- Austria
AT
- Belgium
BE
- Bulgaria
BG
- Croatia
HR
- Cyprus
CY
- Czechia
CZ
- Denmark
DK
- Estonia
EE
- Finland
FI
- France
FR
- Germany
DE
- Greece
GR
- Hungary
HU
- Ireland
IE
- Italy
IT
- Latvia
LV
- Lithuania
LT
- Luxembourg
LU
- Malta
MT
- Netherlands
NL
- Poland
PL
- Portugal
PT
- Romania
RO
- Slovakia
SK
- Slovenia
SI
- Spain
ES
- Sweden
SE
- United Kingdom
UK
Non‐MSs reporting
- Iceland
IS
- Republic of North Macedonia
MK
- Norway
NO
- Switzerland
CH
Definitions
- ‘Antimicrobial‐resistant isolate’
In the case of quantitative data, an isolate was defined as ‘resistant’ to a selected antimicrobial when its minimum inhibitory concentration (MIC) value (in mg/L) was above the cut‐off value or the disc diffusion diameter (in mm) was below the cut‐off value. The cut‐off values, used to interpret MIC distributions (mg/L) for bacteria from animals and food, are shown in Material and methods, Tables 5, 6 and 7. In the case of qualitative data, an isolate was regarded as resistant when the country reported it as resistant using its own cut‐off value or break point
- ‘Level of antimicrobial resistance’
The percentage of resistant isolates among the tested isolates
- ‘Reporting MS group’
MSs (MSs) that provided data and were included in the relevant table for antimicrobial resistance data for the bacteria–food/animal category–antimicrobial combination
- Terms used to describe the antimicrobial resistance levels
Rare: < 0.1% Very low: 0.1% to 1.0% Low: > 1.0% to 10.0% Moderate: > 10.0% to 20.0% High: > 20.0% to 50.0% Very high: > 50.0% to 70.0% Extremely high: > 70.0%
Appendix A – High‐level resistance to ciprofloxacin among certain Salmonella serovars recovered from the poultry origins, as well as a pig carcase
1.
High‐level resistance to ciprofloxacin in S. Kentucky
Considering individual serovars, S. Kentucky accounted for most of the Salmonella isolates recovered from the poultry origins and pig carcases which exhibited MICs to ciprofloxacin of ≥ 4 mg/L (181/253). Within each of the poultry origins, the highest number of Salmonella isolates exhibiting high‐level resistance to this antimicrobial was attributed to S. Kentucky; this serovar accounting for 44.9%, 88.9%, 73.6%, 60% and 90.7% of the total number of isolates displaying MICs of ≥ 4 mg/L from broiler carcases, turkey carcases, broilers, laying hens and turkeys, respectively. Additionally, a single isolate recovered from a pig carcase also displayed high‐level ciprofloxacin resistance and was serotyped as S. Kentucky. S. Kentucky isolates exhibiting high‐level ciprofloxacin resistance are likely to belong to the multilocus sequence type (ST) 198 clone, which has shown epidemic spread across Africa first, then to the Middle East, Asia and Europe (Le Hello et al., 2011, 2013; Hawkey et al., 2019). Notably in 2018, the occurrence of this serovar exhibiting high‐level resistance was observed by many MSs from most parts of Europe, suggesting further clonal expansion (S. Kentucky ST198‐X1) within poultry populations. In view of reported MIC values, most of the S. Kentucky isolates exhibiting high‐level ciprofloxacin resistance in 2018/2019 displayed MICs of ≥ 8 mg/L (only one S. Kentucky isolate from a broiler flock displayed an MIC of 4 mg/L). Additionally, a very high proportion of the poultry/pig S. Kentucky isolates displaying ciprofloxacin MICs of ≥ 4 mg/L (n = 181) were also multiresistant (57.5%), primarily showing resistance to ampicillin, gentamicin, nalidixic acid, sulfamethoxazole and tetracycline (AMP‐CIP‐GEN‐NAL‐SMX‐TET). Figure A.1 presents the overall AMR levels among MDR S. Kentucky isolates from poultry which exhibited high‐level ciprofloxacin resistance.
Figure A.1.

- n: Total number of MDR S. Kentucky isolates exhibiting high‐level ciprofloxacin resistance. NB: The single S. Kentucky isolate recovered from a pig carcase in 2019, which also displayed high‐level ciprofloxacin resistance, additionally showed resistance to AMP‐GEN‐NAL‐SMX‐TET.
In 2018, S. Kentucky was the seventh most commonly reported serovar in humans, with 663 cases reported by EU/EEA countries. From the monitoring of human cases in 2018, very high to extremely high levels of resistance were noted to gentamicin (51.1%), sulfonamides (71.1%), ampicillin (72.7%), tetracyclines (76.6%), ciprofloxacin (85.7%) and nalidixic acid (87.3%); consistent with the multiresistance patterns observed in isolates from the monitoring of poultry in 2018, and the possible dissemination of the S. Kentucky ST198 strain within Europe. Furthermore, of 3,953 Salmonella isolates from humans where ciprofloxacin MIC data was available, 180 of these (4.6%) exhibited MICs of ≥ 4 mg/L, of which S. Kentucky accounted for 140 (88.6%). Figure A.2 shows the spatial distributions of ciprofloxacin resistance among S. Kentucky isolates reported from human cases in 2018.
Figure A.2.

Spatial distribution of ciprofloxacin resistance among S. Kentucky from human cases in 2018
Hawkey et al. (2019) recently documented that MDR S. Kentucky ST198 is a globally disseminated clone, capable of rapid spread and accumulation of last‐line AMR determinants. Acquisition of SGI1 and plasmids, as well as mutations in the QRDR, were the only genetic features found during this study to explain the global epidemiological success of the MDR S. Kentucky ST198 lineage which is highly resistant to ciprofloxacin. Coipan et al. (2020) describe how a clone of this lineage, with an ESBL‐gene (bla CTX‐M-14b) incorporated on the chromosome, has emerged in Europe. In contrast to plasmid‐mediated resistance, chromosomal‐mediated resistance is most likely to be maintained also without antibiotic pressure, especially if it incurs no fitness cost for the bacteria.
High‐level resistance to ciprofloxacin among other Salmonella serovars
While S. Kentucky generally accounted for most of the Salmonella isolates exhibiting high‐level resistance and there was a significant contribution from S. Infantis in broilers, laying hens and broiler carcases, many other serovars exhibiting resistance by this definition were noted among the poultry origins (namely S. Newport, S. Bardo, S. Enteritidis, S. Bovismorbificans, S. Paratyphi B var. Java, S. Muenster, S. Ohio and S. Saintpaul). Figure A4 shows the number of isolates exhibiting high‐level resistance to ciprofloxacin by serovar within each of the poultry origins.
Considering ciprofloxacin MICs among the serovars presented in Figure A.3 (excluding S. Kentucky), MICs of 4 mg/L were generally reported, although there were a few exceptions. MICs of 8 mg/L were noted in two S. Infantis isolates from broilers, a single S. Bovismorbificans isolate from laying hens and a single S. Enteritidis isolate from turkeys, as well as from single S. Bardo, S. Enteritidis and S. Newport isolates from broiler carcases. Additionally, MICs of > 8 mg/L were noted in an S. Ohio isolate from laying hens, as well as an S. Infantis isolate and an isolate of unspecified serovar from broilers. Single S. Infantis and S. Muenster isolates from broiler and turkey carcases, respectively, also displayed MICs of > 8 mg/L.
Figure A.3.

- n: Total number of Salmonella isolates exhibiting high‐level ciprofloxacin resistance; ns: number of isolates by serovar exhibiting high‐level ciprofloxacin resistance; * serovar unspecified; salmonellas in the legend are listed according to their predominance within all the animal/carcase origins; in addition, a single S. Kentucky isolate displaying high‐level ciprofloxacin resistance was recovered from a pig carcase in 2019.
Appendix B – Cefotaxime, ceftazidime and ciprofloxacin resistance in Salmonella spp. recovered from each of the animal/carcase origins and humans considering all reporting MSs in 2018/2019
1.
Table B.1 summarises cefotaxime, ceftazidime and ciprofloxacin resistance in Salmonella spp. recovered from each of the animal/carcase origins and humans considering all reporting MSs in 2018/2019.
Appendix C – Occurrence of resistance at the Salmonella serovar level
1.
In carcases of food‐producing animals
Breakdown of the most prevalent serovars
The detailed reporting of results at the serovar level clearly demonstrated the major contribution of a few serovars to the observed occurrence of resistance in Salmonella spp. Figure C.1 illustrates the relative contribution of some of the most dominant serovars recovered from each of the carcase origins considering all reporting countries (including non‐MSs). In pig carcases, six serovars (monophasic Typhimurium, Derby, Typhimurium, Rissen, Infantis and Brandenburg) accounted for 83.3% of Salmonella spp.; while in calf carcases, serovars monophasic Typhimurium, Derby, Anatum, Dublin, London and Ohio accounted for 57.1% of the total Salmonella spp. isolated from this origin. Additionally, in broiler carcases, six serovars (Infantis, Indiana, Enteritidis, Chester, Montevideo and Derby) accounted for 67.4% of Salmonella isolates; while in turkey carcases, Bredeney, monophasic Typhimurium, Agona, Newport, Hadar and Indiana accounted for 73.7% of Salmonella spp. isolated from this origin.
Figure C.1.

- * Monophasic S. Typhimurium includes antigenic formulas; serovars in the legend are listed according to their predominance within all the carcase origins. From calf carcases, S. Dublin and S. London were joint fourth most frequently reported.
Complete susceptibility and multidrug resistance
Patterns of resistance associated with these different serovars have a marked influence on the overall resistance levels in Salmonella spp., and Figure C.2 summarises the proportion of completely susceptible and MDR isolates among particular serovars recovered from each of these carcase origins considering all reporting countries (including non‐MSs). Large contributions of a few resistant serovars to the overall level of MDR among Salmonella spp. were evident within some of the carcase origins; notably S. Infantis in broiler carcases, and S. Typhimurium and its monophasic variant in pig carcases.
Figure C.2.

- N: Total number of Salmonella spp. or total number of particular serovars recovered from the carcase monitoring; * monophasic S. Typhimurium includes antigenic formulas.
In food‐producing animal populations
Breakdown of the most prevalent serovars
Considering all reporting countries (including non‐MSs), the relative contribution of some of the most dominant serovars recovered from each of the food‐producing animal populations is illustrated in Figure C.3. In pigs, six serovars (Derby, monophasic Typhimurium, Typhimurium, Rissen, Brandenburg and Goldcoast) accounted for 83% of Salmonella spp.; while in calves, serovars monophasic Typhimurium, Typhimurium, Anatum, Meleagridis, Enteritidis and Mbandaka accounted for 64.1% of the total Salmonella spp. isolated from this origin. Additionally, in broilers, six serovars (Infantis, Enteritidis, Mbandaka, Kentucky, Livingstone and Senftenberg) accounted for 62.9% of Salmonella isolates, while in laying hens six serovars (Enteritidis, Infantis, Kentucky, Typhimurium, Senftenberg and Mbandaka) accounted for 62.4% of isolates; and in turkeys, serovars Derby, Infantis, Kentucky, Newport, Bredeney and Hadar accounted for 58% of Salmonella isolates.
Figure C.3.

- * Monophasic S. Typhimurium includes antigenic formulas; serovars in the legend are listed according to their predominance within all the animal origins. From calves, S. Anatum and S. Meleagridis were the joint third most frequently reported; S. Enteritidis and S. Mbandaka were the joint fourth most frequently reported.
Complete susceptibility and multidrug resistance
The patterns of resistance associated with these different serovars influenced the overall resistance levels in Salmonella isolates, and Figure C.4 summarises the proportion of completely susceptible and MDR isolates among particular serovars recovered from each of these food‐producing animal populations considering all reporting countries (including non‐MSs).
Figure C.4.

- * monophasic S. Typhimurium includes antigenic formulas. N: Total number of Salmonella spp. or total number of particular serovars recovered from the monitoring of animals.
Resistance exhibited by particular serovars
S. Derby was the most common serovar detected in fattening pigs and turkeys, as well as the second most frequently recovered from pig and calf carcases, accounting for 32%, 25.2%, 25.8% and 13.2% of Salmonella isolates recovered from these animal/carcase origins, respectively (see Figures C.1 and C.3). While multidrug resistance was not frequently observed among S. Derby isolates from pigs and their derived carcases (13.9% and 9.9%, respectively), it was detected at high levels in isolates from calf carcases (33.3%) and turkeys (22.9%); with 87.3% (179/205) of turkey isolates showing resistance to one or more antimicrobials. Notably, the MDR analysis performed on the carcase/animal isolates comprised ten antimicrobial classes and included the glycylcycline class.
Among S. Derby isolates recovered from these animal/carcase origins, different core resistance patterns predominated. In pigs, where 16/115 (13.9%) isolates were MDR, the most common resistance pattern was to ampicillin, sulfamethoxazole and trimethoprim (4/16 MDR S. Derby reported by Denmark); while in pig carcases, where 28/283 (9.9%) were MDR, the predominant core resistance pattern was to sulfamethoxazole, trimethoprim and tetracycline (9/28 MDR S. Derby reported by Croatia, Denmark, France and Spain). This latter core pattern with the addition of ampicillin resistance (AMP‐SMX‐TMP‐TET) was most frequently noted among MDR isolates from turkeys (47/205, 22.9%). Among MDR isolates recovered from calf carcases (4/12, 33.3%), the most frequent core pattern was resistance to chloramphenicol, tigecycline, sulfamethoxazole and tetracycline.
Recent studies on S. Derby originating from the pork and poultry sectors in France identified four major host‐specific lineages, corresponding to multilocus sequence typing (MLST) profiles ST39, ST40, ST71 and ST682 (Sévellec et al., 2018, 2020). The lineages ST39, ST40 and ST682 were determined to be associated with pork, and ST71 with poultry. While ST71 and ST682 isolates were generally devoid of resistance genes, ST40 isolates commonly harboured several resistance genes, with Clade 2 of this lineage characterised by SGI1 and the pattern of resistance to streptomycin, sulfonamides and tetracycline. Additionally, the presence of a resistance gene for fosfomycin was detected in all genomes from ST39 (Sévellec et al., 2020). Results obtained from the EFSA monitoring of turkeys at the European level in 2018 contrast with the findings of Sévellec et al., with a proportion of S. Derby from turkeys demonstrating resistance in the EFSA monitoring. The results may therefore illustrate geographical differences in the distribution of S. Derby lineages and associated resistance patterns in the different reporting European countries. Notably, five out of six MSs reported MDR among S. Derby isolates recovered from turkeys, with the most frequent core MDR pattern (AMP‐SMX‐TMP‐TET) noted among isolates from Spain and the United Kingdom (38.3% of all MDR S. Derby isolates). Multidrug resistance was not observed among four isolates recovered from turkeys by France, however, 3/4 of these isolates were resistant to both sulfamethoxazole and tetracycline.
Resistance to five antimicrobial classes was observed in single isolates recovered from calf carcases and pigs, as well as two isolates recovered from pig carcases and 17 isolates from turkeys. Additionally, a single isolate recovered from a pig carcase was resistant to six antimicrobial classes. Ciprofloxacin/nalidixic acid resistance among MDR isolates was reported in single isolates recovered from calf carcases and pigs, three isolates from pig carcases and 24 isolates from turkeys. Tigecycline resistance was only observed in a single MDR isolate recovered from a calf carcase.
Resistance to third‐generation cephalosporins was not detected in S. Derby isolates from pigs, calves or calf carcases, and only single isolates reported from pig carcases by Romania (N = 1) and turkeys by Poland (N = 1) were determined to be resistant to this antimicrobial class. Both S. Derby isolates exhibited an ESBL phenotype, with the isolate from turkeys also expressing an AmpC phenotype. Where third‐generation cephalosporin resistance was reported in these two isolates, only the isolate recovered from a pig carcase also displayed ‘microbiological’ resistance to ciprofloxacin (MIC > 0.064 mg/L). Nevertheless, when ciprofloxacin and cefotaxime resistance were interpreted using clinical breakpoints (CBPs), this isolate did not display combined ‘clinical’ resistance.
Monophasic S . Typhimurium commonly exhibited resistance, and was the most dominant serovar recovered from pig carcases, calf carcases and calves, as well as the second most dominant serovar recovered from turkey carcases and pigs; accounting for 33.3%, 14.3%, 15.6%, 12.6% and 27.3% of Salmonella isolates recovered from these animal/carcase origins, respectively (see Figures C.1 and C.3). Notably, the proportion of all Salmonella isolates showing MDR in calves, calf carcases, pig carcases and pigs was greatly influenced by the occurrence of multiresistant monophasic S. Typhimurium, which accounted for 39.1% (9/23), 47.6% (10/21), 56.4% (268/475) and 56.5% (78/138) of the MDR Salmonella isolates recovered from these carcase/animal origins, respectively (see Figure C.5). Similarly, this serovar contributed the highest level of multiresistance (13%, 7/54) to overall MDR levels among Salmonella isolates recovered from turkey carcases, as did S. Infantis.
Figure C.5.

- n: Total number of Salmonella isolates exhibiting MDR; serovars contributing the highest levels of MDR to overall MDR levels in Salmonella spp. are illustrated with a percentage; * monophasic S. Typhimurium includes antigenic formulas.
Although a greater number of monophasic S. Typhimurium isolates were recovered from pigs and their derived carcases, this serovar exhibited MDR among all carcase/animal origins, with the most frequent pattern of resistance to ampicillin, sulfamethoxazole and tetracycline. This was followed in pig carcases by the same pattern with the addition of chloramphenicol (AMP‐CHL‐SMX‐TET), while in pigs, two core MDR patterns were next most frequently observed: resistance to ampicillin, sulfamethoxazole, trimethoprim and tetracycline, as well as the same pattern with the addition of chloramphenicol (AMP‐CHL‐SMX‐TMP‐TET). Notably among the MDR isolates recovered from pigs and calves, as well as their derived carcases, sulfamethoxazole resistance was observed at levels of 98.7%, 77.8%, 98.5% and 100% from these origins, respectively. Among the multiresistant monophasic S. Typhimurium isolates recovered from poultry, all isolates displayed resistance to sulfamethoxazole.
Monophasic S. Typhimurium has spread widely among European pig populations. Particular MDR patterns are associated with monophasic S. Typhimurium and because this serovar was prevalent in many countries, these patterns greatly influenced the overall resistance figures. This is exemplified by resistance to ampicillin, sulfamethoxazole and tetracycline which occurred as an MDR pattern without additional resistances in 179/366 (48.9%) monophasic S. Typhimurium isolates from pig carcases and in 42/98 (42.9%) monophasic S. Typhimurium isolates from pigs. This resistance pattern (together with resistance to streptomycin) is typical of the European clone of monophasic S. Typhimurium (Hopkins et al., 2010). The genes conferring resistance to these antimicrobials are commonly found in association together with IS26 mobile genetic elements, responsible for their integration at different chromosomal locations, in recently described European strains of monophasic S. Typhimurium (Sun et al., 2019). It is noteworthy that multidrug resistance in the European clone of monophasic S. Typhimurium appears to have originated from integration of MDR plasmids into the chromosome, facilitated by the presence of these IS26 mobile genetic elements (Sun et al., 2019).
Resistance to five antimicrobial classes was observed among isolates from pigs, calves and broilers, as well as pig carcases; resistance to six antimicrobial classes was noted in nine isolates from pig carcases and two isolates from pigs, as well as single isolates from calves and broilers. Single isolates originating from pig carcases, pigs and calves also exhibited resistance to seven antimicrobial classes; a single isolate recovered from a pig additionally showed resistance to eight antimicrobial classes. Ciprofloxacin/nalidixic acid resistance among MDR isolates from broilers, pigs and calves, as well as carcases of pigs, calves and turkeys were observed at levels of 7.1%, 9%, 22.2%, 6.3%, 0% and 28.6%, respectively. Tigecycline resistance was reported in two MDR isolates from pig carcases, as well as a single MDR isolate from broilers.
In 2019, monophasic S. Typhimurium was the third most frequent serovar causing human infection in Europe, with 6,493 cases reported by EU/EEA countries. While extremely high levels of MDR (73.8%) were observed among 1,594 isolates from human cases in 2019 (those tested against the panel of nine antimicrobial classes; the MDR analysis of human isolates did not include the glycylcycline class), combined ‘microbiological’ resistance to ciprofloxacin and cefotaxime was very low (0.4%) among 1,819 tested isolates from human cases. Notably, only one monophasic S. Typhimurium isolate recovered from a pig by Italy displayed combined ‘microbiological’ resistance to these two highest priority CIAs; combined ‘microbiological’ resistance to ciprofloxacin and cefotaxime was not detected among monophasic S. Typhimurium isolates recovered from the other carcase/animal origins. Considering resistance to third‐generation cephalosporins among the carcase/animal origins, only six monophasic S. Typhimurium isolates recovered from pigs and their derived carcases displayed resistance to this antimicrobial class. Italy reported resistance to cefotaxime/ceftazidime in 2/59 monophasic S. Typhimurium isolates from pig carcases (both with an ESBL phenotype), as well as 3/31 isolates from pigs (one with an ESBL phenotype and one with an AmpC phenotype; the third isolate, although resistant to cefotaxime/ceftazidime on supplementary testing, was not characterised as possessing either an ESBL or AmpC phenotype due to borderline but negative synergy testing, as well as cefoxitin susceptibility); while Czechia reported resistance to this class in 1/3 monophasic S. Typhimurium isolates from pig carcases (AmpC phenotype). No monophasic S. Typhimurium isolates recovered from calves or poultry, or their derived carcases displayed resistance to third‐generation cephalosporins. From the monitoring of human monophasic S. Typhimurium cases reported to ECDC in 2019, out of 1,805 isolates for which data were available, eight had an ESBL phenotype and six had an AmpC phenotype, with genes encoding different types of CTX‐M enzymes as well as CMY‐2, SHV‐12 and AmpC1 enzymes detected.
S . Typhimurium was the second most frequently reported serovar from calves, as well as the third most commonly reported serovar from pigs and pig carcases; accounting for 14.1%, 13.9% and 10.8% of Salmonella isolates recovered from these origins, respectively (see Figures C.1 and C.3). Among S. Typhimurium isolates recovered from calves, pigs and pig carcases, multidrug resistance was also frequently observed: 77.8%, 62% and 63%, respectively. Notably, the proportion of all Salmonella isolates showing MDR in calves was greatly influenced by the occurrence of multiresistant S. Typhimurium, which accounted for 30.4% (7/23) of the MDR Salmonella isolates recovered from this animal population (see Figure C.5).
Although a greater number of S. Typhimurium isolates were recovered from pigs, laying hens and pig carcases, this serovar exhibited MDR among all carcase/animal origins. A wide range of different MDR patterns were reported among S. Typhimurium isolates from pigs and their derived carcases. The most frequent MDR core pattern among isolates from pigs, as well as calf carcases, was resistance to ampicillin, sulfamethoxazole and tetracycline; although only one S. Typhimurium isolate exhibited MDR from calf carcases. Among isolates from pig carcases, the predominant MDR pattern was resistance to ampicillin, chloramphenicol, sulfamethoxazole and tetracycline. This latter core pattern was also the most frequently noted among MDR isolates from broilers and turkeys. Although genotypic data were not reported, mobile genetic elements which could account for this resistance pattern in S. Typhimurium isolates have previously been described. Salmonella genomic island 1 (SGI1), known to contain a multidrug resistance region located on a complex class 1 integron designated In104, confers pentavalent resistance (the ampicillin, chloramphenicol, streptomycin, sulfamethoxazole, tetracycline resistance phenotype – ACSSuT) and has widely been documented in a range of Salmonella serovars.
Of the seven MDR S. Typhimurium isolates recovered from calves, six different resistance patterns were noted, with resistance to ampicillin, sulfamethoxazole, trimethoprim and tetracycline observed in two of these isolates. In laying hens, the most frequent MDR core pattern was to gentamicin, sulfamethoxazole and tetracycline; while in broiler carcases, the pattern ampicillin, sulfamethoxazole and tetracycline was most commonly reported. Of only four MDR S. Typhimurium isolates recovered from turkey carcases, four different combinations were noted. Notably, all MDR S. Typhimurium isolates recovered from calves and turkeys, as well as their derived carcases exhibited resistance to ampicillin (100%), while resistance to this antimicrobial was noted in most of the MDR isolates from pigs and broilers, and their derived carcases.
Resistance to five antimicrobial classes was observed among isolates from pigs and their derived carcases, as well as a couple of isolates from calves, turkeys and turkey carcases. Among a few isolates from pigs, broilers and pig carcases, resistance to six antimicrobial classes was noted. Furthermore, resistance to seven antimicrobial classes was observed in a single isolate from turkeys. Ciprofloxacin/nalidixic acid resistance among MDR isolates from laying hens, pig carcases, turkey carcases, calves, broilers, pigs and turkeys were observed at levels of 10%, 14.7%, 25%, 28.6%, 33.3%, 35.5% and 45.5%, respectively. Tigecycline resistance among multiresistant S. Typhimurium isolates was reported in four MDR isolates from pig carcases, and single MDR isolates from pigs, calves and broiler carcases.
Considering resistance to third‐generation cephalosporins among the carcase/animal origins, Spain was the only country to report resistance to this antimicrobial class in 1/4 S. Typhimurium isolates from turkeys (ESBL phenotype). Additionally, where cefotaxime/ceftazidime resistance was reported in this isolate, ‘microbiological’ resistance to ciprofloxacin was also observed. No S. Typhimurium isolates recovered from the other animal or carcase origins displayed resistance to third‐generation cephalosporins. In view of human cases of S. Typhimurium, this serovar was identified as the second most common in 2019, with 9,100 cases reported by EU/EEA countries. While multidrug resistance among human isolates was observed at a lower level (30.9% of 834 isolates) to that noted among its monophasic variant (73.8%), combined ‘microbiological’ resistance to ciprofloxacin and cefotaxime was observed at the same level (0.4% of 2,429 tested S. Typhimurium isolates and 0.4% of 1,819 tested monophasic S. Typhimurium isolates). Additionally of 2,375 human S. Typhimurium isolates for which data were available to ECDC in 2019, 21 isolates exhibited an ESBL phenotype and 3 isolates exhibited an AmpC phenotype; genes encoding different types of CTX‐M enzymes, as well as CMY‐2, OXA‐1 and OXA‐48 were detected.
Interestingly, S. Rissen isolates recovered from pig carcases displayed similar levels of MDR to those of S. Typhimurium isolates (recovered from pigs and their derived carcases), where 57.7% (45/78) of S. Rissen isolates were multiresistant. Although the proportion of MDR Salmonella isolates in pig carcases was mostly influenced by the occurrence of multiresistant S. Typhimurium and its monophasic variant (72.2%, 343/475), S. Rissen accounted for 9.5% of the MDR Salmonella isolates recovered from this carcase origin (see Figure C.5).
Multiresistant S. Rissen isolates were recovered from pigs, broilers and laying hens, as well as carcases of pigs and broilers. While MDR was not frequently observed among S. Rissen isolates from pigs (3/14, 21.4%), a very high proportion of isolates exhibited MDR from pig carcases (45/78, 57.7%), with a wide range of different resistance patterns noted. The most frequent MDR pattern among isolates from pig carcases was resistance to ampicillin, chloramphenicol, sulfamethoxazole, trimethoprim and tetracycline (26.7%). García‐Fierro et al. (2016) previously identified a dominant S. Rissen clone in pigs, pork and humans in Spain, which was shown to carry genes conferring resistance to ampicillin, chloramphenicol, streptomycin, sulfonamides, tetracycline and trimethoprim at varying frequencies, mostly on integrons. S. Rissen is also a common serovar in pigs, chicken, pork and man in some parts of Asia. Pornsukarom et al. (2015) demonstrated that S. Rissen isolates originating from Thai pig farms were frequently multidrug resistant to most of the antimicrobials listed above.
A single S. Rissen isolate recovered from broiler carcases also exhibited resistance to ampicillin, chloramphenicol, sulfamethoxazole, trimethoprim and tetracycline. Of only three MDR isolates recovered from pigs, three different combinations were noted, of which resistance to ampicillin, trimethoprim and tetracycline was a feature of all three. In broilers, where 5/30 (16.7%) S. Rissen isolates exhibited MDR, four different combinations were noted (the most common being resistance to ampicillin, cefotaxime, chloramphenicol, ciprofloxacin, gentamicin, sulfamethoxazole, trimethoprim and tetracycline). Resistance to six antimicrobial classes was also observed among isolates from pig carcases and broilers, as well as resistance to seven antimicrobial classes among isolates from pigs and their derived carcases. The core pattern of resistance to ampicillin, sulfamethoxazole, trimethoprim and tetracycline was noted in the only two MDR S. Rissen isolates recovered from laying hens (N = 12). Tigecycline resistance was not a feature of any of the MDR S. Rissen isolates recovered from these animal/carcase origins.
Resistance to third‐generation cephalosporins was detected in two S. Rissen isolates reported from broilers by Spain (both with an ESBL phenotype), as well as a single isolate recovered from pigs by Italy (AmpC phenotype). Where third‐generation cephalosporin resistance was reported in the two isolates from broilers, ‘microbiological’ resistance to ciprofloxacin was also observed.
Considering S. Infantis, this serovar was most frequently recovered from broilers and their derived carcases, accounting for 37.6% and 36.3% of Salmonella isolates recovered from these origins, respectively (see Figures C.1 and C.3). Additionally, this serovar was the second most frequently reported in laying hens and turkeys (9.6% and 8.1%, respectively), as well as the fifth most common among pig carcases (3.2%). While multidrug resistance was common among S. Infantis isolates from broilers and their derived carcases, as well as turkeys and their derived carcases (80.2%, 68%, 75.8% and 87.5%, respectively), isolates recovered from laying hens (N = 114) were less frequently MDR (19.3%). This was also apparent in S. Infantis isolates recovered from pig carcases (MDR: 14.3%), although the total number of isolates available for analysis was relatively low (N = 35). Notably, the proportion of all Salmonella isolates showing MDR in broilers and their derived carcases was greatly influenced by the occurrence of multiresistant S. Infantis, which accounted for 79% (630/797) and 75.3% (217/288) of the MDR Salmonella isolates from these origins, respectively (see Figure 64C). Similarly, this serovar contributed the highest levels of multiresistance to overall MDR among Salmonella isolates recovered from laying hens, turkeys and turkey carcases (as did monophasic S. Typhimurium in turkey carcases).
Although a wide range of different MDR patterns were reported among S. Infantis isolates from poultry, the most frequent core pattern of resistance was to ciprofloxacin, nalidixic acid, sulfamethoxazole and tetracycline. This resistance pattern is typical of a major European clone of S. Infantis which is prevalent among broilers (Nógrády et al., 2012). Where MDR was detected, this resistance profile (resistance to only ciprofloxacin, nalidixic acid, sulfamethoxazole and tetracycline) accounted for 46%, 50%, 60.3%, 74.2% and 100% of the multiresistant S. Infantis isolates recovered from turkeys, laying hens, broilers, broiler carcases and turkey carcases, respectively. Although genotypic data were not reported, previous scientific publications in Europe highlight the involvement of plasmids, which appear to be responsible for resistance in many European MDR S. Infantis isolates (Nógrády et al., 2012; Franco et al., 2015). In Australia, an S. Infantis strain harbouring a SGI1 homologue with an integron related to In104 and conferring resistance to streptomycin, sulfamethoxazole and trimethoprim was identified (Levings et al., 2005).
Resistance to five antimicrobial classes was noted among isolates from all poultry origins, with the exception of turkey carcases where all isolates displayed the core resistance pattern as described above (CIP‐NAL‐SMX‐TET). Resistance to six antimicrobial classes was noted among isolates from broilers and turkeys, as well as a single isolate from laying hens; while four isolates from broilers also displayed resistance to seven antimicrobial classes. Additionally, tigecycline resistance was observed among some MDR isolates from poultry, with the exception once more of turkey carcases. Multiresistant S. Infantis was also reported from pig carcases; of only five MDR isolates, four different combinations were noted, of which resistance to sulfamethoxazole and tetracycline was a feature of all five isolates.
Resistance to third‐generation cephalosporins was detected in 34 S. Infantis isolates recovered from broilers, 30 originating from Italy (all displaying an ESBL phenotype, with 6/30 also exhibiting an AmpC phenotype) and 4 from Hungary (2 exhibiting an ESBL phenotype and 2 exhibiting an AmpC phenotype). Additionally, Italy reported resistance to this antimicrobial class in 7/12 S. Infantis isolates from turkeys and in 1/11 isolates from laying hens. An ESBL phenotype was identified in the isolate from laying hens and seven isolates from turkeys, as well as an AmpC phenotype in two of the seven isolates from turkeys. For information on ESBL‐carrying S. Infantis, please see the specific text box within the discussion. Where third‐generation cephalosporin resistance was reported, 32/34 isolates from broilers and all seven isolates from turkeys, as well as the single isolate from laying hens, displayed ‘microbiological’ resistance to ciprofloxacin (MIC > 0.064 mg/L). Nevertheless, when ciprofloxacin and cefotaxime resistance were interpreted using clinical breakpoints (CBPs), no isolates displayed combined ‘clinical’ resistance. While high‐level resistance to ciprofloxacin (MIC ≥ 4 mg/L) was mostly observed among S. Kentucky isolates from poultry, 19.8% (50/252) of isolates displaying resistance by this definition were attributed to S. Infantis. Particular MDR patterns are associated with S. Infantis and because this serovar was prevalent in many countries, these patterns greatly influenced the overall resistance figures. Moreover, resistance to third‐generation cephalosporins, as well as high‐level resistance to ciprofloxacin, further underline the significance of this multiresistant serovar.
Considering human cases of S. Infantis, this serovar was identified as the fourth most common in 2018, with 1,868 cases reported by EU/EEA countries. While high levels of MDR (41.8%) were observed among 378 isolates from human cases in 2018 combined ‘microbiological’ resistance to ciprofloxacin and cefotaxime was low among 713 tested isolates from human cases (4.6%). Additionally of 450 human S. Infantis isolates for which data were available to ECDC in 2018, 26 isolates exhibited an ESBL phenotype and one isolate exhibited an AmpC phenotype; genes encoding different types of CTX‐M enzymes, as well as CMY‐2 were detected.
MDR and ESBL‐producing S. Infantis.
In 2018, the proportion of all Salmonella isolates showing MDR in broilers and their derived carcases was greatly influenced by the occurrence of multiresistant S. Infantis, which accounted for 79% and 75.3% of the MDR Salmonella isolates from these origins, respectively. Additionally, this serovar accounted for 15.8% and 13% of the MDR isolates in turkeys and their derived carcases, respectively. In human cases from 2018 and 2019, 41.8% and 35.7% of S. Infantis were MDR (those tested against the panel of nine antimicrobial classes; the MDR analysis of human isolates did not include the glycylcycline class), with eight and ten countries reporting S. Infantis with an ESBL phenotype, respectively. Of the seven countries reporting on genotype from human cases in 2018, only Italy reported the genotype bla CTX‐M-1, while for 2019 three countries (Denmark, Germany and Italy) reported this genotype. All ESBL‐carrying S. Infantis from Italy were also ciprofloxacin‐resistant.
Over the last decade, multiresistant S. Infantis has increasingly been reported from food‐producing animals and humans in Italy. Subsequently, an S. Infantis clone harbouring a pESI‐like megaplasmid and carrying the ESBL gene bla CTX‐M-1 (mediating cefotaxime resistance), as well as the resistance genes tet(A), sul1, dfrA1 and dfrA14 (conferring resistance to tetracycline, sulfamethoxazole and trimethoprim, respectively), was identified from food‐producing animals and humans in Italy (Franco et al., 2015). This MDR clone was mainly detected among the Italian broiler chicken industry, where it is thought to have disseminated through the food chain to humans (Franco et al., 2015). A proportion of the Italian isolates of MDR S. Infantis also possessed the streptomycin resistance gene aadA1.
The pESI megaplasmid (pESI = ‘plasmid for emerging S. Infantis;’ Tate et al., 2017) was first reported among S. Infantis isolates from Israel; and while these isolates were susceptible to extended‐spectrum cephalosporins, this megaplasmid also conferred resistance to tetracycline, sulfamethoxazole and trimethoprim (Aviv et al., 2014).
Additionally, a S. Infantis clone harbouring the pESI‐like megaplasmid, but carrying the ESBL gene bla CTX‐M-65, has been reported in the United States (Tate et al., 2017), as well as Switzerland (Hindermann et al., 2017). In the US, this genotype has been associated with travel to South America (Tate et al., 2017; Brown et al., 2018). In 2018, two countries (Denmark and the UK) reported one domestically‐acquired case each of bla CTX‐M-65 carrying‐S. Infantis. In addition, three cases with unknown travel history and five related to travel were reported by three countries (Denmark, the Netherlands and the UK). Of the five travel‐related cases, three reported travel to Peru. In 2019, three countries (Denmark, Germany and Spain) together reported 11 domestically‐acquired cases of S. Infantis with bla CTX‐M-65 (the majority of cases in Germany). In addition, four cases with unknown travel and two related to travel were reported by four countries (Denmark, the Netherlands, Norway and Sweden). Both of the travel‐related cases had travelled to Vietnam. The majority of the bla CTX‐M-65 isolates were resistant to ciprofloxacin, nalidixic acid, chloramphenicol, gentamicin, sulfamethoxazole, tetracycline and trimethoprim, in addition of being ESBL‐producing.
Further characterisation of the presumptive ESBL‐producing S. Infantis identified in 2018 from broilers (n = 30) and turkeys (n = 7) in Italy also revealed the presence of genes encoding CTX‐M enzymes, although type(s) were not specified.
In contrast, S. Enteritidis isolates exhibited much lower multiresistance. This serovar was the most frequently reported in laying hens, the second most commonly reported in broilers and the third most frequently reported in broiler carcases, accounting for 30.6%, 7.8% and 7.8% of Salmonella spp. recovered from these poultry origins, respectively (see Figures C.1 and C.3). While complete susceptibility to the harmonised panel of antimicrobials was observed at 44.9% in S. Enteritidis isolates from broiler carcases; in isolates recovered from broilers and laying hens, the majority of isolates exhibited complete susceptibility (66.7% and 83.8%, respectively). Notably, a greater number of countries reported S. Enteritidis data from broilers and laying hens in comparison to those reporting data from broiler carcases, which may reflect the overall reported levels of complete susceptibility. S. Enteritidis belongs to group D Salmonella (serogroup O9) which tend to show elevated colistin MICs, a phenomenon considered to reflect slightly decreased intrinsic susceptibility of wild‐type isolates belonging to Group D (Agersø et al., 2012; Ricci et al., 2020). This is exemplified by the proportion of colistin‐resistant isolates attributed to S. Enteritidis (from laying hens, broilers and broiler carcases) in comparison to other serovars belonging to different serogroups.
Considering the monitoring of human Salmonella cases, S. Enteritidis was the most dominant serovar identified in 2018, with 40,463 cases reported by EU/EEA countries. As was observed among poultry S. Enteritidis isolates, this serovar exhibited much lower multiresistance (79/2,231, 3.5%), and combined ‘microbiological’ resistance to ciprofloxacin and cefotaxime was noted at very low levels (0.3%) among 4,596 tested isolates from human cases. Additionally of 3,205 human S. Enteritidis isolates for which data were available to ECDC in 2018, eight isolates exhibited an ESBL phenotype and one isolate exhibited an AmpC phenotype.
Among S. Enteritidis isolates from human cases in 2018, moderate to high levels of resistance to the (fluoro)quinolone antimicrobial agents, ciprofloxacin and nalidixic acid were reported by 18/23 and 13/15 MSs, respectively. Belgium and Poland also reported high levels of resistance to ampicillin and tetracycline in this serovar from human isolates. Considering the EFSA monitoring of poultry in 2018, a low number of countries reported data on ten or more S. Enteritidis isolates from broilers and their derived carcases (N = 3 and N = 2, respectively), with (fluoro)quinolone resistance noted at moderate levels by Czechia and very high/extremely high levels by Poland. Among S. Enteritidis isolates from laying hens, only eight MSs reported data on ten or more isolates, with (fluoro)quinolone resistance ranging from not detected in Austria to moderate/high in Poland. From an EU baseline survey in 2005–2006, all S. Enteritidis phage type 1 (PT1) isolates recovered from broiler flocks (N = 7) exhibited resistance to nalidixic acid; however, other phage types (e.g. PT4, 7 and 21) also recovered from the monitoring of broilers demonstrated resistance to this antimicrobial, although less frequently (EFSA, 2007). Additionally, phage type 8 frequently showed susceptibility to the panel of antimicrobials tested in EFSA's baseline survey of broilers, although the method used in the EFSA 2007 baseline survey differed in certain respects from that currently performed (EFSA, 2007). A recent Spanish study screened human clinical isolates of S. Enteritidis (N = 491) for antimicrobial drug resistance, with phage type determined for a significant number of these isolates (García et al., 2019). PT1, PT14b, PT56, PT6, PT4 and PT8 predominated (accounting in total for 82% of isolates), with 46.4% and 6.1% of all isolates resistant to nalidixic acid and ampicillin, respectively. Notably, nalidixic acid resistance was statistically associated with PT1 and PT14b, while ampicillin resistance with PT6/PT6a. Findings were considered to support clonal expansion being primarily responsible for the occurrence of nalidixic acid resistance in S. Enteritidis. All ampicillin‐resistant isolates were determined to carry a plasmid‐encoded bla TEM‐1 resistance gene (García et al., 2019).
S. Kentucky was the third most commonly reported serovar in laying hens and turkeys, as well as the fourth most frequently reported in broilers, accounting for 9.5%, 6.5% and 5.2% of Salmonella spp. recovered from these poultry origins, respectively (see Figure 62C). While multidrug resistance was observed at an extremely high level in S. Kentucky isolates from turkeys (84.9%), isolates recovered from broilers and laying hens were less frequently MDR (33.9% and 15.9%, respectively). This variation in MDR was also apparent among S. Kentucky isolates recovered from carcases of turkeys and broilers (75% and 37%, respectively), although the total number of isolates available for analysis from these carcase origins was relatively low (N = 8 and N = 27, respectively).
A wide range of different MDR patterns were reported among S. Kentucky isolates from broilers, laying hens and turkeys. Among all poultry origins (including carcases of broilers and turkeys), the most frequent core pattern of resistance was to ampicillin, ciprofloxacin, nalidixic acid, gentamicin, sulfamethoxazole and tetracycline. Where MDR was detected, this resistance profile (resistance to ampicillin, ciprofloxacin, nalidixic acid, gentamicin, sulfamethoxazole and tetracycline) accounted for 27.8%, 64.9%, 75.6%, 80% and 83.3% of the multiresistant S. Kentucky isolates recovered from laying hens, broilers, turkeys, broiler carcases and turkey carcases, respectively. The same resistance pattern was also frequently found in S. Kentucky isolates from humans in 2018, as well as in a single MDR S. Kentucky isolate recovered from a pig carcase in 2019.
Resistance to six antimicrobial classes was noted in three isolates from turkeys, as well as single isolates from broiler carcases and turkey carcases. Additionally, resistance to seven antimicrobial classes was noted in four isolates from turkeys and a single isolate from broilers. The broiler isolate which showed resistance to seven antimicrobial classes was resistant to tigecycline; four MDR isolates from turkeys also showed tigecycline resistance.
Considering isolates exhibiting high‐level resistance to ciprofloxacin (MIC ≥ 4 mg/L), S. Kentucky accounted for most of the Salmonella isolates recovered from poultry which exhibited resistance by this definition (180/252). Additionally, a single S. Kentucky isolate recovered from a pig carcase displayed high‐level resistance to ciprofloxacin. Resistance to third‐generation cephalosporins was detected in five S. Kentucky isolates recovered from broilers by Malta (4 isolates) and the Netherlands (1 isolate), as well as an isolate recovered from laying hens by Hungary. An ESBL phenotype was reported in the five isolates from broilers, while an AmpC phenotype was reported in the single isolate from laying hens. Where third‐generation cephalosporin resistance was reported in these S. Kentucky isolates, ‘microbiological’ resistance to ciprofloxacin was also observed. The detection of third‐generation cephalosporin resistance and high‐level resistance to ciprofloxacin, underline the significance of this serovar; and notably, when cefotaxime and ciprofloxacin resistance were interpreted using CBPs, the five isolates from broilers as well as the single isolate from laying hens displayed combined ‘clinical’ resistance to these compounds. Coipan et al. (2020) have recently described the introduction and spread of a highly ciprofloxacin‐resistant S. Kentucky with the ESBL‐gene bla CTX‐M-14b among humans in Europe. Cases were identified in eight countries in the period 2013–2018. While the clone seems to have originated in Egypt, the study pointed to a potential establishment of the clone in Malta. Belgium and Malta reported human cases of S. Kentucky bla CTX‐M-14b to TESSy for 2018 and Germany and the Netherlands for 2019. Additionally in 2019, Malta reported a single S. Kentucky with an ESBL phenotype, as well as a single S. Kentucky with a combined ESBL+AmpC phenotype; genotyping was not performed. Medialdea Carrera et al. (2020) were able to confirm a link between Maltese isolates of ESBL‐producing S. Kentucky from poultry and at least one human case in 2019.
In view of the monitoring of human Salmonella cases, S. Kentucky was the seventh most commonly reported serovar in 2018, with 663 cases reported by EU/EEA countries. While extremely high levels of MDR (77.4%) were observed among 177 isolates from human cases in 2018, combined ‘microbiological’ resistance to ciprofloxacin and cefotaxime was low (8.3%) among 290 tested isolates from human cases, but still the highest among the investigated serovars. Additionally, of 200 human S. Kentucky isolates for which data were available to ECDC in 2018, nine isolates exhibited an ESBL phenotype and three isolates exhibited an AmpC phenotype; genes encoding different types of CTX‐M enzymes, as well as CMY‐2, OXA‐48 and SHV‐12, were detected. Two S. Kentucky isolates from human cases in 2018 were also identified as carbapenemase‐producers (carrying bla OXA‐48).
S. Newport isolates recovered from turkeys in 2018 displayed very high levels of MDR, where 58.8% (30/51) of isolates were multiresistant. Notably, the level of MDR among turkeys was greatly influenced by one MS, with Hungary (N = 39) reporting 30 multiresistant isolates. While a relatively low number of S. Newport isolates were available for analysis from broiler and turkey carcases (N = 26 and N = 27, respectively), a greater proportion of isolates from broiler carcases were multiresistant in comparison to those from turkey carcases (84.6% and 18.5%, respectively). Once more however, the level of MDR among broiler carcases was greatly influenced by one MS, with Poland (N = 22) reporting 22 multiresistant isolates. In 2018, out of 289 S. Newport isolates from humans, there was one presumptive ESBL‐producing S. Newport and one AmpC phenotype with blaCMY‐2.
Among MDR S. Newport isolates recovered from turkeys and their derived carcases, the most frequent pattern of resistance was to ampicillin, ciprofloxacin, nalidixic acid and tetracycline; followed by the same pattern but without nalidixic acid resistance. In broiler carcases, the combination ampicillin, ciprofloxacin, nalidixic acid, sulfamethoxazole and tetracycline predominated. This pattern was also the second most frequently reported in broilers, although the combination chloramphenicol, ciprofloxacin, nalidixic acid, sulfamethoxazole and tetracycline was most frequently noted.
Interestingly, multidrug resistance was observed at an extremely high level among S. Bredeney isolates from turkeys in 2018 (82%); while a low level was noted among S. Bredeney isolates from turkey carcases (4.7%). Notably, among isolates reported from turkeys (N = 50), the level of MDR was greatly influenced by one MS, with Hungary (N = 31) reporting 31 multiresistant isolates. In 2018, out of 36 S. Bredeney isolates from humans, one presumptive AmpC was found.
Among MDR S. Bredeney isolates recovered from turkeys, the most frequent pattern of resistance was to ampicillin, ciprofloxacin, nalidixic acid, tigecycline and tetracycline (34.1%); followed by the same pattern but with the addition of trimethoprim (24.4%). This second core pattern was also the most commonly noted among turkey carcases (40%). While a wide range of different resistance patterns were noted among S. Bredeney isolates from turkeys, tigecycline resistance among MDR isolates from this animal origin was observed at 68.3% (all MDR isolates displaying tigecycline‐resistance originated from Hungary).
Spain detected third‐generation cephalosporin resistance in four S. Bredeney isolates from turkeys (all four isolates displayed an ESBL phenotype). Where third‐generation cephalosporin resistance was reported in these isolates, ‘microbiological’ resistance to ciprofloxacin was also observed; however, when MICs to these antimicrobials were interpreted using CBPs, combined ‘clinical’ resistance was not detected.
Multiresistant S. Bareilly was recovered from turkeys in 2018, where 6/6 isolates reported by Italy exhibited MDR. All six isolates showed resistance to the same core pattern (ampicillin, cefotaxime, ceftazidime, ciprofloxacin, nalidixic acid, sulfamethoxazole, trimethoprim and tetracycline) and all were identified as presumptive ESBL‐producers. Although combined ‘microbiological’ resistance to cefotaxime and ciprofloxacin was reported in these isolates, when MICs to these antimicrobials were interpreted using CBPs, combined ‘clinical’ resistance was not detected.
Third‐generation cephalosporin resistance was detected in a single S. Heidelberg isolate recovered from a pig carcase in the Netherlands (AmpC phenotype, with bla CMY‐2 detected) in 2019. Additionally, this isolate displayed ‘microbiological’ resistance to ciprofloxacin; although when CBPs were applied, combined ‘clinical’ resistance to cefotaxime and ciprofloxacin was not observed. The isolate also exhibited resistance to ampicillin, gentamicin, sulfamethoxazole and tetracycline. In 2019, among the 16 isolates of S. Heidelberg from humans, one AmpC‐producer with blaCMY‐2 was identified.
Multiresistant serovars
Considering all reporting countries (including non‐MSs), the contributions of particular multiresistant serovars to overall MDR levels in Salmonella spp. from each of the animal/carcase categories are illustrated in Figure C.5.
Appendix D – Comparison of human Salmonella data by serovar to that in food‐producing animals
1.
In 2018/2019, the quantitative human data were interpreted using EUCAST ECOFF values (categorised into wild‐type and non‐wild type), when available, in the same way as for the animal and food data, following Decision 2013/652/EU. Where ECOFFs do not exist, EUCAST or Clinical and Laboratory Standards Institute (CLSI) CBPs were applied. Notably, for sulfamethoxazole/sulfonamides, there is no EUCAST interpretative criterion for Salmonella and therefore a threshold of > 256 mg/L was applied to both the human and animal data. For qualitative data interpreted with clinical breakpoints (S = susceptible, I = susceptible with increased exposure* and R = resistant), I+R results were combined into one category, with the exception of tetracycline where only R was used in 2019. When aligning susceptible isolates with wild‐type isolates and I+R isolates with non‐wild‐type isolates, there is generally close concordance across categories (Figure D.1). An exception is meropenem where the EUCAST CBP is substantially higher (+4 dilutions) than the ECOFF.
Figure D.1.

- * EUCAST has changed the definitions of SIR from 2019 (EUCAST, 2019 ‐ http://www.eucast.org/newsiandr/). For I, the new definition ‘susceptible, increased exposure’ is used when there is a high likelihood of therapeutic success because exposure to the agent is increased by adjusting the dosing regimen or by its concentration at the site of infection.
It is of note that the countries reporting data on particular Salmonella serovars from human cases are not always the same as those reporting corresponding serovar data within the animal categories. Additionally, the number of isolates reported from human cases and from the animal origins varied, both at the MS and MS‐group level. These factors may introduce a source of variation to results when comparing overall percentage resistance to particular antimicrobials and MDR levels among human and animal isolates.
Notably, the panel of nine antimicrobial classes comprising the MDR analysis of human isolates included the following agents – ampicillin, cefotaxime/ceftazidime, chloramphenicol, ciprofloxacin/pefloxacin/nalidixic acid, gentamicin, meropenem, sulfonamides/sulfamethoxazole, tetracyclines and trimethoprim/trimethoprim‐sulfamethoxazole (co‐trimoxazole) – and did not include tigecycline. For animal isolates, the MDR analysis included the same nine antimicrobial classes, as well as the glycylcycline class. Although tigecycline was not included in the MDR analysis of human isolates, either inclusion or exclusion of tigecycline from the MDR analysis of animal isolates has very limited effect on MDR outputs and therefore, negligible effect on human and animal comparisons.
Comparison of 2018 human data to that in poultry and their derived carcases
S. Infantis was the fourth most common serovar identified in human cases in 2018, with 1,868 cases reported in the EU/EEA. Considering all reporting MSs, the highest levels of resistance in S. Infantis from humans were noted to ciprofloxacin/pefloxacin (29.6%), nalidixic acid (36.4%), sulfonamides (43.3%) and tetracyclines (36.5%), although levels varied markedly between reporting countries. At the reporting MS‐group level for S. Infantis from poultry, generally very high or extremely high resistance to ciprofloxacin, nalidixic acid, sulfamethoxazole and tetracycline was reported, with the exception of laying hens where much lower resistance levels to these antimicrobials were noted. Figure D.2 presents the resistance levels to these four antimicrobials considering all reporting MSs. Notably for human S. Infantis isolates, Germany, Lithuania, Slovakia and the United Kingdom provided interpreted categorical AST data for tetracycline.
Figure D.2.

- N: Total number of isolates reported by MSs.
With the exception of laying hens, MDR among S. Infantis was reported at higher levels in isolates from poultry compared to those from humans considering all reporting countries. In human isolates, overall MDR was observed at 41.8% (12 MSs); while 68%, 75.8%, 80.2% and 87.5% of isolates from broiler carcases (16 MSs and 1 non‐MS), turkeys (8 MSs), broilers (20 MSs) and turkey carcases (2 MSs) were MDR, respectively. At the reporting MS‐group level for S. Infantis isolates recovered from laying hens, MDR was noted at a much lower level of 19.3% (16 MSs). Notably, only eight S. Infantis isolates were reported by two MSs in turkey carcases and only 66 isolates were reported by eight MSs in turkeys; comparative assessment of AMR data to that in humans at the country level was therefore not considered for these categories. Comparative data for nalidixic acid resistance among isolates from both broilers and humans was available for six MSs. Considering only countries reporting a similar number of S. Infantis isolates from both broilers and humans and where more than ten isolates were reported (3 MSs), a higher percentage occurrence of nalidixic acid resistance was noted in isolates originating from broilers in comparison to those from humans by Austria, Italy and Spain. Similarly, Austria, Belgium, Italy, Poland, Slovakia and Spain reported a higher percentage occurrence of ciprofloxacin/pefloxacin resistance in isolates from broilers compared to those from human cases. Notably, these 6 MSs were the only countries where a similar number, as well as ten or more S. Infantis isolates were reported from both broilers and humans for comparative assessment of ciprofloxacin/pefloxacin resistance. Concerning sulfamethoxazole resistance, Austria, Belgium, Italy and Spain were the only countries to report on ten or more S. Infantis isolates from both broilers and humans, with a higher percentage occurrence of resistance noted for all four countries in isolates from broilers compared to isolates from humans. For tetracycline, a comparative assessment of resistance (based on the number of isolates available for both broilers and humans) could be made for five MSs, with Austria, Belgium, Italy and Spain again reporting a higher percentage occurrence of resistance in isolates from broilers compared to isolates from humans. Slovakia reported a lower percentage occurrence of tetracycline resistance in isolates from broilers (N = 51, 54.9%) compared to those from humans (N = 19, 78.9%), however, this MS assessed tetracycline resistance among human S. Infantis isolates using the CLSI CBP (which is one dilution below the EUCAST ECOFF). When applying the same considerations to AMR data for S. Infantis from both broiler carcases and humans (i.e. where a similar number and ten or more isolates were reported), apparent differences in the levels of nalidixic acid resistance were noted by Austria and Spain; with a higher percentage occurrence of resistance in isolates from broiler carcases compared to those from humans. This was also the case for ciprofloxacin/pefloxacin resistance, where Austria, Hungary, Poland and Spain reported a higher percentage occurrence of resistance in isolates from broiler carcases compared to isolates from humans. A higher percentage occurrence of resistance to sulfamethoxazole was also noted in isolates from broiler carcases by Austria and Spain, as well as a higher level of tetracycline resistance in isolates from broiler carcases reported by Austria and Spain. Although comparable AMR data for S. Infantis from both laying hens and humans was available, a much lower number of isolates were reported from laying hens, with only 5 MSs reporting data on ten or more isolates from this poultry origin. Belgium, Italy and Spain reported a lower percentage occurrence of resistance to nalidixic acid, ciprofloxacin, sulfamethoxazole and tetracycline among isolates from laying hens in comparison to isolates from humans. Additionally, Poland reported a lower percentage occurrence of resistance to ciprofloxacin among isolates from laying hens in comparison to those from humans.
S. Enteritidis was the most common Salmonella serovar identified in human cases in 2018, with 40,463 cases reported in the EU/EEA. While MDR was uncommon among S. Enteritidis isolates (from both humans and poultry), the highest levels of resistance in S. Enteritidis from humans were noted to ciprofloxacin/pefloxacin (13.1%), nalidixic acid (16.3%) and colistin (19.2%). Colistin resistance among S. Enteritidis is not uncommon, since this serovar belongs to group D salmonellas (serogroup O9) which tend to show decreased intrinsic susceptibility to colistin (Agersø et al., 2012; Ricci et al., 2020). Figure D.3 presents the resistance levels to these antimicrobials considering all reporting MSs.
Figure D.3.

- N: Total number of isolates reported by MSs. NB. S. Enteritidis was not reported from turkey carcases.
Only 21 S. Enteritidis isolates were reported by six MSs in turkeys; comparative assessment of AMR data to that in humans at the country level was therefore not considered for these categories. Considering data available for broiler carcases, Czechia and Poland were the only countries to report on ten or more S. Enteritidis isolates from this poultry origin. While corresponding human AMR data were not available for Czechia, AMR data from human isolates were reported by Poland. A much higher percentage occurrence of nalidixic acid and ciprofloxacin/pefloxacin resistance was reported among isolates from broiler carcases in comparison to those from humans, however for ciprofloxacin/pefloxacin, a considerably lower number of isolates were available from broiler carcases in comparison to those from humans (N = 39 and N = 345, respectively). Similarly, Czechia, Poland and France were the only countries to report on ten or more S. Enteritidis isolates from broilers. While nalidixic acid and ciprofloxacin/pefloxacin resistance was not detected among broiler isolates from France and moderate/high levels of resistance to these antimicrobials were reported among human isolates (18.6% and 20.9%, respectively), a much lower number of isolates were available from broilers in comparison to humans (N = 10 and N = 86, respectively). Once more, a much higher percentage occurrence of nalidixic acid and ciprofloxacin/pefloxacin resistance was reported among broiler isolates from Poland in comparison to those from humans, however for ciprofloxacin/pefloxacin, a considerably lower number of isolates were available from broilers in comparison to those from humans (N = 39 and N = 345, respectively). While eight MSs reported data on ten or more S. Enteritidis isolates from laying hens, generally a much lower number of isolates were reported by these countries for laying hens in comparison to isolates from human cases; comparative assessment of AMR data to that in humans was therefore not considered. In isolates from human cases, resistance to ciprofloxacin/pefloxacin was reported at 13.1% (N = 5,670) and to nalidixic acid at 16.3% (N = 3,215); while in laying hens (N = 361), ciprofloxacin and nalidixic acid resistance were reported at levels of 10.8% and 10%, respectively.
Considering S. Kentucky, the seventh most commonly reported serovar from human cases in 2018, with 663 cases reported in the EU/EEA, the highest levels of resistance in human isolates were noted to ampicillin (72.7%), ciprofloxacin/pefloxacin (85.7%), gentamicin (51.1%), nalidixic acid (87.3%), sulfonamides (71.1%) and tetracyclines (76.6%). Figure D.4 presents the resistance levels to these antimicrobials in human and poultry isolates considering all reporting MSs. For gentamicin, the clinical breakpoints used for the categorical data from Germany (DIN, Deutsches Institut für Normung) was one dilution higher than the ECOFF while for tetracycline, both Germany and the UK provided interpreted data using CBPs which was one dilution lower than the ECOFF.
Figure D.4.

- N: Total number of isolates reported by MSs.
Considering all reporting countries, extremely high levels of MDR were reported among S. Kentucky isolates from humans, turkeys and turkey carcases (77.4%, 84.9% and 75%, respectively), although the number of isolates recovered from turkeys and their derived carcases was relatively low (N = 53 and N = 8, respectively). While an overall high level of MDR was noted among isolates from broilers and their derived carcases (33.9% and 37%, respectively), an overall moderate level was reported among isolates from laying hens (15.9%). Only 27 S. Kentucky isolates were reported by seven MSs in broiler carcases and only 8 isolates were reported by three MSs in turkey carcases; comparative assessment of AMR data to that in humans at the country level was therefore not considered for these categories. Although comparable AMR data for S. Kentucky from both laying hens and humans was available, only Malta reported data for ten or more isolates from both laying hens and humans (N = 10 and N = 13, respectively). A much higher percentage occurrence of resistance to ampicillin and ciprofloxacin/pefloxacin was noted in human isolates (76.9% and 69.2%, respectively) in comparison to those from laying hens (30%) by Malta, however, results may be subject to imprecision due to the low number of isolates. Overall, fluoroquinolone resistance was noted at a similar level in isolates from humans and laying hens (85.7% and 79.6%?%, respectively); while resistance to ampicillin was noted at a much higher level in isolates from humans compared to those from laying hens (72.7% and 10.6%, respectively). Similarly, Malta was the only country to report AMR data for ten or more isolates from both broilers and humans (N = 23 and N = 13, respectively). A higher percentage occurrence of resistance to ampicillin was noted in isolates from humans (76.9%) compared to those from broilers (60.9%); while a lower percentage occurrence of resistance to ciprofloxacin/pefloxacin was reported in isolates from humans (69.2%) compared to those from broilers (82.6%). No comparable AMR data for S. Kentucky from both turkeys and humans was available.
Comparison of 2019 human data to that in pigs and calves, and their derived carcases
S. Typhimurium was the second most common Salmonella serovar identified in human cases in 2019, with 9,100 cases reported in the EU/EEA. Considering all reporting MSs, the highest levels of resistance in S. Typhimurium from humans were observed for ampicillin (54.3%), sulfonamides (37.2%) and tetracyclines (44.7%); as was the case for isolates from pigs, calves and their derived carcases. Figure D.5 presents the resistance levels to these compounds considering all reporting MSs.
Figure D.5.

- N: Total number of isolates reported by MSs.
Considering all reporting countries, MDR levels in S. Typhimurium were reported at 30.9%, 63%, 25%, 62% and 77.8% in isolates from humans (14 MSs), pig carcases (14 MSs), calf carcases (2 MSs), pigs (7 MSs) and calves (2 MSs), respectively. While 834 isolates were included in the MDR analysis from humans, a much lower number of isolates were available from animals and their derived carcases. Assessment of human and animal S. Typhimurium AMR data at the country level was not performed, as where comparable data were available, a much lower number of isolates were reported from animals in comparison to humans by given MSs; small sample sizes are subject to high statistical variation.
Monophasic S . Typhimurium was the third most common serovar reported from human cases in 2019, with 6,493 registered cases in the EU/EEA. Considering all reporting MSs, the highest levels of resistance in monophasic S. Typhimurium from humans were observed for ampicillin (87.1%), sulfonamides (83.9%) and tetracyclines (80.5%); as was also the case for isolates from pigs, calves and carcases of pigs and calves. Notably, this resistance pattern (together with resistance to streptomycin) is typical of monophasic S. Typhimurium (Hopkins et al., 2010). Figure D.6 presents resistance levels to these compounds considering all reporting MSs.
Figure D.6.

- N: Total number of isolates reported by MSs.
Considering all reporting countries, MDR levels in monophasic S. Typhimurium were reported at 73.8%, 73.2%, 76.9%, 79.6% and 90% in isolates from humans (12 MSs), pig carcases (18 MSs), calf carcases (5 MSs), pigs (6 MSs) and calves (2 MSs), respectively. In total, 1,594 isolates were included in the MDR analysis from humans, while a much lower number of isolates were available from animals and their derived carcases, particularly in calves and their derived carcases (N = 10 and N = 13, respectively). Assessment of human and animal monophasic S. Typhimurium AMR data at the country level was not performed, as where comparable data were available, a much lower number of isolates were reported from animals.
S . Derby was the sixth most common serovar reported from human cases in 2019, with 721 cases registered by EU/EEA countries. While MDR was not as frequently observed among human/animal S. Derby isolates in comparison to S. Typhimurium and its monophasic variant, resistance to sulfonamides and tetracycline was relatively common in S. Derby isolates from human cases (31.8% and 21.7%, respectively). This was also observed among S. Derby isolates from the animal/carcase origins. Figure D.7 presents resistance levels to these compounds considering all reporting MSs. Assessment of human and animal S. Derby AMR data at the country level was not performed due to the low number of isolates reported by MSs from human cases and within the animal categories.
Figure D.7.

- N: Total number of isolates reported by MSs. NB: The S. Derby isolate reported from calves was completely susceptible to all of the 14 antimicrobials tested in the harmonised panel.
Within a given MS, any attempt to relate the occurrence of AMR in human Salmonella isolates to that in isolates from food/food‐producing animals is complicated, as much of the food consumed in a MS may have originated from other MSs or non‐member countries. Salmonella infections can also be associated with foreign travel, other types of animal contact (such as pet reptiles) or the environment. Additionally, some human infections may result from human to human transmission and, although known travel‐associated isolates from human cases were excluded from the analysis, a large proportion of cases lacked information on travel status. Such circumstances may influence the human AMR data at the reporting MS level. Furthermore, the local medical and diagnostic practices and policies for referral to clinical laboratories may vary between countries, which may result in reporting of various clinical or regional subsets of isolates from humans.
Appendix E – Trends in colistin resistance in indicator E. coli from fattening pigs, calves under 1 year of age and broilers
1.
The statistical significance (p ≤ 0.05) of trends in colistin resistance in indicator E. coli from fattening pigs, calves under 1 year of age, broilers and fattening turkeys was tested by logistic regression for countries reporting data for 3 years or more in the period 2014–2019 (see Annex A for details on methodology). The data for fattening turkeys are presented in the main report (Section 4. Antimicrobial resistance in indicator E. coli, Figure 37) and the data for fattening pigs, calves under 1 year of age and broilers are presented in Figures E.1, E.2–E.3 below.
Figure E.1.

- Statistically significant increase (↑) or decrease (↓) indicated (p ≤ 0.05). Data from Croatia was not included in the calculation of the Total (MSs) as data for calves (<1 year) was not reported for the year 2015.
Figure E.2.

- Statistically significant increase (↑) or decrease (↓) indicated (p ≤ 0.05).
Figure E.3.

- Statistically significant increase (↑) or decrease (↓) indicated (p ≤ 0.05).
At the MS‐group level, there are decreasing trends in isolates from broilers and turkeys and no trends for pigs and calves. In individual countries, the level of resistance has decreased for pigs in one MS (Germany) and increased in four MSs (France, Greece, Malta, Portugal). For calves resistance has increased in one MS (Portugal) and for broilers resistance has decreased in one MS (Romania). In isolates from turkeys, colistin resistance has decreased in two MSs (Italy, Spain).
Appendix F – Surveillance and control of LA‐MRSA in the Norwegian pig population
1.
Carl Andreas Grøntvedt and Anne Margrete Urdahl, Norwegian Veterinary Institute
There are three broad categories of meticillin‐resistant Staphylococcus aureus (MRSA), one of which is associated with animals (especially swine), collectively referred to as LA‐MRSA (livestock‐associated MRSA). Within a few years, LA‐MRSA became widespread in swine populations around the world, thereby representing a risk for dissemination to the human population. LA‐MRSA in European swine has mainly been attributed to clonal complex (CC) 398, although other MRSA belonging to other CCs may also show evidence of persistence and transmissibility in livestock holdings and thereby be classified as an LA‐MRSA.
Norway is the only country in the world to have implemented a control strategy from 2013 including measures to eradicate LA‐MRSA in swine (Grøntvedt et al., 2016). The rationale behind this strategy was to prevent the swine population from becoming a domestic reservoir of MRSA with the potential of zoonotic transmission, as MRSA is not a significant cause of disease in swine. With regard to this, Norway has adopted an epidemiologically based definition of LA‐MRSA that includes types of MRSA with evidence of persistence and transmissibility in livestock holdings. The LA‐MRSA surveillance and control strategy includes annual pig population screening, restrictions on trade of live animals upon suspicion, depopulation of pigs within LA‐MRSA positive pig holdings and thorough cleaning and disinfection of premises before restocking with pigs from MRSA‐negative holdings (Grøntvedt et al., 2016). After restocking, samples are collected from animals and the environment to assess the effectiveness of the MRSA eradication. Results from follow‐up testing after restocking demonstrate that LA‐MRSA eradication has been successful in the first attempt in more than 90% of the pig farms, and that only a few farms need to go through more than one eradication process.
A yearly surveillance programme on MRSA in the swine population was implemented from 2014 in Norway. In the first year, all sow herds with more than ten sows were examined (n = 986 herds) and a single positive herd with MRSA CC398, t011 was identified (Urdahl et al., 2016). In 2015, a total of 821 herds were included, of which 86 were nucleus or multiplier herds and 735 were finishing herds (Urdahl et al., 2017). MRSA was identified in four herds; three finishing herds and one multiplier herd. The isolates from two finishing herds were typed as CC1, t177 and further outbreak tracing showed that the two herds belonged to the same cluster of positive herds. The last two herds were not linked, but both were positive for MRSA CC398, t034 (Urdahl et al., 2017). In 2016, a total of 872 herds were investigated, of which 87 were genetic nucleus or multiplier herds, 12 sow pool herds and 773 herds with more than 10 sows (Urdahl et al., 2018). MRSA was not detected in any of the genetic nucleus, multiplier or sow pool herds. LA‐MRSA CC398, t034 was, however, identified in one herd that had recently converted to a specialised finisher herd. Follow‐up testing of contact herds revealed two additional herds positive for the same CC and spa‐type, and eradication was initiated. The surveillance programme in 2017 did not detect any herds with LA‐MRSA CC398 among the 85 genetic nucleus or multiplier herds, 12 sow pool herds or the 729 herds with more than 10 sows included in the surveillance (Urdahl et al., 2018). However, single MRSA isolates belonging to spa‐types t091 (CC7), t843 (CC130) and t6292 (CC425) were detected in one multiplier herd and in two farrow to finish herds, respectively; the latter two isolates of spa‐types t843 and t6292 were confirmed to carry the mecC gene. MRSA was not detected in samples from any of the 716 herds included in the 2018 surveillance (Urdahl et al., 2019). The surveillance programme in 2019 detected one swine herd with MRSA; this isolate was reported as spa‐type t034 (CC398). In total, 722 herds were included in the survey, of which 79 were genetic nucleus or multiplier herds, 12 herds were central units of the sow pool herds, 22 were of the largest farrow to grower or farrow to finish herds and the remaining 609 were herds with more than 10 sows (Urdahl et al., 2020).
Throughout the years, there have been few additional MRSA findings from herds not included in the surveillance, as well as herds detected through contact tracing. An overview of these findings is shown in Table F.1.
Table F.1.
MRSA findings in pig herds in Norway in 2013–2019
| Year | Total no. of herds | No. of herds detected through surveillance | Genotype |
|---|---|---|---|
| 2013 | 22 | CC398 t034 | |
| 2014 | 2 | CC398 t034 | |
| 3 | 1 | CC398 t011 | |
| 2015 | 25 | 2 | CC398 t034 |
| 9 | 2 | CC1 t177 | |
| 2016 | 8 | 1 | CC398 t034 |
| 2017 | 2 | CC7 t091 | |
| 2 | CC8 t024 | ||
| 1 | 1 | CC130 t843 (mecC) | |
| 1 | 1 | CC425 t6292 (mecC) | |
| 2019 | 1 | CC130 t843 (mecC) | |
| 3 | 1 | CC398 t034 | |
| 5 | CC398 t011 | ||
| Total | 84 | 9 |
Note: MRSA was not detected in samples from any of the 716 herds included in the 2018 surveillance.
Population surveillance, outbreak investigations and measures to eradicate LA‐MRSA from pig farms are costly and labor‐intensive strategies. However, the imposed strategy has probably contributed substantially in preventing further dissemination and increased prevalence of LA‐MRSA among pig farms and humans in Norway (Grøntvedt et al., 2016). The strategy is therefore considered relevant under Norwegian conditions, presently characterised by a low overall prevalence of MRSA (including LA‐MRSA) in humans; few primary introductions of LA‐MRSA to the pig population; effective eradication of MRSA from positive pig farms, thereby preventing further transmission among pig farms; and an essentially closed pig population. Changes in these conditions may influence the authorities’ choice of strategy regarding LA‐MRSA in the future.
Appendix G – MRSA spa‐types reported from the monitoring of food and food‐producing animals (including horses) in 2018 and 2019
1.
MRSA spa ‐types reported from the monitoring of food
In 2018, all reported spa‐types recovered from food were those associated with LA‐MRSA (8/8):
-
–
spa‐types associated with the livestock‐associated lineages CC398 and CC9 were reported from broiler meat in Switzerland, as well as types associated with CC398 from broiler and turkey meat in Austria (Figure G.1). CC398 is the most common LA‐MRSA lineage occurring in Europe; while CC9 is also considered a LA‐MRSA clonal lineage. It is disseminated worldwide and is particularly prevalent among various species of livestock in Asia (Cuny et al., 2015b). Kraushaar et al. (2016) reported that MRSA from poultry (chickens and turkeys) collected along the production chains in Germany mainly belonged to ST9, ST398 and ST5, and resistance to clindamycin, erythromycin tetracycline and trimethoprim was most frequently detected. Among the eight LA‐MRSA isolates recovered from poultry meat by Austria and Switzerland, this pattern of resistance was generally reported.
Where typing data were reported from food in 2019, most MRSA isolates were considered to represent livestock‐associated lineages (53/59). Of the 53 isolates considered to represent LA‐MRSA in 2019, these included four isolates of spa‐type t127 recovered from batches of pig and cattle meat by Austria (Figure G.1):
-
–
spa‐ type t127 has been associated with MRSA belonging to several sequence types within CC1, as well as to types in CC474, but is most frequently associated with ST1 (CC1). Austria confirmed these isolates belonged to ST1 and were SCCmec type IVa (2B) from whole genome sequence (WGS) data. Additionally, these isolates were reported to be PVL‐negative and harbour the IEC genes, sak and scn. While the t127‐ST1 genotype is generally considered a CA‐MRSA (regardless of PVL status), the ST1 lineage has been recognised as a LA‐MRSA (Feltrin et al., 2016) and the establishment of spa‐type t127 within livestock in some European countries has also been reported. In a European harmonised baseline survey of breeding pig holdings, the potential clonal spread of spa‐type t127 (ST1) among Italian pig populations was documented (EFSA, 2009c; Franco et al., 2011). Additionally, t127‐ST1 has frequently been detected among ruminants and/or their produce in Italy (Luini et al., 2015; Carfora et al., 2016; Parisi et al., 2016; Macori et al., 2017), as well as from horses in Austria (Loncaric et al., 2014). In an Italian study carried out by Alba et al. (2015), the genetic relatedness of bovine, porcine and human t127‐ST1 isolates were investigated. A high similarity was found among bovine and human t127‐ST1 strains, with all isolates carrying SCCmec type IVa and often possessing the human IEC genes, sak and scn; suggesting establishment of the human t127‐ST1 strain within Italian cattle populations. These genetic features were also evident among the two t127 isolates recovered from cattle meat by Austria in 2019, and therefore, they were considered most likely to represent LA‐MRSA. While the two t127‐ST1 isolates recovered from pig meat by Austria in 2019 also carried SCCmec type IVa (2B) and human IEC genes, distinct genetic differences between human and porcine t127‐ST1 isolates have previously been reported; specifically, absence of IEC genes and presence of SCCmec type V among porcine t127‐ST1 isolates (Franco et al., 2011; Alba et al., 2015). However, as some MRSA types within CC1 appear to have the potential for establishment and spread in livestock (Elstrøm et al., 2019), the t127 isolates recovered from pig meat were also considered likely to represent LA‐MRSA (although the possibility that these isolates represent CA‐MRSA from human sources cannot be ruled out).
In 2019, the six isolates which were not categorised as LA‐MRSA from food included spa‐types t002, t003, t008, t321 and t843 (the latter spa‐type was confirmed to carry the mecC gene ‐ see specific mecC‐MRSA text box further below):
-
–
spa ‐type t002 was recovered from fresh pig meat by Austria. This spa‐type has been associated with several sequence types within CC5, but is most commonly associated with ST5 (CC5); Austria confirmed that this isolate belonged to ST5 and was SCCmec type IVc (2B) from WGS data. While ST5 includes MRSA isolates considered as either CA‐ or HA‐MRSA, a study carried out in the USA suggests that t002‐ST5 may also represent a livestock‐associated MRSA lineage; whereby this genotype was most frequently recovered during investigations focused on the short‐term exposures experienced by veterinary students conducting diagnostic enquiries on pig farms. The t002‐ST5 genotype accounted for 75% of MRSA isolates recovered from pigs, 83.8% of MRSA isolates from the farm environment and 76.9% of MRSA isolates from veterinary students visiting these corresponding farms in the USA (Frana et al., 2013). Furthermore, another study carried out in the USA examined MRSA prevalence among retail pork samples, with 23.1% of MRSA isolates attributed to spa‐type t002 (O'Brien et al., 2012). Due to the PVL‐positive status of this isolate however, it was considered most likely to represent a community‐associated lineage (Figure G.1), as CA‐MRSA frequently possess the PVL toxin, which may confer an increase in virulence, although the exact role of the PVL toxin has been debated (Chadwick et al., 2013). Additionally, the isolate was reported to harbour the IEC genes, sak and scn. With the exception of b‐lactams (penicillin and cefoxitin; oxacillin not tested), the t002 isolate was susceptible to all other antimicrobials tested, which is not surprising since CA‐MRSA strains are typically susceptible to non‐β‐lactam antimicrobials.
-
–
spa ‐type t003 was recovered from fresh pig meat by Austria in 2019. This spa‐type has been associated with several sequence types within CC5 (ST5, ST225 and ST710); Austria confirmed that this isolate belonged to ST3944 (CC5) and was SCCmec type II (2A) from WGS data. Although CC5 contains representatives of both HA‐ and CA‐MRSA, HA‐MRSA are typically multidrug‐resistant and contain a SCCmec element of type I, II or III. The isolate was considered most likely to represent a HA‐MRSA due to its PVL‐negative status, as well as SCCmec element type (Figure G.1). Additionally, the isolate was reported to harbour the IEC genes, sak and scn. With the exception of b‐lactams (penicillin and cefoxitin; oxacillin not tested), the t003 isolate was resistant to erythromycin, ciprofloxacin and clindamycin.
-
–
In 2019, Austria reported spa ‐type t008 from a batch of pig meat, as well as a batch of cattle meat. spa‐type t008 has been associated with many sequence types within CC8 (ST8, ST247, ST250 and ST254), but is most commonly associated with ST8; Austria confirmed that these isolates belonged to ST8 and were SCCmec type IVa (2B) from WGS data. While O'Brien et al. (2012) also reported that t008 accounted for 23.1% of MRSA isolates recovered from US retail pork during their investigation, this spa‐type and sequence type combination is seen in isolates of the globally significant CA‐MRSA USA300 strain, which is PVL‐positive and frequently possesses the arginine catabolic mobile element (ACME). The CA‐MRSA USA300 strain can cause severe infections in humans and has a markedly different epidemiology from HA‐MRSA strains (Tenover and Goering, 2009). Austria confirmed that these isolates were PVL‐positive and the ACME was detected; both isolates were considered to represent CA‐MRSA (Figure G.1). Additionally, these isolates were reported to harbour the IEC genes, sak and scn. With the exception of b‐lactams (penicillin and cefoxitin; oxacillin not tested), the t008 isolates were resistant to erythromycin and kanamycin, as well as ciprofloxacin in the isolate recovered from pig meat. Notably, the USA300 strain has been reported from humans in Austria (Krziwanek et al., 2011), which therefore comprises a potential source of contamination of meat.
-
–
spa ‐type t321 was also recovered from fresh pig meat by Austria in 2019. This spa‐type has been associated with ST1 (CC1), however, Austria confirmed that the isolate belonged to ST5050 (CC1) and was SCCmec type IVa (2B) from WGS data. Although t321‐CC1 has previously been detected from pig farm workers and environmental farm samples in Romania, this genotype has been recognised as a community‐associated MRSA (Huang et al., 2014; Boswihi et al., 2016). The isolate was therefore considered most likely to represent a CA‐MRSA regardless of its PVL‐negative status (Figure G.1). With the exception of b‐lactams (penicillin and cefoxitin; oxacillin not tested), the t321 isolate was resistant to erythromycin, ciprofloxacin, kanamycin, streptomycin and tetracycline.
Additional ad hoc sampling reported by Austria in 2019
The four isolates reported from additional ad hoc sampling of some batches of pig meat by Austria in 2019 comprised spa‐types t011 and t034 – types commonly associated with CC398 – as well as t012.
-
–
spa ‐type t012 has been associated with sequence types within CC30 (ST30 and ST36), another clonal complex containing representatives of HA‐ and CA‐MRSA. Austria confirmed that the t012 isolate was PVL‐negative, belonged to ST30 (CC30) and was SCCmec type IVa (2B) from WGS data. With the exception of b‐lactams (penicillin and cefoxitin; oxacillin not tested), the t012 isolate was susceptible to all other antimicrobials tested. Additionally, the isolate was reported to harbour the IEC genes, sak and scn, as well as the tst gene encoding for toxic shock syndrome toxin 1 (TSST‐1). Although the PVL status of this isolate would suggest a healthcare‐associated lineage, as well as the detection of spa‐type t012 from an Austrian hospital study (Mayerhofer et al., 2015), PVL‐negative t012‐ST30-IV isolates have previously been described as CA‐MRSA (Karapsias et al., 2008). Furthermore, Boswihi et al. (2018) describe the ST30‐MRSA-IV clone as a CA‐MRSA; the t012 isolate recovered from additional ad hoc sampling by Austria was therefore considered most likely to represent a CA‐MRSA (Figure G.1).
MRSA spa ‐types reported from the monitoring of food‐producing animals
In 2018, most reported spa‐types recovered from food‐producing animals were considered to represent livestock‐associated lineages (317/325). Of the 317 isolates considered to represent LA‐MRSA, these included spa‐types t267 and t13790 (Figure G.1):
-
–
spa ‐type t267 was reported from a Danish dairy cow herd in 2018 and was confirmed to belong to CC97. Although MRSA isolates belonging to this clonal lineage have been reported from humans as community‐associated clones (Monecke et al., 2011; Spoor et al., 2013; Egea et al., 2014), CC97 MRSA has been detected in pigs and cattle (associated with bovine mastitis) in Europe and is considered a livestock‐associated lineage. In an earlier European study, an MRSA isolate of spa‐type t267 was reported from dairy cattle in Italy (Feltrin et al., 2016). Certain characteristics of CC97 S. aureus isolates can be associated with human or animal hosts; e.g. the LukM/F leucotoxin and von Willebrand binding protein have ruminant host‐specific activity and were associated with a proportion of isolates from cattle but were not detected in isolates from humans in a European study (Spoor et al., 2013). EFSA recently proposed that WGS should be used to determine MRSA strains and lineages, as well as to investigate the presence of important virulence and host‐adaptation factors and those specific genetic markers (e.g. phages) associated with certain animal hosts (EFSA et al., 2019). The CC97 isolate provides a good illustration of the potential benefits of adopting this approach and the type of additional information which could be obtained.
-
–
The aforementioned spa‐type which was also considered to represent a livestock‐associated lineage in 2018 (spa ‐type t13790) was recovered from a Danish mink farm (sample of mink paw) and reported to belong to CC1. LA‐MRSA in mink has been considered to originate from contaminated pig by‐products used in the production of mink feed and in a 2016 survey of mink feed samples, 19% (20/108) were reported to be positive for LA‐MRSA (Hansen et al., 2017). LA‐MRSA has been detected on the paws and pharynx of mink after exposure to feed contaminated with LA‐MRSA and may persist for more than 26 days (Fertner et al., 2019). MRSA belonging to CC1 has been detected in breeding pigs and in pork in Denmark, although at a much lower frequency than MRSA CC398 (DANMAP, 2016). The occurrence of LA‐MRSA CC1 in pigs and pork in Denmark may therefore account for the detection in mink and while MRSA isolates belonging to CC1 may be regarded as either a CA‐ or LA‐MRSA, the isolate was considered most likely to represent a LA‐MRSA. LA‐MRSA CC1 has also been reported in pigs in other European countries, notably in Italy (Alba et al., 2015). Additionally, Denmark reported that the t13790 isolate was negative for the human immune evasion cluster gene scn, which may also suggest a link to animals. These findings in mink are interesting because, although LA‐MRSA is not considered a food‐borne disease in humans, either food‐borne spread or contamination of the mink environment through their food and subsequent colonisation of the animals, appears to have occurred in the farmed mink.
The eight isolates which were not categorised as LA‐MRSA from food‐producing animals in 2018 comprised spa‐types t223, t1257 and t843 (the latter confirmed to represent a mecC‐MRSA ‐ see specific mecC‐MRSA text box further below):
-
–
Belgium reported spa ‐type t223 from three dairy cow herds and three meat production cattle herds. spa‐type t223 is associated with ST22 (CC22) – a dominant sequence type and spa‐type combination of HA‐MRSA – and Belgium confirmed that one isolate from meat production cattle belonged to ST22 and SCCmec type IV (2B)/IVa (2B) from WGS data. ST22‐MRSA-IV is the pandemic healthcare‐associated strain known as EMRSA‐15, which was first identified in the UK during the early 1990s and has since been reported in many countries. The classical EMRSA‐15 strain typically lacks certain virulence features such as PVL and toxic shock syndrome toxin 1 (TSST‐1), but possesses the enterotoxin C gene, sec (Wolter et al., 2008; Monecke et al., 2011). Belgium confirmed that all six bovine t223 isolates were PVL‐negative, and while WGS of the isolate from meat production cattle was found to harbour the tst gene encoding for TSST‐1, many variants of EMRSA‐15 have been described (Monecke et al., 2011). Such variants are not unforeseen since the genes encoding these virulence toxins reside on mobile genetic elements. Wolter et al. (2008) reported an EMRSA‐15 variant from the USA which was negative for sec and the PVL gene but positive for tst. Other variable virulence markers in ST22‐MRSA-IV strains include the human immune evasion cluster (IEC) genes, chp, sak and scn (Monecke et al., 2011), which Belgium additionally reported from WGS data of the isolate from meat production cattle. All six isolates were considered most likely to represent HA‐MRSA (Figure G.1).
-
–
spa ‐type t1257 was also reported from a Belgian dairy cow herd in 2018. This spa‐type has been associated with sequence types within CC8 (ST239 and ST612), but appears to be more frequently associated with ST612. While the t1257‐ST612 genotype may be regarded as either a CA‐ or HA‐MRSA, the t1257 isolate from a dairy herd was not categorised to a particular lineage (Figure G.1); further typing (including PVL testing) would aid such characterisation.
Where molecular typing data were reported from food‐producing animals in 2019, most MRSA isolates were again considered to represent livestock‐associated lineages (436/439). Of the 436 isolates categorised as LA‐MRSA in 2019, these included spa‐type t127 which was reported from a Danish dairy cow herd (Figure G.1):
-
–
spa ‐type t127 was confirmed to belong to CC1 and to be PVL‐negative. As discussed above, while the t127‐CC1 genotype is generally considered a CA‐MRSA (regardless of PVL status), the establishment of spa‐type t127 (CC1) within livestock in some countries has been well documented. Denmark also confirmed that the t127 isolate was negative for the human immune evasion cluster gene scn, which may suggest a link to animals; the isolate was therefore considered most likely to represent a LA‐MRSA.
In 2019, the three isolates which were not categorised as LA‐MRSA from food‐producing animals comprised spa‐types t843 and t3256, and were confirmed to carry the mecC gene (see specific mecC‐MRSA text box below).
mecC‐MRSA reported in 2018/2019.
In 2018/2019, a total of five mecC‐MRSA isolates were reported. These included three mecC‐MRSA isolates recovered from Danish equine premises (spa‐types t843 and t3256 in 2019, and t843 in 2018), as well as a single mecC‐MRSA isolate recovered from a Danish dairy cow herd in 2019 (spa‐type t843) – see Figure G.1. All four isolates were confirmed to belong to CC130. Antimicrobial susceptibility data for these equine/bovine mecC‐MRSA isolates were not reported. Of note, is the detection of mecC‐MRSA CC130 (spa‐type t528) for the first time from Danish horses in 2015 (DANMAP, 2016; Islam et al., 2017), although mecC‐MRSA isolates have also been recovered from other animal sources (including ruminants) in Denmark (Angen et al., 2017; Petersen et al., 2013; Harrison et al., 2013). In another recent study, the occurrence of MRSA among dead hedgehogs collected throughout Denmark was investigated (Rasmussen et al., 2019). mecC‐MRSA was detected in 61% of these hedgehogs (114/188), of which spa‐type t843 was most commonly found (52%). Furthermore in 2016, mecC‐MRSA CC130 (spa‐type t843) was identified for the first time from bulk tank milk in Denmark (DANMAP, 2016).
In addition to the mecC‐MRSA isolates reported by Denmark, a single MRSA isolate (spa‐type t843, CC130) recovered from pig meat by Austria in 2019 was confirmed to carry the mecC gene (Figure G.1) and contain the SCCmec element type XI (8E). Resistance to non‐b‐lactam antibiotics is currently uncommon among mecC ‐MRSA isolates (Paterson et al., 2014) and, typically, the isolate recovered from pig meat by Austria was susceptible to non‐b‐lactams. Although Austria did not report oxacillin susceptibility data for this isolate, it was resistant to penicillin and cefoxitin; oxacillin has been demonstrated to be a less reliable marker than cefoxitin for detection of mecC‐MRSA (Paterson et al., 2014; Bengtsson et al., 2017).
Considering these two spa‐types (t843 and t3256), both have previously been observed in humans (Paterson et al., 2014; Petersen et al., 2013) and possible transmission between humans and animals is well documented (Petersen et al., 2013; Harrison et al., 2013; Angen et al., 2017). Angen et al. (2017) identified the first case of mecC‐MRSA in domesticated pigs and findings strongly indicated transmission between farmers and pigs. Additionally, the studies carried out by Bengtsson et al. (2017) and Rasmussen et al. (2019) support the hypothesis that wildlife may constitute a reservoir of mecC‐MRSA.
A graphical summary of the genetic diversity of MRSA isolates recovered from food and healthy animals in 2018/2019 is illustrated in Figure G.1.
Appendix H – Additional information and supporting data
List of Annexes
The annexes are available on the EFSA Knowledge Junction community on Zenodo at: https://doi.org/10.5281/zenodo.4557180
The annexes contain the following information:
Annex A. Materials and methods
The annex contains the materials and methods used for producing the EU Summary Report on antimicrobial resistance in zoonotic bacteria from humans, animals and food for the period 2018/2019.
Annex B. Data reported on antimicrobial resistance in Salmonella spp.
The annex contains tables on antimicrobial resistance data:
-
–
Antimicrobial resistance in Salmonella spp. from humans, 2019
-
–
Occurrence of resistance to selected antimicrobials in Salmonella spp. from animal carcases, 2018 and 2019
-
–
Occurrence of resistance to selected antimicrobials in Salmonella spp. from animals, 2018 and 2019
-
–
Occurrence of resistance (%) to selected antimicrobials in specific Salmonella serovars
Annex C. Data reported on antimicrobial resistance in Campylobacter spp.
The annex contains tables and figures showing antimicrobial resistance data:
-
–
Antimicrobial resistance in Campylobacter spp. from humans, 2019 and trends for 2015–2019 period;
-
–
Data reported on antimicrobial resistance and occurrence of resistance to selected antimicrobials in Campylobacter spp. from food‐producing animals and derived meat, for 2018 and 2019 and trends for 2009–2019.
Annex D. Data reported on AMR in indicator Escherichia coli from food‐producing animals and derived meat
The annex contains tables on data reported on AMR in indicator Escherichia coli from food‐producing animals and derived meat.
Annex E. Data on presumptive ESBL‐, AmpC‐ and/or carbapenemase‐producing microorganisms and their resistance occurrence (routine and specific monitorings)
The annex contains the tables (Table 1–22) with the data reported on presumptive ESBL‐, AmpC‐ and/or carbapenemase‐producing microorganisms for poultry (2018) and pigs and cattle (2019) and meat thereof and their resistance occurrence (routine and specific monitorings):
-
–
ESBL‐, AmpC‐, carbapenemase‐producers prevalence and occurrence tables – poultry 2018
-
–
ESBL‐, AmpC‐producers prevalence and occurrence tables – pigs and cattle and meat thereof, 2019
-
–
Specific carbapenemase‐producing E. coli monitoring 2018–2019
-
–
Occurrence of antimicrobial resistance in poultry isolates collected in 2018
Annex F. Data reported on antimicrobial resistance in MRSA from food‐producing animals and derived meat
The annex contains tables on data reported on the prevalence, genetic diversity and antimicrobial resistance of MRSA from food‐producing animals and derived meat.
Supporting data
All tables produced for the European Union Summary Report on Antimicrobial Resistance in Zoonotic and Indicator Bacteria from Humans, Animals and Food in 2018/2019 are available on the EFSA Knowledge Junction community on Zenodo at: https://doi.org/10.5281/zenodo.4557180
The aggregated data set submitted on the negative results for extended‐spectrum β‐lactamase (ESBL) is also available on the Knowledge Junction at: https://doi.org/10.5281/zenodo.4557180
The 2019 prevalence of MRSA aggregated data set is also available on the Knowledge Junction at: https://doi.org/10.5281/zenodo.4557816
Country Data sets
All country data sets containing the tables on the occurrence of antimicrobial resistance per each country are available on the EFSA Knowledge Junction community on Zenodo – please see below the list and corresponding link to the data sets.
The countries that submitted data sets on the 2019 monitoring data year are: the 28 EU Member States, the 3 non‐EU Member States and Republic of North Macedonia as pre‐accession country.
Suggested citation: EFSA and ECDC (European Food Safety Authority and European Centre for Disease Prevention and Control) , 2021. The European Union Summary Report on Antimicrobial Resistance in zoonotic and indicator bacteria from humans, animals and food in 2018/2019. EFSA Journal 2021;19(4):6490, 179 pp. 10.2903/j.efsa.2021.6490
Requestor: European Commission
Question number: EFSA‐Q‐2020‐00002
Declarations of interest: The declarations of interest of all scientific experts active in EFSA's work are available at https://ess.efsa.europa.eu/doi/doiweb/doisearch.
Acknowledgements: EFSA and ECDC wish to thank the members of the Scientific Network for Zoonoses Monitoring Data (EFSA) and the Food‐ and Waterborne Diseases and Zoonoses Network (ECDC) who provided the data and reviewed the report and the members of the Scientific Network for Zoonoses Monitoring Data, for their endorsement of this scientific output. Also, the contribution of EFSA staff members: Pierre‐Alexandre Beloeil, Giusi Amore, Anca‐Violeta Stoicescu, Kenneth Mulligan, Krisztina Nagy, Gina Cioacata, Raquel Garcia Fierro and Karoline Nørstrud, the contributions of ECDC staff members: Therese Westrell and Hanna Merck, and the contributions of EFSA's contractors: Björn Bengtsson, Isabelle Kempf, Oskar Nilsson and Catherine Tallentire for the support provided to this scientific output. Also, the support from the EURL‐AR, specifically Inge Marianne Hansen, Jette Sejer Kjeldgaard, Anne Mette Seyfarth, Pimlapas Leekitcharoenphon, Valeria Bortolaia and Rene S Hendriksen for the confirmatory testing are gratefully acknowledged.
Approved: 24 February 2021
Data: All tables on resistance data used to produce this 2017 EUSR and cross‐referenced in the text are available on the EFSA Knowledge Junction at: https://doi.org/10.5281/zenodo.4557180
EFSA website: http://www.efsa.europa.eu/en/efsajournal/pub/6490
Notes
Regulation (EC) No 178/2002 of the European Parliament and of the Council of 28 January 2002 laying down the general principles and requirements of food law, establishing the EFSA and laying down procedures in matters of food safety. OJ L 31, 1.2.2002, p. 1–24.
Directive 2003/99/EC of the European Parliament and of the Council of 17 November 2003 on the monitoring of zoonoses and zoonotic agents, amending Council Decision 90/424/EEC and repealing Council Directive 92/117/EEC. OJ L 325, 12.12.2003, p. 31–40.
Commission Implementing Decision 2013/652/EU of 12 November 2013 on the monitoring and reporting of antimicrobial resistance in zoonotic and commensal bacteria. OJ L 303, 14.11.2013, p. 26–39.
Commission Implementing Decision 2018/945/EU of 22 June 2018 on the communicable diseases and related special health issues to be covered by epidemiological surveillance as well as relevant case definitions. OJ L 170, 6.7.2018, p. 1–74.
Commission Decision 2012/506/EU amending Decision 2002/253/EC laying down case definitions for reporting communicable diseases to the Community network under Decision No 2119/98/EC of the European Parliament and of the Council. OJ L 262, 27.9.2012, p. 1–57.
Decision No 1082/2013/EU of the European Parliament and of the Council of 22 October 2013 on serious cross‐border threats to health and repealing Decision No 2119/98/EC. OJ L 293, 5.11.2013, p. 1–15.
Links to additional information on Materials and methods (Annex A) and supporting data (Annexes B–F) are provided in Appendix H.
The epidemiological cut‐off (ECOFF) values separate the naive, susceptible wild‐type bacterial populations from isolates that have developed reduced susceptibility to a given antimicrobial agent (Kahlmeter et al., 2003). The ECOFFs may differ from breakpoints used for clinical purposes, which are set out against a background of clinically relevant data, including therapeutic indication, clinical response data, dosing schedules, pharmacokinetics and pharmacodynamics. The use of harmonised methods and ECOFFs ensures the comparability of data over time at the country level and also facilitates the comparison of resistance between MSs.
Links to additional information on Materials and methods (Annex A) and supporting data for this chapter (Annex B) are provided in Appendix H.
See Materials and Methods (Annex A) for terminology used to describe the levels of antimicrobial resistance.
See Materials and Methods (Annex A) for further information regarding the MDR analysis.
‘Microbiological’ resistance.
Links to additional information on Materials and methods (Annex A) and supporting data for this chapter (Annex C) are provided in Appendix H.
As outlined in the Commission Implementing Decision 2013/652/EU of 12 November 2013 on the monitoring and reporting of antimicrobial resistance in zoonotic and commensal bacteria. OJ L 303, 14.11.2013, p. 26–39.
Commission Implementing Decision 2020/1729/EU of 17 November 2020 on the monitoring and reporting of antimicrobial resistance in zoonotic and commensal bacteria and repealing Implementing Decision 2013/652/EU. OJ L 387, 19.11.2020, p. 8–21.
Links to additional information on Materials and methods (Annex A) and supporting data for this chapter (Annex D) are provided in Appendix H.
Links to additional information on Materials and methods (Annex A) and supporting data for this chapter (Annex E) are provided in Appendix H.
All Salmonella and indicator E. coli isolates tested with the harmonised panel of antimicrobial substances (Panel 1) and exhibiting microbiological resistance to cefotaxime, ceftazidime or meropenem were subsequently subjected to further testing using a supplementary panel of substances (Panel 2) to obtain more detailed phenotypic characterisation (see Annex A, materials and methods).
The method is described in Annex A and protocols are available at: https://www.eurl-ar.eu/protocols.aspx.
E. coli isolates exhibiting an ESBL‐, AmpC‐ or ESBL+AmpC‐producing phenotype.
Links to additional information on Materials and methods (Annex A) and supporting data for this chapter (Annex F) are provided in Appendix H.
Contributor Information
European Food Safety Authority, Email: zoonoses@efsa.europa.eu.
European Centre for Disease Prevention and Control, Email: FWD@ecdc.europa.eu.
References
- Agersø Y, Torpdahl M, Zachariasen C, Seyfarth A, Hammerum AM and Nielsen EM, 2012. Tentative colistin epidemiological cut‐off value for Salmonella spp. Foodborne Pathogens and Disease, 9, 367–369. 10.1089/fpd.2011.1015 [DOI] [PubMed] [Google Scholar]
- Alba P, Feltrin F, Cordaro G, Porrero MC, Kraushaar B, Argudín MA, Nykäsenoja S, Monaco M, Stegger M, Aarestrup FM, Butaye P, Franco A and Battisti A, 2015. Livestock‐associated methicillin resistant and methicillin susceptible Staphylococcus aureus sequence type (CC)1 in European farmed animals: high genetic relatedness of isolates from Italian cattle herds and humans. PLoS ONE, 10, e0137143. 10.1371/journal.pone.0137143 [DOI] [PMC free article] [PubMed] [Google Scholar]
- Angen Ø, Stegger M, Larsen J, Lilje B, Kaya H, Pedersen KS, Jakobsen A, Petersen A and Larsen AR, 2017. Report of mecC‐carrying MRSA in domestic swine. Journal of Antimicrobial Chemotherapy, 72, 60–63. 10.1093/jac/dkw389 [DOI] [PMC free article] [PubMed] [Google Scholar]
- Aviv G, Tsyba K, Steck N, Salmon‐Divon M, Cornelius A, Rahav G, Grassl GA and Gal‐Mor O, 2014. A unique megaplasmid contributes to stress tolerance and pathogenicity of an emergent Salmonella enterica serovar Infantis strain. Environmental Microbiology, 16, 977–994. 10.1111/1462-2920.12351 [DOI] [PubMed] [Google Scholar]
- Bai L, Du P, Du Y, Sun H, Zhang P, Wan Y, Lin Q, Fanning S, Cui S and Wu Y, 2019. Detection of plasmid‐mediated tigecycline‐resistant gene tet(X4) in Escherichia coli from pork, Sichuan and Shandong Provinces, China, February 2019. Euro Surveillance, 24, 4. 10.2807/1560-7917.es.2019.24.25.1900340 [DOI] [PMC free article] [PubMed] [Google Scholar]
- Bangerter PD, Sidler X, Perreten V and Overesch G, 2016. Longitudinal study on the colonisation and transmission of methicillin‐resistant Staphylococcus aureus in pig farms. Veterinary Microbiology, 183, 125–134. 10.1016/j.vetmic.2015.12.007 [DOI] [PubMed] [Google Scholar]
- Bengtsson B, Persson L, Ekström K, Unnerstad HE, Uhlhorn H and Börjesson S, 2017. High occurrence of mecC‐MRSA in wild hedgehogs (Erinaceus europaeus) in Sweden. Veterinary Microbiology, 207, 103–107. [DOI] [PubMed] [Google Scholar]
- Boost M, Ho J, Guardabassi L and O'Donoghue M, 2013. Colonization of butchers with livestock‐associated methicillin‐resistant Staphylococcus aureus . Zoonoses Public Health, 60, 572–576. 10.1111/zph.12034 [DOI] [PubMed] [Google Scholar]
- Boswihi SS, Udo EE and Al‐Sweih N, 2016. Shifts in the clonal distribution of methicillin‐resistant Staphylococcus aureus in Kuwait hospitals: 1992–2010. PLoS ONE, 11, e0162744. 10.1371/journal.pone.0162744 [DOI] [PMC free article] [PubMed] [Google Scholar]
- Boswihi SS, Udo EE, Monecke S, Mathew B, Noronha B, Verghese T and Tappa SB, 2018. Emerging variants of methicillin‐resistant Staphylococcus aureus genotypes in Kuwait hospitals. PLoS ONE, 13, e0195933. 10.1371/journal.pone.0195933 [DOI] [PMC free article] [PubMed] [Google Scholar]
- Broens EM, Graat EAM, van der Wolf PJ, van de Giessen AW, van Duijkeren E, Wagenaar JA, van Nes A, Mevius DJ and de Jong MC, 2011. MRSA CC398 in the pig production chain. Preventive Veterinary Medicine, 98, 182–189. 10.1016/j.prevetmed.2010.10.010 [DOI] [PubMed] [Google Scholar]
- Brouwer MSM, Rapallini M, Geurts Y, Harders F, Bossers A, Mevius DJ, Wit B and Veldman KT, 2018. Enterobacter cloacae complex isolated from shrimps from Vietnam encoding blaIMI‐1, resistant to carbapenems but not cephalosporins. Antimicrobial Agents and Chemotherapy, 62. 10.1128/AAC.00398-18 [DOI] [PMC free article] [PubMed] [Google Scholar]
- Brown AC, Chen JC, Francois Watkins LK, Campbell D, Folster JP, Tate H, Wasilenko J, Van Tubbergen C and Friedman CR, 2018. CTX‐M‐65 extended‐spectrum β‐lactamase–producing Salmonella enterica serotype Infantis, United States. Emerging Infectious Diseases, 24, 2284–2291. 10.3201/eid2412.180500 [DOI] [PMC free article] [PubMed] [Google Scholar]
- Campos J, Cristino L, Peixe L and Antunes P, 2016. MCR‐1 in multidrug‐resistant and copper‐tolerant clinically relevant Salmonella 1,4[5],12:i:‐ and S. Rissen clones in Portugal, 2011 to 2015. Euro Surveillance, 21, 5. 10.2807/1560-7917.ES.2016.21.26.30270 [DOI] [PubMed] [Google Scholar]
- Carfora V, Giacinti G, Sagrafoli D, Marri N, Giangolini G, Alba P, Feltrin F, Sorbara L, Amoruso R, Caprioli A, Amatiste S and Battisti A, 2016. Methicillin‐resistant and methicillin‐susceptible Staphylococcus aureus in dairy sheep and in‐contact humans: an intra‐farm study. 99, 4251–4258. 10.3168/jds.2016-10912 [DOI] [PubMed] [Google Scholar]
- Carnevali C, Morganti M, Scaltriti E, Bolzoni L, Pongolini S and Casadei G, 2016. Occurrence of mcr‐1 in colistin‐resistant Salmonella enterica isolates recovered from humans and animals in Italy, 2012 to 2015. Antimicrobial Agents and Chemotherapy, 60, 7532–7534. 10.1128/AAC.01803-16 [DOI] [PMC free article] [PubMed] [Google Scholar]
- Carson C, Li X‐Z, Agunos A, Loest D, Chapman B, Finley R, Mehrotra M, Sherk LM, Gaumond R and Irwin R, 2019. Ceftiofur‐resistant Salmonella enterica serovar Heidelberg of poultry origin – a risk profile using the Codex framework. Epidemiology and Infection, 147, E296. 10.1017/S0950268819001778 [DOI] [PMC free article] [PubMed] [Google Scholar]
- Cavaco LM, Abatih E, Aarestrup FM and Guardabassi L, 2008. Selection and persistence of CTX‐M‐producing Escherichia coli in the intestinal flora of pigs treated with amoxicillin, ceftiofur, or cefquinome. Antimicrobial Agents and Chemotherapy, 52, 3612–3616. 10.1128/aac.00354-08 [DOI] [PMC free article] [PubMed] [Google Scholar]
- Chadwick SG, Prasad A, Smith WL, Mordechai E, Adelson ME and Gygax SE, 2013. Detection of epidemic USA300 community‐associated methicillin‐resistant Staphylococcus aureus strains by use of a single allele‐specific PCR assay targeting a novel polymorphism of Staphylococcus aureus pbp3. Journal of Clinical Microbiology, 51, 2541–2550. [DOI] [PMC free article] [PubMed] [Google Scholar]
- Chong Y, Ito Y and Kamimura T, 2011. Genetic evolution and clinical impact in extended‐spectrum beta‐lactamase producing Escherichia coli and Klebsiella pneumoniae . Infection Genetics and Evolution, 11, 1499–1504. 10.1016/j.meegid.2011.06.001 [DOI] [PubMed] [Google Scholar]
- Coipan CE, Westrell T, van Hoek AHAM, Alm E, Kotila S, Berbers B, de Keersmaecker SCJ, Ceyssens P‐J, Borg ML, Chattaway M, McCormick J, Dallman TJ and Franz E, 2020. Genomic epidemiology of emerging ESBL‐producing Salmonella Kentucky bla CTX‐M‐14b in Europe. Emerging Microbes & Infections, 9, 2124–2135. 10.1080/22221751.2020.1821582 [DOI] [PMC free article] [PubMed] [Google Scholar]
- Crombé F, Argudín MA, Vanderhaeghen W, Hermans K, Haesebrouck F and Butaye P, 2013. Transmission dynamics of methicillin‐resistant Staphylococcus aureus in pigs. Frontiers in Microbiology, 4. 10.3389/fmicb.2013.00057 [DOI] [PMC free article] [PubMed] [Google Scholar]
- Crump JA, Sjölund‐Karlsson M, Gordon MA and Parry CM, 2015. Epidemiology, clinical presentation, laboratory diagnosis, antimicrobial resistance, and antimicrobial management of invasive Salmonella infections. Clinical Microbiology Reviews, 28, 901–937. 10.1128/CMR.00002-15 [DOI] [PMC free article] [PubMed] [Google Scholar]
- Cuny C, Abdelbary M, Layer F, Werner G and Witte W, 2015a. Prevalence of the immune evasion gene cluster in Staphylococcus aureus CC398. Veterinary Microbiology, 177, 219–223. 10.1016/j.vetmic.2015.02.031 [DOI] [PubMed] [Google Scholar]
- Cuny C, Wieler LH and Witte W, 2015b. Livestock‐associated MRSA: the impact on humans. Antibiotics (Basel), 4, 521–543. 10.3390/antibiotics4040521 [DOI] [PMC free article] [PubMed] [Google Scholar]
- DANMAP , 2016. Use of antimicrobial agents and occurrence of antimicrobial resistance in bacteria from food animals, food and humans in Denmark. ISSN 1600‐2032.
- DANMAP , 2018. Use of antimicrobial agents and occurrence of antimicrobial resistance in bacteria from food animals, food and humans in Denmark. ISSN 1600‐2032.
- DANMAP , 2019. Use of antimicrobial agents and occurrence of antimicrobial resistance in bacteria from food animals, food and humans in Denmark. ISSN 1600‐2032.
- DTU , 2018. Comparative genomics of quinolone‐resistant and susceptible Campylobacter jejuni of poultry origin from major poultry producing European countries (GENCAMP). EFSA supporting publication 2018;EN‐1398, 35 pp.
- ECDC (European Centre for Disease Prevention and Control), 2014. EU protocol for harmonised monitoring of antimicrobial resistance in human Salmonella and Campylobacter isolates. Stockholm: ECDC; 2014.
- ECDC (European Centre for Disease Prevention and Control), 2016. EU protocol for harmonised monitoring of antimicrobial resistance in human Salmonella and Campylobacter isolates – June 2016. Stockholm: ECDC; 2016. Available online: https://www.ecdc.europa.eu/sites/default/files/media/en/publications/Publications/antimicrobial-resistance-Salmonella-Campylobacter-harmonised-monitoring.pdf
- ECDC (European Centre for Disease Prevention and Control), 2019. Surveillance of antimicrobial resistance in Europe 2018. Annual report of the European Antimicrobial Resistance Surveillance Network (EARS‐Net). Stockholm: ECDC; 2019.
- ECDC (European Centre for Disease Prevention and Control), 2020. Antimicrobial resistance in the EU/EEA (EARS‐Net) ‐ Annual Epidemiological Report 2019. Stockholm: ECDC; 2020.
- ECDC, EFSA and EMA (European Centre for Disease Prevention and Control, European Food Safety Authority and European Medicines Agency), 2015. ECDC/EFSA/EMA first joint report on the integrated analysis of the consumption of antimicrobial agents and occurrence of antimicrobial resistance in bacteria from humans and food‐producing animals. Stockholm/Parma/London: ECDC/EFSA/EMA, 2015. EFSA Journal 2015;13(1):4006, 114 pp. 10.2903/j.efsa.2015.4006 [DOI] [Google Scholar]
- ECDC, EFSA and EMA (European Centre for Disease Prevention and Control, European Food Safety Authority and European Medicines Agency), 2017. ECDC/EFSA/EMA second joint report on the integrated analysis of the consumption of antimicrobial agents and occurrence of antimicrobial resistance in bacteria from humans and food‐producing animals – Joint Interagency Antimicrobial Consumption and Resistance Analysis (JIACRA) Report. EFSA Journal 2017;15(7):4872, 135 pp. 10.2903/j.efsa.2017.4872 and https://www.ema.europa.eu/en/documents/report/ecdc/efsa/ema-first-joint-report-integrated-analysis-consumptionantimicrobial-agents-occurrence-antimicrobial_en.pdf [DOI] [PMC free article] [PubMed] [Google Scholar]
- EFSA (European Food Safety Authority), 2007. Report of the task force on zoonoses data collection on the analysis of the baseline survey on the prevalence of Salmonella in holdings of broiler flocks of Gallus gallus, Part B. EFSA Journal 2007;101, 86 pp. 10.2903/j.efsa.2007.101 [DOI] [Google Scholar]
- EFSA (European Food Safety Authority), 2008. Report from the Task Force on Zoonoses Data Collection including guidance for harmonized monitoring and reporting of antimicrobial resistance in commensal Escherichia coli and Enterococcus spp. from food animals. EFSA Journal 2008;6(4):141, 44 pp. 10.2903/j.efsa.2008.141r [DOI] [Google Scholar]
- EFSA (European Food Safety Authority), 2009a. Joint scientific report of ECDC, EFSA and EMEA on meticillin resistant Staphylococcus aureus (MRSA) in livestock, companion animals and foods. EFSA‐Q‐2009‐00612 (EFSA Scientific Report (2009) 301, 1–10) and EMEA/CVMP/SAGAM/62464/2009. EFSA Journal 2009;7(6):301r, 10 pp. 10.2903/j.efsa.2009.301r [DOI] [Google Scholar]
- EFSA (European Food Safety Authority), 2009b. Scientific opinion of the Panel on Biological Hazards on a request from the European Commission on Assessment of the public health significance of meticillin resistant Staphylococcus aureus (MRSA) in animals and foods. EFSA Journal 2009;7(3):993, 73 pp. 10.2903/j.efsa.2009.993 [DOI] [Google Scholar]
- EFSA (European Food Safety Authority), 2009c. Analysis of the baseline survey on the prevalence of methicillin‐resistant Staphylococcus aureus (MRSA) in holdings with breeding pigs, in the EU, 2008, Part A: MRSA prevalence estimates; on request from the European Commission. EFSA Journal 2009;7(11):1376, 82 pp. 10.2903/j.efsa.2009.1376 [DOI] [Google Scholar]
- EFSA (European Food Safety Authority), 2012. Technical specifications for the harmonised monitoring and reporting of antimicrobial resistance in methicillin‐resistant Staphylococcus aureus in food‐producing animals and foods. EFSA Journal 2012;10(10):2897, 56 pp. 10.2903/j.efsa.2012.2897 [DOI] [Google Scholar]
- EFSA (European Food Safety Authority), 2020. Technical specifications on a randomisation of sampling for the purpose of antimicrobial resistance monitoring from food‐producing animals and food as from 2021. EFSA Journal 2020;18(12):6364, 31 pp. 10.2903/j.efsa.2020.6364 [DOI] [PMC free article] [PubMed] [Google Scholar]
- EFSA BIOHAZ Panel (EFSA Panel on Biological Hazards), 2011. Scientific Opinion on the public health risks of bacterial strains producing extended‐spectrum b‐lactamases and/or AmpC b‐lactamases in food and food producing animals. EFSA Journal 2011;9(8):2322, 95 pp. 10.2903/j.efsa.2011.2322 [DOI] [Google Scholar]
- EFSA and ECDC (European Food Safety Authority and European Centre for Disease Prevention and Control), 2017. The European Union summary report on antimicrobial resistance in zoonotic and indicator bacteria from humans, animals and food in 2015. EFSA Journal 2017;15(2):4694, 212 pp. 10.2903/j.efsa.2017.4694 [DOI] [PMC free article] [PubMed] [Google Scholar]
- EFSA and ECDC (European Food Safety Authority and European Centre for Disease Prevention and Control), 2018. The European Union summary report on antimicrobial resistance in zoonotic and indicator bacteria from humans, animals and food in 2016. EFSA Journal 2018;16(2):5182, 270 pp. 10.2903/j.efsa.2018.5182 [DOI] [PMC free article] [PubMed] [Google Scholar]
- EFSA and ECDC (European Food Safety Authority and European Centre for Disease Prevention and Control), 2019a. Scientific report on the European Union One Health 2018 Zoonoses Report. EFSA Journal 2019;17(12):5926, 276 pp. 10.2903/j.efsa.2019.5926 [DOI] [PMC free article] [PubMed] [Google Scholar]
- EFSA and ECDC (European Food Safety Authority and European Centre for Disease Prevention and Control), 2019b. The European Union summary report on antimicrobial resistance in zoonotic and indicator bacteria from humans, animals and food in 2017. EFSA Journal 2019;17(2):5598, 278 pp. 10.2903/j.efsa.2019.5598 [DOI] [PMC free article] [PubMed] [Google Scholar]
- EFSA and ECDC (European Food Safety Authority and European Centre for Disease Prevention and Control), 2020. The European Union Summary Report on Antimicrobial Resistance in zoonotic and indicator bacteria from humans, animals and food in 2017/2018. EFSA Journal 2020;18(3):6007, 166 pp. 10.2903/j.efsa.2020.6007 [DOI] [PMC free article] [PubMed] [Google Scholar]
- EFSA and ECDC (European Food Safety Authority and European Centre for Disease Prevention and Control), 2021. Scientific report on the European Union One Health 2019 Zoonoses Report. EFSA Journal 2021;19(2):6406, 286 pp. 10.2903/j.efsa.2021.6406 [DOI] [PMC free article] [PubMed] [Google Scholar]
- EFSA (European Food Safety Authority), Aerts M, Battisti A, Hendriksen R, Kempf I, Teale C, Tenhagen B‐A, Veldman K, Wasyl D, Guerra B, Liébana E, Thomas‐López D and Belœil P‐A, 2019. Scientific report on the technical specifications on harmonised monitoring of antimicrobial resistance in zoonotic and indicator bacteria from food‐producing animals and food. EFSA Journal 2019;17(6):5709, 122 pp. 10.2903/j.efsa.2019.5709 [DOI] [PMC free article] [PubMed] [Google Scholar]
- Egea AL, Gagetti P, Lamberghini R, Faccone D, Lucero C, Vindel A, Tosoroni D, Garnero A, Saka HA, Galas M, Bocco JL, Corso A and Sola C, 2014. New patterns of methicillin‐resistant Staphylococcus aureus (MRSA) clones, community‐associated MRSA genotypes behave like healthcare‐associated MRSA genotypes within hospitals, Argentina. International Journal of Medical Microbiology, 304, 1086–1099. Available online: https://pdfs.semanticscholar.org/313e/a7681483ab77327a6a9d3aab2a871e7b1880.pdf [DOI] [PubMed] [Google Scholar]
- Elhadidy M, Miller WG, Arguello H, Álvarez‐Ordóñez A, Dierick K and Botteldoorn N, 2019. Molecular epidemiology and antimicrobial resistance mechanisms of Campylobacter coli from diarrhoeal patients and broiler carcasses in Belgium. Transboundary Emer. Dis., 66, 463–475. 10.1111/tbed.13046 [DOI] [PubMed] [Google Scholar]
- Elstrøm P, Grøntvedt CA, Gabrielsen C, Stegger M, Angen Ø, Åmdal S, Enger H, Urdahl AM, Jore S, Steinbakk M and Sunde M, 2019. Livestock‐associated MRSA CC1 in Norway; introduction to pig farms, zoonotic transmission, and eradication. Frontiers in Microbiology, 10, 139. 10.3389/fmicb.2019.00139 [DOI] [PMC free article] [PubMed] [Google Scholar]
- EMA (European Medicines Agency), 2019. European Surveillance of Veterinary Antimicrobial Consumption, 2019. Sales of veterinary antimicrobial agents in 31 European countries in 2017. (EMA/294674/2019).
- EMA (European Medicines Agency), 2020. European Surveillance of Veterinary Antimicrobial Consumption, 2020. ‘Sales of veterinary antimicrobial agents in 31 European countries in 2018’. (EMA/24309/2020). Available online: https://www.ema.europa.eu/en/documents/report/sales-veterinary-antimicrobial-agents-31-european-countries-2018-trends-2010-2018-tenth-esvac-report_en.pdf
- EMA and EFSA (European Medicines Agency and European Food Safety Authority), 2017. Joint Scientific Opinion on measures to reduce the need to use antimicrobial agents in animal husbandry in the European Union, and the resulting impacts on food safety (RONAFA). EFSA Journal 2017;15(1):4666, 245 pp. 10.2903/j.efsa.2017.4666 [DOI] [PMC free article] [PubMed] [Google Scholar]
- EUCAST (European Committee for Antimicrobial Susceptibility Testing), 2017. The EUCAST guidelines for detection of resistance mechanisms and specific resistances of clinical and/or epidemiological importance. Version 2.0. Available online: https://www.eucast.org/fileadmin/src/media/PDFs/EUCAST_files/Resistance_mechanisms/EUCAST_detection_of_resistance_mechanisms_170711.pdf
- EUCAST (The European Committee on Antimicrobial Susceptibility Testing), 2019. New definitions of S, I and R from 2019. Available online: http://www.eucast.org/newsiandr/
- EUCAST (European Committee for Antimicrobial Susceptibility Testing), 2020. Campylobacter jejuni and coli ‐ calibration of zone diameter breakpoints to MIC values. Version 3.0, January 2020. Available online: https://www.eucast.org/fileadmin/src/media/PDFs/EUCAST_files/Disk_criteria/Validation_2020/Camplyobacter_v_3.0_January_2020.pdf
- EURL (European Union Reference Laboratory for Antimicrobial Resistance), 2018. Laboratory Protocol, Isolation of methicillin‐resistant Staphylococcus aureus (MRSA) from food‐producing animals and farm environment. Technical University of Denmark.
- Feltrin F, Alba P, Kraushaar B, Ianzano A, Argudín MA, Di Matteo P, Porrero MC, Aarestrup FM, Butaye P, Franco A and Battisti A, 2016. A livestock‐associated, multidrug‐resistant, methicillin‐resistant Staphylococcus aureus clonal complex 97 lineage spreading in dairy cattle and pigs in Italy. Appied Environmental Microbiology, 82, 816–821. 10.1128/AEM.02854-15 [DOI] [PMC free article] [PubMed] [Google Scholar]
- Fertner M, Pedersen K and Chriél M, 2019. Experimental exposure of farmed mink (Neovison vison) to livestock‐associated methicillin‐resistant Staphylococcus aureus contaminated feed. Veterinary Microbiology, 231, 45–47. 10.1016/j.vetmic.2019.02.033 [DOI] [PubMed] [Google Scholar]
- Florez‐Cuadrado D, Ugarte‐Ruiz M, Meric G, Quesada A, Porrero MC, Pascoe B, Saez‐Llorente JL, Orozco GL, Dominguez L and Sheppard SK, 2017. Genome Comparison of Erythromycin Resistant Campylobacter from Turkeys Identifies Hosts and Pathways for Horizontal Spread of erm(B) Genes. Frontiers in Microbiology, 8, 2240. 10.3389/fmicb.2017.02240 [DOI] [PMC free article] [PubMed] [Google Scholar]
- Frana TS, Beahm AR, Hanson BM, Kinyon JM, Layman LL, Karriker LA, Ramirez A and Smith TC, 2013. Isolation and characterization of methicillin‐resistant Staphylococcus aureus from pork farms and visiting veterinary students. PLoS ONE, 8, e53738. 10.1371/journal.pone.0053738 [DOI] [PMC free article] [PubMed] [Google Scholar]
- Franco A, Hasman H, Iurescia M, Lorenzetti R, Stegger M, Pantosti A, Feltrin F, Ianzano A, Porrero MC, Liapi M and Battisti A, 2011. Molecular characterization of spa type t127, sequence type 1 methicillin‐resistant Staphylococcus aureus from pigs. Journal of Antimicrobial Chemotherapy, 66, 1231–1235. 10.1093/jac/dkr115 [DOI] [PubMed] [Google Scholar]
- Franco A, Leekitcharoenphon P, Feltrin F, Alba P, Cordaro G, Iurescia M, Tolli R, D'Incau M, Staffolani M, Di Giannatale E, Hendriksen RS and Battisti A, 2015. Emergence of a clonal lineage of multidrug‐resistant ESBL‐producing Salmonella Infantis transmitted from broilers and broiler meat to humans in Italy between 2011 and 2014. PLoS ONE. 10.1371/journal.pone.0144802 [DOI] [PMC free article] [PubMed] [Google Scholar]
- FSA (Food Standards Agency), 2017. Risk Assessment on Meticillin‐Resistant Staphylococcus aureus (MRSA), with a focus on Livestock‐associated MRSA in the UK Food Chain. Available online: https://www.food.gov.uk/sites/default/files/media/document/mrsa_risk_assessment_feb17_0.pdf
- García P, Malorny B, Rodicio MR, Stephan R, Hächler H, Guerra B and Lucarelli C, 2016. Horizontal acquisition of a multidrug‐resistance module (R‐type ASSuT) is responsible for the monophasic phenotype in a widespread clone of Salmonella serovar 4,[5],12:i:‐. Frontiers in Microbiology, 7, 680. 10.3389/fmicb.2016.00680 [DOI] [PMC free article] [PubMed] [Google Scholar]
- García V, Vázquez X, Bances M, Herrera‐León L, Herrera‐León S and Rodicio MR, 2019. Molecular characterization of Salmonella enterica serovar Enteritidis, genetic basis of antimicrobial drug resistance and plasmid diversity in ampicillin‐resistant isolates. Microbial Drug Resistance, 25, 219–226. 10.1089/mdr.2018.0139 [DOI] [PubMed] [Google Scholar]
- García‐Álvarez L, Holden MTG, Lindsay H, Webb CR, Brown DFJ, Curran MD, Walpole E, Brooks K, Pickard DJ, Teale C, Parkhill J, Bentley SD, Edwards GF, Girvan EK, Kearns AM, Pichon B, Hill RLR, Larsen AR, Skov RL, Peacock SJ, Maskell DJ and Holmes MA, 2011. Meticillin‐resistant Staphylococcus aureus with a novel mecA homologue in human and bovine populations in the UK and Denmark: a descriptive study. Lancet Infectious Diseases, 11, 595–603. 10.1016/S1473-3099(11)70126-8 [DOI] [PMC free article] [PubMed] [Google Scholar]
- García‐Fierro R, Montero I, Bances M, González‐Hevia MÁ and Rodicio MR, 2016. Antimicrobial drug resistance and molecular typing of Salmonella enterica serovar rissen from different sources. Microbial Drug Resistance, 22, 211–217. [DOI] [PubMed] [Google Scholar]
- García‐Soto S, Abdel‐Glil MY, Tomaso H, Linde J and Methner U, 2020. Emergence of multidrug‐resistant Salmonella enterica subspecies enterica serovar Infantis of multilocus sequence type 2283 in German broiler farms. Frontiers in Microbiology, 11, 1741. 10.3389/fmicb.2020.01741. PMID: 32765483; PMCID: PMC7380084. [DOI] [PMC free article] [PubMed] [Google Scholar]
- Graveland H, Wagenaar JA, Heesterbeek H, Mevius D, van Duijkeren E and Heederik D, 2010. Methicillin resistant Staphylococcus aureus ST398 in veal calf farming: human MRSA carriage related with animal antimicrobial usage and farm hygiene. PLoS ONE, 5, e10990. 10.1371/journal.pone.0010990 [DOI] [PMC free article] [PubMed] [Google Scholar]
- Greninger AL, Addetia A, Starr K, Cybulski RJ, Stewart MK, Salipante SJ, Bryan AB, Cookson B, Gaudreau C, Bekal S and Fang FC, 2020. International Spread of Multidrug‐Resistant Campylobacter coli in Men Who Have Sex With Men in Washington State and Quebec, 2015‐2018. Clinical Infectious Diseases, 71, 1896–1904. 10.1093/cid/ciz1060 [DOI] [PMC free article] [PubMed] [Google Scholar]
- Grøntvedt CA, Elstrøm P, Stegger M, Skov RL, Skytt Andersen P, Larssen KW, Urdahl AM, Angen Ø, Larsen J, Åmdal S, Løtvedt SM, Sunde M and Bjørnholt JV, 2016. Methicillin‐resistant Staphylococcus aureus CC398 in humans and pigs in Norway: a “One Health” perspective on introduction and transmission. Clinical Infectious Diseases, 63, 1431–1438. [DOI] [PMC free article] [PubMed] [Google Scholar]
- Guardabassi L, O'Donoghue M, Moodley A, Ho J and Boost M, 2009. Novel lineage of methicillin‐resistant Staphylococcus aureus, Hong Kong. Emerging and Infectious Diseases, 15, 1998–2000. [DOI] [PMC free article] [PubMed] [Google Scholar]
- Gu B, Kelesidis T, Tsiodras S, Hindler J and Humphries RM, 2013. The emerging problem of linezolid‐resistant Staphylococcus. Journal of Antimicrobial Chemotherapy, 68, 4–11. 10.1093/jac/dks354 [DOI] [PMC free article] [PubMed] [Google Scholar]
- Hammerum AM, Larsen J, Andersen VD, Lester CH, Skytte TSS, Hansen F, Olsen SS, Mordhorst H, Skov RL, Aarestrup FM and Agerso Y, 2014. Characterization of extended‐spectrum beta‐lactamase (ESBL)‐producing Escherichia coli obtained from Danish pigs, pig farmers and their families from farms with high or no consumption of third‐or fourth‐generation cephalosporins. Journal of Antimicrobial Chemotherapy, 69, 2650–2657. 10.1093/jac/dku180 [DOI] [PubMed] [Google Scholar]
- Handel N, Schuurmans JM, Feng YF, Brul S and ter Kuile BH, 2014. Interaction between mutations and regulation of gene expression during development of De Novo antibiotic resistance. Antimicrobial Agents and Chemotherapy, 58, 4371–4379. 10.1128/aac.02892-14 [DOI] [PMC free article] [PubMed] [Google Scholar]
- Handel N, Otte S, Jonker M, Brul S and ter Kuile BH, 2015. Factors that affect transfer of the IncI1 beta‐lactam resistance plasmid pESBL‐283 between E. coli strains. PLoS ONE, 10, e0123039. 10.1371/journal.pone.0123039 [DOI] [PMC free article] [PubMed] [Google Scholar]
- Hansen JE, Larsen AR, Skov RL, Chriél M, Larsen G, Angen Ø, Larsen J, Lassen DCK and Pedersen K, 2017. Livestock‐associated methicillin‐resistant Staphylococcus aureus is widespread in farmed mink (Neovison vison). Veterinary Microbiology, 207, 44–49. 10.1016/j.vetmic.2017.05.027 [DOI] [PubMed] [Google Scholar]
- Harrison EM, Paterson GK, Holden MTG, Larsen J, Stegger M, Larsen AR, Petersen A, Skov RL, Christensen JM, Bak Zeuthen A, Heltberg O, Harris SR, Zadoks RN, Parkhill J, Peacock SJ and Holmes MA, 2013. Whole genome sequencing identifies zoonotic transmission of MRSA isolates with the novel mecA homologue mecC. EMBO Molecular Medicine, 5, 509–515. 10.1002/emmm.201202413 [DOI] [PMC free article] [PubMed] [Google Scholar]
- Hawkey J, Le Hello S, Doublet B, Granier SA, Hendriksen RS, Fricke WF, Ceyssens P‐J, Gomart C, Billman‐Jacobe H, Holt KE and Weill F‐X, 2019. Global phylogenomics of multidrug‐resistant Salmonella enterica serotype Kentucky ST198. Microbial Genomics, 5. 10.1099/mgen.0.000269 [DOI] [PMC free article] [PubMed] [Google Scholar]
- He F, Xu J, Wang J, Chen Q, Hua X, Fu Y and Yu Y, 2016. Decreased susceptibility to tigecycline mediated by a mutation in mlaA in Escherichia coli strains. Antimicrobial Agents and Chemotherapy, 60, 7530–7531. [DOI] [PMC free article] [PubMed] [Google Scholar]
- He T, Wang R, Liu D, Walsh TR, Zhang R, Lv Y, Ke Y, Ji Q, Wei R, Liu Z, Shen Y, Wang G, Sun L, Lei L, Lv Z, Li Y, Pang M, Wang L, Sun Q, Fu Y, Song H, Hao Y, Shen Z, Chen Wang S Wu C, Shen J and Wang Y, 2019. Emergence of plasmid‐mediated high‐level tigecycline resistance genes in animals and humans. Nature Microbiology, 4, 1450–1456. 10.1038/s41564-019-0445-2 [DOI] [PubMed] [Google Scholar]
- Heikinheimo A, Johler S, Karvonen L, Julmi J, Fredriksson‐Ahomaa M and Stephan R, 2016. New dominant spa type t2741 in livestock‐associated MRSA (CC398‐MRSA‐V) in Finnish fattening pigs at slaughter. Antimicrobial Resistance and Infection Control, 5, 6. 10.1186/s13756-016-0105-8 [DOI] [PMC free article] [PubMed] [Google Scholar]
- Henszel L, Kanitz E, Kornschober C, Pietzka A, Ruppitsch W, Schaeffer J and Schmid D, 2020. An outbreak of nalidixic acid and ciprofloxacin resistant Salmonella Enteritidis linked to eggs from Poland, Austria, 2019. In: Proceedings of the 2020 European Scientific Conference on Applied Infectious Disease Epidemiology (ESCAIDE); 24‐27 November 2020; Online. ECDC, 2020. Available online: https://www.escaide.eu/sites/default/files/documents/Escaide2020-abstract-book.pdf
- Hindermann D, Gopinath G, Chase H, Negrete F, Althaus D, Zurfluh K, Tall BD, Stephan R and Nüesch‐Inderbinen M, 2017. Salmonella enterica serovar Infantis from food and human infections, Switzerland, 2010–2015: poultry‐related multidrug resistant clones and an emerging ESBL producing clonal lineage. Frontiers in Microbiology, 8, 1322. 10.3389/fmicb.2017.01322 [DOI] [PMC free article] [PubMed] [Google Scholar]
- Hopkins KL, Kirchner M, Guerra B, Granier SA, Lucarelli C, Porrero MC, Jakubczak A, Threlfall EJ and Mevius DJ, 2010. Multiresistant Salmonella enterica serovar 4,[5],12:i:‐ in Europe: a new pandemic strain? Eurosurveillance, 15(22): pii=19580. Available online: http://www.eurosurveillance.org/ViewArticle.aspx?ArticleId=19580 [PubMed] [Google Scholar]
- Huang E, Gurzau AE, Hanson BM, Kates AE, Smith TC, Pettigrew MM, Spinu M and Rabinowitz PM, 2014. Detection of livestock‐associated methicillin‐resistant Staphylococcus aureus among swine workers in Romania. Journal of Infection and Public Health, 7, 323–332. 10.1016/j.jiph.2014.03.008 [DOI] [PubMed] [Google Scholar]
- Irrgang A, Tenhagen B‐A, Pauly N, Schmoger S, Kaesbohrer A and Hammerl JA, 2019. Characterization of VIM‐1‐ Producing E. coli isolated from a German fattening pig farm by an improved isolation procedure. Frontiers in Microbiology, 10, 2256. 10.3389/fmicb.2019.02256 [DOI] [PMC free article] [PubMed] [Google Scholar]
- Irrgang A, Pauly N, Tenhagen B‐A, Grobbel M, Kaesbohrer A and Hammerl JA, 2020. Spill‐Over from Public Health? First Detection of an OXA‐48‐Producing Escherichia coli in a German Pig Farm. Microorganisms, 8, 855. 10.3390/microorganisms8060855 [DOI] [PMC free article] [PubMed] [Google Scholar]
- Islam MZ, Espinosa‐Gongora C, Damborg P, Sieber RN, Munk R, Husted L, Moodley A, Skov R, Larsen J and Guardabassi L, 2017. Horses in Denmark are a reservoir of diverse clones of methicillin‐resistant and ‐susceptible Staphylococcus aureus. Frontiers in Microbiology, 543, 10. 10.3389/fmicb.2017.00543 [DOI] [PMC free article] [PubMed] [Google Scholar]
- Jehanne Q, Pascoe B, Benejat L, Ducournau A, Buissonniere A, Mourkas E, Megraud F, Bessede E, Sheppard SK and Lehours P, 2020. Genome‐Wide Identification of Host‐Segregating Single‐Nucleotide Polymorphisms for Source Attribution of Clinical Campylobacter coli Isolates. Applied and Environmental Microbiology, 86. 10.1128/aem.01787-20. [DOI] [PMC free article] [PubMed] [Google Scholar]
- Kahlmeter G, Brown DF, Goldstein FW, MacGowan AP, Mouton JW, Osterlund A, Rodloff A, Steinbakk M, Urbaskova P and Vatopoulos A, 2003. European harmonization of MIC breakpoints for antimicrobial susceptibility testing of bacteria. Journal of Antimicrobial Chemotherapy, 52, 145–148. 10.1093/jac/dkg312 [DOI] [PubMed] [Google Scholar]
- Karapsias S, Piperaki ET, Spiliopoulou I, Katsanis G and Tseleni‐Kotsovili A, 2008. Methicillin‐resistant Staphylococcus aureus nasal carriage among healthy employees of the Hellenic Air Force. Eurosurveillance, 13, 3. [DOI] [PubMed] [Google Scholar]
- Kieffer N, Aires‐de-Sousa M, Nordmann P and Poirel L, 2017. High Rate of MCR‐1–producing Escherichia coli and Klebsiella pneumoniae among Pigs, Portugal. Emerging Infectious Diseases, 23, 2023–2029. [DOI] [PMC free article] [PubMed] [Google Scholar]
- Kinross P, Petersen A, Skov R, Van Hauwermeiren E, Pantosti A, Laurent F, Voss A, Kluytmans J, Struelens MJ, Heuer O and Monnet DL and the European human LA‐MRSA study group , 2017. Livestock‐associated meticillin‐resistant Staphylococcus aureus (MRSA) among human MRSA isolates, European Union/European Economic Area countries, 2013. Eurosurveillance, 22, pii=16‐00696. 10.2807/1560-7917.es.2017.22.44.16-00696 [DOI] [PMC free article] [PubMed] [Google Scholar]
- Kraemer JG, Pires J, Kueffer M, Semaani E, Endimiani A, Hilty M and Oppliger A, 2017. Prevalence of extended‐spectrum β‐lactamase‐producing Enterobacteriaceae and methicillin‐resistant Staphylococcus aureus in pig farms in Switzerland. Science of the Total Environment, 603–604, 401–405. 10.1016/j.scitotenv.2017.06.110 [DOI] [PubMed] [Google Scholar]
- Kraushaar B, Ballhausen B, Leeser D, Tenhagen BA, Käsbohrer A and Fetsch A, 2016. Antimicrobial resistances and virulence markers in Methicillin‐resistant Staphylococcus aureus from broiler and turkey: a molecular view from farm to fork, 200, 25–32. 10.1016/j.vetmic.2016.05.022 [DOI] [PubMed] [Google Scholar]
- Krziwanek K, Metz‐Gercek S and Mittermayer H, 2011. Trends in the occurrence of MRSA strains in Upper Austria from 2006 to 2009. Clinical Microbiology and Infection, 17, 920–923. 10.1111/j.1469-0691.2010.03376.x [DOI] [PubMed] [Google Scholar]
- Larsen J, Stegger M, Andersen PS, Petersen A, Larsen AR, Westh H, Agersø Y, Fetsch A, Kraushaar B, Käsbohrer A, Feβler AT, Schwarz S, Cuny C, Witte W, Butaye P, Denis O, Haenni M, Madec J, Jouy E, Laurent F, Battisti A, Franco A, Alba P, Mammina C, Pantosti A, Monaco M, Wagenaar JA, de Boer E, van Duijkeren E, Heck M, Domínguez L, Torres C, Zarazaga M, Price LB and Skov RL, 2016. Evidence for human adaptation and foodborne transmission of livestock‐associated methicillin‐resistant Staphylococcus aureus . Clinical Infectious Diseases, 63, 1349–1352. 10.1093/cid/ciw532 [DOI] [PMC free article] [PubMed] [Google Scholar]
- Larsen J, Sunde M, Islam MZ, Urdahl AM, Barstad AS, Larsen AR, Grøntvedt CA and Angen Ø, 2017. Evaluation of a widely used culture‐based method for detection of livestock‐associated meticillin‐resistant Staphylococcus aureus (MRSA), Denmark and Norway, 2014 to 2016. Euro Surveillance, 22, pii=30573. [DOI] [PMC free article] [PubMed] [Google Scholar]
- Le Hello S, Hendriksen RS, Doublet B, Fisher I, Nielsen EM, Whichard JM, Bouchrif B, Fashae K, Granier SA, Jourdan‐Da Silva N, Cloeckaert A, Threlfall EJ, Angulo FJ, Aarestrup FM, Wain J and Weill FX, 2011. International spread of an epidemic population of Salmonella enterica serotype Kentucky ST198 resistant to ciprofloxacin. Journal of Infectious Diseases, 204, 675–684. 10.1093/infdis/jir409 [DOI] [PubMed] [Google Scholar]
- Le Hello S, Bekhit A, Granier SA, Barua H, Beutlich J, Zając M, Münch S, Sintchenko V, Bouchrif B, Fashae K, Pinsard JL, Sontag L, Fabre L, Garnier M, Guibert V, Howard P, Hendriksen RS, Christensen JP, Biswas PK, Cloeckaert A, Rabsch W, Wasyl D, Doublet B and Weill FX, 2013. The global establishment of a highly‐fluoroquinolone resistant Salmonella enterica serotype Kentucky ST198 strain. Frontiers in Microbiology, 4, 395. 10.3389/fmicb.2013.00395 [DOI] [PMC free article] [PubMed] [Google Scholar]
- Levings RS, Lightfoot D, Partridge SR, Hall RM and Djordjevic SP, 2005. The genomic island SGI1, containing the multiple antibiotic resistance region of Salmonella enterica serovar typhimurium DT104 or variants of it, is widely distributed in other S. enterica serovars. Journal of Bacteriology, 187, 4401–4409. [DOI] [PMC free article] [PubMed] [Google Scholar]
- Li L, Liao X, Yang Y, Sun J, Li L, Liu B, Yang S, Ma J, Li X, Zhang Q and Liu Y, 2013. Spread of oqxAB in Salmonella enterica serotype Typhimurium predominantly by IncHI2 plasmids. Journal of Antimicrobial Chemotherapy, 68, 2263–2268. 10.1093/jac/dkt209 [DOI] [PubMed] [Google Scholar]
- Li D, Wu C, Wang Y, Fan R, Schwarz S and Zhang S, 2015. Identification of multiresistance gene cfr in methicillin‐resistant Staphylococcus aureus from pigs: plasmid location and integration into a staphylococcal cassette chromosome mec complex. Antimicrobial Agents and Chemotherapy, 59, 3641–3644. 10.1128/AAC.00500-15. https://aac.asm.org/content/59/6/3641#ref-24 [DOI] [PMC free article] [PubMed] [Google Scholar]
- Liu BT, Zhang XY, Wan SW, Hao JJ, Jiang RD and Song FJ, 2018. Characteristics of Carbapenem‐resistant Enterobacteriaceae in ready‐to‐eat vegetables in China. Frontiers in Microbiology, 9, 1147. 10.3389/fmicb.2018.01147 [DOI] [PMC free article] [PubMed] [Google Scholar]
- Liu D, Liu W, Lv Z, Xia J, Li X, Hao Y, Zhou Y, Yao H, Liu Z, Wang Y, Shen J, Ke Y and Shen Z, 2019. Emerging erm(B)‐mediated macrolide resistance associated with novel multidrug resistance genomic Islands in Campylobacter. Antimicrobial Agents and Chemotherapy, 63. 10.1128/aac.00153-19 [DOI] [PMC free article] [PubMed] [Google Scholar]
- Loncaric I, Künzel F, Licka T, Simhofer H, Spergser J and Rosengarten R, 2014. Identification and characterization of methicillin‐resistant Staphylococcus aureus (MRSA) from Austrian companion animals and horses. Veterinary Microbiology, 168, 381–387. 10.1016/j.vetmic.2013.11.022 [DOI] [PubMed] [Google Scholar]
- Luangtongkum T, Jeon B, Han J, Plummer P, Logue CM and Zhang Q, 2009. Antibiotic resistance in Campylobacter: emergence, transmission and persistence. Future Microbiology, 4, 189–200. 10.2217/17460913.4.2.189 [DOI] [PMC free article] [PubMed] [Google Scholar]
- Luini M, Cremonesi P, Magro G, Bianchini V, Minozzi G, Castiglioni B and Piccinini R, 2015. Methicillin‐resistant Staphylococcus aureus (MRSA) is associated with low within‐herd prevalence of intra‐mammary infections in dairy cows: genotyping of isolates. Veterinary Microbiology, 178, 270–274. 10.1016/j.vetmic.2015.05.010 [DOI] [PubMed] [Google Scholar]
- Luk‐In S, Pulsrikarn C, Bangtrakulnonth A, Chatsuwan T and Kulwichit W, 2017. Occurrence of a novel class 1 integron harboring qnrVC4 in Salmonella Rissen. Diagnostic Microbiology and Infectious Disease, 88, 282–286. [DOI] [PubMed] [Google Scholar]
- Macori G, Giuseppina G, Bellio A, Gallina S, Bianchi DM, Sagrafoli D, Marri N, Giangolini G, Amatiste S and Decastelli L, 2017. Molecular epidemiology of Staphylococcus aureus in the ovine dairy chain and in farm‐related humans. Toxins, 9, 11. 10.3390/toxins9050161 [DOI] [PMC free article] [PubMed] [Google Scholar]
- Mangat CS, Bekal S, Avery BP, Côté G, Daignault D, Doualla‐Bell F, Finley R, Lefebvre B, Bharat A, Parmley EJ, Reid‐Smith RJ, Longtin J, Irwin RJ and Mulvey MR, 2019. Genomic investigation of the emergence of invasive multidrug‐resistant Salmonella enterica serovar Dublin in humans and animals in Canada. Antimicrobial Agents and Chemotherapy, 63, e00108‐19. 10.1128/aac.00108-19. PMID: 31036694; PMCID: PMC6535508. [DOI] [PMC free article] [PubMed] [Google Scholar]
- Martinez JL, 2014. General principles of antibiotic resistance in bacteria, Drug Discovery Today. Technologies, 11, 33–39. 10.1016/j.ddtec.2014.02.001 [DOI] [PubMed] [Google Scholar]
- Maslikowska JA, Walker SAN, Elligsen M, Mittmann N, Palmay L, Daneman N and Simor A, 2016. Impact of infection with extended‐spectrum beta‐lactamase‐producing Escherichia coli or Klebsiella species on outcome and hospitalization costs. Journal of Hospital Infection, 92, 33–41. 10.1016/j.jhin.2015.10.001 [DOI] [PubMed] [Google Scholar]
- Mayerhofer B, Stöger A, Pietzka AT, Fernandez HL, Prewein B, Sorschag S, Kunert R, Allerberger F and Ruppitsch W, 2015. Improved protocol for rapid identification of certain spa types using high resolution melting curve analysis. PLoS ONE, 10, e0116713. 10.1371/journal.pone.0116713 [DOI] [PMC free article] [PubMed] [Google Scholar]
- Medialdea Carrera R, Melillo T, Rocco G and Borg M, 2020. Investigation of an outbreak of ESBL‐producing Salmonella Kentucky in humans linked to poultry in Malta, 2013–2020. In: Proceedings of the European Scientific Conference on Applied Infectious Disease Epidemiology (ESCAIDE); 24‐27 November 2020; Online. ECDC, 2020. Available online: https://www.escaide.eu/sites/default/files/documents/Escaide2020-abstract-book.pdf
- Monecke S, Coombs G, Shore AC, Coleman DC, Akpaka P, Borg M, Chow H, Ip M, Jatzwauk L, Jonas D, Kadlec K, Kearns A, Laurent F, O'Brien FG, Pearson J, Ruppelt A, Schwarz S, Scicluna E, Slickers P, Tan H‐L, Weber S and Ehricht R, 2011. A field guide to pandemic, epidemic and sporadic clones of methicillin‐resistant Staphylococcus aureus . PLoS ONE, 6, e17936. 10.1371/journal.pone.0017936 [DOI] [PMC free article] [PubMed] [Google Scholar]
- More E, Ayats T, Ryan PG, Naicker PR, Keddy KH, Gaglio D, Witteveen M and Cerda‐Cuellar M, 2017. Seabirds (Laridae) as a source of Campylobacter spp., Salmonella spp. and antimicrobial resistance in South Africa. Environmental Microbiology. 10.1111/1462-2920.3874 [DOI] [PubMed] [Google Scholar]
- Mossong J, Mughini‐Gras L, Penny C, Devaux A, Olinger C, Losch S, Cauchie HM, van Pelt W and Ragimbeau C, 2016. Human Campylobacteriosis in Luxembourg, 2010–2013: a case‐control study combined with multilocus sequence typing for source attribution and risk factor analysis. Scientific Reports, 6, 20939. 10.1038/srep20939 [DOI] [PMC free article] [PubMed] [Google Scholar]
- Nógrády N, Király M, Davies R and Nagy B, 2012. Multidrug resistant clones of Salmonella Infantis of broiler origin in Europe. International Journal of Food Microbiology, 157, 108–112. [DOI] [PubMed] [Google Scholar]
- O'Brien AM, Hanson BM, Farina SA, Wu JY, Simmering JE, Wardyn SE, Forshey BM, Kulick ME, Wallinga DB and Smith TC, 2012. MRSA in conventional and alternative retail pork products. PLoS ONE, 7, e30092. 10.1371/journal.pone.0030092 [DOI] [PMC free article] [PubMed] [Google Scholar]
- Olaitan AO, Morand S and Rolain J‐M, 2014. Mechanisms of polymyxin resistance: acquired and intrinsic resistance in bacteria. Frontiers in Microbiology, 643, 18. 10.3389/fmicb.2014.00643 [DOI] [PMC free article] [PubMed] [Google Scholar]
- Parisi A, Caruso M, Normanno G, Latorre L, Sottili R, Miccolupo A, Fraccalvieri R and Santagada G, 2016. Prevalence, antimicrobial susceptibility and molecular typing of methicillin‐resistant Staphylococcus aureus (MRSA) in bulk tank milk from southern Italy. Food Microbiology, 58, 36–42. 10.1016/j.fm.2016.03.004 [DOI] [PubMed] [Google Scholar]
- Parisi A, Crump JA, Glass K, Howden BP, Furuya‐Kanamori L, Vilkins S, Gray DJ and Kirk MD, 2018. Health outcomes from multidrug‐resistant Salmonella infections in high‐income countries: a systematic review and meta‐analysis. Foodborne Pathogens and Disease, 15. 10.1089/fpd.2017.2403 [DOI] [PubMed] [Google Scholar]
- Paterson GK, Harrison EM and Holmes MA, 2014. The emergence of mecC methicillin‐resistant Staphylococcus aureus. Trends in Microbiology, 22, 42–47. [DOI] [PMC free article] [PubMed] [Google Scholar]
- Pauly N, Hammerl JA, Schwarz S, Grobbel M, Meemken D, Malorny B, Tenhagen B‐A, Kaesbohrer A and Irrgang A, 2021. Co‐occurrence of the blaVIM‐1 and blaSHV‐12 genes on an IncHI2 plasmid of an Escherichia coli isolate recovered from German livestock. Journal of Antimicrobial Chemotherapy, 76, 531–533. 10.1093/jac/dkaa436 [DOI] [PMC free article] [PubMed] [Google Scholar]
- Pergola S, Franciosini MP, Comitini F, Ciani M, De Luca S, Bellucci S, Menchetti L and Casagrande Proietti P, 2017. Genetic diversity and antimicrobial resistance profiles of Campylobacter coli and Campylobacter jejuni isolated from broiler chicken in farms and at time of slaughter in central Italy. Journal of Applied Microbiology, 122, 1348–1356. 10.1111/jam.13419 [DOI] [PubMed] [Google Scholar]
- Perrin‐Guyomard A, Jouy E, Urban D, Chauvin C, Granier SA, Mourand G, Chevance A, Adam C, Moulin G and Kempf I, 2020. Decrease in fluoroquinolone use in French poultry and pig production and changes in resistance among E. coli and Campylobacter. Veterinary Microbiology, 243. [DOI] [PubMed] [Google Scholar]
- Petersen A, Stegger M, Heltberg O, Christensen J, Zeuthen A, Knudsen LK, Urth T, Sorum M, Schouls L, Larsen J, Skov R and Larsen AR, 2013. Epidemiology of methicillin‐resistant Staphylococcus aureus carrying the novel mecC gene in Denmark corroborates a zoonotic reservoir with transmission to humans. Clinical Microbiology and Infection, 19, E16–E22. 10.1111/1469-0691.12036 [DOI] [PubMed] [Google Scholar]
- Pimenta AC, Fernandes R and Moreira IS, 2014. Evolution of drug resistance: insight on TEM beta‐lactamases structure and activity and beta‐lactam antibiotics. Mini Reviews in Medicinal Chemistry, 14, 111–122. [DOI] [PubMed] [Google Scholar]
- Pornsukarom S, Patchanee P, Erdman M, Cray PF, Wittum T, Lee J and Gebreyes WA, 2015. Comparative phenotypic and genotypic analyses of Salmonella Rissen that originated from food animals in Thailand and United States. Zoonoses and Public Health, 62, 151–158. [DOI] [PubMed] [Google Scholar]
- Qin S, Wang Y, Zhang Q, Zhang M, Deng F, Shen Z, Wu C, Wang S, Zhang J and Shen J, 2014. Report of ribosomal RNA methylase gene erm(B) in multidrug‐resistant Campylobacter coli. The Journal of Antimicrobial Chemotherapy, 69, 964–968. 10.1093/jac/dkt492 [DOI] [PubMed] [Google Scholar]
- Queenan K, Hasler B and Rushton J, 2016. A one Health approach to antimicrobial resistance surveillance: is there a business case for it? International Journal of Antimicrobial Agents, 48, 422–427. 10.1016/j.ijantimicag.2016.06.014 [DOI] [PubMed] [Google Scholar]
- Rasmussen SL, Larsen J, van Wijk RE, Jones OR, Berg TB, Angen Ø and Larsen RL, 2019. European hedgehogs (Erinaceus europaeus) as a natural reservoir of methicillin‐resistant Staphylococcus aureus carrying mecC in Denmark. PLoS ONE, 14, e0222031. [DOI] [PMC free article] [PubMed] [Google Scholar]
- Ricci V, Zhang D, Teale C and Piddock LJV, 2020. The O‐antigen epitope governs susceptibility to colistin in Salmonella enterica. mBio, 11, e02831–19. 10.1128/mBio.02831-19 [DOI] [PMC free article] [PubMed] [Google Scholar]
- Rosner BM, Schielke A, Didelot X, Kops F, Breidenbach J, Willrich N, Gölz G, Alter T, Stingl K, Josenhans C, Suerbaum S and Stark K, 2017. A combined case‐control and molecular source attribution study of human Campylobacter infections in Germany, 2011‐2014/692/308/174/692/499 article. Scientific Reports, 7. 10.1038/s41598-017-05227-x [DOI] [PMC free article] [PubMed] [Google Scholar]
- Rossler E, Signorini ML, Romero‐Scharpen A, Soto LP, Berisvil A, Zimmermann JA, Fusari ML, Olivero C, Zbrun MV and Frizzo LS, 2019. Meta‐analysis of the prevalence of thermotolerant Campylobacter in food‐producing animals worldwide. Zoonoses and Public Health, 66, 359–369. 10.1111/zph.12558 [DOI] [PubMed] [Google Scholar]
- Sahibzada S, Abraham S, Coombs GW, Pang S, Hernández‐Jover M, Jordan D and Heller J, 2017. Transmission of highly virulent community‐associated MRSA ST93 and livestock‐associated MRSA ST398 between humans and pigs in Australia. Scientific Reports, 7, 5273. 10.1038/s41598-017-04789-0 [DOI] [PMC free article] [PubMed] [Google Scholar]
- Schulz J, Boklund A, Toft N and Halasa T, 2019. Effects of control measures on the spread of LA‐MRSA among Danish pig herds between 2006 and 2015 – a simulation study. Scientific Reports, 9. Available online: https://www.nature.com/articles/s41598-018-37075-8 [DOI] [PMC free article] [PubMed] [Google Scholar]
- Sévellec Y, Vignaud ML, Granier SA, Lailler R, Feurer C, Le Hello S, Mistou MY and Cadel‐Six S, 2018. Polyphyletic nature of Salmonella enterica serotype Derby and lineage‐specific host‐association revealed by genome‐wide analysis. Frontiers in Microbiology, 9, 891. 10.3389/fmicb.2018.00891 [DOI] [PMC free article] [PubMed] [Google Scholar]
- Sévellec Y, Granier SA, Le Hello S, Weill F‐X, Guillier L, Mistou MY and Cadel‐Six S, 2020. Source attribution study of sporadic Salmonella Derby cases in France. Frontiers in Microbiology, 11, 889. 10.3389/fmicb.2020.00889 [DOI] [PMC free article] [PubMed] [Google Scholar]
- Shen J, Wang Y and Schwarz S, 2013. Presence and dissemination of the multiresistance gene cfr in Gram‐positive and Gram‐negative bacteria. Journal of Antimicrobial Chemotherapy, 68, 1697–1706. 10.1093/jac/dkt092 [DOI] [PubMed] [Google Scholar]
- Shore AC, Deasy EC, Slickers P, Brennan G, O'Connell B, Monecke S, Ehricht R and Coleman DC, 2011. Detection of staphylococcal cassette chromosome mec Type XI carrying highly divergent mecA, mecI, mecR1, blaZ, and ccr genes in human clinical isolates of clonal complex 130 methicillin‐resistant Staphylococcus aureus. Antimicrobial Agents and Chemotherapy, 55, 3765–3773. 10.1128/AAC.00187-11 [DOI] [PMC free article] [PubMed] [Google Scholar]
- Skov RL and Monnet DL, 2016. Plasmid‐mediated colistin resistance (mcr‐1 gene): three months later, the story unfolds. Eurosurveillance, 21, :pii=30155. Available online: https://www.eurosurveillance.org/images/dynamic/EE/V21N09/art21403.pdf [DOI] [PubMed] [Google Scholar]
- Société Française de Microbiologie , 2020. In Société Française de Microbiologie (ed.). CASFM/EUCAST. pp. 114–115. [Google Scholar]
- Spoor LE, McAdam PR, Weinert LA, Rambaut A, Hasman H, Aarestrup FM, Kearns AM, Larsen AR, Skov RL and Fitzgerald JR, 2013. Livestock origin for a human pandemic clone of community‐associated methicillin‐resistant Staphylococcus aureus. mBio, 4, e00356–13. 10.1128/mBio.00356-13 [DOI] [PMC free article] [PubMed] [Google Scholar]
- Stegger M, Lindsay JA, Moodley A, Skov R, Broens EM and Guardabassi L, 2011. Rapid PCR detection of Staphylococcus aureus clonal complex 398 by targeting the restriction‐modification system carrying sau1‐hsdS1. Journal of Clinical Microbiology, 49, 732–734. [DOI] [PMC free article] [PubMed] [Google Scholar]
- Sun H, Wan Y, Du P and Bai L, 2019. The epidemiology of monophasic Salmonella Typhimurium. Foodborne Pathogens and Disease. 10.1089/fpd.2019.2676 [DOI] [PubMed] [Google Scholar]
- SVA (Swedish National Veterinary Institute), 2019. Surveillance of infectious diseases in animals and humans in Sweden 2019. Uppsala, Sweden. SVA:s rapportserie, 64, 1654–7098. [Google Scholar]
- Szczepanska B, Andrzejewska M, Spica D and Klawe JJ, 2017. Prevalence and antimicrobial resistance of Campylobacter jejuni and Campylobacter coli isolated from children and environmental sources in urban and suburban areas. BMC Microbiology, 17, 80. 10.1186/s12866-017-0991-9 [DOI] [PMC free article] [PubMed] [Google Scholar]
- Tang Y, Dai L, Sahin O, Wu Z, Liu M and Zhang Q, 2017. Emergence of a plasmid‐borne multidrug resistance gene cfr(C) in foodborne pathogen Campylobacter. The Journal of Antimicrobial Chemotherapy, 72, 1581–1588. 10.1093/jac/dkx023 [DOI] [PubMed] [Google Scholar]
- Tate H, Folster JP, Hsu C‐H, Chen J, Hoffmann M, Li C, Morales C, Tyson GH, Mukherjee S, Brown AC, Green A, Wilson W, Dessai U, Abbott J, Joseph L, Haro J, Ayers S, McDermott PF and Zhaoa S, 2017. Comparative analysis of extended‐spectrum‐β‐lactamase CTX‐M‐65‐producing Salmonella enterica serovar Infantis isolates from humans, food animals, and retail chickens in the United States. Antimicrobial Agents and Chemotherapy, 61, e00488–17. 10.1128/aac.00488-17 [DOI] [PMC free article] [PubMed] [Google Scholar]
- Tegegne HA, Koláčková I, Florianová M, Wattiau P, Gelbíčová T, Boland C, Madec J‐Y, Haenni M and Karpíšková R, 2021. Genomic insights into methicillin‐resistant Staphylococcus aureus spa type t899 isolates belonging to different sequence types. Applied and Environmental Microbiology. 10.1128/AEM.01994-20 [DOI] [PMC free article] [PubMed] [Google Scholar]
- Tenover FC and Goering RV, 2009. Methicillin‐resistant Staphylococcus aureus strain USA300: origin and epidemiology. Journal of Antimicrobial Chemotherapy, 64, 441–446. 10.1093/jac/dkp241 [DOI] [PubMed] [Google Scholar]
- Thepault A, Meric G, Rivoal K, Pascoe B, Mageiros L, Touzain F, Rose V, Beven V, Chemaly M and Sheppard SK, 2017. Genome‐wide identification of host‐segregating epidemiological markers for source attribution in Campylobacter jejuni . Applied and Environmental Microbiology, 83. 10.1128/aem.03085-16 [DOI] [PMC free article] [PubMed] [Google Scholar]
- Torneke K, Torren‐Edo J, Grave K and Mackay DK, 2015. The management of risk arising from the use of antimicrobial agents in veterinary medicine in EU/EEA countries ‐ a review. Journal of Veterinary Pharmacology and Therapeutics, 38, 519–528. 10.1111/jvp.12226 [DOI] [PubMed] [Google Scholar]
- Touati A, Mairi A, Baloul Y, Lalaoui R, Bakour S, Thighilt L, Gharout A and Rolain J‐M, 2017. First detection of Klebsiella pneumoniae producing OXA‐48 in fresh vegetables from Beja €ıa city, Algeria. Journal of Global Antimicrobial Resistance, 9, 17–18. 10.1016/j.jgar.2017.02.006 [DOI] [PubMed] [Google Scholar]
- Urdahl AM, Bergsjø B, Hofshagen M, Norström M and Lium B, 2014. The surveillance programme for methicillin resistant Staphylococcus aureus in pigs in Norway 2014. Surveillance programmes for terrestrial and aquatic animals in Norway. Annual report 2014. Oslo: Norwegian Veterinary Institute 2014.
- Urdahl AM, Bergsjø B, Norström M and Grøntvedt CA, 2016. The surveillance programme for methicillin resistant Staphylococcus aureus in pigs in Norway 2015. Surveillance programmes for terrestrial and aquatic animals in Norway. Annual report 2015. Oslo: Norwegian Veterinary Institute 2016.
- Urdahl AM, Norström M, Bergsjø B and Grøntvedt CA, 2017. The surveillance programme for methicillin resistant Staphylococcus aureus in pigs in Norway 2016. Surveillance programmes for terrestrial and aquatic animals in Norway. Annual report 2016. Oslo: Norwegian Veterinary Institute 2017.
- Urdahl AM, Norström M, Bergsjø B and Grøntvedt CA, 2018. The surveillance programme for methicillin resistant Staphylococcus aureus in pigs in Norway 2017. Surveillance programmes for terrestrial and aquatic animals in Norway. Annual report 2017. Oslo: Norwegian Veterinary Institute 2018.
- Urdahl AM, Norström M, Bergsjø B and Grøntvedt CA, 2019. The surveillance programme for methicillin resistant Staphylococcus aureus in pigs in Norway 2018. Surveillance programmes for terrestrial and aquatic animals in Norway. Annual report 2018. Oslo: Norwegian Veterinary Institute 2019.
- Urdahl AM, Norström M, Bergsjø B and Grøntvedt CA, 2020. The surveillance programme for methicillin resistant Staphylococcus aureus in pigs in Norway 2019. Surveillance programmes for terrestrial and aquatic animals in Norway. Annual report 2019. Oslo: Norwegian Veterinary Institute 2020.
- Van den Berg RR, Dissel S, Rapallini MLBA, van der Weijden CC, Wit B and Heymans R, 2019. Characterization and whole genome sequencing of closely related multidrug‐resistant Salmonella enterica serovar Heidelberg isolates from imported poultry meat in the Netherlands. PLoS ONE. 10.1371/journal.pone.0219795 [DOI] [PMC free article] [PubMed] [Google Scholar]
- Wallace RL, Bulach D, Valcanis M, Polkinghorne BG, Pingault N, Stylianopoulos A, Givney RC, Glass K and Kirka MD, 2020. Identification of the first erm(B)‐positive Campylobacter jejuni and Campylobacter coli associated with novel multidrug resistance genomic islands in Australia. J Glob Antimicrob Resist, 23, 311–314. 10.1016/j.jgar.2020.09.009 [DOI] [PubMed] [Google Scholar]
- Wang Y, Zhang M, Deng F, Shen Z, Wu C, Zhang J, Zhang Q and Shen J, 2014. Emergence of multidrug‐resistant Campylobacter species isolates with a horizontally acquired rRNA methylase. Antimicrobial Agents and Chemotherapy, 58, 5405–5412. 10.1128/aac.03039-14 [DOI] [PMC free article] [PubMed] [Google Scholar]
- WHO (World Health Organization), 2006. WHO Drug Information. 20, 237–280. Available online: https://www.who.int/medicines/publications/druginformation/issues/DrugInfo06vol20_4/en/
- WHO (World Health Organization ‐ Advisory Group on Integrated Surveillance of Antimicrobial Resistance), 2019. Critically important antimicrobials for human medicine, 6th Revision 2018. 45 pp. Available online: http://www.who.int/foodsafety/publications/antimicrobials-sixth/en/
- Wolter DJ, Chatterjee A, Varman M and Goering RV, 2008. Isolation and characterization of an epidemic methicillin‐resistant Staphylococcus aureus 15 variant in the central United States. Journal of Clinical Microbiology, 46, 3548–3549. [DOI] [PMC free article] [PubMed] [Google Scholar]
- Yao H, Shen Z, Wang Y, Deng F, Liu D, Naren G, Dai L, Su CC, Wang B, Wang S, Wu C, Yu EW, Zhang Q and Shen J, 2016. Emergence of a potent multidrug efflux pump variant that enhances campylobacter resistance to multiple antibiotics. mBio, 7. 10.1128/mbio.01543-16 [DOI] [PMC free article] [PubMed] [Google Scholar]
- Zurfluh K, Poirel L, Nordmann P, Klumpp J and Stephan R, 2015. First detection of Klebsiella variicola producing OXA‐181 carbapenemase in fresh vegetable imported from Asia to Switzerland. Antimicrobial Resistance and Infection Control, 4, 38. 10.1186/s13756-015-0080-5 [DOI] [PMC free article] [PubMed] [Google Scholar]