Abstract
Different models have been proposed to elucidate the origins of the founding populations of America, along with the number of migratory waves and routes used by these first explorers. Settlements, both along the Pacific coast and on land, have been evidenced in genetic and archeological studies. However, the number of migratory waves and the origin of immigrants are still controversial topics. Here, we show the Australasian genetic signal is present in the Pacific coast region, indicating a more widespread signal distribution within South America and implicating an ancient contact between Pacific and Amazonian dwellers. We demonstrate that the Australasian population contribution was introduced in South America through the Pacific coastal route before the formation of the Amazonian branch, likely in the ancient coastal Pacific/Amazonian population. In addition, we detected a significant amount of interpopulation and intrapopulation variation in this genetic signal in South America. This study elucidates the genetic relationships of different ancestral components in the initial settlement of South America and proposes that the migratory route used by migrants who carried the Australasian ancestry led to the absence of this signal in the populations of Central and North America.
Keywords: settlement of South America, Australasian, genetics, Native Americans, Pacific coastal route
A signal of genetic affinity between present-day and ancient natives from South America and present-day indigenous groups of South Asia, Australia, and Melanesia has been previously reported (1–4). This Australasian−Native American connection persists as one of the most intriguing and poorly understood events in human history. The controversial Australasian population genetic component (i.e., “Ypikuéra population” or “Y population” component) was identified exclusively in the present-day Amazonian populations (2), suggesting at least two different founding waves leading to the formation of the people of this region. The first wave was inferred to be composed of direct descendants of the Beringian standstill population, and a second wave was formed by an admixed population of Beringian and southeast Asian ancestors that reached Beringia more recently. Both these populations would have settled and admixed in the Amazon region.
The contribution of an unsampled population to the autochthonous gene pool is thought to have led to the origin of the Australasian shared ancestry (2). In this sense, the Y population would be part of the first colonizing groups of the American continent. However, data from ancient South American samples indicated a weak Y signal around 10,000 yBP (3). This evidence indicates that, rather than a second wave entering South America from southeast Asia, the Y ancestry might be traced back to common ancestors of Native Americans, who lived in northeast Asia. Furthermore, a new line of evidence indicates that the first American clades split in East Asia, not in Beringia, which makes the gene flow of the Y ancestry from the ancestral East Asian groups even more likely (5). However, the paucity of the signal among present-day and ancient groups, along with the endemic and apparently random pattern of detection, has raised the possibility that it could be a false-positive detection, likely due to the strong genetic drift effects experienced by the Amazonian populations (and other indigenous South Americans). However, it might be the other way around, a scenario in which the signal went below the significance level in some populations, due to the high drift effects they experienced (i.e., false negatives).
We explored our dataset (SI Appendix, Extended Methods), which is currently the most comprehensive set of genomic data from South American populations (383 individuals; 438,443 markers), to shed light on this question. Ethical approval for sample collection was provided by the Brazilian National Ethics Commission (CONEP Resolutions 123 and 4599). CONEP also approved oral consent for the use of these samples in population history and human evolution studies. Individual and/or tribal informed oral consent was obtained from participants who were not able to read or write.
Our results showed that the Australasian genetic signal, previously described as exclusive to Amazonian groups, was also identified in the Pacific coastal population, pointing to a more widespread signal distribution within South America, and possibly implicating an ancient contact between Pacific and Amazonian dwellers. In addition, a significant amount of interpopulation and intrapopulation variation of this genetic signal was detected.
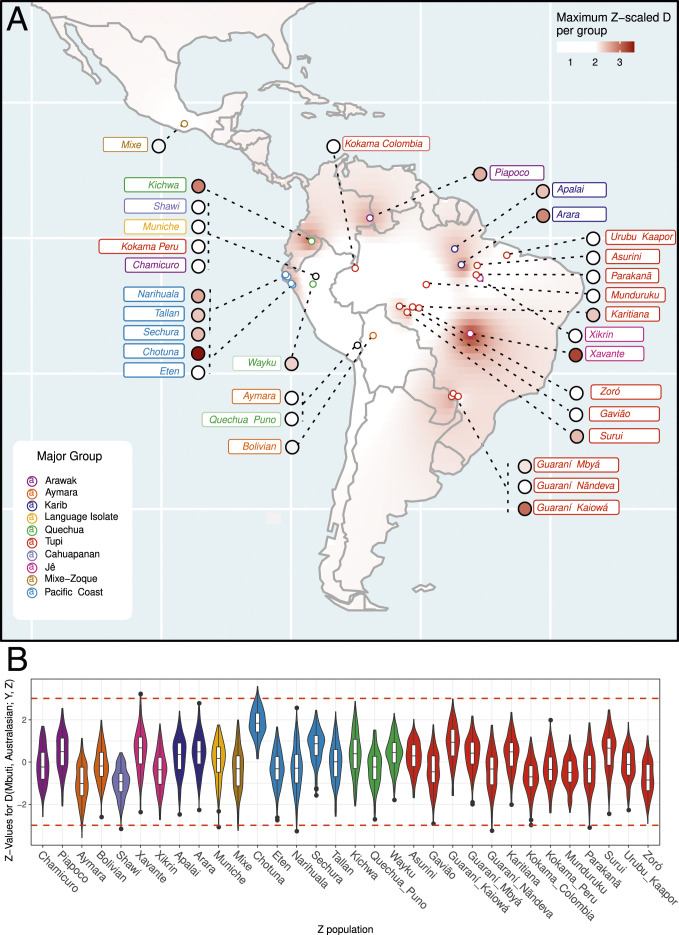
To test the existence of this excess allele sharing, we calculated the D(Mbuti, Australasian; Y, Z) statistic for every pair of Y and Z indigenous groups or individuals in our dataset (Dataset S1A), where “Australasian” is also iterated over the Australasian groups, namely Australian (and Australian.DG), Melanesian, Onge (i.e., ONG.SG), and Papuan (6–9). In the tests between groups, signal detection was reproduced in Karitiana and Suruí (Amazonia), but it was also observed in Chotuna (Mochica descendants from the Pacific coast), Guaraní Kaiowá (central west Brazil), and Xavánte (Central Brazilian Plateau) (Dataset S3). When we used the maximum unrelated set of individuals (Dataset S1A), the signal lost significance level in Karitiana, Suruí, and Guaraní Kaiowá (Dataset S3). However, the signal was still evident in the Pacific coast population and in the central Brazilian natives (Fig. 1 and Dataset S3).
Fig. 1.
Relative patterns of genetic affinity of Australasians among Native American groups. (A) Maximum Z values per population interpolated with the inverse distance weighting method. (B) Distribution of all estimated Z values (y axis) for each “Z” population (x axis) as violin and box plots. In B, the black dots represent outliers, and the red dashed lines indicate the Z-value thresholds of Z = −3 and Z = 3.
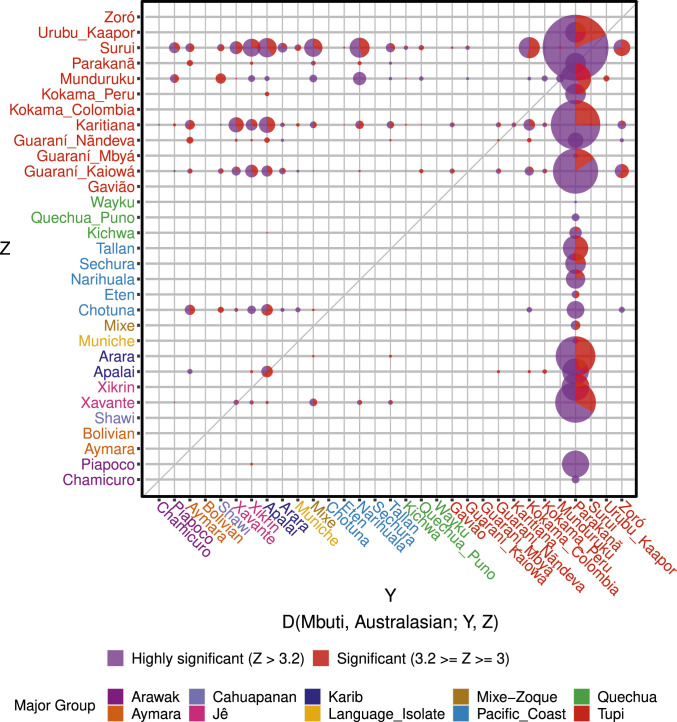
We also aimed to detect whether some individuals would present a higher number of significant tests than others from the same population, which could indicate a heterogeneous genetic ancestry within the positive populations. Our analysis showed that, indeed, some individuals presented a higher number of tests pointing to excess allele sharing, but also that some are more likely to present a significant deficit of this ancestry in comparison to the others (Fig. 2 and Dataset S4 C and D). From these results, it is evident that the loss of signal significance upon the shift from the complete set to the maximum unrelated set of samples (Dataset S3) was caused by the exclusion of specific individuals with higher levels of allele sharing with Australasians rather than by the removal of a bias caused by the relatedness among the tested samples in the first place.
Fig. 2.
Excess affinity of Native Americans with Australasians. The y axis indicates the group affiliation of the individual used at the Z position of the statistic (excess in allele sharing). The x axis represents the group affiliation of the individual at the Y position of the statistic (deficit in allele sharing). Estimates were clustered by groups, and the number of significant tests was weighted by the number of individuals in the comparison.
This provides strong evidence that a significant variability of this signal exists not only at an interpopulation level but also between individuals from the same populations. These results suggest that the intrapopulation variability of this signal is not rare (Fig. 2) and is observed in several groups (Apalai, Guaraní Nãndeva, Karitiana, Munduruku, Parakanã, and Xavánte). Most significant tests detected this excess signal in Tupí-speaking individuals, but the signal was also detected in individuals from every major linguistic group (Fig. 2 and Dataset S4) and, at the same time, presented a widespread geographic distribution within South America (Fig. 1). Conversely, a considerable number of samples were inferred to have a deficit of allele sharing with Australasians (Fig. 2 and Dataset S4D). Strikingly, the individual PAR137 (Parakanã) presented an extremely high proportion of significant tests (31.64%), indicating a relative deficit. This individual is not an outlier neither in the principal component analysis of the Native American samples (Dataset S1 B and C), nor regarding its missingness rate (Dataset S1A), nor in a multidimensional scaling (MDS) of pairwise genetic distances between samples in the unrelated and unadmixed subset (Dataset S1D). Besides, the distribution of Y-population ancestry among present-day indigenous groups of South America showed no relationship with ethnolinguistic diversity or geographic location.
To further characterize the ancestry of Central and South American indigenous groups, we replicated a series of tests performed with qpWave by Skoglund et al. (2) to investigate the minimum number of ancestry streams necessary for the formation of these populations. Essentially, we selected four populations from each of the six global regions (sub-Saharan Africa, western Europe, East Asia, South Asia, Siberia/central Asia, and Oceania) as outgroups, and 14 indigenous groups with more than three unadmixed and unrelated individuals as test groups (SI Appendix, Extended Methods). These groups were tested in a few combinations, and the results are summarized in Dataset S5 (qpWave weights for the full dataset in Dataset S5B). These results reproduce the estimates obtained by Skoglund et al. (2) also indicating that at least two streams of migration are necessary to explain the present-day genetic diversity of Central and South American populations.
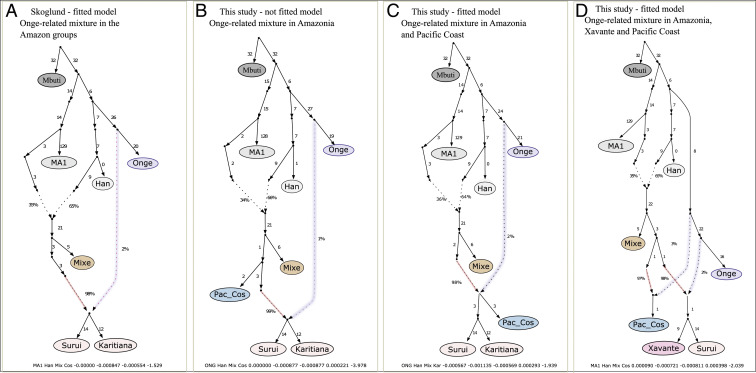
As the Chotuna group in the Pacific coast also exhibited excess allele sharing (Fig. 1 and Dataset S3) with the Australasians as estimated by D statistic (Mbuti; Australasians: Y, Z), we created admixture graph models based on the scaffold of Skoglund et al. (2) (Fig. 3A) with the addition of the Pacific coastal groups Sechura, Chotuna, and Narihuala. The best-fitted model showed that the Pacific coast is a mixed group of South American ancestry and a small non-American contribution associated with a sister branch of Onge (Fig. 3C), as also observed for Karitiana and Suruí. When the Xavánte were included in the analysis, the best-fitted model showed a direct contribution of the Australasian component in the Pacific coast, followed by a strong drift of this signal, giving rise to Amazonian groups (Fig. 3D). Although Fig. 3D could indicate two independent events, the small genetic distances between the nodes in this model reinforced the single admixture event evidence. The Treemix (10) analysis also showed a pattern of diversification in which Pacific coastal and Andean groups diverged first (Dataset S6), followed by the eastern Andean slopes populations and then, finally, the Amazonians and other eastern South Americans. These findings suggest that the Y-population contribution was introduced before the formation of the Amazonian branch, likely in the ancestors of Pacific coastal/Amazonian populations.
Fig. 3.
Admixture graph modeling of the Y-population contribution to Amazonia and Pacific coast. (A) Previously published model proposed by Skoglund et al. (2). To investigate these genetic affinities, we first create (B and C) admixture graphs adding the Pacific coastal groups Sechura, Chotuna, and Narihuala (Pac_Cos) to the previous models, and (D) add Xavánte and the Pacific coast, followed by Suruí and Karitiana.
Different migration routes to the South American region have been previously proposed and evidenced. Archeological and genetic data demonstrated that both routes, Pacific coastal and inland, were likely used by the first migrants (11). Our models point to an ancient genetic affinity between the Pacific coast and Amazonian populations that could be explained by the presence of Y ancestry in both geographic regions. In addition, this shared ancestry seems to precede the separation of the Pacific and Amazon branches, showing an entry through the west coast, followed by successive events of genetic drift in the Brazilian populations. This genetic evidence for the presence of Y ancestry on the South American Pacific coast indicates that this ancestry likely reached this region through the Pacific coastal route, and therefore could explain absence of this genetic component in the populations of North and Central America studied so far.
Supplementary Material
Acknowledgments
M.A.C.e.S was supported by Fundação de Amparo á Pesquisa do Estado de São Paulo (FAPESP) (2018/013716; 2015/26875-9) and T.F. was funded by FAPESP (2016/12371-1; 2015/26875-9).
Footnotes
The authors declare no competing interest.
This article contains supporting information online at https://www.pnas.org/lookup/suppl/doi:10.1073/pnas.2025739118/-/DCSupplemental.
Data Availability
The newly genotyped datasets reported in this paper have been deposited in the European Genome-phenome Archive and are available for download under accession no. EGAS00001005022.
Change History
July 8, 2021: The author line and the Acknowledgements have been updated.
References
- 1.Raghavan M., et al., Genomic evidence for the Pleistocene and recent population history of Native Americans. Science 349, aab3884 (2015). [DOI] [PMC free article] [PubMed] [Google Scholar]
- 2.Skoglund P., et al., Genetic evidence for two founding populations of the Americas. Nature 525, 104–108 (2015). [DOI] [PMC free article] [PubMed] [Google Scholar]
- 3.Moreno-Mayar J. V., et al., Early human dispersals within the Americas. Science 362, eaav2621 (2018). [DOI] [PubMed] [Google Scholar]
- 4.Posth C., et al., Reconstructing the deep population history of Central and South America. Cell 175, 1185–1197.e22 (2018). [DOI] [PMC free article] [PubMed] [Google Scholar]
- 5.Ning C., Fernandes D., Changmai P., Flegontova O., The genomic formation of First American ancestors in East and Northeast Asia. bioRxiv [Preprint] (2020). 10.1101/2020.10.12.336628. Accessed 15 October 2020. [DOI]
- 6.Lazaridis I., et al., Ancient human genomes suggest three ancestral populations for present-day Europeans. Nature 513, 409–413 (2014). [DOI] [PMC free article] [PubMed] [Google Scholar]
- 7.Prüfer K., et al., The complete genome sequence of a Neanderthal from the Altai Mountains. Nature 505, 43–49 (2014). [DOI] [PMC free article] [PubMed] [Google Scholar]
- 8.Patterson N., et al., Ancient admixture in human history. Genetics 192, 1065–1093 (2012). [DOI] [PMC free article] [PubMed] [Google Scholar]
- 9.Mondal M., et al., Genomic analysis of Andamanese provides insights into ancient human migration into Asia and adaptation. Nat. Genet. 48, 1066–1070 (2016). [DOI] [PubMed] [Google Scholar]
- 10.Pickrell J. K., Pritchard J. K., Inference of population splits and mixtures from genome-wide allele frequency data. PLoS Genet. 8, e1002967 (2012). [DOI] [PMC free article] [PubMed] [Google Scholar]
- 11.Potter B. A., et al., Current evidence allows multiple models for the peopling of the Americas. Sci. Adv. 4, eaat5473 (2018). [DOI] [PMC free article] [PubMed] [Google Scholar]
Associated Data
This section collects any data citations, data availability statements, or supplementary materials included in this article.
Supplementary Materials
Data Availability Statement
The newly genotyped datasets reported in this paper have been deposited in the European Genome-phenome Archive and are available for download under accession no. EGAS00001005022.


