

Abstract
Mitochondrial outer membrane permeabilization, which is a critical step in apoptosis, is initiated upon transmembrane insertion of the C‐terminal α‐helix (α9) of the proapoptotic Bcl‐2 family protein BAX. The isolated α9 fragment (residues 173–192) is also competent to disrupt model membranes, and the structures of its membrane‐associated oligomers are of interest in understanding the potential roles of this sequence in apoptosis. Here, we used ultrafast two‐dimensional infrared (2D IR) spectroscopy, thioflavin T binding, and transmission electron microscopy to show that the synthetic BAX α9 peptide (α9p) forms amyloid aggregates in aqueous environments and on the surfaces of anionic small unilamellar vesicles. Its inherent amyloidogenicity was predicted by sequence analysis, and 2D IR spectra reveal that vesicles modulate the β‐sheet structures of insoluble aggregates, motivating further examination of the formation or suppression of BAX amyloids in apoptosis.
Keywords: 2D IR, amyloid, apoptosis, BAX
1. INTRODUCTION
The Bcl‐2 family of proteins regulates the mitochondrial pathway of apoptosis, 1 , 2 , 3 and dysfunction of one or more members can contribute to cancers, 4 , 5 , 6 neurodegenerative diseases, 7 , 8 and developmental disorders. 9 , 10 The proapoptotic member BAX plays a central role in apoptosis via mitochondrial outer membrane permeabilization (MOMP). During MOMP, BAX oligomerizes on the mitochondrial outer membrane (MOM) and forms pores, which in turn release proteins such as cytochrome c and SMAC/DIABLO that promote downstream caspase activation and cell death. 3 , 11 , 12 The early events in this process, including the insertion of the BAX C‐terminal helix (α9) into the MOM and homodimerization, are increasingly well‐characterized, 1 , 13 , 14 , 15 , 16 but the molecular‐level structure of the oligomeric BAX pore remains unknown. Additionally, non‐MOMP functions of BAX have been reported 17 and clusters containing hundreds to thousands of BAX monomers have been implicated in mitochondrial fission, 18 , 19 suggesting multiple modes of action that likely involve undiscovered structural rearrangements.
In contrast to most current models of full‐length BAX oligomerization, membrane‐permeabilizing peptides derived from the isolated C‐terminus (α9) sequence appear to form diverse secondary structures, including β‐sheets. 20 , 21 , 22 Prior studies using Fourier transform infrared (FTIR) spectroscopy showed that β‐rich structures form in the absence and presence of model membranes based on strong absorbances below ~1,640 cm−1. 20 , 21 Tatulian et al. used FTIR peak assignments in combination with UV circular dichroism and partial solid‐state NMR data to propose a model of an octameric α/β pore to explain its membrane permeabilizing activity. 21 However, the strategy of assigning FTIR features using Gaussian deconvolution is prone to error from overfitting 23 and cannot easily distinguish between uniform ensembles and mixed states. Interestingly, reported BAX α9 peptide spectra collected across multiple conditions contain strong Amide I absorbances in the range of 1,620–1,630 cm−1. 20 , 21 Features in this region are characteristic of delocalized excitons within extended β‐sheets, 24 , 25 , 26 , 27 , 28 in contrast to bounded β‐sheets in folded proteins and the α/β pore model which absorb at higher frequencies (≳1,630 cm−1). 29 , 30 , 31 Because reported structural models of BAX α9 pores 21 cannot account for such delocalization effects, it is necessary to consider amyloid‐like modes of assembly for the BAX C‐terminus.
In this study, we examined the aggregation of a synthetic human BAX α9 peptide (α9p) with the sequence H2N‐VTIFVAGVLTASLTIWKKMG‐CO2H. Using sequence‐based structure analysis, we found that this region of the BAX sequence has a high β‐aggregation and amyloid propensity. We characterized α9p aggregates formed in the absence and presence of anionic small unilamellar vesicles (SUVs) using ultrafast two‐dimensional infrared (2D IR) spectroscopy. This technique, which is described in detail elsewhere, 26 , 30 , 32 , 33 , 34 provides substantial advantages over FTIR spectroscopy including the ability to detect vibrational coupling through cross‐peaks. Our 2D IR results, supported by thioflavin T (ThT) binding and transmission electron microscopy (TEM) experiments, show that α9p forms stable, insoluble amyloid aggregates, and that their formation and β‐strand organizations depend on interactions with phospholipid bilayers. These findings provide new insight into the oligomerization of the isolated BAX C‐terminus and suggest that amyloid aggregation may be relevant to the behavior of the full‐length protein in vivo.
2. RESULTS
First, we used sequence‐based structure analysis to determine β‐aggregation or amyloid propensity of the full‐length human BAX sequence (Figure 1). Four different algorithms (AGGRESCAN, 35 TANGO, 36 , 37 , 38 PASTA 2.0, 39 and MetAmyl 40 ) showed convergent predictions of high propensities localized within the C‐terminal α‐helix (α9) and elevated propensities within α5 and α6, which are also known to associate with membranes 16 , 41 ; notably, the ZipperDB database (https://services.mbi.ucla.edu/zipperdb) also indicates that the α9 region has high amyloid propensity (accession ID: PDB:1F16_A). 42 Here, the entire α9 region is predicted to form β‐sheets, in contrast with the previous α/β pore model. 21 Although these predictions are broadly consistent with the ability of α9p to form β‐strands, they do not account for bilayer interactions, so aggregation trials in the absence and presence of model membranes are required to determine their effects.
FIGURE 1.

Structure and aggregation propensity of wild type human BAX. (a) Solution structure of BAX (PDB ID: 1F16) 43 with helices α1–α8 in gray and α9 in blue, showing the sequence synthesized in this work (α9p). (b) Aggregation and amyloid propensities of full‐length BAX protein via sequence analysis extracted from AGGRESCAN, 35 TANGO, 36 , 37 , 38 PASTA 2.0, 39 and MetAmyl 40
To examine the aggregation of α9p in in the absence of membranes, we diluted 6 mM stocks of the disaggregated peptide to a final concentration of 150 μM into a D2O buffer containing 20 mM Tris (pD 7.5) and 100 mM NaCl, and followed the signal in the Amide I region over time using rapid‐scan 2D IR spectroscopy. 31 , 34 , 44 Immediately after dilution, two diagonal peak pairs near ω pump = 1,645 cm−1 and ω pump = 1,675 cm−1 appeared, consistent with a largely disordered initial structure comprising random coil and β‐turns, respectively (Figure 2a). 30 , 34 , 45 , 46 , 47 Following a variable lag phase, a transition to β‐sheets was observed by the growth of a broad diagonal peak pair between ω pump = 1,600–1,635 cm−1 and concomitant reduction in the coil feature (Figure 2b). Eventually, a stationary phase is reached in which the spectrum is dominated by a narrow peak pair at ω pump = 1,620 cm−1 (Figure 2c). This low‐frequency signal arises from delocalized Amide I normal modes oriented perpendicular to hydrogen‐bonded β‐strands. The size of the resulting red shift scales with coupling constants that depend on the distances and angles between oscillators, following an asymptotic trend with the number of strands in the β‐sheets. 25 , 27 , 28 , 48 , 49 Similar kinetic behavior was observed via ThT fluorescence (Figure S1a), and TEM images (Figure S2a) show the formation of insoluble aggregates at long times (24 hr). Thus, given sufficient time and appropriate conditions, the helix/coil features that are observed in early 2D IR spectra (Figure 2a,b) and previously reported FTIR spectra 20 eventually transition to extended amyloid β‐sheets as predicted from sequence analysis (Figure 1). Notably, the appearance and disappearance of the ~1,610 cm−1 diagonal 2D IR signal (Figure 2d) at the onset of aggregation indicates the formation of a transient β‐rich intermediate with different coupling parameters. 50
FIGURE 2.

Aggregation behavior of α9p in aqueous buffer. (a–c) (Bottom) two‐dimensional infrared (2D IR) spectra with (top) corresponding diagonal slices for α9p in buffer at (a) early, (b) intermediate, and (c) late time points. Spectra are normalized to the largest Amide I intensity in the stationary‐phase (>250 min) spectrum and diagonal slices, which reflect the ν(0–1) bleach signals, are reversed in sign for comparison to Fourier transform infrared (FTIR) absorbance. Horizontal lines are drawn through diagonal frequencies discussed in the main text and monitored in (d). (d) Diagonal intensities at 1,610 cm−1 (gray); 1,620 cm−1 (red); 1,645 cm−1 (black); and 1,675 cm−1 (blue) during α9p aggregation. Kinetic traces are color coded as indicated by arrows in (a–c) (right). Additional trials are shown in Figure S3
To characterize stable species formed at long times, insoluble aggregates were isolated by centrifugation after 24 hr incubation at room temperature. As shown in Figure S4, the 2D IR spectrum of the insoluble fraction is nearly identical to the stationary‐phase spectra from kinetics experiments (Figure 2c). The FTIR spectrum and 2D IR diagonal slice of the insoluble fraction (Figure 3a, top) are dominated by a ~1,620 cm−1 signal and no other features are resolved above noise. However, close inspection of the 2D IR spectrum (Figure 3a, bottom) reveals that the excitonic feature (i) is accompanied by weak diagonal intensity in the coil region (ii) and near ω pump = 1,680 cm−1 (iii). Weak cross‐peaks (iv) are also observed between the high‐ (iii) and low‐frequency (i) features, indicating that these modes exist within the same coupled array. The high‐frequency feature may arise from either β‐turns or intrastrand coupling of Amide I modes, and although these are difficult to distinguish in unlabeled samples, 49 the low intensity is indicative of a likely parallel‐stranded configuration (vide infra). 27 , 47 , 48
FIGURE 3.
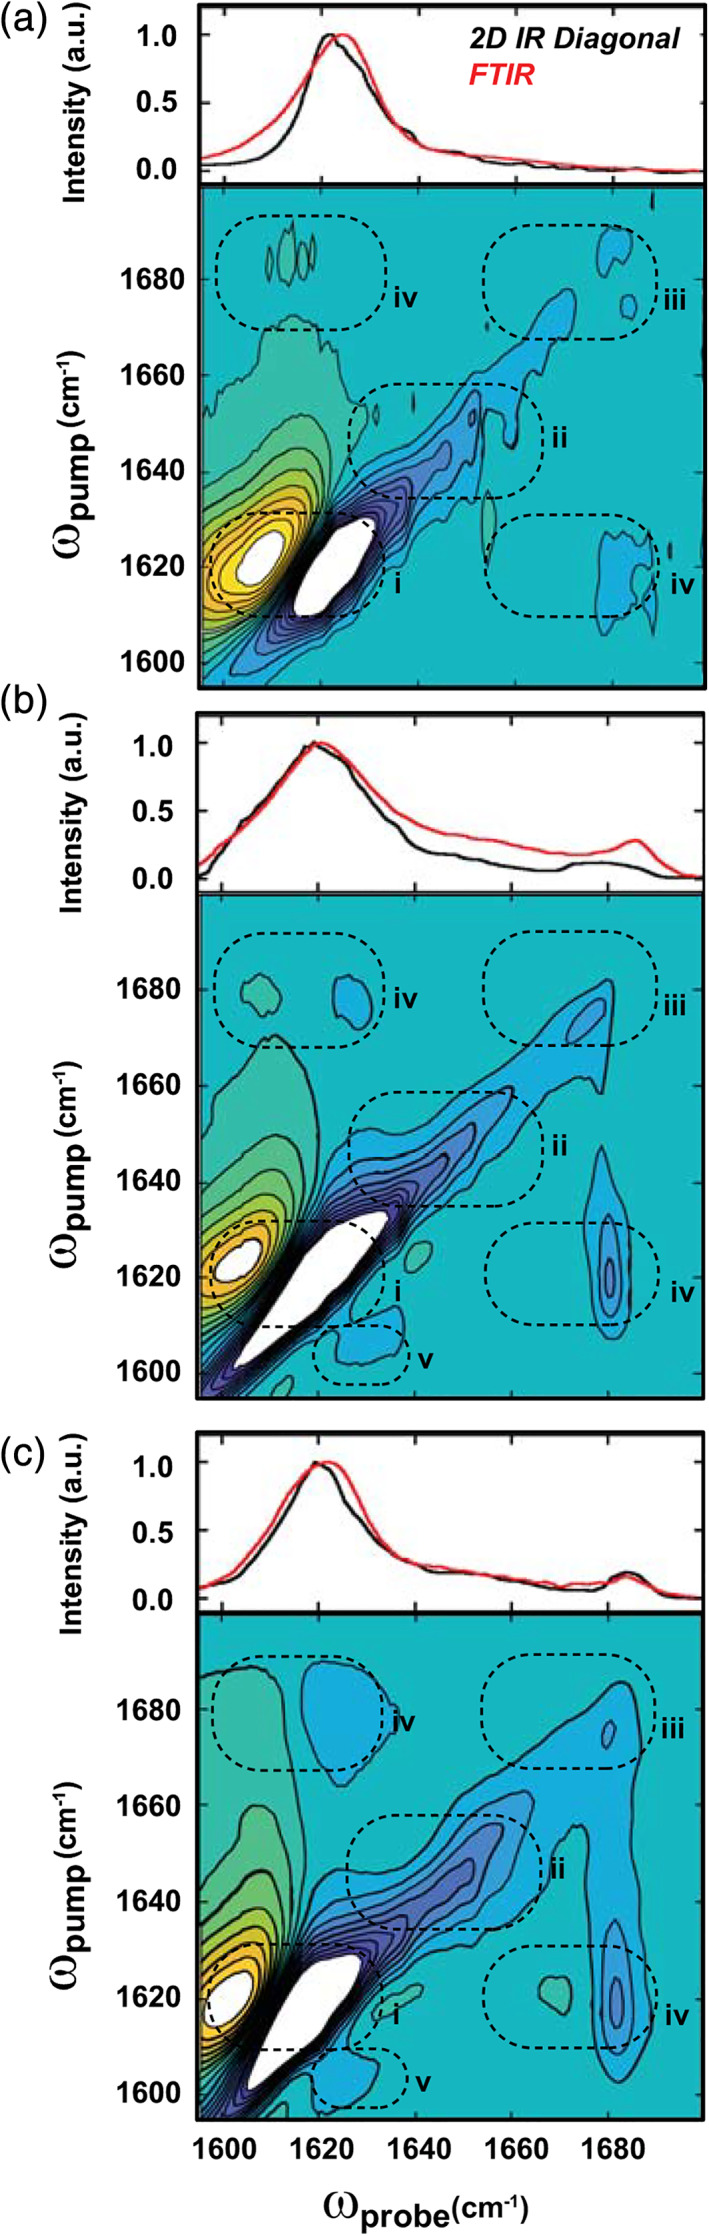
Two‐dimensional infrared (2D IR) and Fourier transform infrared (FTIR) spectra of insoluble α9p aggregates formed over 24 hr. (a–c): (Bottom) 2D IR spectra with (top) corresponding diagonal slices (black line) and FTIR spectra (red line) for mature α9p aggregates formed in the absence of small unilamellar vesicles (SUVs) (a), and in the presence of 10 mM (b) and 1 μM (c) 1‐palmitoyl‐2‐oleoyl‐sn‐glycero‐3‐phosphocholine:1‐palmitoyl‐2‐oleoyl‐sn‐glycero‐3‐phosphoglycerol (POPC:POPG) SUVs. 2D IR spectra are scaled to 50% of their respective Amide I maxima and peaks in Regions i–iv correspond to structural features discussed in the text. Vertical slices taken at ω probe = 1,680 cm−1 are shown in Figure S5 to compare the intensities of features (iii) and (iv)
Next, we performed the aggregation experiments using suspensions of 3:1 1‐palmitoyl‐2‐oleoyl‐sn‐glycero‐3‐phosphocholine:1‐palmitoyl‐2‐oleoyl‐sn‐glycero‐3‐phosphoglycerol (POPC:POPG) SUVs in the same buffer at a peptide: lipid ratio of 1:65 (10 mM total lipids). We observed rapid precipitation immediately following dilution; ThT fluorescence increased within ~5 min (Figure S1b), and the resulting precipitates contained both SUVs and networks of fibril‐like structures associated with their surfaces (Figure S2b). The accelerated formation of these species precluded 2D IR kinetics experiments, but in spectra of insoluble aggregates collected after 24 hr, a strong ~1,620 cm−1 signal indicates amyloid formation (Figure 3b). In contrast to the aggregates formed in the absence of SUVs, this feature is broadened in both the FTIR spectrum and the 2D IR diagonal slice, and the high‐frequency feature near 1,680 cm−1 is clearly resolved (Figure 3b, top). These features (i, iii) are apparent along the diagonal in the 2D IR spectrum (Figure 3b, bottom) and the signal in the coil region (ii) remains relatively weak. The increase in intensity of the high‐frequency feature (iii), and enhancement of cross‐peaks (iv) compared to Figure 3a (Figure S5), indicates that the α9p amyloids formed on SUVs have an alternative topology that includes a strongly coupled β‐turn, antiparallel β‐strands, or both. 24 , 25 , 48 , 49 Additionally, the signal near 1,610 cm−1 resembles low‐frequency Amide I modes in mature fibrils of Aβ, which were previously attributed to a subpopulation of aggregates with enhanced inter‐strand coupling. 50 However, the presence of a cross‐peak (v) to the dominant excitonic mode (i) indicates that different degrees of delocalization occur within the same structures, possibly as a result of structural inhomogeneity along β‐strands within β‐sheets. Interestingly, a similar low‐frequency signal is observed in the intermediate states during lipid‐free aggregation (Figure 2b,d) so it is possible that aggregation pathways diverge upon trapping of intermediates on SUVs followed by subsequent growth of aggregates with an altered topology.
Finally, we repeated the lipid‐dependent aggregation experiments using a reduced concentration of SUVs (1 μM total lipids) for a peptide: lipid ratio of 150:1. Under these conditions, only a small fraction of α9p molecules can interact with bilayers so a mixture of bilayer‐dependent and bilayer‐independent aggregates is expected. Again, aggregation proceeded rapidly (Figure S1c) and insoluble complexes containing SUVs and peptide aggregates were observed (Figure S2c). The FTIR and 2D IR spectra of the aggregates (Figure 3c) reproduced the features of those collected in the presence of excess lipids (Figure 3b), indicating that the membrane‐dependent conformation is still dominant; surprisingly, the intensities of the high‐frequency (~1,680 cm−1) diagonal feature (iii) and its associated cross‐peaks (iv) were further enhanced (Figure S5). These results support a model of rapid nucleation of α9p on anionic SUVs followed by amyloid aggregation in a topologically distinct state that persists in a stable conformation for at least 24 hr.
3. DISCUSSION
This study provides compelling evidence through sequence analysis, IR spectroscopy, ThT fluorescence, and TEM imaging, that the C‐terminal fragment (residues 173–192) of human BAX (α9p) forms amyloid fibrils in solution and on the surfaces of anionic (POPC:POPG) SUVs. The 2D IR data reveals that while these two classes of aggregates contain extended β‐sheets that span the majority of the residues, they differ in the organization of their β‐strands. Specifically, α9p aggregates formed in the absence of lipid bilayers are likely parallel‐stranded while those formed on SUVs have a more complex topology. In future studies, the detailed structures of these aggregates can be determined by combining 2D IR spectroscopy with isotope editing in order to reveal contacts between specific peptide bonds. 44 , 49 , 51 , 52
By comparing our results to prior reports, we gain new insight into the structures of BAX α9p assemblies formed on model phospholipid bilayers. Our FTIR and 2D IR spectra reproduce the strong ~1,620 cm−1 signal observed in previous works, 20 , 21 which is well‐known to arise from vibrational excitonic coupling in extended β‐sheets 24 , 27 , 28 , 32 , 48 and was likely misassigned to two‐stranded structures in the α/β pore model. 21 In the 2D IR spectra, a previously unassigned signal at ~1,610 cm−1 and the β‐sheet mode at ~1,680 cm−1 are resolved, and cross‐peaks show that they arise from coupled modes within insoluble assemblies where contributions from α‐helices and other structures are minor. The latter high‐frequency mode is consistent with the presence of antiparallel β‐strands, albeit within amyloid aggregates instead of oligomeric transmembrane pores. The primary difference in our results is a reduced contribution of α‐helices and disordered structures, which appear between 1,635 and 1,665 cm−1. 46 It is possible that some differences in membrane composition, curvature, and stability could bias the system toward a stable transmembrane structure, but this does not account for the presence of the aforementioned excitonic signals in spectra of α9p variants associated with multilamellar vesicles 20 and supported lipid bilayers. 21 Instead, previous reports likely detected mixtures of states, including soluble preamyloid and insoluble amyloid structures (cf. Figure 2a–c) that were unresolvable by FTIR. Although the final stable state of α9p is clearly amyloid in nature, this does not necessarily preclude the formation of transient pores along the bilayer‐dependent aggregation pathway. Such kinetic details may become accessible via 2D IR with increased scan rates and fast mixing techniques. 53 , 54
To date, structural studies of BAX have focused on the early events in MOMP, where transmembrane insertion of α9, homodimerization, and oligomerization are well‐established. 1 , 11 , 12 , 13 , 14 , 15 , 16 The results presented here show that the same region of sequence is highly amyloidogenic, and the resulting structures are modulated by model phospholipid bilayers. Clearly, more experiments will be required to establish whether the same phenomena occur in full‐length BAX upon its interactions with mitochondrial membranes. However, the strong amyloid propensity of α9p suggests that the amyloid state of BAX is accessible under near‐physiological conditions and must be considered in any detailed mechanistic model of apoptosis. Importantly, our observations generate new hypotheses regarding the possible functions of BAX. One possibility is that the amyloid pathway is suppressed in vivo by specific interactions of α9 with other regions of the BAX sequence, by structural preferences imposed by the MOM itself, or by other proteins involved in MOMP. Here, misfolding and amyloid aggregation of BAX would alter the balance of proapoptotic and antiapoptotic Bcl‐2 family proteins, perturbing pathways that regulate cell survival and death. Another possibility is that its amyloid‐like structures (including intermediates) are directly involved in cell death as mitochondrial analogs of cytotoxic amyloids such as Aβ 55 , 56 , 57 and some antimicrobial peptides. 58 , 59 Such structures could evolve from BAX pores, 11 , 12 occur in late‐stage BAX clusters, 18 , 19 or form within noncanonical pathways of mitochondrial disruption and dysfunction. 17 Finally, the recent observation that full‐length BAX is incorporated into fibrils formed by the antiapoptotic peptide humanin suggests that such heteroamyloids could act to suppress BAX function via sequestration in an inactive form. 60 , 61 Thus, our results motivate the continued examination of the amyloid state of BAX in vitro and in vivo to further understand the molecular mechanisms of apoptosis.
4. MATERIALS AND METHODS
4.1. Sequence analysis
The publicly available aggregation prediction servers AGGRESCAN (http://bioinf.uab.es/aggrescan/), 35 TANGO (http://tango.crg.es), 36 , 37 , 38 PASTA 2.0 (http://old.protein.bio.unipd.it/pasta2), 39 and MetAmyl (http://metamyl.genouest.org) 40 were used to predict the aggregation propensities across the full‐length human BAX protein (UniProt Accession ID: Q07812, PDB ID: 1F16, Figure S6). The AGGRESCAN server requires no input parameters outside of the amino acid sequence. For TANGO analysis, the option “no protection” was used for both the N‐ and C‐termini. The pH, temperature, ionic strength, and concentration were set to 7.5, 298.15 K, 0.120 M, and 0.000150 M, respectively, to reflect solution conditions used for BAX α9 peptide experiments throughout this work. For PASTA 2.0 analysis, the region (90% specificity) threshold was used which corresponds to top pairing energies and an energy threshold of 22 and <−2.8 PEU (PEU, 1.0 PASTA energy unit = 1.192 kcal/mol), respectively, which allow for high confidence in aggregation region detection. In the MetAmyl analysis, the “best global accuracy” threshold was applied for the BAX aggregation prediction.
4.2. Peptide synthesis and purification
The BAX α9 peptide (α9p) H2N‐VTIFVAGVLTASLTIWKKMG‐CO2H was synthesized in the solid state using standard fluorenylmethyloxycarbonyl (Fmoc) chemistry on Gly‐Wang resin using an AAPPTec FOCUS XC automated peptide synthesizer. The product was purified by reverse‐phase HPLC using a Hitachi LaChrom Elite system equipped with a Vydac semipreparative C4 column. Acetonitrile and water, supplemented with 0.1% 2,2,2‐trifluoroacetic acid (TFA) and 10% 2,2,2‐trifluoroethanol (TFE), were used as the mobile phase for HPLC purification, with a linear gradient of 30–37% acetonitrile:TFE:TFA over 60 min. The pure peptide was confirmed using a Bruker Daltonic MALDI‐TOF mass spectrometer (Figure S7).
4.3. Sample preparation
Purified α9p was resuspended in deuterated hexafluoroisopropanol (d‐HFIP) to deuterate exchangeable sites and promote disaggregation of peptides. 28 Concentrated (6 mM) peptide/d‐HFIP solution was diluted into Tris‐buffered (20 mM Tris, 100 mM NaCl, pD/pH = 7.5) D2O or H2O, either with or without lipid vesicles, to a final peptide concentration of 150 μM and incubated at room temperature for ~24 hr to ensure aggregation unless otherwise noted. For SUV preparation, chloroform solutions of POPC and POPG (Avanti Polar Lipids, Alabaster, AL) were combined in a ratio of 3:1 POPC:POPG and dried under vacuum. Lipid films were resuspended to 10 mM lipid concentration in the appropriate buffer and mixed vigorously for 1 hr. SUVs were prepared by sonicating the resulting suspensions for 10 min. 62 For experiments at 10 mM lipids, SUV suspensions were used as prepared, and for experiments at low lipid concentrations, SUV suspensions were diluted into identical buffers to the desired concentration. For ThT and 2D IR kinetics experiments, data collection was started immediately after dilution of the stock with no additional processing. For 2D IR and TEM experiments after 24 hr incubation, aggregated samples were centrifuged at 5,000g for 10 min and the insoluble fractions were resuspended in 20% of the original volume of buffer for analysis.
4.4. IR spectroscopy
Sample and background FTIR spectra were collected with 128 scans at room temperature using a JASCO 6800 FTIR spectrometer equipped with a PIKE Technologies (Madison, WI) MIRacle ATR Accessory and DTGS detector with a resolution of 1 cm−1. Buffer backgrounds were subtracted and residual baseline correction was performed in MATLAB using low‐order polynomials. For 2D IR spectroscopy, ~17 μJ mid‐IR pulses with (~100 fs) were directed into a 2DQuick Array spectrometer (Phasetech Spectroscopy, Inc., Madison, WI) equipped with a 128 × 128 pixel MCT array detector as previously described. 63 All spectra were collected with perpendicular pump and probe polarizations and four‐frame phase cycling to reduce interference from pump scatter. Probe frequencies were calibrated to the absorbances of 4‐nitrobenzaldehyde in dichloromethane (1,605; 1,676; and 1,709 cm−1), used as an external standard. All instruments were purged continuously with dry air to minimize contributions from water vapor. 2D IR spectra were processed in MATLAB using low‐order polynomial background correction and Hamming apodization. 44
4.5. ThT fluorescence
For ThT experiments, concentrated peptide/d‐HFIP solutions were diluted directly into a quartz cuvette containing Tris buffer, ThT (25 μM) and SUVs. Emission spectra between 450 and 600 nm were collected in 30 s intervals using a Cary Eclipse spectrofluorometer (λ ex = 440 nm), and emission intensities at 480 nm were monitored over time.
4.6. Transmission electron microscopy
For TEM experiments, 5 μl of buffered α9p samples, with or without SUVs, were deposited onto formvar coated nickel grids (Electron Microscopy Sciences, Hatfield, PA) and allowed to incubate for 5 min at room temperature. Excess buffer was removed by blotting, and the grids were dried in air for 10 min and stained with 2% uranyl acetate. TEM images were collected with a Hitachi H‐7650 TEM using an acceleration voltage of 60 kV.
CONFLICT OF INTEREST
The authors declare no conflict of interest.
AUTHOR CONTRIBUTIONS
David A. Price: Conceptualization, data curation, formal analysis, investigation, methodology, project administration, resources, software, validation, visualization, writing – review and editing. Tayler D. Hill: Methodology, resources, writing – review and editing. Kaitlyn A. Hutson: Investigation. Blaze W. Rightnowar: investigation. Sean D. Moran: Conceptualization, data curation, funding acquisition, methodology, project administration, resources, software, supervision, validation, visualization, writing – original draft preparation, writing – review and editing.
Supporting information
Appendix S1: Supporting information
ACKNOWLEDGMENTS
This research is in part supported by the SIU Research Enriched Academic Challenge (REACH) program awarded to K. A. H. and B. W. R. This material is based upon work supported by the National Science Foundation Graduate Research Fellowship under Grant No. DGE‐1545870 to T. D. H. The authors wish to thank the Southern Illinois University IMAGE center for assistance in the collection of the TEM images. The transmission electron microscope used in this work was purchased through a grant from National Science Foundation (DEB‐0521177). The authors wish to thank the SIU Mass Spectrometry Facility director Dr Mary Kinsel for training and assistance pertaining to the Bruker Daltonic MALDI TOFMS results included in this publication.
Price DA, Hill TD, Hutson KA, Rightnowar BW, Moran SD. Membrane‐dependent amyloid aggregation of human BAX α9 (173–192). Protein Science. 2021;30:1072–1080. 10.1002/pro.4053
Funding information National Science Foundation (Division of Environmental Biology), Grant/Award Number: DEB‐0521177; National Science Foundation Graduate Research Fellowship (Division of Graduate Education), Grant/Award Number: DGE‐1545870; SIU Research Enriched Academic Challenge (REACH)
REFERENCES
- 1. Youle RJ, Strasser A. The BCL‐2 protein family: Opposing activities that mediate cell death. Nat Rev Mol Cell Biol. 2008;9:47–59. [DOI] [PubMed] [Google Scholar]
- 2. Chipuk JE, Moldoveanu T, Llambi F, Parsons MJ, Green DR. The BCL‐2 family reunion. Mol Cell. 2010;37:299–310. [DOI] [PMC free article] [PubMed] [Google Scholar]
- 3. Gillies LA, Kuwana T. Apoptosis regulation at the mitochondrial outer membrane. J Cell Biochem. 2014;115:632–640. [DOI] [PubMed] [Google Scholar]
- 4. Xin M, Li R, Xie M, et al. Small‐molecule Bax agonists for cancer therapy. Nat Commun. 2014;5:4935–4935. [DOI] [PMC free article] [PubMed] [Google Scholar]
- 5. Adams JM, Cory S. The BCL‐2 arbiters of apoptosis and their growing role as cancer targets. Cell Death Differ. 2018;25:27–36. [DOI] [PMC free article] [PubMed] [Google Scholar]
- 6. Warren CFA, Wong‐Brown MW, Bowden NA. BCL‐2 family isoforms in apoptosis and cancer. Cell Death Dis. 2019;10:177. [DOI] [PMC free article] [PubMed] [Google Scholar]
- 7. Akhtar RS, Ness JM, Roth KA. Bcl‐2 family regulation of neuronal development and neurodegeneration. Biochim Biophys Acta. 2004;1644:189–203. [DOI] [PubMed] [Google Scholar]
- 8. Shacka JJ, Roth KA. Regulation of neuronal cell death and neurodegeneration by members of the Bcl‐2 family: Therapeutic implications. CNS Neurol Disord Drug Targets. 2005;4:25–39. [DOI] [PubMed] [Google Scholar]
- 9. Kollek M, Müller A, Egle A, Erlacher M. Bcl‐2 proteins in development, health, and disease of the hematopoietic system. FEBS J. 2016;283:2779–2810. [DOI] [PubMed] [Google Scholar]
- 10. Opferman JT, Kothari A. Anti‐apoptotic BCL‐2 family members in development. Cell Death Differ. 2018;25:37–45. [DOI] [PMC free article] [PubMed] [Google Scholar]
- 11. Cosentino K, Garcia‐Saez AJ. Bax and Bak pores: Are we closing the circle? Trends Cell Biol. 2017;27:266–275. [DOI] [PMC free article] [PubMed] [Google Scholar]
- 12. Uren RT, Iyer S, Kluck RM. Pore formation by dimeric Bak and Bax: An unusual pore? Philos Trans R Soc Lond B Biol Sci. 2017;372:20160218. [DOI] [PMC free article] [PubMed] [Google Scholar]
- 13. Westphal D, Dewson G, Czabotar PE, Kluck RM. Molecular biology of Bax and Bak activation and action. Biochim Biophys Acta. 2011;1813:521–531. [DOI] [PubMed] [Google Scholar]
- 14. Bleicken S, Jeschke G, Stegmueller C, Salvador‐Gallego R, García‐Sáez AJ, Bordignon E. Structural model of active Bax at the membrane. Mol Cell. 2014;56:496–505. [DOI] [PMC free article] [PubMed] [Google Scholar]
- 15. Gahl RF, He Y, Yu S, Tjandra N. Conformational rearrangements in the pro‐apoptotic protein, Bax, as it inserts into mitochondria: A cellular death switch. J Biol Chem. 2014;289:32871–32882. [DOI] [PMC free article] [PubMed] [Google Scholar]
- 16. Westphal D, Dewson G, Menard M, et al. Apoptotic pore formation is associated with in‐plane insertion of Bak or Bax central helices into the mitochondrial outer membrane. Proc Natl Acad Sci U S A. 2014;111:E4076–E4085. [DOI] [PMC free article] [PubMed] [Google Scholar]
- 17. Chong SJF, Marchi S, Petroni G, Kroemer G, Galluzzi L, Pervaiz S. Noncanonical cell fate regulation by Bcl‐2 proteins. Trends Cell Biol. 2020;30:537–555. [DOI] [PubMed] [Google Scholar]
- 18. Karbowski M, Lee Y‐J, Gaume B, et al. Spatial and temporal association of Bax with mitochondrial fission sites, Drp1, and Mfn2 during apoptosis. J Cell Biol. 2002;159:931–938. [DOI] [PMC free article] [PubMed] [Google Scholar]
- 19. Nasu Y, Benke A, Arakawa S, et al. In situ characterization of Bak clusters responsible for cell death using single molecule localization microscopy. Sci Rep. 2016;6:27505. [DOI] [PMC free article] [PubMed] [Google Scholar]
- 20. del Mar Martínez‐Senac M, Corbalán‐García S, Gómez‐Fernández JC. Conformation of the C‐terminal domain of the pro‐apoptotic protein Bax and mutants and its interaction with membranes. Biochemistry. 2001;40:9983–9992. [DOI] [PubMed] [Google Scholar]
- 21. Tatulian SA, Garg P, Nemec KN, Chen B, Khaled AR. Molecular basis for membrane pore formation by Bax protein carboxyl terminus. Biochemistry. 2012;51:9406–9419. [DOI] [PMC free article] [PubMed] [Google Scholar]
- 22. Garg P, Nemec KN, Khaled AR, Tatulian SA. Transmembrane pore formation by the carboxyl terminus of Bax protein. Biochim Biophys Acta. 2013;1828:732–742. [DOI] [PubMed] [Google Scholar]
- 23. Hawkins DM. The problem of overfitting. J Chem Inform Comput Sci. 2004;44:1–12. [DOI] [PubMed] [Google Scholar]
- 24. Cheatum CM, Tokmakoff A, Knoester J. Signatures of β‐sheet secondary structures in linear and two‐dimensional infrared spectroscopy. J Chem Phys. 2004;120:8201–8215. [DOI] [PubMed] [Google Scholar]
- 25. Demirdöven N, Cheatum CM, Chung HS, Khalil M, Knoester J, Tokmakoff A. Two‐dimensional infrared spectroscopy of antiparallel β‐sheet secondary structure. J Am Chem Soc. 2004;126:7981–7990. [DOI] [PubMed] [Google Scholar]
- 26. Shim S‐H, Strasfeld DB, Ling YL, Zanni MT. Automated 2D IR spectroscopy using a mid‐IR pulse shaper and application of this technology to the human islet amyloid polypeptide. Proc Natl Acad Sci U S A. 2007;104:14197–14202. [DOI] [PMC free article] [PubMed] [Google Scholar]
- 27. Moran SD, Zanni MT. How to get insight into amyloid structure and formation from infrared spectroscopy. J Phys Chem Lett. 2014;5:1984–1993. [DOI] [PMC free article] [PubMed] [Google Scholar]
- 28. Lomont JP, Ostrander JS, Ho J‐J, Petti MK, Zanni MT. Not all β‐sheets are the same: Amyloid infrared spectra, transition dipole strengths, and couplings investigated by 2D IR spectroscopy. J Phys Chem B. 2017;121:8935–8945. [DOI] [PMC free article] [PubMed] [Google Scholar]
- 29. Zandomeneghi G, Krebs MRH, McCammon MG, Fändrich M. FTIR reveals structural differences between native beta‐sheet proteins and amyloid fibrils. Prot Sci. 2004;13:3314–3321. [DOI] [PMC free article] [PubMed] [Google Scholar]
- 30. Baiz CR, Peng CS, Reppert ME, Jones KC, Tokmakoff A. Coherent two‐dimensional infrared spectroscopy: Quantitative analysis of protein secondary structure in solution. Analyst. 2012;137:1793–1799. [DOI] [PubMed] [Google Scholar]
- 31. Moran SD, Woys AM, Buchanan LE, Bixby E, Decatur SM, Zanni MT. Two‐dimensional IR spectroscopy and segmental 13C labeling reveals the domain structure of human γD‐crystallin amyloid fibrils. Proc Natl Acad Sci U S A. 2012;109:3329–3334. [DOI] [PMC free article] [PubMed] [Google Scholar]
- 32. Kim YS, Hochstrasser RM. Applications of 2D IR spectroscopy to peptides, proteins, and hydrogen‐bond dynamics. J Phys Chem B. 2009;113:8231–8251. [DOI] [PMC free article] [PubMed] [Google Scholar]
- 33. Hamm P, Zanni M. Concepts and methods of 2D infrared spectroscopy. Cambridge: Cambridge University Press, 2011. [Google Scholar]
- 34. Ghosh A, Ostrander JS, Zanni MT. Watching proteins wiggle: Mapping structures with two‐dimensional infrared spectroscopy. Chem Rev. 2017;117:10726–10759. [DOI] [PMC free article] [PubMed] [Google Scholar]
- 35. de Groot NS, Pallarés I, Avilés FX, Vendrell J, Ventura S. Prediction of "hot spots" of aggregation in disease‐linked polypeptides. BMC Struct Biol. 2005;5:18. [DOI] [PMC free article] [PubMed] [Google Scholar]
- 36. Fernandez‐Escamilla AM, Rousseau F, Schymkowitz J, Serrano L. Prediction of sequence‐dependent and mutational effects on the aggregation of peptides and proteins. Nat Biotechnol. 2004;22:1302–1306. [DOI] [PubMed] [Google Scholar]
- 37. Linding R, Schymkowitz J, Rousseau F, Diella F, Serrano L. A comparative study of the relationship between protein structure and beta‐aggregation in globular and intrinsically disordered proteins. J Mol Biol. 2004;342:345–353. [DOI] [PubMed] [Google Scholar]
- 38. Rousseau F, Schymkowitz J, Serrano L. Protein aggregation and amyloidosis: Confusion of the kinds? Curr Opin Struct Biol. 2006;16:118–126. [DOI] [PubMed] [Google Scholar]
- 39. Walsh I, Seno F, Tosatto SCE, Trovato A. PASTA 2.0: An improved server for protein aggregation prediction. Nucleic Acids Res. 2014;42:W301–W307. [DOI] [PMC free article] [PubMed] [Google Scholar]
- 40. Emily M, Talvas A, Delamarche C. MetAmyl: A METa‐predictor for AMYLoid proteins. PLoS One. 2013;8:e79722. [DOI] [PMC free article] [PubMed] [Google Scholar]
- 41. García‐Sáez AJ, Coraiola M, Serra MD, Mingarro I, Müller P, Salgado J. Peptides corresponding to helices 5 and 6 of Bax can independently form large lipid pores. FEBS J. 2006;273:971–981. [DOI] [PubMed] [Google Scholar]
- 42. Thompson MJ, Sievers SA, Karanicolas J, Ivanova MI, Baker D, Eisenberg D. The 3D profile method for identifying fibril‐forming segments of proteins. Proc Natl Acad Sci U S A. 2006;103:4074–4078. [DOI] [PMC free article] [PubMed] [Google Scholar]
- 43. Suzuki M, Youle RJ, Tjandra N. Structure of Bax: Coregulation of dimer formation and intracellular localization. Cell. 2000;103:645–654. [DOI] [PubMed] [Google Scholar]
- 44. Middleton CT, Woys AM, Mukherjee SS, Zanni MT. Residue‐specific structural kinetics of proteins through the union of isotope labeling, mid‐IR pulse shaping, and coherent 2D IR spectroscopy. Methods. 2010;52:12–22. [DOI] [PMC free article] [PubMed] [Google Scholar]
- 45. Choi J‐H, Kim J‐S, Cho M. Amide I vibrational circular dichroism of polypeptides: Generalized fragmentation approximation method. J Chem Phys. 2005;122:174903. [DOI] [PubMed] [Google Scholar]
- 46. Barth A. Infrared spectroscopy of proteins. Biochim Biophys Acta. 2007;1767:1073–1101. [DOI] [PubMed] [Google Scholar]
- 47. Ganim Z, Chung HS, Smith AW, DeFlores LP, Jones KC, Tokmakoff A. Amide I two‐dimensional infrared spectroscopy of proteins. Acc Chem Res. 2008;41:432–441. [DOI] [PubMed] [Google Scholar]
- 48. Hahn S, Kim SS, Lee C, Cho M. Characteristic two‐dimensional IR spectroscopic features of antiparallel and parallel beta‐sheet polypeptides: Simulation studies. J Chem Phys. 2005;123:084905. [DOI] [PubMed] [Google Scholar]
- 49. Strasfeld DB, Ling YL, Gupta R, Raleigh DP, Zanni MT. Strategies for extracting structural information from 2D IR spectroscopy of amyloid: Application to islet amyloid polypeptide. J Phys Chem B. 2009;113:15679–15691. [DOI] [PMC free article] [PubMed] [Google Scholar]
- 50. Lomont JP, Rich KL, Maj M, Ho J‐J, Ostrander JS, Zanni MT. Spectroscopic signature for stable β‐amyloid fibrils versus β‐sheet‐rich oligomers. J Phys Chem B. 2018;122:144–153. [DOI] [PMC free article] [PubMed] [Google Scholar]
- 51. Woys AM, Almeida AM, Wang L, et al. Parallel β‐sheet vibrational couplings revealed by 2D IR spectroscopy of an isotopically labeled macrocycle: Quantitative benchmark for the interpretation of amyloid and protein infrared spectra. J Am Chem Soc. 2012;134:19118–19128. [DOI] [PMC free article] [PubMed] [Google Scholar]
- 52. Buchanan LE, Carr JK, Fluitt AM, et al. Structural motif of polyglutamine amyloid fibrils discerned with mixed‐isotope infrared spectroscopy. Proc Natl Acad Sci U S A. 2014;111:5796–5801. [DOI] [PMC free article] [PubMed] [Google Scholar]
- 53. Luther BM, Tracy KM, Gerrity M, Brown S, Krummel AT. 2D IR spectroscopy at 100 kHz utilizing a mid‐IR OPCPA laser source. Opt Express. 2016;24:4117–4127. [DOI] [PubMed] [Google Scholar]
- 54. Tracy KM, Barich MV, Carver CL, Luther BM, Krummel AT. High‐throughput two‐dimensional infrared (2D IR) spectroscopy achieved by interfacing microfluidic technology with a high repetition rate 2D IR spectrometer. J Phys Chem Lett. 2016;7:4865–4870. [DOI] [PubMed] [Google Scholar]
- 55. Murphy MP, LeVine H 3rd. Alzheimer's disease and the amyloid‐beta peptide. J Alzheimers Dis. 2010;19:311–323. [DOI] [PMC free article] [PubMed] [Google Scholar]
- 56. Eisenberg D, Jucker M. The amyloid state of proteins in human diseases. Cell. 2012;148:1188–1203. [DOI] [PMC free article] [PubMed] [Google Scholar]
- 57. Jang H, Connelly L, Arce FT, et al. Alzheimer's disease: Which type of amyloid‐preventing drug agents to employ? Phys Chem Chem Phys. 2013;15:8868–8877. [DOI] [PMC free article] [PubMed] [Google Scholar]
- 58. Kagan BL, Jang H, Capone R, et al. Antimicrobial properties of amyloid peptides. Mol Pharm. 2012;9:708–717. [DOI] [PMC free article] [PubMed] [Google Scholar]
- 59. Last NB, Miranker AD. Common mechanism unites membrane poration by amyloid and antimicrobial peptides. Proc Natl Acad Sci U S A. 2013;110:6382–6387. [DOI] [PMC free article] [PubMed] [Google Scholar]
- 60. Guo B, Zhai D, Cabezas E, et al. Humanin peptide suppresses apoptosis by interfering with Bax activation. Nature. 2003;423:456–461. [DOI] [PubMed] [Google Scholar]
- 61. Morris DL, Kastner DW, Johnson S, et al. Humanin induces conformational changes in the apoptosis regulator BAX and sequesters it into fibers, preventing mitochondrial outer‐membrane permeabilization. J Biol Chem. 2019;294:19055–19065. [DOI] [PMC free article] [PubMed] [Google Scholar]
- 62. Akbarzadeh A, Rezaei‐Sadabady R, Davaran S, et al. Liposome: Classification, preparation, and applications. Nanoscale Res Lett. 2013;8:102. [DOI] [PMC free article] [PubMed] [Google Scholar]
- 63. Price DA, Kartje ZJ, Hughes JA, et al. Infrared spectroscopy reveals the preferred motif size and local disorder in parallel stranded DNA G‐quadruplexes. Chembiochem. 2020;21:2792–2804. [DOI] [PubMed] [Google Scholar]
Associated Data
This section collects any data citations, data availability statements, or supplementary materials included in this article.
Supplementary Materials
Appendix S1: Supporting information