

Abstract
Through the successes of checkpoint blockade and adoptive cellular therapy, immunotherapy has become an established treatment modality for cancer. Cellular metabolism has emerged as a critical determinant of the viability and function of both cancer cells and immune cells. In order to sustain prodigious anabolic needs, tumours employ a specialized metabolism that differs from untransformed somatic cells. This metabolism leads to a tumour microenvironment that is commonly acidic, hypoxic and/or depleted of critical nutrients required by immune cells. In this context, tumour metabolism itself is a checkpoint that can limit immune-mediated tumour destruction. Because our understanding of immune cell metabolism and cancer metabolism has grown significantly in the past decade, we are on the cusp of being able to unravel the interaction of cancer cell metabolism and immune metabolism in therapeutically meaningful ways. Although there are metabolic processes that are seemingly fundamental to both cancer and responding immune cells, metabolic heterogeneity and plasticity may serve to distinguish the two. As such, understanding the differential metabolic requirements of the diverse cells that comprise an immune response to cancer offers an opportunity to selectively regulate immune cell function. Such a nuanced evaluation of cancer and immune metabolism can uncover metabolic vulnerabilities and therapeutic windows upon which to intervene for enhanced immunotherapy.
Work over the past several decades has shown that activated immune cells employ many metabolic pathways attributed to cancer cells1-3 (Fig. 1). This convergence of metabolic adaptations creates a fundamental competition for nutrients required by cancer cells and immune cells within the tumour microenvironment (TME). However, we are coming to find fundamental differences between the metabolic programmes of cancer cells and immune cells, as well as between different immune cells. Understanding these differences can reveal specific metabolic vulnerabilities and, consequently, novel targets for therapeutic approaches aimed at metabolic programming in order to enhance cancer immunotherapy.
Fig. 1 ∣. Cancer cell metabolism and derangements in the TME.

Mitochondrial oxidation of nutrients, including glucose, amino acids and fatty acids, through the tricarboxylic acid (TCA) cycle and the electron transport chain (ETC) is a highly efficient means of producing energy for quiescent, differentiated cells. However, during periods of increased proliferation, such as after immune activation or malignant transformation, cells upregulate an alternative pathway for glucose metabolism, called aerobic glycolysis. Although less efficient in generating ATP, aerobic glycolysis allows for more rapid metabolism of glucose, efficient disposal of excess carbon and regeneration of NAD+ while preserving mitochondrial enzymatic activity for anabolic processes242. Glycolytic intermediates are channelled through other essential pathways, such as the pentose phosphate pathway, the one-carbon pathway and the hexosamine biosynthesis pathway. These pathways support cellular processes that are critical for highly proliferative cells, such as synthesis of fatty acids and nucleic acids. Pathways for the metabolism of glutamine are also upregulated in the setting of increased proliferation72. In addition to supplying the TCA cycle with carbon skeletons that maintain intermediates for biosynthesis of amino acids, nucleic acids and fatty acids (a process known as anaplerosis), glutamine is the primary source of nitrogen used for amino acid and nucleic acid synthesis. These cells also upregulate a broad range of amino acid transporters and maintain tightly controlled redox balance, primarily through NADPH synthesis. Many cells within the tumour microenvironment (TME) express ectoenzymes, such as indoleamine 2,3-dioxygenase (IDO), arginase 1 (ARG1) and CD73, which deplete nutrients, as well as increase immunosuppressive metabolites, such as kynurenine and adenosine. Along with a deranged microvasculature, these metabolic adaptations can have profound effects on the metabolic make-up of the TME, leading to depletion of vital nutrients, hypoxia, acidosis and the generation of immune-toxic metabolites as shown. MDSC, myeloid-derived suppressor cell; R-2-HG, (R)-2-hydroxyglutarate; ROS, reactive oxygen species; Teff, effector T; Treg, regulatory T.
Although the ability of cancer cells and tumour tissue to upregulate glycolytic catabolism of glucose to form lactate, even in oxygen-replete conditions (aerobic glycolysis), a process known as the ‘Warburg effect’, has been considered a hallmark of malignancy, it has become increasingly clear that cancer metabolism is heterogeneous, and that cancer cells can engage in a broad range of metabolic programmes to meet the demands of growth and proliferation, and that in addition to aerobic glycolysis, mitochondrial respiration is fundamentally important in this regard4-7. Predictably, highly metabolically active cancer cells (Fig. 1) impart profound effects on the TME, leading to nutrient depletion, hypoxia, acidity and the generation of metabolites that can be toxic at certain concentrations. A significant amount of glucose from the TME is metabolized through aerobic glycolysis, generating high amounts of lactate and H+, thereby lowering the intratumoural pH. That said, it is likely that the balance between lactate-generating glycolysis and oxidative phosphorylation (OXPHOS) is dependent on the degree of hypoxia, which can be both heterogeneous and wide ranging within the TME. It is instructive to note that in moderately hypoxic regions, CO2 derived from mitochondrial respiration is hydrated by extracellular carbonic anhydrase enzymes, forming HCO3− and H+. Thus, oxidative metabolism can be a significant and often overlooked source of extracellular acidification within the TME.
Given the recent establishment of cancer immunotherapy, including the use of blocking antibodies against immune checkpoint pathways and adoptive cell therapy with chimeric antigen receptor T cells (CAR T cells), several recent studies have begun to establish the relationship of tumour-intrinsic metabolism to successful immunotherapy. For instance, it has been reported that increased glycolytic metabolism in melanoma cells is associated with resistance to adoptive T cell therapy and checkpoint blockade8,9. Other studies have shown that signalling through immune checkpoint proteins on tumour cells, including PD1 and B7-H3, was responsible for increased glucose depletion within the TME10-12. Interestingly, some immunosuppressive checkpoint pathways are actually induced as a direct consequence of tumour acidification13. Further, immune checkpoint blockade can dampen glycolysis of tumour cells, restore glucose in the TME and permit T cell glycolysis and cytokine production14. Several recent studies have demonstrated that targeting specific aspects of tumour-intrinsic metabolism, such as the hexosamine biosynthesis pathway (HBP) or glutamine metabolism, could foster an immune response and sensitize tumours to checkpoint blockade15,16.
Because of the emergence of immunotherapy as a pillar of oncologic therapy, it is increasingly vital to understand as much as possible about the metabolic interdependence of infiltrating immune cells and cancer. This Review aims to discuss the following fundamental questions: which metabolic programmes are critical for the function of specific cell subsets involved in the immune response to cancer; how these metabolic programmes might be perturbed within the TME; the implications of metabolic derangements in the TME for current immunotherapeutic paradigms; and how metabolic interventions might be leveraged to enhance the antitumour immune response.
The TME and immune contexture
Highly active metabolic pathways that are characteristic of cancer cells (Fig. 1) can create profound changes in the composition of nutrients and other small molecules within the TME. This can have critical effects on the immune response. The high metabolic activity of cancer cells and disorganized vasculature within the TME can contribute to a nutrient-depleted and hypoxic microenvironment, establishing metabolic competition between cancer cells and infiltrating immune cells14,17,18. Indeed, the glucose uptake and effector function of antitumour CD4+ T cells has been shown to be inversely proportional to glycolytic activity of cancer cells in mouse models18, and glucose availability in the TME allows for improved cytokine expression from antitumour CD8+ T cells14. Furthermore, transcriptomic analyses of patients with melanoma from The Cancer Genome Atlas revealed that effector T (Teff) cell genes, such as CD40lg and IFNG, are inversely correlated with HK2 expression, which encodes the rate-limiting enzyme in the glycolytic pathway18. Metabolic programmes active within cells of the TME can also lead to the generation of toxic concentrations of certain metabolites. Elevated levels of adenosine, kynurenine, ornithine, reactive oxygen species (ROS) and potassium, as well as increased acidosis, have all been reported in the TME, and each can have profound effects in suppressing the antitumour immune response.
The immune contexture of the TME comprises a range of distinct cell types19 (TAbLe 1). Effector cells perform functions aimed at cell killing and can arise from either the innate (non-specific) or adaptive (antigen-specific) arms of the immune system. Antitumour effector cells arising from the adaptive system include CD4+ and CD8+ Teff cells, which orchestrate and carry out antigen-specific killing of cancer cells, respectively. CD8+ Teff cells are critically important in direct tumour cell killing through the induction of apoptosis and cytokine secretion. CD4+ T cells comprise numerous subsets. Some of these subsets, the most well studied of which is the T helper 1 (TH1) subset, can also provide significant antitumour activity. These antitumour CD4+ T cells, collectively termed conventional CD4+ (CD4+con)v T cells, are distinct from immunosuppressive, pro-tumorigenic CD4+ T cells known as regulatory T (Treg) cells. Although cells may engage in direct tumour cell killing, they primarily contribute to antitumour immunity through cytokine secretion and assisting in CD8+ T cell activation. Antitumour CD4+ conv T cells share significant metabolic characteristics with CD8+Teff cells. Although less well understood in terms of antitumour immunity, B cells may also perform effector roles in the TME20. Importantly, as part of the adaptive immune system, T cells and B cells can give rise to memory cell populations, which can persist long after the resolution of an infection or tumour response. CD8+ memory T (Tmem) cells are a crucial aspect of long-term tumour control. Innate cells, such as natural killer (NK) cells and inflammatory macrophages, perform critical antitumour effector functions as well. There are also immunosuppressive cell populations within the TME, including CD4+FOXP3+Treg cells, myeloid-derived suppressor cells (MDSCs), anti-inflammatory macrophages and some B cell populations20. Through various mechanisms, including cytokine secretion and metabolic derangements, these cells can dampen or eliminate the effectiveness of antitumour effector cell populations. Lastly, antigen-presenting cells, such as intratumoural dendritic cells (DCs), have been shown to perform essential roles in maintaining active adaptive immune response within the TME21,22. Numerous excellent reviews can be referred to for more detailed discussions of tumour immunology and immunotherapy19,23-25.
Table 1 ∣.
Functional and metabolic phenotypes of immune cells within the TME
| Cell type | Function | Metabolic phenotype |
|---|---|---|
| Immune activation or inflammatory | ||
NK cell
|
MHC-independent cytotoxicity: Perforin, granzymes FASL, TRAIL IFNγ, TNF |
Glycolysis and OXPHOS |
Inflammatory TAM
|
MHC-independent cytotoxicity: TNF, IL-1β Oxidative burst Antigen presentation |
Glycolysis and PPP |
DC
|
DAMP processing Teff cell activation Antigen presentation |
Glycolysis |
Teffcell
|
Antigen-specific cytotoxicity: Perforin, granzymes FASL IFNγ, TNF |
Highly glycolytic and OXPHOS Amino acid metabolism (arginine, tryptophan, serine, leucine, glutamine, cysteine) PPP |
Tmem Cell
|
Maintain long-lived response | OXPHOS |
| Immunosuppression | ||
MDSC
|
IL-10, TGFβ Amino acid depletion Polyamines, kynurenine |
Glycolysis and OXPHOS |
Immunosuppressive TAM
|
IL-10 Amino acid depletion Polyamines, kynurenine VEGF |
OXPHOS, HBP |
Tregcell
|
IL-2 sequestration: Dampen APC co-stimulation IL-10, TGFβ Adenosine |
OXPHOS |
APC, antigen-presenting cell; DAMP, damage-associated molecular pattern; DC, dendritic cell; FASL, fas ligand; HBP, hexosamine biosynthesis pathway; IFNγ, interferon-γ; MDSC, myeloid-derived suppressor cell; MHC, major histocompatibility complex; NK, natural killer; OXPHOS, oxidative phosphorylation; PPP, pentose phosphate pathway; TAM, tumour-associated macrophage; TGFβ, transforming growth factor-β; Teff, effector T; TME, tumour microenvironment; Tmem, memory T; TNF, tumour necrosis factor; TRAIL, TNF-related apoptosis-inducing ligand; Treg, regulatory T; VEGF, vascular endothelial growth factor.
The metabolism of the antitumour response
Glucose metabolism of antitumour effector T cells.
CD4+conv and CD8+ Teff cells form the critical effector compartment of the antitumour response. When naive CD4+ and CD8+ T cells, which are non-proliferative, recognize their cognate antigen in the context of co-stimulatory signalling, they become proliferative and enact metabolic features to support immense growth26-28. Although many early investigations highlighted the upregulation of aerobic glycolysis as a hallmark of T cell activation, it is now clear that upregulated tricarboxylic acid (TCA) cycle metabolism and OXPHOS are also a critical aspect of CD4+conv and CD8+ T cell activation. Although TCA cycle metabolism is upregulated within 24 h post activation, upregulated aerobic glycolysis appears to be a more rapid event, occurring within 6 h after activation27-32.
The transcriptional activity of MYC and hypoxia inducible factor 1 (HIF-1) are both upregulated in response to T cell activation and promote metabolic reprogramming26,29,33,34. Notably, although HIF-1 is well known to regulate metabolism in response to hypoxia, its activity is also induced in response to T cell activation in the absence of hypoxia. MYC and HIF-1 transcriptional activity leads to upregulation of genes encoding enzymes that promote glycolysis, such as pyruvate kinase (PKM1), hexokinase 2 (HK2) and GLUT1 (ReFS29,34,35). Pathways emanating from proximal metabolites in the glycolytic pathway are also integral components of T cell activation and function (Fig. 1). The pentose phosphate pathway (PPP) metabolizes glucose-6-phosphate to generate NADPH and ribose-5-phosphate36. Glucose shuttling into the PPP is significantly increased upon CD4+ T cell activation29. The PPP is the primary cellular source for NADPH, which is required for fatty acid and plasma membrane synthesis in newly activated CD8+ T cells37. NADPH is also critical for REDOX homeostasis in proliferating manunalian cells38-40. ROS levels in activated T cells need to be finely regulated. Although dysregulated ROS levels can be toxic39,41,42, ROS play an important role in Teff cell activation, having been shown to promote nuclear factor of activated T cells (NFAT)-dependent IL-2 expression in CD4+ and CD8+ T cells. Another pathway originating from early glycolytic reactions, the HBP, is the primary cellular source of glycosylation substrates, which mediate a variety of effects on a broad range of proteins, including stability, trafficking and function. The HBP relies on metabolism of glucose and glutamine and is responsive to their availability. The main substrate produced by the HBP, UDP-GlcNAc, is critical for effector CD4+ and CD8+ T cell expansion and function43. Lastly, the serine–glycine–one-carbon pathway allows cells the ability to generate serine, glycine, NADPH and one-carbon units for use in the folate cycle. Teff cell proliferation and function were dependent on sufficient serine metabolism in vitro and in vivo44 (Fig. 1).
Glucose carbons that are not metabolized to lactate or by proximal glycolytic pathways contribute significantly to the TCA cycle in Teff cells6 (Fig. 1). In highly proliferative cells, intermediates of the TCA cycle are rapidly consumed to serve as building blocks for a broad range of biomolecular syntheses, a process called cataplerosis45. For example, citrate can be exported to the cytoplasm to regenerate acetyl-CoA for use in lipid and cholesterol synthesis, both of which are critical for producing membranes in proliferative Teff cells. Other TCA cycle intermediates function as building blocks for biosynthesis of, for example, nucleotides and amino acids, which are in high demand during proliferation. Like cancer cells, Teff cells are highly proliferative and upregulate specific glycolytic programmes, including aerobic glycolysis, PPP, HBP and TCA cycle support, to allow massive cell division and effector functions.
T cells and glucose restriction in the TME.
Glucose limitation within the TME can markedly affect the T cell response. For example, low-glucose conditions (0.1 mM) suppressed the generation of the glycolytic intermediate phosphoenolpyruvate (PEP) in T cells, which disrupted calcium-dependent NFAT signalling in vitro18. Compared with control, decreasing the glucose concentration in growth media has been shown to suppress the extracellular acidification rate (a measure of aerobic glycolysis), augment the oxygen consumption rate (a measure of OXPHOS), attenuate mTOR signalling and suppress the effector function of both CD4+ and CD8+ Teff cells46-48. Reduced mTOR complex 1 (mTORC1) signalling interfered with Teff cell differentiation and, in the case of CD4+ T cells, specifically favoured the development of immunosuppressive, pro-tumorigenic Treg cells49. Interestingly, in CD8+ T cells, mTOR blockade with rapamycin favoured differentiation of long-lived Tmem cells, which may play an important role in sustaining antitumour responses49-51. Decreasing glucose availability in culture suppressed production of the critical effector molecules interferon-γ (INFγ), IL-17 and granzyme B in Teff cells compared with control growth media47,48,52,53. In activated CD4+ T cells cultured in glucose-free media containing the alternative sugar fuel galactose (which suppresses aerobic glycolysis), the glycolytic enzyme GAPDH assumed a moonlighting role, binding the 3′ untranslated region of Ifng mRNA and suppressing its translation and Teff cell function31. Glucose restriction in media conditioned by primary ovarian cancer cells led to microRNA-mediated suppression of the histone methylase EZH2 (enhancer of zeste homologue 2), leading to decreased NOTCH signalling, suppressed cytokine production and decreased viability of Teff cells54.
Increasing the glycolytic capacity of mouse sarcoma cells through either pharmacologic treatment with the AKT activator 4-hydroxytamoxifen in co-culture experiments or overexpression of key glycolytic enzymes (for example, Glut1, Hk2 and Pdk1) in tumour cells followed by injection into mice led to suppression of CD8+ T cell effector function compared with vehicle-treated tumour cells or empty vector overexpression, respectively14. Similarly, compared with wild-type tumours, implanted Hk2- overexpressing melanoma cells suppressed CD4+ T cell antitumour effector function and in vivo responses in mouse models18. Furthermore, expression of glycolysis-related genes in tumour samples from patients with melanoma and non-small-cell lung cancer was inversely correlated to T cell infiltration8. Tipping the metabolic balance can also be accomplished through directly manipulating T cell metabolism. For example, overexpression of the glycolytic enzyme PEP carboxykinase in tumour-specific CD4+ T cells improved antitumour responses compared with control vector-transfected T cells in an adoptive T cell model using melanoma-specific T cells18.
Mitochondrial respiration is also a critical aspect of Teff cell metabolism. Several recent studies have reported that T cells in patients with cancer (compared with healthy controls) and tumour-infiltrating CD8+ T cells in tumour-bearing mice (compared with non-infiltrating CD8+ T cells) displayed decreased mitochondrial mass as well as indicators of mitochondrial dysfunction55-57. Mitochondrial fitness of resting peripheral CD8+ T cells was impaired in patients with chronic lymphocytic leukaemia compared with healthy controls55. Furthermore, the degree of response in these patients to CAR T cell therapy was negatively correlated to the degree of mitochondrial impairment of infused CAR T cells55. Tumour-infiltrating CD8+ T cells from patients with renal cell carcinoma showed dysregulated mitochondrial dynamics and function, including elevated levels of mitochondrial ROS and hyperpolarization, compared with CD8+ T cells from healthy donors56. Normal ex vivo activation of these T cells could be rescued with mitochondrial ROS scavengers or pyruvate supplementation. Mitochondrial biogenesis and function are particularly deranged in a subset of dysfunctional tumour-infiltrating CD8+ T cells termed exhausted T cells (box 1). As a whole, these studies demonstrate that cancer itself can lead to derangements in the metabolism of Teff cells, including mitochondrial dynamics, and that a reciprocal relationship exists between the degree of glycolytic activity of cancer cells and the antitumour effector function of infiltrating T cells.
Box 1 ∣. Metabolism of T cell exhaustion.
CD8+ T cells in the tumour microenvironment (TME) can adopt a state of functional exhaustion wherein they are poorly proliferative and unable to generate sufficient cytotoxicity against target cancer cells. A similar cell subset exists during chronic viral infections, such as lymphocytic choriomeningitis virus (LCMV) clone 13 in mice or hepatitis C virus in humans243. There are numerous metabolic features that are emerging as characteristic of this set of immune cells, termed CD8+ exhausted T cells. Some of the metabolic characteristics appear to be a consequence of co-inhibitory signalling, such as PD1, which is highly characteristic of CD8+ exhausted T cells. In a chronic LCMV mouse model, PD1 signalling inhibited the expression of peroxisome proliferator-activated receptor-γ co-activator 1α (PGC1α), which disrupted mitochondrial and effector function and led to significantly less oxidative capacity compared with T cells responding to an acute LCMV infection244. Overexpression of PGC1α in adoptively transferred T cells improved mitochondrial function and restored T cell function. T cells infiltrating tumours showed similar mitochondrial dysfunction and loss of oxidative capacity secondary to inhibited PGC1α activity57. Interestingly, antitumour T cells also regained function through overexpression of PGC1α, implying that the activity of a metabolic programme can, in and of itself, overcome functional T cell exhaustion. PD1 signalling also suppressed mTOR complex 1 (mTORC1) signalling and glycolytic activity in infiltrating CD8+ T cells in a progressive mouse tumour model14. Given the dependence of T cell function (and loss of function) on metabolic programming, more studies are needed to assess the determinants of metabolic dysfunction and associated T cell exhaustion within the TME.
Amino acids and the antitumour T cell response.
Like cancer cells, highly proliferative immune cells, such as activated T cells, are reliant on amino acid metabolism to support protein and nucleotide synthesis. As such, amino acid transporters, including SLC7A5 (also known as LAT1)58, SLC38A1 (also known as SNAT1), SLC38A2 (also known as SNAT2)59 and SLC1A5 (also known as ASCT2)60, have been found to be highly upregulated during T cell activation compared with naive cells in in vitro human and mouse studies61. Essential amino acids must be obtained exogenously. For example, leucine was required for mTORC1 signalling, effector function and proper differentiation in effector CD8+ and CD4+ cells. Interestingly, deletion of the leucine transporter, Slc7a5, in mouse models caused metabolic failure during in vitro activation and cytokine-directed differentiation of CD4+ (TH1, IL-17-producing TH17) and CD8+ Teff cells, but had no adverse effect on the differentiation of Treg cells26,62. Activated T cells also rapidly metabolize arginine, and exogenous arginine supplementation leads to improved T cell fitness and increased generation of central Tmem cells63. Serine, tryptophan and cysteine are also vital nutrients for T cell responses and, as such, are important mediators of antitumour immune responses44,64-66. Tryptophan is an essential amino acid and its availability within the TME is an important factor in determining strength and quality of the T cell response. Human T cell proliferation and activation were strongly suppressed in tryptophan-free media compared with normal growth media66,67. Cancer cells, tumour-associated macrophages (TAMs), MDSCs, suppressive DCs and cancer-associated fibroblasts can deplete tryptophan levels through enzymatic activity of indoleamine 2,3-dioxygenase (IDO)68, which can be expressed at high levels in these cells within the TME. Underlining the importance of this metabolic pathway for tumour growth, IDO expression has been correlated with poor outcomes in patients with several cancer types, including gastric cancer, colorectal cancer, non-small-cell lung cancer and melanoma69-71.
In proliferating cells, glutamine provides nitrogen for amino acid and nucleic acid synthesis and carbon to replenish TCA cycle intermediates that are syphoned off as building blocks for biosynthesis — a process called anaplerosis (Fig. 1). Cancer cells and some activated immune cells, such as T cells and macrophages, are generally highly glutamine avid59,72. The expression of glutamine transporters SLC1A5 and SLC38A1 and/or SLC38A2 was significantly upregulated during in vitro stimulation of murine CD4+conv T cells60. Driven by MYC, glutamine is metabolized by glutaminase (GLS) to glutamate, which may enter the TCA cycle after conversion by glutamate dehydrogenase (GLUD1) to α-ketoglutarate (αKG; also known as 2-oxoglutarate). αKG is subsequently metabolized to succinate and fumarate in the TCA cycle29. Interestingly, in settings of glutamine restriction, some cancer cell lines switch to glucose-fuelled anaplerosis, wherein pyruvate is converted by pyruvate carboxylase to oxaloacetate, which enters the TCA cycle73. Our group has recently shown that effector CD8+ T cells are also capable of upregulating pyruvate carboxylase activity under conditions of glutamine blockade in vitro16.
Although effector function and proliferation in differentiated CD8+ Teff cells was suppressed by limiting glutamine in media59, if glutamine availability was restricted during activation of CD8+ T cells, it altered differentiation towards a long-lived, memory phenotype74. This effect on differentiation was shown to be mediated by αKG. αKG and other TCA metabolites, such as succinate and fumarate, can modulate the activity of a wide range of cellular processes, including epigenetic remodelling and the stability of critical transcription factors, such as HIF-1α (ReFS45,75).
Lipid metabolism and T cells.
Activated T cells also reprogramme lipid metabolism, upregulating de novo lipid synthesis and cholesterol uptake, which are critical for membrane synthesis and mediated by the transcription factors sterol regulatory element-binding protein 1 (SREBP1) and SREBP2, respectively37,76. Proliferation, metabolic reprogramming and antiviral activity were dramatically suppressed in activated mouse CD8+ T cells lacking SREBP1 and SREBP2 functionality. In addition, the cholesterol content in membranes during CD8+ T cell activation and expansion in vitro was, in part, regulated by cholesterol esterification enzyme acetyl-CoA acetyltransferase (ACAT1). Acat1 knockout CD8+ T cells showed increased membrane cholesterol and improved T cell receptor clustering and signalling, leading to enhanced proliferation, function and improved tumour killing in adoptive-transfer mouse tumour models76. Pharmacologic inhibition of ACAT1 with avasimide improved the antitumour effect in mice compared with vehicle-treated control animals. Cholesterol metabolism and antitumour T cell function is an evolving story, however. A recent study by Ma et al. demonstrated that a high cholesterol content in tumours can induce T cell dysfunction by activating the endo-plasmic reticulum stress response77. As such, although cholesterol is important for Teff cell proliferation and metabolism, the benefit of targeting specific aspects of cholesterol metabolism to improve the antitumour immune response needs further study.
The metabolism of immunologic memory.
Unlike Teff cells, CD8+ Tmem cells preferentially rely on OXPEIOS78-81. Compared with CD8+ Teff cells, enhanced spare respiratory capacity, a parameter indicative of the ability of cells to upregulate OXPEIOS, is also highly characteristic of Tmem cells78. Initial studies using etomoxir as an inhibitor of carnitine palmitoyl transferase 1A (CPT1A), a mitochondrial transporter responsible for the import of long-chain fatty acids destined for fatty acid β-oxidation (FAO), implicated FAO as the primary fuel for OXPEIOS in Tmem cells. However, more recent work using T cell-specific Cpt1a knockout models has called this into question and demonstrated that off-target effects of high-dose etomoxir (200 μM) are likely responsible for the earlier findings82. This should not be taken to imply that Tmem cells do not use FAO in support of OXPHOS and spare respiratory capacity but, rather, that FAO is not the sole pathway responsible for this metabolic phenotype. Indeed, the expression of CPT1A is consistently upregulated in CD8+ Tmem cells compared with Teff cells. Furthermore, a CD8+T cell subset known as tissue-resident memory cells were specifically dependent on fatty acid binding protein 4 (FABP4) and FABP5 to import extracellular fatty acids for FAO and for maintenance of a long-term memory phenotype83.
Intermediates of the TCA cycle, such as αKG, succinate and fumarate, are particularly important in adaptive memory. Inhibition of 2-oxoglutarate-dependent dioxygenases (2OGDD) through alterations in these TCA metabolites has been shown to increase memory cell differentiation in CD8+ T cells84,85. Although glucose, glutamine and fatty acids are the primary nutrient sources fuelling the TCA cycle, a range of other nutrients, such as amino acids and acetate, can also enter the cycle. In particular, acetate metabolism is emerging as an important source of acetyl-CoA in CD8+ T cells and some cancer types16,86-88. In the mitochondria, acetate can enter the TCA cycle after it is metabolized by acyl-CoA synthetase short chain family member 1 (ACSS1) to form acetyl-CoA. Alternatively, acetate can be converted to acetyl-CoA by ACSS2 in the cytoplasm, where it can contribute to fatty acid synthesis and acetylation reactions important in epigenetic reprogramming and post-translational modifications. The metabolism of acetate is an important metabolic pathway for promoting the function of memory CD8+T cells88. Interestingly, blockade of glutamine metabolism during T cell activation increased Tmemcell differentiation and induced acetate metabolism and associated enzymes, including ACSS1 and ACSS216,85. As quiescent cells, Tmem cells preferentially rely on OXPHOS relative to aerobic glycolysis and have significant mitochondrial reserve that is required to upregulate OXPHOS further upon antigen activation. Tmem cells can adapt several distinct nutrient sources to fuel this metabolic programme.
Hypoxia and the antitmnour T cell response.
Although tumours are highly heterogeneous, high levels of metabolic activity and associated oxygen consumption, as well as disorganized, poorly functioning vasculature, can generate hypoxic regions with median oxygen saturation levels <2 % (compared with a median of about 5% in normal tissues)89,90. The effect of hypoxia on Teff cells is not straightforward. Complicating this area of study is the fact that HIF-1 transcriptional activity is upregulated in response to T cell activation in normoxic conditions34, so it is challenging to understand the effect of hypoxia on further augmenting HIF-1 activity while also evaluating HIF-1-independent effects. Early in vitro studies of CD8+ Teff cell activation, differentiation and function showed that whereas proliferation and the expression of some cytokines were suppressed in hypoxia, the lytic capacity, activation markers and survival were improved91. Subsequent in vivo studies showed that CD4+ and CD8+ splenic T cells were more poorly activated after concanavalin A challenge in mice exposed to subatmospheric O2 tension (8%) compared with mice exposed to ambient O2 tension (20%)92. Other studies showed that in vitro hypoxic exposure causes intracellular accumulation of the metabolite (S)-2-hydroxyglutarate (S-2-HG), which profoundly alters CD8+ T cell activation and differentiation, suppressing cytokine secretion and cytolytic capacity, but, interestingly, augmenting proliferation, long-term survival and antitumour response after in vivo transfer in mouse models84. Contrary to previous findings demonstrating the necessity of oxidative metabolism and oxidative metabolic capacity in forming long-lived memory CD8+ T cells, glycolytic activity enforced through constitutive HIF-1α activity (achieved through conditional knockout of the HIF-1 regulator Vhl) actually favoured the formation of long-lived effector memory cells in mouse vaccine models93. Other work has demonstrated that hypoxia induced the expression of the ectonucleotidases CD39 and CD73 on various cells in the TME94,95. These enzymes break down ATP in the TME to adenosine. Adenosine is a ligand for the A2A and A2B purinergic receptors, which are expressed on a large range of immune cells, and is broadly immunosuppressive, inhibiting effector cell function and proliferation of Teff cells96-101. Interestingly, supplemental oxygen enhanced the antitumour immune response of T cells in mice by downregulating the adenosine signalling pathway102. The effect of hypoxia on antitumour T cells is an evolving area of study. Further research will clearly benefit the field of immunotherapy, given both the prevalence of hypoxic regions in tumours as well as the profound effects hypoxia can have on the adaptive immune response.
Toxic metabolites.
In addition to adenosine, many other products generated from cancer cell metabolism influence infiltrating T cells (Figs 1 and 2). Elevated levels of extracellular lactate and H+ in the TME can suppress T cell proliferation, survival, cytotoxicity and cytokine production in in vitro studies of mouse and human CD8+ T cells103,104. The upregulation of the gene encoding the key Teff cell transcription factor NFAT was impaired during in vitro activation of mouse CD8+ T cells in the presence of high levels of lactate and H+ compared with standard growth media104. In vivo mouse studies showed that mouse melanoma cells that have Ldha knocked down produced less lactate and were more responsive to immune-mediated tumour rejection than empty vector-transfected control melanoma cells104. MAP kinase signalling was also severely impaired in human effector CD8+ T cells activated in the presence of elevated lactate and H+ compared with control media105.
Fig. 2 ∣. Metabolic derangements in the TME inhibit T cell function.

The metabolic milieu of the tumour microenvironment (TME) is a reflection of cancer metabolic programmes. Nutrient deprivation, hypoxia and toxic metabolites are conditions within the TME that confront and influence T cell metabolism and function. The consequences of TME conditions on immune cell responses can be predicted based on a growing literature of preclinical, translational and clinical studies. AMPK, AMP kinase; EZH2, enhancer of zeste homologue 2; Granz B, granzyme B; IFNγ, interferon-γ; MDSC, myeloid-derived suppressor cell; miRNA, microRNA; NFAT, nuclear factor of activated T cells; PKA, protein kinase A; R-2-HG, (R)-2-hydroxyglutarate; TCR, T cell receptor; Teff, effector T; TH1, T helper 1; Tmem, memory T;Treg, regulatory T;Tscm, stem cell memory T; TNF, tumour necrosis factor.
The accumulation of specific amino acids within tumours can also suppress the Teff cell response. Probably the most well studied in this regard are the effects of tryptophan metabolites, especially kynurenine, which is generated through the activity of IDO1 106. Functioning as an endogenous ligand for aryl hydrocarbon receptors on T cells, kynurenine caused upregulation of the PD1 co-inhibitory pathway on activated CD8+ T cells in vitro compared with vehicle-treated control107. This upregulation of PD1 was also observed on tumour-infiltrating CD8+ T cells in mouse models treated with exogenous kynurenine compared with vehicle-treated controls. Tumour-infiltrating CD8+ T cells from kynurenine treated tumour-bearing mice produced less IFNγ and TNF.
Cancer cells have also been reported to suppress T cell activity through release of the oncometabolite (R)-2-hydroxyglutarate (R-2-HG). This metabolite can inhibit epigenetic dioxygenase enzymes, such as histone demethylases, leading to increased methylation and modified transcription. R-2-HG produced by isocitrate dehydrogenase (IDH)-mutant human glioma was taken up by T cells in in vitro studies. R-2-HG interfered with proliferation, T cell receptor signalling, NFAT activity and polyamine biosynthesis in activated human CD4+ and CD8+ T cells in vitro108. This was corroborated by the finding that R-2-HG released into the TME in IDH-mutant glioma-bearing mice inhibited complement-mediated antitumour response as well as T cell migration, proliferation and cytokine secretion109. These studies highlight the intricate interplay of cancer metabolites and immune function within the TME (Fig. 2).
High levels of necrosis lead to increased levels of potassium within the TME, which limits T cell effector function110. Mediated by reduced cytoplasmic levels of acetyl-CoA, this state induced epigenetic remodelling of activated T cells, inducing a dysfunctional state of Teff cells within the TME111. However, this dysfunctional state was enriched with characteristics of T cell stemness. In accord with the induction of a stem-like state, ex vivo stimulation and expansion of Teff cells in high potassium produced T cells with improved in vivo persistence, multipotency and capacity for tumour clearance111. The generation of T cell-suppressive metabolites through tumour necrosis and metabolic activity intrinsic to the TME forms an important mechanism of tumour immune evasion.
Metabolism and the innate effector response.
Because NK cells are particularly adept at cell killing during major histocompatibility complex class I (MHC-I) down-regulation, a common evasion strategy of cancer cells, they form a critical effector component of tire innate response. Metabolically, aerobic glycolysis and OXPHOS were upregulated after in vitro cytokine stimulation (IL-12 and IL-15) of NK cells112. Interestingly, SREBP transcription factors were required for these cytokine-induced metabolic changes during in vitro NK cell stimulation113. Pharmacologic inhibition of SREBP activity suppressed metabolic reprogramming, cytokine production and cytotoxicity in vitro and curtailed anti-tumour response in an adoptive NK cell mouse model. Interestingly, it has been reported that endogenous SREBP inhibitors, such as 27-hydroxycholesterol, can be increased within the TME and thus may be a mechanism of NK cell suppression112,114-118. Lung cancer progression in mice and tumour-associated transforming growth factor-β (TGFβ) are correlated with increased fructose-1,6-bisphosphatase (FBP1) expression in tumour-associated NK cells119. FBP1 is a key enzyme in gluconeogenesis, which, when activated, strongly suppressed glycolysis in NK cells, leading to dysfunction and diminished viability. Interestingly, pharmacologic inhibition of FBP1 was sufficient to re-establish glycolytic metabolism, as well as cytokine production and cytotoxicity in vitro, and improve antitumour response in adoptive cell therapy mouse models119. These studies showed that rescuing NK function through FBP1 inhibition was dependent on restoration of glucose metabolism, as blocking glucose metabolism with 2-deoxyglucose (2-DG) prevented the rescue caused by FBP1 inhibition. 2-DG by itself also led to NK cell dysfunction119, implying that inhibition of glucose metabolism could have profound effects on NK cell antitumour response. Other metabolic derangements within the TME are likely to affect NK cell function as well. For instance, low arginine levels can impair NK cell proliferation and IFNγ production120,121, and hypoxia can suppress cytolytic activity122-124. Human NK cell-activating receptors, such as NKp46 and NKp30, are suppressed in response to hypoxia or low arginine in in vitro studies121,124. High lactate levels and associated low pH, as in the TME, also suppressed NK cell cytotoxicity, cytokine production and NFAT signalling in in vitro studies104,125,126. Lastly, elevated adenosine levels within the TME can strongly suppress NK cell effector function and proliferation127.
Other innate cells, macrophages and DCs also enact specific metabolic programmes upon activation. Although early in vitro work using activation schemes with specific cytokines classified macrophages into inflammatory (M1) or immunosuppressive (M2) phenotypes, there is poor evidence that these polarized phenotypes play distinct roles in vivo128,129. More recent work has uncovered a spectrum of macrophage phenotypes characterized by distinct transcriptional states130. That said, macrophages with inflammatory characteristics can play an important role in antitumour immunity19, and in this regard it is instructive to examine what has been established regarding the metabolic programming of in vitro derived ‘M1’ macrophages. Glucose metabolism is a vital aspect of the inflammatory phenotype in macrophages. Upon activation, for example by a Toll-like receptor agonist, these cells showed increased expression of glycolytic genes, high levels of glucose uptake, increased lactate production and upregulated glutamine anaplerosis131. This metabolic reprogramming led to increased succinate levels, which increased expression of the inflammatory cytokine IL-1β by stabilizing HIF-1 (ReF.132). Inflammatory macrophages are also particularly reliant on the PPP for the generation of NADPH, with 13C-glucose tracing studies confirming increased routing of glucose though this pathway upon activating inflammatory phenotypes in culture133,134. NADPH is necessary to produce high levels of ROS as part of an oxidative burst, a key effector mechanism for these cells132,135,136. Arginine is also a critical nutrient in the function of pro-inflammatory ‘M1’ macrophages as they express high levels of inducible nitric oxide synthase (iNOS) compared with alternatively activated or ‘M2’ polarized macrophages in in vitro studies137. iNOS requires arginine to generate cytotoxic nitric oxide, an important pro-inflammatory mediator of antitumour response138,139.
Specific nutrient deficits within the TME, particularly glucose and arginine, can severely limit the metabolism and related elaboration of effector programmes in these cells. Glucose limitation not only suppresses glycolysis as a whole but can curtail PPP activity and TCA cycle function, thus limiting the generation of NADPH, ROS and succinate, all of which can severely limit M1 macrophage function. Supporting this idea, the secretion of pro-inflammatory cytokines by macrophages was significantly reduced by glycolysis inhibition with 2-DG140.
DCs are an important class of antigen-presenting cells involved in the antitumour response. Intratumoural DCs that are capable of antigen cross-presentation have specifically emerged as a vital component of this response22. Upon activation, DCs undergo maturation allowing antigen processing and presentation to T cells. This response was coupled to a metabolic switch from OXPHOS to aerobic glycolysis, mediated by HIF-1α in response to in vitro LPS activation141, and by the PI3K–AKT pathway in response to Toll-like receptor stimulation in vitro142. This switch to glycolysis and away from OXPHOS during DC activation is critical for DC survival, production of stimulatory cytokines and activation of T cells142. Interestingly, pharmacologic activation of AMPK, which promotes mitochondrial biogenesis and oxidative respiration143, was sufficient to block DC maturation in vitro142. Given this critical dependence on aerobic glycolysis, glucose competition in the TME may significantly suppress DC activation and viability and thus limit the ability of DCs to foster an effective and persistent T cell response.
The metabolism of cancer immune evasion
Metabolism of adaptive immune suppression.
Immunosuppressive Treg cells preferentially rely on TCA cycle function and mitochondrial respiration144,145. Although initial studies demonstrating the dependence of Treg cells on FAO did not account for off-target effects of etomoxir, other studies have shown that FAO does support OXPHOS in Treg cells, although not as the sole pathway82,146,147. In contrast to Teff cells, Treg cells showed decreased glucose uptake and expressed lower levels of GLUT1 in vitro144. Interestingly, although glycolysis did not appear to play a crucial role in Treg cell differentiation or a long-lived phenotype, our laboratory has reported that a subset of highly active Treg cells, termed effector Treg cells, relied on the upregulation of glycolysis for optimal function148. As such, Treg cells appear to be metabolically flexible, which may allow them to thrive within relatively harsh and heterogeneous conditions, such as the TME. To this end, it has been reported that the Treg cell-defining transcription factor, FOXP3, reprogrammes cellular metabolism through suppression of MYC favouring OXPHOS and NAD(H) oxidation149. In conditions of low glucose and high lactate, such as found in the TME, these adaptations allow for a metabolic advantage of these immunosuppressive cells, allowing Treg cells to resist lactate-induced functional and proliferative suppression (unlike Teff cells) in vitro149. Glucose or glutamine deprivation (leading to reduced intracellular αKG) in media during in vitro skewing experiments can alter CD4 differentiation and favour the development of Treg cells150,151.
Similar to Teff cells, Treg cell response to hypoxia is not entirely clear. Hypoxia has been shown to promote cytokine-mediated recruitment of Treg cells into the tumour environment152. Other work has demonstrated that FOXP3 transcript is actually increased in response to HIF-1α induction153-155. Also, adoptively transferred Treg cell-specific Hif1 knockout cells failed to migrate into brain tumours in mouse models compared with wild-type controls, an effect that was also observed in dichloroacetate-treated Treg cells, in which glycolysis is inhibited compared with vehicle-treated control Treg cells156. Interestingly, hypoxia-responsive adenosine signalling through the adenosine receptor A2A on Treg cells induced proliferation and significantly stronger immunoregulatory activity in mixed lymphocyte culture experiments157,158. Conversely, several groups have reported that hypoxia-induced HIF-1α can destabilize Treg cells, with reports demonstrating that hypoxia can promote TH17 CD4+ T cells through direct HIF-1α interactions with the cell subtype-defining transcription factors FOXP3 and RORγt, respectively52,53,159.
The unique metabolism of amino acids within the TME can also have a profound effect on Treg cells. IDO1 activity can strongly promote Tregcell differentiation in vitro, an effect that appears to be secondary to both tryptophan deficiency as well as the generation of downstream metabolites, such as kynurenine160,161. Kynurenine has been found to induce the generation of FOXP3-expressing Treg cells by functioning as an endogenous ligand for aryl hydrocarbon receptors on T cells162. Interestingly, many of the qualities of the TME that make it inhospitable for Teff cells are either well tolerated by Treg cells (elevated lactate and H+) or can induce Treg cell responses (for example, accumulation of adenosine, kynurenine and hypoxia).
Metabolism of innate immune suppression.
TAMs can adopt phenotypes that are highly immunosuppressive. Although there is a spectrum of TAM phenotypes as mentioned above, it is useful to examine the metabolic programming of what heretofore had been established as an ‘M2’ anti-inflammatory macrophage subset, characteristics of which are clearly evident within immunosuppressive TAMs. Like Treg cells, M2 macrophages upregulate FAO and mitochondrial respiration134,163. Although early studies demonstrating that FAO is obligatory in M2 macrophages did not take into account the off-target effects of the CPT1A inhibitor etomoxir164, forced induction of FAO and mitochondrial biogenesis by overexpression of Pgc1α primes macrophages for an immunosuppressive phenotype and strongly suppresses the production of pro-inflammatory cytokines163.
M2 macrophages metabolize amino acids in a distinct manner from inflammatory macrophages, expressing high levels of arginase 1 (ARG1), which depletes arginine and generates polyamines that are important mediators of wound healing but also highly immunosuppressive165-168.
Another group of tumour-associated immunosuppressive innate cells, MDSCs, appear to be highly metabolically active. Both aerobic glycolysis and OXPHOS were upregulated in tumour-associated MDSCs compared with MDSCs in the periphery169. In another study, granulocytic MDSCs from the spleens of tumour-bearing mice also showed increases in both aerobic glycolysis and OXPHOS compared with splenic neutrophils from the same mice. Interestingly, MD SC expansion in vitro and accumulation in the TME in mouse breast cancer models could be attenuated through blockade of glycolysis with 2-DG, likely by causing increased ROS levels in these cells170.
Hypoxic regions within tumours have been associated with the accumulation of macrophages, where they aid tumour development through the production of angiogenesis factors, mitogenic factors and cytokines associated with tumour metastasis171-173. Furthermore, hypoxia can promote the generation of immunosuppressive macrophage phenotypes174. Adenosine, which can be generated as a result of hypoxia, can trigger signalling through A2A and A2B receptors on macrophages, both of which augment the differentiation and functional capabilities of immunosuppressive macrophages as well as attenuate the cytokine release of pro-inflammatory macrophages in vitro96,175. Elevated lactic acid in culture has been shown to promote the M2 phenotype, increasing ARG1 expression and polyamine-dependent immunosuppression176. High glycolytic rates in triple-negative breast cancer were shown to promote MDSCs, whereas restricting glycolysis in these cancer cells inhibited granulocyte colony-stimulating factor and granulocyte–macrophage colony-stimulating factor secretion from cancer cells and limited MDSC development177. Interestingly, hypoxia skewed MDSCs towards an immunosuppressive, M2-like TAM phenotype compared with normoxic MDSCs in vitro. This occurred via HIF-1α mechanisms, as Hif1a knockout MDSCs displayed increased tumour growth compared with wild-type MDSCs in mouse melanoma tumour models178.
Exploiting differential metabolic plasticity
Whereas the activation, proliferation and function of Teff cells can be attenuated through inhibiting numerous metabolic pathways, other attributes, such as long-term viability or effector function upon restimulation, may be enhanced. Although inhibiting glycolytic metabolism with 2-DG inhibited Teff cell generation, it also conditioned T cells towards a long-lived, memory-like phenotype50. Interestingly, blocking glycolysis during ex vivo T cell activation and expansion, before reinfusion for tumour treatment, not only allowed for increased survival of antitumour T cells but also for improved cytokine production and cytotoxicity. Similar phenomena have been reported in CD8+ Teff cells in response to AKT inhibition, glutamine blockade, hypoxia, arginine supplementation and potassium supplementation16,63,74,93, 111,179. It may be possible to differentially affect cancer and the immune response. For example, acetate metabolism can rescue T cell function in glucose-restricted CD8+Teff cells87. In addition, our group recently demonstrated the importance of this pathway in maintaining metabolic homeostasis in CD8+ T cells undergoing glutamine blockade16. These findings could imply a generalizable therapeutic strategy, in that blocking the use of typical metabolic fuels, such as glucose or glutamine, may render some cancers metabolically compromised, but may leave antitumour T cells metabolically intact and functional given their ability to use alternative sources, such as acetate. Although specific metabolic interventions may be introduced pharmacologically as adjuncts to checkpoint blockade (TAbLe 2), these targets may be particularly applicable to CAR T cell therapy, wherein manipulation of metabolic pathways can be precisely defined through genetic means (box 2). Future studies delineating the degree of metabolic flexibility possible within a given immune cell subset and functional capacity are clearly warranted.
Table 2 ∣.
Metabolic inhibitors with potential for clinical translation
| Pathway | Target | Representative drugs | Representative phase II/III clinical trials |
Refs |
|---|---|---|---|---|
| Glycolysis | GLUT1 | WZB117 | NA | 187 |
| HK | 2-DG | NA | 50 | |
| 3-Bromopyruvate | NA | 188 | ||
| PFKFB3 | 3-(3-Pyridinyl)-1-(4-pyridinyl)-2-propen-1-one (3-PO), PFK158 | NA | 189 | |
| GAPDH | Dimethyl fumarate (DMF) | Phase IIa | 190,191 | |
| Heptelidic acid | NA | 192 | ||
| PDHK1 | Dichloroacetate (DCA) | Phase II | 193,194 | |
| LDHA | NCI-737, NCI-006 | NA | 195 | |
| FAO | CPT1A | Etomoxir | NA | 196 |
| Perhexidine | NA | 197 | ||
| CD36 | ABT-511 | Phase II | 198,199 | |
| FAS | ACC1 | Firsocostat | NA | 200 |
| Cholesterol esterification | ACAT | Pactimibe | NA | 201 |
| Electron transport and/or mitochondrial function | AMPK | Metformin | Phase IIa | 202-205 |
| Glutaminolysisb | GLS | BPTES | NA | 206 |
| CB-839 | Phase IIa | 207,208 | ||
| Glutamine metabolism | Glutamine requiring enzymes | DON | NA | 16 |
| JHU083 | NA | 209 | ||
| One-carbon metabolism | SHMT2 | RZ-2994 | NA | 44 |
| One-carbon metabolism | TS, DHFR, GARFT | Pemetrexed | Phase IIa and phase IIIa | 192,210,211 |
| Methotrexate | Phase IIa | 212-214 | ||
| TS | 5-Fluorouracil | Phase IIIa | 215-217 | |
| Reduction of ROS levels | Antioxidant | NAC | Phase II | 218,219 |
| Increase of ROS levels | GSH | Menadione | NA | 220 |
| Pentose phosphate pathway | G6PD | Polydatin | NA | 221 |
| Hexosamine biosynthetic pathway | PGM3 | FR054 | NA | 222 |
| Arginine pathway | ARG1 | CB-1158 | Phase IIa | 223-225 |
| Arginine pathway | Pegylated arginine deiminase | ADI-PEG20 | NA | 226 |
| IDO inhibitors | IDO | Epacadostat | Phase IIa | 227-229 |
| Indoximod | Phase IIa | 227,230,231 | ||
| Navoximod | NA | 227 | ||
| R-2-HG synthesis | Mutant IDH1 | FT-2102 | Phase IIa | 232-234 |
| Adenosine pathway | CD73 | Oleclumab | Phase IIa | 98,235-237 |
| BMS-986179 | Phase IIa | 98,235,238 | ||
| NZV930, CPI-006 | NA | 98,235 | ||
| Adenosine receptor A2A | PBF-509 | Phase IIa | 98,239 | |
| CPI-444 | Phase IIa | 98,240 | ||
| AZD4635 | Phase IIa | 98,241 |
ACAT, acetyl-CoA acetyltransferase; ACC1, acetyl-CoA carboxylase; AMPK, AMP kinase; ARG1, arginase; CPT1A, carnitine palmitoyl transferase 1; 2-DG, 2-deoxyglucose; DHFR, dihydrofolate reductase; DON, 6-diazo-5-oxo-l-norleucine; GAPDH, glyceraldehyde 3-phosphate dehydrogenase; GARFT, glycinamide ribonucleotide formyltransferase; GLS, glutaminase; GLUT1, glucose transporter, type 1; G6PD, glucose-6-phosphate dehydrogenase; GSH, glutathione; HK, hexokinase; IDH1, isocitrate dehydrogenase; IDO, indoleamine 2,3-dioxygenase; LDHA, lactate dehydrogenase A; NA, not applicable; NAC, N-acetyl cysteine; PDHK1, pyruvate dehydrogenase kinase; PFKFB3, 6-phosphofructo-2-kinase/fructose-2,6-biphosphatase; PGM3, phosphoglucomutase; R-2-HG, (R)-2-hydroxyglutarate; ROS, reactive oxygen species; SHMT2, serine hydroxymethyltransferase, mitochondrial; TS, thymidylate synthase.
Denotes clinical trial in combination with established immunotherapy agents.
The enzymatic catabolism of glutamine to generate tricarboxylic acid cycle intermediates.
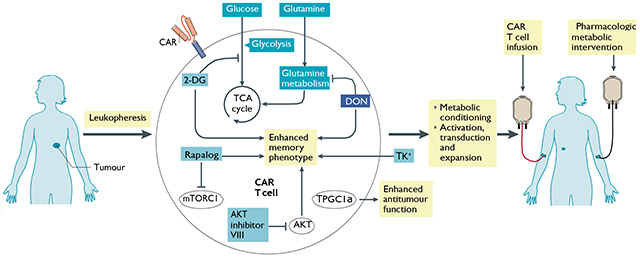
Box 2 ∣. Adoptive T cell therapies enable highly flexible approaches to metabolic therapy through ex vivo culture conditioning or genetic targeting of metabolic processes.
T cells in such regimens can be genetically modified to express chimeric antigen receptors (CARs) that recognize known tumour surface antigens and trigger T cell receptor signalling in the absence of major histocompatibility complex presentation. T cells can be metabolically conditioned through the use of chemical inhibitors or genetic editing during ex vivo expansion, through metabolically engineered media or through pharmacologic treatment after T cell reinfusion. Many of the interventions discussed, including inhibiting glycolysis, glutamine metabolism with 6-diazo-5-oxo-l-norleucine (DON), AKT–mTOR signalling and potassium supplementation, have been used in ex vivo T cell expansion and led to improved T cell persistence and antitumour response50,74,111,179 (see the figure). Recent studies demonstrated that forced expression of peroxisome proliferator-activated receptor-γ co-activator 1α (PGC1α), which promotes mitochondrial biogenesis, in adoptively transferred CD8+ T cells resulted in superior intratumoural metabolic and effector function57. Several groups have also reported the importance of the co-stimulatory receptor 4-1BB in positively conditioning mitochondrial health and biogenesis for robust antitumour immunity245,246. These findings have been validated in the CAR T cell field, wherein the addition of the 4-1BB receptor module has enhanced T cell persistence and increased therapeutic efficacy247-251. 2-DG, 2-deoxyglucose; TCA, tricarboxylic acid.
Checkpoint blockade and immunometabolism.
It is of great interest to define both the metabolic consequences of checkpoint therapy and the metabolic determinants of response. Checkpoint signalling has been shown to regulate metabolism in several studies. For example, PDL1 expression on cancer cells can drive Akt–mTOR activation and glycolysis in cancer cells, increasing glucose uptake and augmenting competition with T cells for glucose14. CD155-TIGIT signalling in T cells from human gastric cancer tissue dampened glucose uptake, lactate production and expression of glycolytic enzymes GLUT1 and HK2180. Conversely, agonism of the co-stimulatory pathway GITR broadly increased T cell metabolic activity and proliferation compared with isotype-treated control T cells181. Lastly, in vitro PD1 and CTLA4 signalling on activated human T cells suppressed metabolic pathways, such as aerobic glycolysis, that are associated with T cell activation182. To this end, the prospect of combining metabolic inhibitors (TAbLe 2) with checkpoint inhibitors holds promise to enhance the efficacy of checkpoint blockade. Targeting tumour metabolism by inhibiting glutamine metabolism in mouse models inhibited tumour growth and conditioned the TME to be more hospitable for antitumour effector cells16. Also, metabolically reprogramming T cells to make them more robust, long-lasting memory cells might improve their response to checkpoint inhibitors. This has been heralded by recent clinical trials combining the anti-folate pemetrexed with anti-PDL1 immune checkpoint blockade183. In addition to having direct antitumour effects, pemetrexed treatment enhanced the metabolic fitness and effector function of antitumour CD8+ T cells, as well as induced immunologic cell death of cancer cells to trigger the immune response.
Conclusion and perspective
Although much of the foundation of immunometabolism has been informed by observations of cancer metabolism, it is clear that there are distinct differences between cancer and immunologic metabolic reprogramming. These differences provide opportunities to target metabolism as a means of enhancing the efficacy of immunotherapy (Fig. 3). Such an approach can be achieved through numerous different strategies. These include targeting tumourmetabolic programmes to inhibit growth and alter the TME, targeting the metabolism of suppressive immune cells to inhibit their function and targeting effector cell metabolism to enhance tumour killing. Likewise, ex vivo pharmacologic or genetic reprogramming of T cell metabolic pathways prior to adoptive cellular therapy offers an opportunity to dramatically engineer enhanced features, which may include longevity or enhanced effector function (bOX 2).
Fig. 3 ∣. Potential metabolic targets for enhancing immune response in cancer.

Using small molecules, monoclonal antibodies and genetic editing, metabolic processes can be targeted to either disable cancer and suppressive immune cell metabolism or, conversely, engage and support effector cell metabolism. Metabolic processes in suppressive immune populations and cancer cells can be targeted to directly decrease viability, as well as to disable metabolic pathways that deplete nutrients (for example, arginase 1 (ARG1) and indoleamine 2,3-dioxygenase (IDO)), lead to toxic metabolites (for example, lactate and CD73) or induce metabolic control of effector cell populations (for example, mutant IDH1 generation of the oncometabolite (R)-2-hydroxyglutarate (R-2-HG)). Metabolic interventions may also be able to induce beneficial changes in effector populations, such as increasing longevity and antigen-specific immunologic memory. A2AR, adenosine receptor subtype A2A; AOA, amino-oxyacetic acid; 2-DG, 2-deoxyglucose; DON, 6-diazo-5-oxo-l-norleucine; ETC, electron transport chain; G6PD, glucose-6-phosphate dehydrogenase; MDSC, myeloid-derived suppressor cell; PGM3, phosphoglucomutase; TCA, tricarboxylic acid; Teff, effector T; Treg, regulatory T.
Future work should begin to focus on the metabolic interdependence of immune cells and cancer cells within the TME. In addition to nutrient depletion and the generation of metabolites that can suppress the immune response at certain concentrations, cancer cells can engage in metabolic crosstalk with other cells within the TME, wherein metabolic programmes can be induced and co-opted to benefit malignant progression. It has been reported that pancreatic stellate cells can provide alanine to cancer cells and, thus, fuel proliferation184, and bone marrow stromal cells have been reported to provide cysteine to promote survival of chronic lymphocytic leukaemia cells185. In another report, ammonia from cancer cell glutamine metabolism diffused through the TME and triggered autophagy in cancer-associated fibroblasts, which in turn provided protein breakdown products, such as glutamine itself, to further support cancer cell metabolism186. It will be important to understand whether and by what mechanism immune-evading cancers may be co-opting the metabolic machinery of immune cells and benefitting from their remarkable metabolic flexibility.
Oxidative phosphorylation (OXPHOS).
A highly efficient form of cellular respiration synthesizing ATP from the phosphorylation of ADP using electrochemical potential energy generated by the transfer of electrons from NADH or FADH2 to oxygen through a series of mitochondrial electron carriers.
Immune checkpoint pathways.
Pathways mediated by cell surface proteins on immune cells, such as PD1 or CTLA4, that serve to suppress the immune response, which can be activated by ligands within the tumour microenvironment or draining lymph nodes.
Chimeric antigen receptor T cells (CAR T cells).
T cells harvested from a patien’s blood and genetically modified to express a special receptor that can recognize and respond to specific, predefined molecular targets on tumour cells.
Hexosamine biosynthesis pathway (HbP).
A branch of glycolysis that generates building blocks used for glycosylation of proteins and lipids.
Pentose phosphate pathway (PPP).
A metabolic branch of glycolysis generating NADPH, used for fatty acid synthesis and redox homeostasis, and 5-carbon sugars used in nucleotide synthesis.
Nuclear factor of activated T cells (NFAT).
A calcium-dependent transcription factor activated in response to T cell receptor stimulation. Cooperation with the AP-1 transcription factor results in a productive immune response and transcription of pro-inflammatory cytokines, such as iL-2 and interferon-γ.
Cataplerosis.
The loss of metabolic intermediates in a metabolic pathway (particularly the tricarboxylic acid cycle) owing to consumption or degradation.
Anaplerosis.
The process of replenishing intermediates of the tricarboxylic acid cycle to support biosynthesis.
De novo lipid synthesis.
The cellular biosynthesis of fatty acids, triglycerides, cholesterol and other lipids from carbohydrates or other non-lipid precursors.
2-Oxoglutarate-dependent dioxygenases (2OgDD).
A family of enzymes that catalyse the hydroxylation of macromolecules, often as a prerequisite to demethylation, reliant on α-ketoglutarate, Fe2+, ascorbate and oxygen as cofactors.
Major histocompatibility complex (MHC).
MHC class i (MHC-i) is expressed on all nucleated cells, a molecular complex presenting intracellular peptide epitopes for CD8+ T cell receptor recognition. Also expressed on antigen-presenting cells, allowing initial antigen-specific activation of cytotoxic CD8+ T cells. MHC-ii is highly expressed on antigen-presenting cells for presenting antigenic epitopes for CD4+ T cell receptor recognition and activation.
Antigen cross-presentation.
The ability of antigen-presenting cells to process extracellular antigens and present them to CD8+ T cells through major histocompatibility complex class 1 presentation.
Footnotes
Competing interests
J.D.P. is a scientific founder, a paid consultant and has equity in Dracen Pharmaceuticals. Technology arising in part from the studies described herein was patented by Johns Hopkins University and subsequently licensed to Dracen Pharmaceuticals (JHU083 is currently labelled as DRP-083). R.D.L. and J.D.P. are inventors for pending patent application no. PCT/US16/44829 submitted by Johns Hopkins University that covers the use of glutamine analogues, such as JHU083 (DRP-083), for cancer immunotherapy. J.D.P has been a paid consultant for Corvus Pharmaceuticals and has equity in the company.
Peer review information
Nature Reviews Cancer thanks N. Chandel, J. Fan and the other, anonymous, reviewer(s) for their contribution to the peer review of this work.
Publisher’s note
Springer Nature remains neutral with regard to jurisdictional claims in published maps and institutional affiliations.
References
- 1.Fox CJ, Hammerman PS & Thompson CB Fuel feeds function: energy metabolism and the T-cell response. Nat. Rev. Immunol 5, 844–852 (2005).This paper reviews the critical determinants of metabolic reprogramming that occur during T cell activation, including the roles of co-stimulatory signalling and growth factors, to meet increased bioenergetic demands required for pathogen response.
- 2.Andrejeva G & Rathmell JC Similarities and distinctions of cancer and immune metabolism in inflammation and tumors. Cell Metab. 26, 49–70 (2017). [DOI] [PMC free article] [PubMed] [Google Scholar]
- 3.Bauer DE et al. Cytokine stimulation of aerobic glycolysis in hematopoietic cells exceeds proliferative demand. FASEB J. 18, 1303–1305 (2004). [DOI] [PMC free article] [PubMed] [Google Scholar]
- 4.Kim J & DeBerardinis RJ Mechanisms and implications of metabolic heterogeneity in cancer. Cell Metab. 30, 434–446 (2019). [DOI] [PMC free article] [PubMed] [Google Scholar]
- 5.Weinberg F et al. Mitochondrial metabolism and ROS generation are essential for Kras-mediated tumorigenicity. Proc. Natl Acad. Sci. USA 107, 8788–8793 (2010). [DOI] [PMC free article] [PubMed] [Google Scholar]
- 6.Ma EH et al. Metabolic profiling using stable isotope tracing reveals distinct patterns of glucose utilization by physiologically activated CD8+ T cells. Immunity 51, 856–870.e5 (2019). [DOI] [PubMed] [Google Scholar]
- 7.Chen PH et al. Metabolic diversity in human non-small cell lung cancer cells. Mol. Cell 76, 838–851.e5 (2019). [DOI] [PMC free article] [PubMed] [Google Scholar]
- 8.Cascone T et al. Increased tumor glycolysis characterizes immune resistance to adoptive T cell therapy. Cell Metab. 27, 977–987.e4 (2018).This study identifies elevated tumour glycolysis as a determinant of immune resistance in melanoma in an adoptive cell therapy model.
- 9.Renner K et al. Restricting glycolysis preserves T cell effector functions and augments checkpoint therapy. Cell Rep. 29, 135–150.e9 (2019). [DOI] [PubMed] [Google Scholar]
- 10.Kleffel S et al. Melanoma cell-intrinsic PD-1 receptor functions promote tumor growth. Cell 162, 1242–1256 (2015). [DOI] [PMC free article] [PubMed] [Google Scholar]
- 11.Nunes-Xavier CE et al. Decreased expression of B7-FH3 reduces the glycolytic capacity and sensitizes breast cancer cells to AKT/mTOR inhibitors. Oncotarget 7, 6891–6901 (2016). [DOI] [PMC free article] [PubMed] [Google Scholar]
- 12.Lim S et al. Immunoregulatory protein B7-H3 reprograms glucose metabolism in cancer cells by ROS-mediated stabilization of HIF1α. Cancer Res. 76, 2231 (2016). [DOI] [PMC free article] [PubMed] [Google Scholar]
- 13.Johnston RJ et al. VISTA is an acidic pH-selective ligand for PSGL-1. Nature 574, 565–570 (2019). [DOI] [PubMed] [Google Scholar]
- 14.Chang CH et al. Metabolic competition in the tumor microenvironment is a driver of cancer progression. Cell 162, 1229–1241 (2015).This study demonstrates that glucose consumption by tumours can restrict the glycolytic capacity and IFNγ production of T cells, and that this nutrient competition can be attenuated through checkpoint blockade with antibodies against PD1/PDL1 and CTLA4.
- 15.Sharma NS et al. Targeting tumor-intrinsic hexosamine biosynthesis sensitizes pancreatic cancer to anti-PD1 therapy. J. Clin. Investigation 130, 451–465 (2020). [DOI] [PMC free article] [PubMed] [Google Scholar]
- 16.Leone RD et al. Glutamine blockade induces divergent metabolic programs to overcome tumor immune evasion. Science 366, 1013–1021 (2019).This study demonstrates, using pharmacologic glutamine blockade, the potential of leveraging the ability of CD8+T cells to use alternative metabolic pathways, including acetate metabolism and glucose anaplerosis, to enhance the antitumour response.
- 17.Lukey MJ,Katt WP & Cerione RA Targeting amino acid metabolism for cancer therapy. Drug Discov. Today 22, 796–804 (2017). [DOI] [PMC free article] [PubMed] [Google Scholar]
- 18.Ho PC et al. Phosphoenolpyruvate is a metabolic checkpoint of anti-tumor T cell responses. Cell 162, 1217–1228 (2015).This study demonstrates the role of glucose deprivation within the TME as an novel checkpoint for T cell tumouricidal effector functions. Additionally, the study shows a critical role for the glycolysis metabolite, phosphoenolpyruvate, in sustaining Ca2+-NFAT signalling in activated antitumour T cells.
- 19.Fridman WH, Zitvogel L,Sautes-Fridman C & Kroemer G The immune contexture in cancer prognosis and treatment. Nat. Rev. Clin. Oncol 14, 717–734 (2017). [DOI] [PubMed] [Google Scholar]
- 20.Tsou P,Katayama H, Ostrin EJ & Hanash SM The emerging role of B cells in tumor immunity. Cancer Res. 76, 5597–5601 (2016). [DOI] [PubMed] [Google Scholar]
- 21.Roberts EW et al. Critical role for CD103+/CD141+ dendritic cells bearing CCR7 for tumor antigen trafficking and priming of T cell immunity in melanoma. Cancer Cell 30, 324–336 (2016). [DOI] [PMC free article] [PubMed] [Google Scholar]
- 22.Jansen CS et al. An intra-tumoral niche maintains and differentiates stem-like CD8 T cells. Nature 576, 465–470 (2019). [DOI] [PMC free article] [PubMed] [Google Scholar]
- 23.Pardoll D Cancer and the immune system: basic concepts and targets for intervention. Semin. Oncol 42, 523–538 (2015). [DOI] [PMC free article] [PubMed] [Google Scholar]
- 24.Miller JF & Sadelain M The journey from discoveries in fundamental immunology to cancer immunotherapy. Cancer Cell 27, 439–449 (2015). [DOI] [PubMed] [Google Scholar]
- 25.Becht E, Giraldo NA, Dieu-Nosjean MC, Sautes-Fridman C & Fridman WH Cancer immune contexture and immunotherapy. Curr. Opin. Immunol 39, 7–13 (2016). [DOI] [PubMed] [Google Scholar]
- 26.Patel CH, Leone RD, Horton MR & Powell JD Targeting metabolism to regulate immune responses in autoimmunity and cancer. Nat Rev. Drug Discov 18, 669–688 (2019). [DOI] [PubMed] [Google Scholar]
- 27.Menk AV et al. Early TCR signaling induces rapid aerobic glycolysis enabling distinct acute T cell effector functions. Cell Rep. 22, 1509–1521 (2018). [DOI] [PMC free article] [PubMed] [Google Scholar]
- 28.Frauwirth KA et al. The CD28 signaling pathway regulates glucose metabolism. Immunity 16, 769–777 (2002).This study shows that the upregulated glycolytic rate in activated T cells is dependent on CD28 co-stimulation acting through PI3K-AKT signalling.
- 29.Wang R et al. The transcription factor Myc controls metabolic reprogramming upon T lymphocyte activation. Immunity 35, 871–882 (2011).This study demonstrates that acute metabolic reprogramming in activated T cells, including the upregulation of gylycolytic, pentose phosphate and glutaminolysis pathways, is dependent on the activity of the MYC transcription factor.
- 30.Gatza E et al. Manipulating the bioenergetics of alloreactive T cells causes their selective apoptosis and arrests graft-versus-host disease. Sci. Transl Med 3, 67ra68 (2011). [DOI] [PMC free article] [PubMed] [Google Scholar]
- 31.Chang CH et al. Posttranscriptional control of T cell effector function by aerobic glycolysis. Cell 153, 1239–1251 (2013).This study shows that IFNγ translation in activated T cells is dependent on the upregulation of aerobic glycolysis. The study reports a novel mechanism wherein GAPDH, in the absence of glycolysis-driven NAD+, blocks IFNγ translation through a moonlighting role by binding to the 3′ untranslated region of IFNγ mRNA.
- 32.Sena LA et al. Mitochondria are required for antigen-specific T cell activation through reactive oxygen species signaling. Immunity 38, 225–236 (2013). [DOI] [PMC free article] [PubMed] [Google Scholar]
- 33.Pollizzi KN & Powell JD Integrating canonical and metabolic signalling programmes in the regulation of T cell responses. Nat. Rev. Immunol 14, 435–446 (2014). [DOI] [PMC free article] [PubMed] [Google Scholar]
- 34.Finlay DK et al. PDK1 regulation of mTOR and hypoxia-inducible factor 1 integrate metabolism and migration of CD8+ T cells. J. Exp. Med 209, 2441–2453 (2012). [DOI] [PMC free article] [PubMed] [Google Scholar]
- 35.Osthus RC et al. Deregulation of glucose transporter 1 and glycolytic gene expression by c-Myc. J. Biol. Chem 275, 21797–21800 (2000). [DOI] [PubMed] [Google Scholar]
- 36.Patra KC & Hay N The pentose phosphate pathway and cancer. Trends Biochem. Sci 39, 347–354 (2014). [DOI] [PMC free article] [PubMed] [Google Scholar]
- 37.Kidani Y et al. Sterol regulatory element-binding proteins are essential for the metabolic programming of effector T cells and adaptive immunity. Nat. Immunol 14, 489–499 (2013). [DOI] [PMC free article] [PubMed] [Google Scholar]
- 38.Gorrini C, Harris IS & Mak TW Modulation of oxidative stress as an anticancer strategy. Nat. Rev. Drug Discov 12, 931–947 (2013). [DOI] [PubMed] [Google Scholar]
- 39.Hosios AM & Vander Heiden MG The redox requirements of proliferating mammalian cells. J. Biol. Chem 293, 7490–7498 (2018). [DOI] [PMC free article] [PubMed] [Google Scholar]
- 40.Przybytkowski E & Averill-Bates DA Correlation between glutathione and stimulation of the pentose phosphate cyclein situin Chinese hamster ovary cells exposed to hydrogen peroxide. Arch. Biochem. Biophysics 325, 91–98 (1996). [DOI] [PubMed] [Google Scholar]
- 41.Sena LA& Chandel NS Physiological roles of mitochondrial reactive oxygen species. Mol. Cell 48, 158–167 (2012). [DOI] [PMC free article] [PubMed] [Google Scholar]
- 42.Mak TW et al. Glutathione primes T cell metabolism for inflammation. Immunity 46, 675–689 (2017). [DOI] [PubMed] [Google Scholar]
- 43.Swamy M et al. Glucose and glutamine fuel protein O-GlcNAcylation to control T cell self-renewal and malignancy. Nat. Immunol 17, 712–720 (2016).This study identifies the regulation of protein O-GlcNAcylation through glucose and glutamine metabolism as a key controller of T cell clonal expansion.
- 44.Ma EH et al. Serine is an essential metabolite for effector T cell expansion. Cell Metab. 25, 345–357 (2017).This study identifies extracellular serine as a key immunometabolite that is required for optimal T cell expansion, in glucose-replete conditions.
- 45.Martínez-Reyes I & Chandel NS Mitochondrial TCA cycle metabolites control physiology and disease. Nat. Commun 11, 102 (2020). [DOI] [PMC free article] [PubMed] [Google Scholar]
- 46.Blagih J et al. The energy sensor AMPK regulates T cell metabolic adaptation and effector responses in vivo. Immunity 42, 41–54 (2015). [DOI] [PubMed] [Google Scholar]
- 47.Cham CM & Gajewski TF Glucose availability regulates IFN-γ production and p70S6 kinase activation in CD8+effector T cells. J. Immunol 174, 4670–4677 (2005). [DOI] [PubMed] [Google Scholar]
- 48.Cham CM, Driessens G, O′Keefe JP & Gajewski TF Glucose deprivation inhibits multiple key gene expression events and effector functions in CD8+T cells. Eur. J. Immunol 38, 2438–2450 (2008). [DOI] [PMC free article] [PubMed] [Google Scholar]
- 49.Delgoffe GM et al. The mTOR kinase differentially regulates effector and regulatory T cell lineage commitment. Immunity 30, 832–844 (2009). [DOI] [PMC free article] [PubMed] [Google Scholar]
- 50.Sukumar M et al. Inhibiting glycolytic metabolism enhances CD8+ T cell memory and antitumor function. J. Clin. investigation 123, 4479–4488 (2013).This study shows that inhibiting glycolysis with 2-DG during in vitro activation enhances the CD8+ T cell memory phenotype and leads to improved antitumour activity after adoptive transfer.
- 51.Araki K et al. mTOR regulates memory CD8 T-cell differentiation. Nature 460, 108–112 (2009). [DOI] [PMC free article] [PubMed] [Google Scholar]
- 52.Shi LZ et al. HIF1α-dependent glycolytic pathway orchestrates a metabolic checkpoint for the differentiation of TH17 and Treg cells. J. Exp. Med 208, 1367–1376 (2011). [DOI] [PMC free article] [PubMed] [Google Scholar]
- 53.Dang EV et al. Control of TH17/Treg balance by hypoxia-inducible factor 1. Cell 146, 772–784 (2011). [DOI] [PMC free article] [PubMed] [Google Scholar]
- 54.Zhao E et al. Cancer mediates effector T cell dysfunction by targeting microRNAs and EZH2 via glycolysis restriction. Nat. Immunol 17, 95–103 (2016). [DOI] [PMC free article] [PubMed] [Google Scholar]
- 55.van Bruggen JAC et al. Chronic lymphocytic leukemia cells impair mitochondrial fitness in CD8+ T cells and impede CAR T-cell efficacy. Blood 134, 44–58 (2019). [DOI] [PMC free article] [PubMed] [Google Scholar]
- 56.Siska PJ et al. Mitochondrial dysregulation and glycolytic insufficiency functionally impair CD8 T cells infiltrating human renal cell carcinoma. JCI Insight 2, e93411 (2017). [DOI] [PMC free article] [PubMed] [Google Scholar]
- 57.Scharping NE et al. The tumor microenvironment represses T cell mitochondrial biogenesis to drive intratumoral T cell metabolic insufficiency and dysfunction. Immunity 45, 374–388 (2016). [DOI] [PMC free article] [PubMed] [Google Scholar]
- 58.Nii T et al. Molecular events involved in up-regulating human Na+-independent neutral amino acid transporter LAT1 during T-cell activation. Biochem. J 358, 693–704 (2001). [DOI] [PMC free article] [PubMed] [Google Scholar]
- 59.Carr EL et al. Glutamine uptake and metabolism are coordinately regulated by ERK/MAPK during T lymphocyte activation. J. Immunol 185, 1037–1044 (2010). [DOI] [PMC free article] [PubMed] [Google Scholar]
- 60.Nakaya M et al. Inflammatory T cell responses rely on amino acid transporter ASCT2 facilitation of glutamine uptake and mTORC1 kinase activation. Immunity 40, 692–705 (2014). [DOI] [PMC free article] [PubMed] [Google Scholar]
- 61.Ren W et al. Amino-acid transporters in T-cell activation and differentiation. Cell Death Dis. 8, e2655 (2017). [DOI] [PMC free article] [PubMed] [Google Scholar]
- 62.Sinclair LV et al. Control of amino-acid transport by antigen receptors coordinates the metabolic reprogramming essential for T cell differentiation. Nat. Immunol 14, 500–508 (2013). [DOI] [PMC free article] [PubMed] [Google Scholar]
- 63.Geiger R et al. l-Arginine modulates T cell metabolism and enhances survival and anti-tumor activity. Cell 167, 829–842.e813 (2016).This study shows that elevating l-arginine levels during T cell activation promotes long-lived central memory-like cells with enhanced antitumour activity in a mouse model.
- 64.Srivastava MK, Sinha P, Clements VK, Rodriguez P & Ostrand-Rosenberg S Myeloid-derived suppressor cells inhibit T-cell activation by depleting cystine and cysteine. Cancer Res. 70, 68–77 (2010). [DOI] [PMC free article] [PubMed] [Google Scholar]
- 65.Munn DH et al. Prevention of allogeneic fetal rejection by tryptophan catabolism. Science 281, 1191–1193 (1998). [DOI] [PubMed] [Google Scholar]
- 66.Munn DH et al. Inhibition of T cell proliferation by macrophage tryptophan catabolism. J. Exp. Med 189, 1363–1372 (1999).This paper uncovers the ability of macrophages to induce cell cycle arrest in Teff cells through the IDO-dependent catabolism of tryptophan.
- 67.Munn DH et al. GCN2 kinase in T Cells mediates proliferative arrest and anergy induction in response to indoleamine 2,3-dioxygenase. Immunity 22, 633–642 (2005). [DOI] [PubMed] [Google Scholar]
- 68.Liu M et al. Targeting the IDO1 pathway in cancer: from bench to bedside. J. Hematol. Oncol 11, 100–100 (2018). [DOI] [PMC free article] [PubMed] [Google Scholar]
- 69.Liu H. et al. Increased expression of IDO associates with poor postoperative clinical outcome of patients with gastric adenocarcinoma. Sci. Rep 6, 21319 (2016). [DOI] [PMC free article] [PubMed] [Google Scholar]
- 70.Li R et al. IDO inhibits T-cell function through suppressing Vav1 expression and activation. Cancer Biol. Ther 8, 1402–1408 (2009). [DOI] [PubMed] [Google Scholar]
- 71.Godin-Ethier J, Hanafi LA, Piccirillo CA & Lapointe R Indoleamine 2,3-dioxygenase expression in human cancers: clinical and immunologic perspectives. Clin. Cancer Res 17, 6985–6991 (2011). [DOI] [PubMed] [Google Scholar]
- 72.Cluntun AA, Lukey MJ, Cerione RA & Locasale JW Glutamine metabolism in cancer: understanding the heterogeneity. Trends Cancer 3, 169–180 (2017). [DOI] [PMC free article] [PubMed] [Google Scholar]
- 73.Cheng T et al. Pyruvate carboxylase is required for glutamine-independent growth of tumor cells. Proc. Natl Acad. Sci. USA 108, 8674–8679 (2011). [DOI] [PMC free article] [PubMed] [Google Scholar]
- 74.Nabe S et al. Reinforce the antitumor activity of CD8+ T cells via glutamine restriction. Cancer Sci. 109, 3737–3750 (2018). [DOI] [PMC free article] [PubMed] [Google Scholar]
- 75.Reid MA, Dai Z & Locasale JW The impact of cellular metabolism on chromatin dynamics and epigenetics. Nat. Cell Biol 19, 1298–1306 (2017). [DOI] [PMC free article] [PubMed] [Google Scholar]
- 76.Yang W et al. Potentiating the antitumour response of CD8+ T cells by modulating cholesterol metabolism. Nature 531, 651–655 (2016).This work demonstrates the potential to enhance CD8+ T cell effector function, proliferation and antitumour activity through pharmacologic and genetic blockade of the cholesterol-esterifying enzyme ACAT1, which allows for increased cholesterol content in plasma membranes, facilitating T cell receptor clustering.
- 77.Ma X et al. Cholesterol induces CD8+ T cell exhaustion in the tumor microenvironment. Cell Metab. 30, 143–156.e5 (2019). [DOI] [PMC free article] [PubMed] [Google Scholar]
- 78.van der Windt GJ et al. Mitochondrial respiratory capacity is a critical regulator of CD8+ T cell memory development. Immunity 36, 68–78 (2012). [DOI] [PMC free article] [PubMed] [Google Scholar]
- 79.van der Windt GJ et al. CD8 memory T cells have a bioenergetic advantage that underlies their rapid recall ability. Proc. Natl Acad. Sci. USA 110, 14336–14341 (2013). [DOI] [PMC free article] [PubMed] [Google Scholar]
- 80.Pollizzi KN et al. mTORC1 and mTORC2 selectively regulate CD8+ T cell differentiation. J. Clin. Investigation 125, 2090–2108 (2015). [DOI] [PMC free article] [PubMed] [Google Scholar]
- 81.Pollizzi KN et al. Asymmetric inheritance of mTORC1 kinase activity during division dictates CD8+ T cell differentiation. Nat. Immunol 17, 704–711 (2016). [DOI] [PMC free article] [PubMed] [Google Scholar]
- 82.Raud B et al. Etomoxir actions on regulatory and memory T cells are independent of Cpt1a-mediated fatty acid oxidation. Cell Metab. 28, 504–515.e7 (2018). [DOI] [PMC free article] [PubMed] [Google Scholar]
- 83.Pan Y et al. Survival of tissue-resident memory T cells requires exogenous lipid uptake and metabolism. Nature 543, 252–256 (2017). [DOI] [PMC free article] [PubMed] [Google Scholar]
- 84.Tyrakis PA et al. S-2-hydroxyglutarate regulates CD8+ T-lymphocytefate. Nature 540, 236–241 (2016). [DOI] [PMC free article] [PubMed] [Google Scholar]
- 85.Chisolm DA et al. CCCTC-binding factor translates interleukin 2- and α-ketoglutarate-sensitive metabolic changes in T cells into context-dependent gene programs. Immunity 47, 251–267.e7 (2017). [DOI] [PMC free article] [PubMed] [Google Scholar]
- 86.Schug ZT, Vande Voorde J & Gottlieb E The metabolic fate of acetate in cancer. Nat. Rev. Cancer 16, 708–717 (2016). [DOI] [PMC free article] [PubMed] [Google Scholar]
- 87.Qiu J et al. Acetate promotes T cell effector function during glucose restriction. Cell Rep. 27, 2063–2074.e5 (2019). [DOI] [PMC free article] [PubMed] [Google Scholar]
- 88.Balmer ML et al. Memory CD8+ T cells require increased concentrations of acetate induced by stress for optimal function. Immunity 44, 1312–1324 (2016). [DOI] [PubMed] [Google Scholar]
- 89.Petrova V,Annicchiarico-Petruzzelli M, Melino G & Amelio I The hypoxic tumour microenvironment. Oncogenesis 7, 10 (2018). [DOI] [PMC free article] [PubMed] [Google Scholar]
- 90.McKeown SR Defining normoxia, physoxia and hypoxia in tumours—implications for treatment response. Br. J. Radiol 87, 20130676 (2014). [DOI] [PMC free article] [PubMed] [Google Scholar]
- 91.Caldwell CC et al. Differential effects of physiologically relevant hypoxic conditions on T lymphocyte development and effector functions. J. Immunol 167, 6140–6149 (2001). [DOI] [PubMed] [Google Scholar]
- 92.Ohta A et al. In vivo T cell activation in lymphoid tissues is inhibited in the oxygen-poor microenvironment. Front. Immunol 2, 27 (2011). [DOI] [PMC free article] [PubMed] [Google Scholar]
- 93.Phan AT et al. Constitutive glycolytic metabolism supports CD8+ T cell effector memory differentiation during viral infection. Immunity 45, 1024–1037 (2016). [DOI] [PMC free article] [PubMed] [Google Scholar]
- 94.Wang L et al. CD73 has distinct roles in nonhematopoietic and hematopoietic cells to promote tumor growth in mice. J. Clin. Investigation 121, 2371–2382 (2011). [DOI] [PMC free article] [PubMed] [Google Scholar]
- 95.Allard B, Longhi MS, Robson SC & Stagg J The ectonucleotidases CD39 and CD73: novel checkpoint inhibitor targets. Immunol. Rev 276, 121–144 (2017). [DOI] [PMC free article] [PubMed] [Google Scholar]
- 96.Ferrante CJ et al. The adenosine-dependent angiogenic switch of macrophages to an M2-like phenotype is independent of interleukin-4 receptor α (IL-4Rα) signaling. Inflammation 36, 921–931 (2013). [DOI] [PMC free article] [PubMed] [Google Scholar]
- 97.Leone RD, Lo YC & Powell JD A2aR antagonists: next generation checkpoint blockade for cancer immunotherapy. Comput. Struct. Biotechnol. J 13, 265–272 (2015). [DOI] [PMC free article] [PubMed] [Google Scholar]
- 98.Leone RD & Emens LA Targeting adenosine for cancer immunotherapy. J. Immunother. Cancer 6, 57 (2018). [DOI] [PMC free article] [PubMed] [Google Scholar]
- 99.Waickman AT et al. Enhancement of tumor immunotherapy by deletion of the A2A adenosine receptor. Cancer Immunol. Immunother 61, 917–926 (2012). [DOI] [PMC free article] [PubMed] [Google Scholar]
- 100.Ohta A et al. A2A adenosine receptor protects tumors from antitumor T cells. Proc. Natl Acad. Sci 103, 13132–13137 (2006).This study demonstrates that pharmacologic or genetic inhibition of adenosine-A2AR receptor signalling on T cells enhanced T cell-mediated tumour regression and destruction of metastases.
- 101.Leone RD et al. Inhibition of the adenosine A2a receptor modulates expression of T cell coinhibitory receptors and improves effector function for enhanced checkpoint blockade and ACT in murine cancer models. Cancer Immunol. Immunother 67, 1271–1284 (2018). [DOI] [PMC free article] [PubMed] [Google Scholar]
- 102.Hatfield SM et al. Immunological mechanisms of the antitumor effects of supplemental oxygenation. Sci. Transl Med 7, 277ra230 (2015).This report shows the potential of respiratory hyperoxygenation in mice to suppress adenosine-A2AR signalling in antitumour CD8+T cells and NK cells, while also weakening Treg cell immunosuppression, leading to enhanced tumour regression and survival.
- 103.Fischer K et al. Inhibitory effect of tumor cell–derived lactic acid on human T cells. Blood 109, 3812–3819 (2007).This study demonstrates the suppressive effect of lactic acid on CD8+ Teff cell proliferation, cytokine production and cytotoxicity.
- 104.Brand A et al. LDHA-associated lactic acid production blunts tumor immunosurveillance by T and NK cells. Cell Metab. 24, 657–671 (2016). [DOI] [PubMed] [Google Scholar]
- 105.Mendler AN et al. Tumor lactic acidosis suppresses CTL function by inhibition of p38 and JNK/c-Jun activation. Int. J. Cancer 131, 633–640 (2012). [DOI] [PubMed] [Google Scholar]
- 106.Labadie BW, Bao R & Luke JJ Reimagining IDO Pathway inhibition in cancer immunotherapy via downstream focus on the tryptophan–kynurenine–aryl hydrocarbon axis. Clin. Cancer Res 25, 1462–1471 (2019). [DOI] [PMC free article] [PubMed] [Google Scholar]
- 107.Liu Y et al. Tumor-repopulating cells induce PD-1 expression in CD8+ T cells by transferring kynurenine and AhR activation. Cancer Cell 33, 480–494.e7 (2018). [DOI] [PubMed] [Google Scholar]
- 108.Bunse L et al. Suppression of antitumor T cell immunity by the oncometabolite (R)-2-hydroxyglutarate. Nat. Med 24, 1192–1203 (2018).This study shows that tumour-derived R-2-HG is taken up by T cells and interferes with NFAT transcriptional activity and polyamine biosynthesis to suppress T cell activity. The antitumour immune response is enhanced by inhibition of enzymatic activity of IDH1.
- 109.Zhang L et al. d-2-Hydroxyglutarate is an intercellular mediator in IDH-mutant gliomas inhibiting complement and T cells. Clin. Cancer Res 24, 5381–5391 (2018). [DOI] [PMC free article] [PubMed] [Google Scholar]
- 110.Eil R et al. Ionic immune suppression within the tumour microenvironment limits T cell effector function. Nature 537, 539–543 (2016).This study shows that necrosis-related potassium release occurs in human and mouse tumours and that elevated extracellular potassium concentration leads to suppression of Akt–mTOR signalling and T cell function in a PP2A-dependent manner.
- 111.Vodnala SK et al. T cell stemness and dysfunction in tumors are triggered by a common mechanism. Science 363, eaau0135 (2019). [DOI] [PMC free article] [PubMed] [Google Scholar]
- 112.Keppel MP, Saucier N,Mah AY, Vogel TP & Cooper MA Activation-specific metabolic requirements for NK cell IFN-γ production. J. Immunol 194, 1954–1962 (2015). [DOI] [PMC free article] [PubMed] [Google Scholar]
- 113.Assmann N et al. Srebp-controlled glucose metabolism is essential for NK cell functional responses. Nat. Immunol 18, 1197–1206 (2017). [DOI] [PubMed] [Google Scholar]
- 114.Wu Q et al. 27-Hydroxycholesterol promotes cell-autonomous, ER-positive breast cancer growth. Cell Rep. 5, 637–645 (2013). [DOI] [PMC free article] [PubMed] [Google Scholar]
- 115.Rossin D et al. Increased production of 27-hydroxycholesterol in human colorectal cancer advanced stage: possible contribution to cancer cell survival and infiltration. Free. Radio. Biol. Med 136, 35–44 (2019). [DOI] [PubMed] [Google Scholar]
- 116.Li D, Long W, Huang R, Chen Y & Xia M 27-Hydroxycholesterol inhibits sterol regulatory element-binding protein 1 activation and hepatic lipid accumulation in mice. Obesity 26, 713–722 (2018). [DOI] [PubMed] [Google Scholar]
- 117.Guo F et al. Upregulation of 24(R/S),25-epoxycholesterol and 27-hydroxycholesterol suppresses the proliferation and migration of gastric cancer cells. Biochem. Biophys. Res. Commun 504, 892–898 (2018). [DOI] [PubMed] [Google Scholar]
- 118.Sun JC, Ma A & Lanier LL Cutting edge: IL-15-independent NK cell response to mouse cytomegalovirus infection. J. Immunol 183, 2911–2914 (2009). [DOI] [PMC free article] [PubMed] [Google Scholar]
- 119.Cong J et al. Dysfunction of natural killer cells by FBP1-induced inhibition of glycolysis during lung cancer progression. Cell Metab. 28, 243–255.e5 (2018). [DOI] [PubMed] [Google Scholar]
- 120.Oberlies J et al. Regulation of NK cell function by human granulocyte arginase. J. Immunol 182, 5259–5267 (2009). [DOI] [PubMed] [Google Scholar]
- 121.Lamas B et al. Altered functions of natural killer cells in response to l-arginine availability. Cell Immunol. 280, 182–190 (2012). [DOI] [PubMed] [Google Scholar]
- 122.Sarkar S et al. Hypoxia induced impairment of NK cell cytotoxicity against multiple myeloma can be overcome by IL-2 activation of the NK cells. PLoS One 8, e64835 (2013). [DOI] [PMC free article] [PubMed] [Google Scholar]
- 123.Loftus RM et al. Amino acid-dependent cMyc expression is essential for NK cell metabolic and functional responses in mice. Nat. Commun 9, 2341 (2018). [DOI] [PMC free article] [PubMed] [Google Scholar]
- 124.Balsamo M et al. Hypoxia downregulates the expression of activating receptors involved in NK-cell-mediated target cell killing without affecting ADCC. Eur. J. Immunol 43, 2756–2764 (2013). [DOI] [PubMed] [Google Scholar]
- 125.Husain Z, Huang Y,Seth P& Sukhatme VP Tumor-derived lactate modifies antitumor immune response: effect on myeloid-derived suppressor cells and NK cells. J. Immunol 191, 1486–1495 (2013). [DOI] [PubMed] [Google Scholar]
- 126.Harmon C et al. Lactate-mediated acidification of tumor microenvironment induces apoptosis of liver-resident NK cells in colorectal liver metastasis. Cancer Immunol. Res 7, 335–346 (2019). [DOI] [PubMed] [Google Scholar]
- 127.Young A et al. A2AR adenosine signaling suppresses natural killer cell maturation in the tumor microenvironment. Cancer Res. 78, 1003–1016 (2018). [DOI] [PubMed] [Google Scholar]
- 128.Orecchioni M, Ghosheh Y, Pramod AB & Ley K Macrophage polarization: different gene signatures in M1(LPS+) vs. classically and M2(LPS−) vs. alternatively activated macrophages. Front. Immunol 10, 1084 (2019). [DOI] [PMC free article] [PubMed] [Google Scholar]
- 129.Martinez FO & Gordon S The M1 and M2 paradigm of macrophage activation: time for reassessment. F1000Prime Rep. 6, 13 (2014). [DOI] [PMC free article] [PubMed] [Google Scholar]
- 130.Aras S & Zaidi MR TAMeless traitors: macrophages in cancer progression and metastasis. Br. J. Cancer 117, 1583–1591 (2017). [DOI] [PMC free article] [PubMed] [Google Scholar]
- 131.Freemerman AJ et al. Metabolic reprogramming of macrophages: glucose transporter 1 (GLUT1)-mediated glucose metabolism drives a proinflammatory phenotype. J. Biol. Chem 289, 7884–7896 (2014). [DOI] [PMC free article] [PubMed] [Google Scholar]
- 132.Tannahill GM et al. Succinate is an inflammatory signal that induces IL-1β through HIF-1α. Nature 496, 238–242 (2013). [DOI] [PMC free article] [PubMed] [Google Scholar]
- 133.Haschemi A et al. The sedoheptulose kinase CARKL directs macrophage polarization through control of glucose metabolism. Cell Metab. 15, 813–826 (2012). [DOI] [PMC free article] [PubMed] [Google Scholar]
- 134.Jha AK et al. Network integration of parallel metabolic and transcriptional data reveals metabolic modules that regulate macrophage polarization. Immunity 42, 419–430 (2015). [DOI] [PubMed] [Google Scholar]
- 135.Iles KE & Forman HJ Macrophage signaling and respiratory burst. Immunol. Res 26, 95–105 (2002). [DOI] [PubMed] [Google Scholar]
- 136.Viola A, Munari F, Sanchez-Rodriguez R, Scolaro T & Castegna A The metabolic signature of macrophage responses. Front. Immunol 10, 1462 (2019). [DOI] [PMC free article] [PubMed] [Google Scholar]
- 137.Zajac E et al. Angiogenic capacity of M1- and M2-polarized macrophages is determined by the levels of TIMP-1 complexed with their secreted proMMP-9. Blood 122, 4054–4067 (2013). [DOI] [PMC free article] [PubMed] [Google Scholar]
- 138.Stuehr DJ & Nathan CF Nitric oxide. A macrophage product responsible for cytostasis and respiratory inhibition in tumor target cells. J. Exp. Med 169, 1543–1555 (1989). [DOI] [PMC free article] [PubMed] [Google Scholar]
- 139.El-Gayar S, Thuring-Nahler H, Pfeilschifter J, Rollinghoff M & Bogdan C Translational control of inducible nitric oxide synthase by IL-13 and arginine availability in inflammatory macrophages. J. Immunol 171, 4561–4568 (2003). [DOI] [PubMed] [Google Scholar]
- 140.Moon JS et al. mTORC1-induced HK1-dependent glycolysis regulates NLRP3 inflammasome activation. Cell Rep. 12, 102–115 (2015). [DOI] [PMC free article] [PubMed] [Google Scholar] [Retracted]
- 141.Jantsch J et al. Hypoxia and hypoxia-inducible factor-1α modulate lipopolysaccharide-induced dendritic cell activation and function. J. Immunol 180, 4697–4705 (2008). [DOI] [PubMed] [Google Scholar]
- 142.Krawczyk CM et al. Toll-like receptor-induced changes in glycolytic metabolism regulate dendritic cell activation. Blood 115, 4742–4749 (2010). [DOI] [PMC free article] [PubMed] [Google Scholar]
- 143.Hardie DG AMP-activated/SNF1 protein kinases: conserved guardians of cellular energy. Nat. Rev. Mol. Cell Biol 8, 774–785 (2007). [DOI] [PubMed] [Google Scholar]
- 144.Michalek RD et al. Cutting edge: distinct glycolytic and lipid oxidative metabolic programs are essential for effector and regulatory CD4+T cell subsets. J. Immunol 186, 3299–3303 (2011). [DOI] [PMC free article] [PubMed] [Google Scholar]
- 145.Gerriets VA et al. Metabolic programming and PDHK1 control CD4+ T cell subsets and inflammation. J. Clin. Investigation 125, 194–207 (2015). [DOI] [PMC free article] [PubMed] [Google Scholar]
- 146.Pacella I et al. Fatty acid metabolism complements glycolysis in the selective regulatory T cell expansion during tumor growth. Proc. Natl Acad. Sci. USA 115, E6546–e6555 (2018). [DOI] [PMC free article] [PubMed] [Google Scholar]
- 147.Cluxton D,Petrasca A, Moran B & Fletcher JM Differential regulation of human Treg and TH17 cells by fatty acid synthesis and glycolysis. Front. Immunol 10, 115 (2019). [DOI] [PMC free article] [PubMed] [Google Scholar]
- 148.Sun IH et al. mTOR complex 1 signaling regulates the generation and function of central and effector Foxp3+regulatory T cells. J. Immunol 201, 481–492 (2018). [DOI] [PMC free article] [PubMed] [Google Scholar]
- 149.Angelin A et al. Foxp3 reprograms T cell metabolism to function in low-glucose, high-lactate environments. Cell Metab. 25, 1282–1293.e87 (2017).This study shows that the Treg cell-defining transcription factor, FOXP3, suppresses MYC activity and glycolysis, while increasing OXPHOS, allowing Treg cells to resist lactate-mediated suppression in low-glucose environments such as the TME.
- 150.Araujo L, Khim P,Mkhikian H, Mortales CL & Demetriou M Glycolysis and glutaminolysis cooperatively control T cell function by limiting metabolite supply to N-glycosylation. eLife 6, e21330 (2017). [DOI] [PMC free article] [PubMed] [Google Scholar]
- 151.Klysz D et al. Glutamine-dependent α-ketoglutarate production regulates the balance between T helper 1 cell and regulatory T cell generation. Sci. Signal 8, ra97 (2015). [DOI] [PubMed] [Google Scholar]
- 152.Facciabene A et al. Tumour hypoxia promotes tolerance and angiogenesis via CCL28 and Treg cells. Nature 475, 226–230 (2011). [DOI] [PubMed] [Google Scholar]
- 153.Clambey ET et al. Hypoxia-inducible factor-1α-dependent induction of FoxP3 drives regulatory T-cell abundance and function during inflammatory hypoxia of the mucosa. Proc. Natl Acad. Sci. USA 109, E2784–E2793 (2012). [DOI] [PMC free article] [PubMed] [Google Scholar]
- 154.Westendorf AM et al. Hypoxia enhances immunosuppression by inhibiting CD4+effector T cell function and promoting Treg activity. Cell Physiol. Biochem 41, 1271–1284 (2017). [DOI] [PubMed] [Google Scholar]
- 155.Ben-Shoshan J,Maysel-Auslender S, Mor A, Keren G & George J Hypoxia controls CD4+CD25+ regulatory T-cell homeostasis via hypoxia-inducible factor-1α. Eur. J. Immunol 38, 2412–2418 (2008). [DOI] [PubMed] [Google Scholar]
- 156.Miska J et al. HIF-1α is a metabolic switch between glycolytic-driven migration and oxidative phosphorylation-driven immunosuppression of Tregs in glioblastoma. Cell Rep. 27, 226–237.e4 (2019). [DOI] [PMC free article] [PubMed] [Google Scholar]
- 157.Ohta A & Sitkovsky M Extracellular adenosine-mediated modulation of regulatory T cells. Front. Immunol 5, 304 (2014). [DOI] [PMC free article] [PubMed] [Google Scholar]
- 158.Ohta A et al. The development and immunosuppressive functions of CD4+CD25+FoxP3+ regulatory T cells are under influence of the adenosine-A2A adenosine receptor pathway. Front. Immunol 3, 190 (2012). [DOI] [PMC free article] [PubMed] [Google Scholar]
- 159.Lee JH, Elly C, Park Y & Liu YC E3 ubiquitin ligase VHL regulates hypoxia-inducible factor-1α to maintain regulatory T cell stability and suppressive capacity. Immunity 42, 1062–1074 (2015). [DOI] [PMC free article] [PubMed] [Google Scholar]
- 160.Fallarino F et al. The combined effects of tryptophan starvation and tryptophan catabolites down-regulate T cell receptor ζ-chain and induce a regulatory phenotype in naive T cells. J. Immunol 176, 6752–6761 (2006). [DOI] [PubMed] [Google Scholar]
- 161.Chen W,Liang X,Peterson AJ, Munn DH & Blazar BR The indoleamine 2,3-dioxygenase pathway is essential for human plasmacytoid dendritic cell-induced adaptive T regulatory cell generation. J. Immunol 181, 5396–5404 (2008). [DOI] [PMC free article] [PubMed] [Google Scholar]
- 162.Mezrich JD et al. An interaction between kynurenine and the aryl hydrocarbon receptor can generate regulatory T cells. J. Immunol 185, 3190 (2010). [DOI] [PMC free article] [PubMed] [Google Scholar]
- 163.Vats D et al. Oxidative metabolism and PGC-1β attenuate macrophage-mediated inflammation. Cell Metab. 4, 13–24 (2006). [DOI] [PMC free article] [PubMed] [Google Scholar]
- 164.Divakaruni AS et al. Etomoxir inhibits macrophage polarization by disrupting CoA homeostasis. Cell Metab. 28, 490–503.e7 (2018). [DOI] [PMC free article] [PubMed] [Google Scholar]
- 165.Shearer JD, Richards JR, Mills CD & Caldwell MD Differential regulation of macrophage arginine metabolism: a proposed role in wound healing. Am. J. Physiol 272, E181–E190 (1997). [DOI] [PubMed] [Google Scholar]
- 166.Ye C et al. Targeting ornithine decarboxylase by α-difluoromethylornithine inhibits tumor growth by impairing myeloid-derived suppressor cells. J. Immunol 196, 915 (2016). [DOI] [PMC free article] [PubMed] [Google Scholar]
- 167.Mills CD, Shearer J, Evans R & Caldwell MD Macrophage arginine metabolism and the inhibition or stimulation of cancer. J. Immunol 149, 2709–2714 (1992). [PubMed] [Google Scholar]
- 168.Hayes CS et al. Polyamine-blocking therapy reverses immunosuppression in the tumor microenvironment. Cancer Immunol. Res 2, 274–285 (2014). [DOI] [PMC free article] [PubMed] [Google Scholar]
- 169.Hossain F et al. Inhibition of fatty acid oxidation modulates immunosuppressive functions of myeloid-derived suppressor cells and enhances cancer therapies. Cancer Immunol. Res 3, 1236–1247 (2015). [DOI] [PMC free article] [PubMed] [Google Scholar]
- 170.Jian SL et al. Glycolysis regulates the expansion of myeloid-derived suppressor cells in tumor-bearing hosts through prevention of ROS-mediated apoptosis. Cell Death Dis. 8, e2779 (2017). [DOI] [PMC free article] [PubMed] [Google Scholar]
- 171.Casazza A et al. Impeding macrophage entry into hypoxic tumor areas by Sema3A/Nrp1 signaling blockade inhibits angiogenesis and restores antitumor immunity. Cancer Cell 24, 695–709 (2013). [DOI] [PubMed] [Google Scholar]
- 172.Murdoch C & Lewis CE Macrophage migration and gene expression in response to tumor hypoxia. Int. J. Cancer 117, 701–708 (2005). [DOI] [PubMed] [Google Scholar]
- 173.Henze AT & Mazzone M The impact of hypoxia on tumor-associated macrophages. J. Clin. Investigation 126, 3672–3679 (2016). [DOI] [PMC free article] [PubMed] [Google Scholar]
- 174.Tripathi C et al. Macrophages are recruited to hypoxic tumor areas and acquire a pro-angiogenic M2-polarized phenotype via hypoxic cancer cell derived cytokines Oncostatin M and Eotaxin. Oncotarget 5, 5350–5368 (2014). [DOI] [PMC free article] [PubMed] [Google Scholar]
- 175.Csóka B et al. Adenosine promotes alternative macrophage activation via A2A and A2B receptors. FASEB J. 26, 376–386 (2012). [DOI] [PMC free article] [PubMed] [Google Scholar]
- 176.Colegio OR et al. Functional polarization of tumour-associated macrophages by tumour-derived lactic acid. Nature 513, 559–563 (2014).This study demonstrates that lactic acid from tumour cells induces an M2-like phenotype in macrophages with upregulation of vascular endothelial growth factor and ARG1.
- 177.Li W et al. Aerobic glycolysis controls myeloid-derived suppressor cells and tumor immunity via a specific CEBPB isoform in triple-negative breast cancer. Cell Metab. 28, 87–103.e6 (2018). [DOI] [PMC free article] [PubMed] [Google Scholar]
- 178.Corzo CA et al. HIF-1α regulates function and differentiation of myeloid-derived suppressor cells in the tumor microenvironment. J. Exp. Med 207, 2439–2453 (2010). [DOI] [PMC free article] [PubMed] [Google Scholar]
- 179.Crompton JG et al. Akt inhibition enhances expansion of potent tumor-specific lymphocytes with memory cell characteristics. Cancer Res. 75, 296–305 (2015).This work shows that harvested tumour infiltrating lymphocytes expanded in the presence of an inhibitor of AKT show enhanced transcriptional, metabolic and functional properties of Tmem cells, imbuing these T cells with enhanced in vivo persistence and augmented antitumor activity in mouse models.
- 180.He W et al. CD155T/TIGIT signaling regulates CD8+ T-cell metabolism and promotes tumor progression in human gastric cancer. Cancer Res. 77, 6375–6388 (2017). [DOI] [PubMed] [Google Scholar]
- 181.Sabharwal SS et al. GITR agonism enhances cellular metabolism to support CD8+ T-cell proliferation and effector cytokine production in a mouse tumor model. Cancer Immunol. Res 6, 1199 (2018). [DOI] [PubMed] [Google Scholar]
- 182.Parry RV et al. CTLA-4 and PD-1 receptors inhibit T-cell activation by distinct mechanisms. Mol. Cell Biol 25, 9543–9553 (2005). [DOI] [PMC free article] [PubMed] [Google Scholar]
- 183.Schaer DA et al. The folate pathway inhibitor pemetrexed pleiotropically enhances effects of cancer immunotherapy. Clin. Cancer Res 25, 7175–7188 (2019).This study demonstrates that pemetrexed augments antitumour immunity in combination with anti-PDL1 checkpoint blockade in mouse models, in part by enhancing CD8+ T cell metabolic health through stimulating mitochondrial biogenesis with subsequent increased T cell infiltration and activation.
- 184.Sousa CM et al. Pancreatic stellate cells support tumour metabolism through autophagic alanine secretion. Nature 536, 479–483 (2016). [DOI] [PMC free article] [PubMed] [Google Scholar]
- 185.Zhang W et al. Stromal control of cystine metabolism promotes cancer cell survival in chronic lymphocytic leukaemia. Nat. Cell Biol 14, 276–286 (2012). [DOI] [PMC free article] [PubMed] [Google Scholar]
- 186.Ko Y-H et al. Glutamine fuels a vicious cycle of autophagy in the tumor stroma and oxidative mitochondrial metabolism in epithelial cancer cells: implications for preventing chemotherapy resistance. Cancer Biol. Ther 12, 1085–1097 (2011). [DOI] [PMC free article] [PubMed] [Google Scholar]
- 187.Zhang Z et al. Differential glucose requirement in skin homeostasis and injury identifies a therapeutic target for psoriasis. Nat. Med 24, 617–627 (2018). [DOI] [PMC free article] [PubMed] [Google Scholar]
- 188.Okano T et al. 3-Bromopyruvate ameliorate autoimmune arthritis by modulating TH17/Treg cell differentiation and suppressing dendritic cell activation. Sci. Rep 7, 42412 (2017). [DOI] [PMC free article] [PubMed] [Google Scholar]
- 189.Telang S et al. Discovery of a PFKFB3 inhibitor for phase I trial testing that synergizes with the B-Raf inhibitor vemurafenib. Cancer Metab. 2, P14–P14 (2014). [Google Scholar]
- 190.Kornberg MD et al. Dimethyl fumarate targets GAPDH and aerobic glycolysis to modulate immunity. Science 360, 449–453 (2018). [DOI] [PMC free article] [PubMed] [Google Scholar]
- 191.US National Library of Medicine. ClinicalTrials.gov https://clinicaltrials.gov/ct2/show/NCT02546440 (2020). [DOI] [PubMed]
- 192.Liberti MV et al. A predictive model for selective targeting of the Warburg effect through GAPDH inhibition with a natural product. Cell Metab. 26, 648–659.e8 (2017). [DOI] [PMC free article] [PubMed] [Google Scholar]
- 193.Dunbar EM et al. Phase 1 trial of dichloroacetate (DCA) in adults with recurrent malignant brain tumors. Invest. N. Drugs 32, 452–464 (2014). [DOI] [PMC free article] [PubMed] [Google Scholar]
- 194.US National Library of Medicine. ClinicalTrials.gov https://clinicaltrials.gov/ct2/show/NCT01386632 (2020). [DOI] [PubMed]
- 195.Yeung C et al. Targeting glycolysis through inhibition of lactate dehydrogenase impairs tumor growth in preclinical models of Ewing sarcoma. Cancer Res. 79, 5060–5073 (2019). [DOI] [PMC free article] [PubMed] [Google Scholar]
- 196.Holubarsch Christian J. F. et al. A double-blind randomized multicentre clinical trial to evaluate the efficacy and safety of two doses of etomoxir in comparison with placebo in patients with moderate congestive heart failure: the ERGO (Etomoxir for the Recovery of Glucose Oxidation) study. Clin. Sci 113, 205–212 (2007). [DOI] [PubMed] [Google Scholar]
- 197.Senanayake EL et al. Multicentre double-blind randomized controlled trial of perhexiline as a metabolic modulator to augment myocardial protection in patients with left ventricular hypertrophy undergoing cardiac surgery. Eur. J. Cardiothorac. Surg 48, 354–362 (2015). [DOI] [PubMed] [Google Scholar]
- 198.US National Library of Medicine. ClinicalTrials.gov https://clinicaltrials.gov/ct2/show/NCT00602199 (2020). [DOI] [PubMed]
- 199.US National Library of Medicine. ClinicalTrials.gov https://clinicaltrials.gov/ct2/show/NCT00061646 (2020). [DOI] [PubMed]
- 200.Alkhouri N, Lawitz E, Noureddin M, DeFronzo R & Shulman GI GS-0976 (Firsocostat): an investigational liver-directed acetyl-CoA carboxylase (ACC) inhibitor for the treatment of non-alcoholic steatohepatitis (NASH). Expert. Opin. Investig. Drugs 29, 135–141 (2020). [DOI] [PMC free article] [PubMed] [Google Scholar]
- 201.Meuwese MC et al. ACAT inhibition and progression of carotid atherosclerosis in patients with familial hypercholesterolemia: the CAPTIVATE randomized trial. Jama 301, 1131–1139 (2009). [DOI] [PubMed] [Google Scholar]
- 202.Scharping NE,Menk AV,Whetstone RD, Zeng X & Delgoffe GM Efficacy of PD-1 blockade Is potentiated by metformin-induced reduction of tumor hypoxia. Cancer immunology Res. 5, 9–16 (2017). [DOI] [PMC free article] [PubMed] [Google Scholar]
- 203.US National Library of Medicine. ClinicalTrials.gov https://clinicaltrials.gov/ct2/show/NCT03048500 (2020). [DOI] [PubMed]
- 204.US National Library of Medicine. ClinicalTrials.gov https://clinicaltrials.gov/ct2/show/NCT03800602 (2020). [DOI] [PubMed]
- 205.US National Library of Medicine. ClinicalTrials.gov https://clinicaltrials.gov/ct2/show/NCT03994744 (2020). [DOI] [PubMed]
- 206.Xiang Y et al. Targeted inhibition of tumor-specific glutaminase diminishes cell-autonomous tumorigenesis. J. Clin. Investigation 125, 2293–2306 (2015). [DOI] [PMC free article] [PubMed] [Google Scholar]
- 207.Gross MI et al. Antitumor activity of the glutaminase inhibitor CB-839 in triple-negative breast cancer. Mol. Cancer Therapeutics 13, 890–901 (2014). [DOI] [PubMed] [Google Scholar]
- 208.US National Library of Medicine. ClinicalTrials.gov https://clinicaltrials.gov/ct2/show/NCT04265534 (2020). [DOI] [PubMed]
- 209.Lee CF et al. Preventing allograft rejection by targeting immune metabolism. Cell Rep. 13, 760–770 (2015). [DOI] [PMC free article] [PubMed] [Google Scholar]
- 210.Adjei AA Pemetrexed (ALIMTA), A. Novel multitargeted antineoplastic agent. Clin. Cancer Res 10, 4276s (2004). [DOI] [PubMed] [Google Scholar]
- 211.US National Library of Medicine. ClinicalTrials.gov https://clinicaltrials.gov/ct2/show/NCT03793179 (2020). [DOI] [PubMed]
- 212.Chabner BA, Myers CE, Coleman CN & Johns DG The clinical pharmacology of antineoplastic agents (first of two parts). N. Engl. J. Med 292, 1107–1113 (1975). [DOI] [PubMed] [Google Scholar]
- 213.US National Library of Medicine. ClinicalTrials.gov https://clinicaltrials.gov/ct2/show/NCT00989352 (2020). [DOI] [PubMed]
- 214.US National Library of Medicine. ClinicalTrials.gov https://clinicaltrials.gov/ct2/show/NCT03643276 (2020). [DOI] [PubMed]
- 215.Longley DB, Harkin DP& Johnston PG 5-Fluorouracil: mechanisms of action and clinical strategies. Nat. Rev. Cancer 3, 330–338 (2003). [DOI] [PubMed] [Google Scholar]
- 216.US National Library of Medicine. ClinicalTrials.gov https://clinicaltrials.gov/ct2/show/NCT02997228 (2020). [DOI] [PubMed]
- 217.US National Library of Medicine. ClinicalTrials.gov https://clinicaltrials.gov/ct2/show/NCT03777813 (2020). [DOI] [PubMed]
- 218.Suwannaroj S, Lagoo A, Keisler D & McMurray RW Antioxidants suppress mortality in the female NZB × NZW F1 mouse model of systemic lupus erythematosus (SLE). Lupus 10, 258–265 (2001). [DOI] [PubMed] [Google Scholar]
- 219.US National Library of Medicine. ClinicalTrials.gov https://clinicaltrials.gov/ct2/show/NCT00003346 (2020). [DOI] [PubMed]
- 220.Yang Z et al. Restoring oxidant signaling suppresses proarthritogenic T cell effector functions in rheumatoid arthritis. Sci. Transl Med 8, 331ra338 (2016). [DOI] [PMC free article] [PubMed] [Google Scholar]
- 221.Mele L et al. A new inhibitor of glucose-6-phosphate dehydrogenase blocks pentose phosphate pathway and suppresses malignant proliferation and metastasis in vivo. Cell Death Dis. 9, 572 (2018). [DOI] [PMC free article] [PubMed] [Google Scholar]
- 222.Ricciardiello F et al. Inhibition of the hexosamine biosynthetic pathway by targeting PGM3 causes breast cancer growth arrest and apoptosis. Cell Death Dis. 9, 377 (2018). [DOI] [PMC free article] [PubMed] [Google Scholar]
- 223.Steggerda SM et al. Inhibition of arginase by CB-1158 blocks myeloid cell-mediated immune suppression in the tumor microenvironment. J. Immunother. Cancer 5, 101 (2017). [DOI] [PMC free article] [PubMed] [Google Scholar]
- 224.US National Library of Medicine. ClinicalTrials.gov https://clinicaltrials.gov/ct2/show/NCT03361228 (2020). [DOI] [PubMed]
- 225.US National Library of Medicine. ClinicalTrials.gov https://clinicaltrials.gov/ct2/show/NCT02903914 (2020). [DOI] [PubMed]
- 226.Przystal JM et al. Efficacy of arginine depletion by ADI-PEG20 in an intracranial model of GBM. Cell Death Dis. 9, 1192 (2018). [DOI] [PMC free article] [PubMed] [Google Scholar]
- 227.Prendergast GC, Malachowski WP, DuHadaway JB & Muller AJ Discovery of IDO1 inhibitors: from bench to bedside. Cancer Res. 77, 6795–6811 (2017). [DOI] [PMC free article] [PubMed] [Google Scholar]
- 228.US National Library of Medicine. ClinicalTrials.gov https://clinicaltrials.gov/ct2/show/NCT03493945 (2020). [DOI] [PubMed]
- 229.US National Library of Medicine. ClinicalTrials.gov https://clinicaltrials.gov/ct2/show/NCT04231864 (2020). [DOI] [PubMed]
- 230.US National Library of Medicine. ClinicalTrials.gov https://clinicaltrials.gov/ct2/show/NCT04049669 (2020). [DOI] [PubMed]
- 231.US National Library of Medicine. ClinicalTrials.gov https://ciinicaitrials.gov/ct2/show/NCT02073123 (2020). [DOI] [PubMed]
- 232.Megias-Vericat JE, Ballesta-Lopez O, Barragan E & Montesinos P IDH1-mutated relapsed or refractory AML: current challenges and future prospects. Blood Lymphat. Cancer 9, 19–32 (2019). [DOI] [PMC free article] [PubMed] [Google Scholar]
- 233.US National Library of Medicine. ClinicalTrials.gov https://clinicaltrials.gov/ct2/show/NCT03684811 (2020). [DOI] [PubMed]
- 234.US National Library of Medicine. ClinicalTrials.gov https://clinicaltrials.gov/ct2/show/NCT02719574 (2020). [DOI] [PubMed]
- 235.Li X et al. Navigating metabolic pathways to enhance antitumour immunity and immunotherapy. Nat. Rev. Clin. Oncol 16, 425–441 (2019). [DOI] [PubMed] [Google Scholar]
- 236.US National Library of Medicine. ClinicalTrials.gov https://clinicaltrials.gov/ct2/show/NCT03742102 (2020). [DOI] [PubMed]
- 237.US National Library of Medicine. ClinicalTrials.gov https://clinicaltrials.gov/ct2/show/NCT04262388 (2020). [DOI] [PubMed]
- 238.US National Library of Medicine. ClinicalTrials.gov https://clinicaltrials.gov/ct2/show/NCT02754141 (2020). [DOI] [PubMed]
- 239.US National Library of Medicine. ClinicalTrials.gov https://clinicaltrials.gov/ct2/show/NCT02403193 (2020). [DOI] [PubMed]
- 240.US National Library of Medicine. ClinicalTrials.gov https://clinicaltrials.gov/ct2/show/NCT03337698 (2020). [DOI] [PubMed]
- 241.US National Library of Medicine. ClinicalTrials.gov https://clinicaltrials.gov/ct2/show/NCT03381274 (2020). [DOI] [PubMed]
- 242.Vander Heiden MG & DeBerardinis RJ Understanding the intersections between metabolism and cancer biology. Cell 168, 657–669 (2017). [DOI] [PMC free article] [PubMed] [Google Scholar]
- 243.Saeidi A et al. T-cell exhaustion in chronic infections: reversing the state of exhaustion and reinvigorating optimal protective immune responses. Front. Immunol 9,2569 (2018). [DOI] [PMC free article] [PubMed] [Google Scholar]
- 244.Bengsch B et al. Bioenergetic insufficiencies due to metabolic alterations regulated by the inhibitory receptor PD-1 are an early driver of CD8+ T cell exhaustion. Immunity 45, 358–373 (2016).This paper reports the suppression of glycolysis, mitochondrial dysfunction and mitochondrial biogenesis in CD8+ T cells through PD1 signalling leading to an exhausted T cell phenotype.
- 245.Teijeira A et al. Mitochondrial morphological and functional reprogramming following CD137 (4-1BB) costimulation. Cancer Immunol. Res 6, 798 (2018). [DOI] [PubMed] [Google Scholar]
- 246.Menk AV et al. 4-1BB costimulation induces T cell mitochondrial function and biogenesis enabling cancer immunotherapeutic responses. J. Exp. Med 215, 1091 (2018). [DOI] [PMC free article] [PubMed] [Google Scholar]
- 247.Zhao Z et al. Structural design of engineered costimulation determines tumor rejection kinetics and persistence of CAR T cells. Cancer Cell 28, 415–428 (2015). [DOI] [PMC free article] [PubMed] [Google Scholar]
- 248.Milone MC et al. Chimeric receptors containing CD137 signal transduction domains mediate enhanced survival of T cells and increased antileukemic efficacy in vivo. Mol. Ther 17, 1453–1464 (2009). [DOI] [PMC free article] [PubMed] [Google Scholar]
- 249.Imai C et al. Chimeric receptors with 4-1BB signaling capacity provoke potent cytotoxicity against acute lymphoblastic leukemia. Leukemia 18, 676–684 (2004). [DOI] [PubMed] [Google Scholar]
- 250.Finney HM, Akbar AN & Lawson AD Activation of resting human primary T cells with chimeric receptors: costimulation from CD28, inducible costimulator, CD134, and CD137 in series with signals from the TCRζ chain. J. Immunol 172, 104–113 (2004). [DOI] [PubMed] [Google Scholar]
- 251.Davila ML et al. Efficacy and toxicity management of 19-28z CAR T cell therapy in B cell acute lymphoblastic leukemia. Sci. Transl Med 6, 224ra225 (2014). [DOI] [PMC free article] [PubMed] [Google Scholar]