Abstract
The present study elucidated the structures of three A-type tri- and tetrameric PACs isolated from Cinnamomum verum bark to the level of absolute configuration and determined their dental bioactivity using two therapeutically relevant bioassays. After selecting a PAC oligomer fraction via a biologically diverse bioassay-guided process, in tandem with centrifugal partition chromatography (CPC), phytochemical studies led the isolation of PAC oligomers that represent the main bioactive principles of C. verum: two A-type tetrameric PACs, epicatechin-(2β→O→7,4β→8)-epicatechin-(4β→6)-epicatechin-(2β→O→7,4β→8)-catechin (1) and parameritannin A1 (2), together with a trimer, cinnamtannin B1 (3). Structure determination of the underivatized proanthocyanidins utilized a combination of HRESIMS, ECD, 1D/2D NMR, and 1H iterative Full Spin Analysis (HiFSA) data and led to NMR-based evidence for the deduction of absolute configuration in constituent catechin and epicatechin monomeric units.
Graphical Abstract
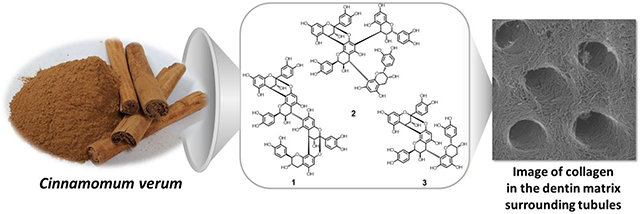
Oligomeric proanthocyanidins (PACs) show promising biomimetic potential for the enhancement of dentin, the bulk tissue of teeth, by cross-linking collagen inter-molecularly and inter-microfibrillarly.1-3 Type I collagen represents 90% of the extracellular matrix of dentin, which serves in a critical structural and protective function for tooth function and survival. The high content of certain, dentin-bioactive PACs from cocoa seeds, grape seeds, pine bark, and cinnamon make these natural materials attractive renewable sources of collagen-crosslinkers with therapeutic potential. The bark of Cinnamomum verum L. (Lauraceae; true cinnamon) investigated in this study has a particularly favorable potential as dentin biomodification agent.4,5
Also known as condensed tannins, PACs are one major class of phenolic plant metabolites that are composed of oligomeric or polymeric flavan-3-ol moieties. PACs have been classified into several subclasses based on the hydroxylation patterns in the A- and B-rings of the flavan-3-ol moieties. Among them, procyanidins consist of catechin and epicatechin (and their enantiomers) as monomeric units and represent the most widely distributed PAC types in plants of the Northern hemisphere.6 Oligomeric PACs (OPACs, degree of polymerization DP=3-10, oligomer definition in analogy to sugar chemistry) present in the bark of C. verum are mainly composed of procyanidins with both A-type (C→C and C→O→C double linkage) and B-type (C→C single linkage) inter-flavan linkages (IFLs). In previous studies, OPACs with a DP = 3–5 exhibited the most potent dentin biomodification potency.7-9 The present study describes the isolation and structure elucidation of A-type tri- and tetrameric PACs (Figure 1) from C. verum bark and the determination of their bioactivity under two relevant dental bioassays, thereby contributing towards the ultimate goal of developing effective and standardized interventional materials for restorative dental therapies. The chemical outcomes provide new insights into IFL types that are unique to C. verum of PACs and are associated with a rapid enhancement of the mechanical properties and reduction in the biodegradability of the dentin matrix.
Figure 1.
Structures of the oligomeric proanthocyanidins (OPACs), 1-3, isolated from C. verum bark, in comparison with their core A-type dimer, proanthocyanidin A2. In addition to the classical chemical formulas, the graphical PAC Block ARray representations (PACBAR; bottom) along with the text-based macro and micro PACBAR codes.10
RESULTS AND DISCUSSION
Diverse Dental Biological Guidance.
Contributing to the greater efforts of our interdisciplinary research activities aimed at the development of PAC-based biomaterials with targeted activity of dentin matrix, a diversity of PAC enriched plant materials (grape seeds, Vitis vinifera; the stem bark of true cinnamon, Cinnamomum verum; the inner barks of pine, Pinus massoniana, seeds of cacao, Theobroma cacao, tea leaves, Camellia sinensis) were previously prioritized for their ability to increase the stiffness of dentin.4,5 Furthermore, single chemical entities were isolated and their activities independently tested to deduce the key structural characteristics of PACs that exhibit dentin matrix biomodification potential, including increased modulus of elasticity and biostability against collagenase digestion. This has brought our work one step closer to developing PAC-based dental biomaterials for future clinical applications.7,9,11
Structure Elucidation of PACs.
Compound 1 was obtained as a brownish amorphous powder, which exhibited a reddish coloration on TLC plates following spraying with vanillin-H2SO4 reagent typical for PACs. The molecular formula was determined to be C60H46O24 by HRESIMS data, suggesting 1 to be a tetrameric procyanidin with two A-type linkages. The 1H and 13C DEPTQ-135 NMR data (Table 1) exhibited resonance patterns consistent with four AMX spin systems, indicating the presence of four 1,3,4-trisubstituted aromatic rings (B-, E-, H-, and K-rings). In addition, the 1H NMR spectrum showed resonances associated with two sets of AX spin systems at δH 4.1028 (I-H-3, d, J = 3.26 Hz)/4.4390 (I-H-4, d, J = 3.26 Hz) and 4.1121 (III-H-3, d, J = 3.48 Hz)/4.1999 (III-H-4, d, J = 3.48 Hz), respectively, which were assigned to H-3 and H-4 of doubly-linked (ent)epicatechin units (A-type PACs). This was also evident from the observation of two ketal carbon resonances at δC 100.31 (III-C-2) and 100.14 (I-C-2) present in the 13C DEPTQ-135 spectrum. The presence of a terminal (ent-)catechin unit in 1 was supported by resonances at δH 4.7358 (IV-H-2, d, J = 8.36 Hz), 4.1605 (IV-H-3, ddd, J = 9.01, 8.36, 5.54 Hz), 3.0201 (IV-H-4a, dd, J = −16.29, 5.54 Hz), and 2.5697 (IV-H-4b, dd, J = −16.29, 9.01 Hz) in the 1H spectrum. In addition, the 1H spectrum exhibited aromatic hydrogen resonances of two meta-coupled hydrogens at δH 6.0858 and 6.0338 (d, J = 2.32 Hz), and three singlets at δH 6.0590, 6.0361, and 6.1141 attributed to H-6/H-8 in each monomeric unit. Further analysis of the 2D NMR data (COSY, ROESY, HSQC, HMBC) allowed unambiguous assignments for all 1H and 13C NMR resonances and indicated a B-type IFL connecting two A-type PAC dimers. The 2→O→7/4→8 linkages between units I/II and III/IV were supported by the following NOE cross-peaks: H-4 (unit I)/H-2 (unit II); H-2',6' (unit I)/H-6 (unit II), and H-4 (unit III)/H-2 (unit IV); H-2',6' (unit III)/H-6 (unit IV), respectively. These linkages were further confirmed by HMBC correlations between H-4 (unit I) and C-8/9 (unit II), and between H-4 (unit III) and C-7/8 (unit IV). The 3,4-trans configuration of the C- (unit I) and I-rings (unit III) were determined by the NOE cross-peaks of H-3 (C-ring)/H-6 (D-ring) and H-3 (I-ring)/H-6 (J-ring), respectively.12 HMBC correlations between H-4 (unit II) and C-5/6/7 (unit III) revealed that units II and III were connected through a 4→6 rather than a 4→8 IFL. This was further supported by the high frequency substituent chemical shift (s.c.s.) effect on the C-6 (unit III) signal, resonating at δc 111.18.7 ROESY correlations between H-8 (unit III, G ring) and H-2'/5' (unit III, H ring) provided additional evidence for the presence of a 4→6 interflavanyl linkage between units II and III. A small coupling constant (3J2,3 = 1.29 Hz) and matching COSY correlation between H-2 and H-3 suggested that these two F-ring hydrogens occupied a cis configuration and formed an (ent)epicatechin moiety (unit II). Moreover, the 2,3-cis-3,4-trans configuration of the F-ring in unit II was deduced from the 3J2,3 and 3J3,4 coupling constants (1.29 and 1.91 Hz, respectively). This was further supported by an s.c.s. effect for the 13C resonance appearing at δC 79.01 (C-2, F-ring), as a result of a γ-gauche effect at C-4 (F-ring), which is consistent with 2,4-trans configuration.11,13-16
Table 1.
| 1 | 2 | ||||
|---|---|---|---|---|---|
| ring | no. | δC, mult. | δH (J, Hz) | δC, mult. | δH (J, Hz) |
| Unit I | |||||
| C | 2 | 100.14, C | 100.15, C | ||
| 3 | 68.30, CH | 4.1028, d (3.26) | 66.81, CH | 3.2929, d (3.57) | |
| 4 | 29.48, CH | 4.4390, d (3.26) | 28.86, CH | 4.2420, d (3.57) | |
| A | 5 | 157.10, C | 156.72, C | ||
| 6 | 98.33, CH | 6.0338, d (2.32) | 98.30, CH | 5.9890, d (2.39) | |
| 7 | 158.07, C | 157.86, C | |||
| 8 | 96.67, CH | 6.0858, d (2.32) | 96.52, CH | 6.0625, d (2.39) | |
| 9 | 154.16, C | 154.23, C | |||
| 10 | 104.41, C | 104.91, C | |||
| B | 1' | 132.60, C | 132.30, C | ||
| 2' | 115.71, CH | 7.1562, d (2.07) | 115.80, CH | 7.1578, d (2.16) | |
| 3' | 145.65, C | 145.54, C | |||
| 4' | 146.72, C | 146.72, C | |||
| 5' | 115.59, CH | 6.8116, d (8.35) | 116.15, CH | 6.8998, d (8.18) | |
| 6' | 119.76, CH | 7.0282, dd (8.35, 2.07) | 119.93, CH | 6.9335, dd (8.18, 2.16) | |
| Unit II | |||||
| F | 2 | 79.01, CH | 5.3371, d (1.29) | 78.71, CH | 5.6628, d (1.02) |
| 3 | 72.49, CH | 3.9669, dd (1.91, 1.29) | 72.43, CH | 4.0708, dd (1.83, 1.02) | |
| 4 | 38.49, CH | 4.7125, d (1.91) | 38.39, CH | 4.4343, d (1.83) | |
| D | 5 | 156.59, C | 154.23, C | ||
| 6 | 96.46, CH | 6.0590, s | 107.72, C | ||
| 7 | 152.26, C | 148.41, C | |||
| 8 | 106.90, C | 106.91, C | |||
| 9 | 152.38, C | 150.29, C | |||
| 10 | 106.02, C | 107.22, C | |||
| E | 1' | 131.63, C | 131.65, C | ||
| 2' | 116.30, CH | 7.1229, dd (2.04, 0.10) | 116.76, CH | 7.3166, d (2.08) | |
| 3' | 146.19, C | 145.77, C | |||
| 4' | 145.87, C | 146.31, C | |||
| 5' | 115.98, CH | 6.7735, dd (8.24, 0.10) | 116.12, CH | 6.8387, d (8.43) | |
| 6' | 120.70, CH | 6.9340, dd (8.24, 2.04) | 121.43, CH | 7.2150, dd (8.43, 2.08) | |
| Unit III | |||||
| I | 2 | 100.31, C | 80.15, CH | 4.1153, d (1.41) | |
| 3 | 67.76, CH | 4.1121, d (3.48) | 67.39, CH | 3.6285, ddd (4.51, 1.99, 1.41) | |
| 4 | 29.76, CH | 4.1999, d (3.48) | 29.73, CH2 | 2.7742, dd (−18.48, 1.99) | |
| 2.7895, dd (−18.48, 4.51) | |||||
| G | 5 | 154.04, C | 155.47, C | ||
| 6 | 111.18, C | 96.60, CH | 6.0798, s | ||
| 7 | 156.74, C | 156.06, C | |||
| 8 | 97.62, CH | 6.0361, s | 108.82, C | ||
| 9 | 152.23, C | 155.56, C | |||
| 10 | 104.32, C | 99.91, C | |||
| H | 1' | 132.14, C | 132.83, C | ||
| 2' | 115.71, CH | 7.1303, dd (2.20, 0.84) | 115.43, CH | 6.6557, d (1.77) | |
| 3' | 146.99, C | 145.88, C | |||
| 4' | 146.80, C | 145.42, C | |||
| 5' | 115.59, CH | 6.8092, dd (8.35, 0.84) | 115.88, CH | 6.7219, d (8.16) | |
| 6' | 119.88, CH | 7.0221, dd (8.35, 2.20) | 119.25, CH | 6.2863, dd (8.16, 1.77) | |
| Unit IV | |||||
| L | 2 | 85.22, CH | 4.7358, d (8.36) | 76.58, CH | 4.7529, d (0.56) |
| 3 | 68.21, CH | 4.1605, ddd (9.01, 8.36, 5.54) | 71.34, CH | 4.0915, d (2.06, 0.56) | |
| 4 | 29.26, CH2 | 3.0201, dd (−16.29, 5.54) | 37.64, CH | 4.3848, d (2.06) | |
| 2.5697, dd (−16.29, 9.01) | |||||
| J | 5 | 156.20, C | 159.41, C | ||
| 6 | 96.75, CH | 6.1141, s | 96.82, CHC | 5.8853, d (2.43) | |
| 7 | 152.14, C | 159.27, C | |||
| 8 | 106.51, C | 97.11, CHC | 5.9336, d (2.43) | ||
| 9 | 151.33, C | 157.86, C | |||
| 10 | 103.19, C | 99.34, C | |||
| K | 1' | 130.11, C | 131.69, C | ||
| 2' | 116.40, CH | 6.9957, dd (1.99, 0.37) | 116.74, CH | 7.1133, d (1.82) | |
| 3' | 146.19, C | 146.31, C | |||
| 4' | 146.80, C | 146.29, C | |||
| 5' | 116.84, CH | 6.8664, dd (8.00, 0.37) | 115.96, CH | 6.9234, d (8.11) | |
| 6' | 121.41, CH | 6.9267, dd (8.00, 1.99) | 120.70, CH | 6.9040, dd (8.11, 1.82) | |
1H and 13C NMR data were acquired in methanol-d4 at 900 and 225 MHz at 298 K, respectively.
The δH and J values were generated via 1H iterative Full Spin Analysis (HiFSA).
These chemical shifts were obtained by the indirect 13C dimension in the HMBC experiment due to signal disappearance caused by H/D exchange of H-6 and H-8 in the J ring.
The absolute configuration of 1, as well as the other OPACs, was determined by ECD spectroscopy.17-19 High amplitude positive and negative Cotton effects in the 220-240 nm window indicated 4β vs. 4α orientation of the flavan-3-ol groups, respectively. A strong positive CE at 228 nm of 1 allowed the assignment of β-orientation at the C-4 positions in rings C, F, and I. On the other hand, flavan-3-ols with 2α and 2β configurations showed low-amplitude negative vs. positive CE at 270-280 nm, respectively.
Summarizing the results thus far, 1 was determined to be comprised of two β-linked A-type dimers (upper and lower half units), which in turn were 4β →6-linked to form a tetramer. While a low-amplitude, negative CE at 272 nm in 1 supported 2α configurations of the constituent flavan-3-ol units, such an interpretation has to be considered tentative due to the nature of the CE caused by the aromatic 1Lb transition, which is dominated by the aryl chromophores attached to the C-4s in OPAC molecules.
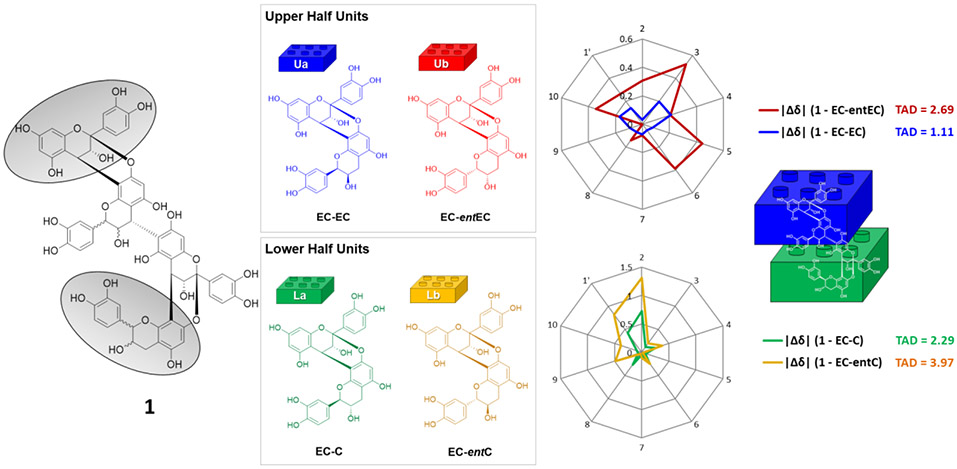
For further confirmation of the stereochemical assignments, we have previously developed a differential 13C chemical shifts (Δδ) method that builds on the comparison of chemical shifts of unknown PACs with those of unambiguously established monomeric and oligomeric PAC building blocks.7,11 The absolute configurations at C-2/C-3 in the F- and L-rings were determined by comparison of the 13C NMR chemical shifts of C-2/3/4/5/6/7/8/9/10/1' with those of possible dimeric PACs (Figure 2): proanthocyanidin A2 (epicatechin-epicatechin), epicatechin-(2β→O→7,4β→8)-ent-epicatechin (epicatechin-ent epicatechin), proanthocyanidin A1 (epicatechin-catechin), and proanthocyanidin A4 (epicatechin-ent catechin); these compounds have been previously isolated in our laboratory from pine bark (Pinus massoniana).7,9 Although the (2R,3R,4S) absolute configurations of the F-ring in the upper half unit was already confirmed by the high-amplitude CE at 228 nm, the small pyran-ring coupling constants (3J2,3, 2J3,4), and the relatively shielded resonance of C-2, the configuration of the upper dimeric unit was also confirmed by this method to verify its validity.
Figure 2.
Determination of the absolute configuration of 1 via comparison of 13C chemical shift differences with those of its four stereochemically possible A-type dimeric PAC moieties.
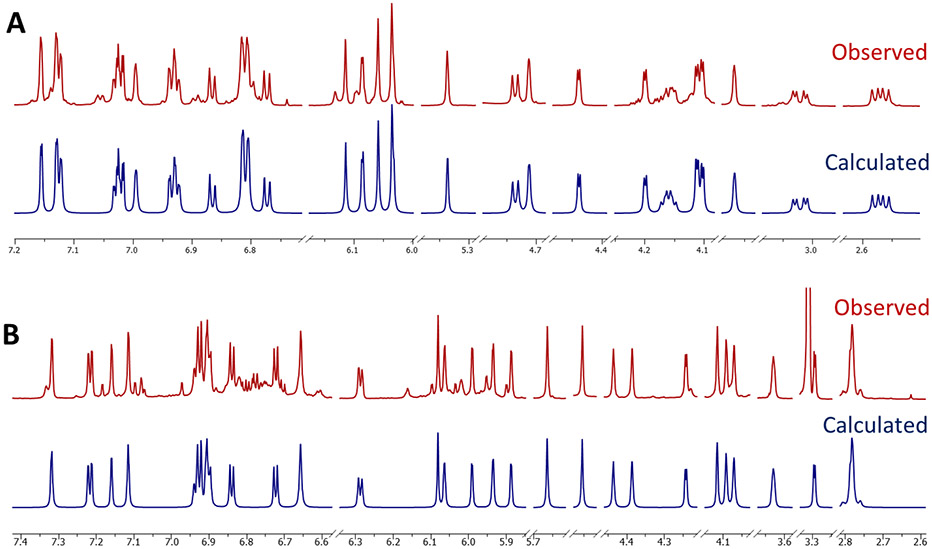
Next, differential 13C chemical shift values (Δδ [ppm]) were calculated using the values of units I and IV, as the chemical shifts in units II and III were affected by the additional β connection between them. As shown in Figure 2, the total absolute deviation (TAD) values: ∑∣Δδ∣ [ppm] calculated for proanthocyanidin A2 (EC-EC, blue for the upper half unit: TAD = 1.11) and proanthocyanidin A1 (EC-C, green for the lower half unit: TAD = 2.29) were significantly smaller than those of their counterparts, epicatechin-(2β→O→7,4β→8)-ent-epicatechin (EC-entEC, red; TAD = 2.69) and proanthocyanidin A4 (EC-entC, yellow; TAD = 3.97). In addition, the 13C chemical shifts of C-2 and C-9 in unit IV (ring L) were 85.22 and 151.33 ppm, respectively, and are reliable indicators of the absolute configurations of A-type dimeric PACs possessing catechin as a terminal unit.7 This led to the conclusion that the upper and lower half dimeric units were proanthocyanidin A2 (blue) and A1 (green), respectively. Accordingly, the structure of 1 was most compatible with that of the tetrameric PAC, epicatechin-(2β→O→7,4β→8)-epicatechin-(4β→6)-epicatechin-(2β→O→7,4β→8)-catechin, named peanut procyanidin E, as it was first isolated from peanut skin.20 While the data obtained for 1 is fully consistent with the structure of a previously reported chemical entity, this represents the first complete determination of its absolute configuration and also represents the first report of its unequivocal NMR data analysis, acquired at room temperature. Moreover, complete 1H NMR assignments of 1 were achieved by 1H iterative full spin analysis (HiFSA) in the present study, allowing for a highly precise determination of all its 1H NMR parameters (δH with 0.1 ppb and J values with 10 mHz precision; Table 1, Figure 3).
Figure 3.
The congruence of the observed (red, methanol-d4, 900 MHz) and calculated (blue) 1H NMR spectra of OPACs 1 (A) and 2 (B) demonstrates the validity of the HiFSA profiles of the two isolates.
Purification also afforded PAC 2 as a brownish amorphous powder and, analogous to 1, its molecular formula of C60H48O24 was determined by HRESIMS data ([M + H]+ m/z 1153.2597), also indicating it to be a tetrameric PAC with one A- and two B-type interflavanyl linkage. In order to resolve the complexity of its 1H NMR spectrum, which arose from severe signal overlap and higher order spin coupling effects, 1H iterative Full Spin Analysis (HiFSA) was applied and yielded detailed NMR spin parameters for 2, as well as for 1 (Table 1, Figure 3). Two pairs of meta-coupled doublets for H-6 and H-8 were observed in the 1H NMR spectrum of 2, indicating the presence of two A-rings without substitution at either C-6 or C-8. Moreover, in the 1H NMR spectrum, only one singlet for H-6 or H-8 in the A-ring of the terminal unit was observed, indicating that 2 possesses a fully substituted A-ring in the middle of the PAC oligomer sequence.
The 1H and 13C DEPTQ 135 NMR spectra showed signals for four AMX spin systems (B-, E-, H-, and K rings). Moreover, the 1H NMR spectrum exhibited an AX spin system with resonances at δH 3.2929 (I-H-3, d, J = 3.57 Hz)/4.2420 (I-H-4, J = 3.57 Hz) assigned to H-3 and H-4 in the C-ring (unit I) of a doubly-linked A-type PAC, which was further supported by the presence of a ketal carbon resonance at δC 100.15 (C-2, C-ring). The 2→O→7/4→8 linkage between units I and II was supported by the ROESY correlation between H-4 (unit I) and H-2 (unit II). The terminal unit was identified as an (ent)epicatechin moiety based on the 1H resonances at δH 4.1153 (III-H-2, d, J = 1.41 Hz), 3.6285 (III-H-3, ddd, J = 4.51, 1.99, 1.41 Hz), 2.7742 (III-H-4a, dd, J = −18.48, 1.99 Hz), and 2.7895 (III-H-4b, dd, J = −18.48, 4.51 Hz). Additional resonances for H-2/3/4 of the flavan-3-ol pyran rings were observed at δH 5.6628 (II-H-2, d, J = 1.02 Hz), 4.0708 (II-H-3, dd, J = 1.83, 1.02 Hz), 4.4343 (II-H-4, d, J = 1.83 Hz), 4.7529 (IV-H-2, d, J = 0.56 Hz), 4.0915 (IV-H-3, dd, J = 2.06, 0.56 Hz), and 4.3848 (IV-H-4, d, J = 2.06 Hz). This suggested B-type linkages between units II and III as well as units IV and II, which were thereby both assigned to have 2,3-cis-3,4-trans configurations. The HMBC cross-peaks of H-4 (L-ring, unit IV)/C-5,6,7 (D-ring, unit II) and H-4 (F-ring, unit II)/C-8,9 (G-ring, unit III) confirmed the 6 → 4 (between units II and IV) and the 8 → 4 (between units II and III) interflavanyl linkages, respectively. Further detailed analysis of the 2D NMR data (COSY, ROESY, HSQC, HMBC), the ECD spectra (strong positive CE at 237 nm and weak negative CE at 273 nm), and NMR data comparison with literature data eventually identified 2 as epicatechin-(2β→O→7,4β→8)-[epicatechin-(4β→6)]-epicatechin-(4β→8)-epicatechin, previously named parameritannin A1.21,22 This compound was originally isolated from the bark of Parameria laevigata, and its structure was confirmed by thiolytic degradation.21 While 2 has also been isolated from other Cinnamomum species (C. cassia, C. tamala, and C. osmophloeum), this is the first report of its presence in C. verum (C. zeylanicum).23-25
Notably, 2 experienced H/D exchange during dissolution in the deuterated protic NMR solvent (methanol-d4), as became evident when acquiring 1H NMR spectra at different time points (Figure S25, Supporting Information). As a result of the exchange process, the signals of H-6 and H-8 of unit IV disappeared after only a few days. While this phenomenon has been observed with flavonoids, including OPACs and anthocyanidins,26-28 as detailed in our previous report on OPACs from Pinus massoniana bark,9 it poses a practical challenge for the structure elucidation of PACs, which typically requires multiple NMR measurements over a period of time.
The molecular formula (C45H36O18, HRESIMS molecular ion at m/z 865.1965 [M + H]+, calcd for C45H37O18, 865.1980) and TLC color reactivity suggested 3 to be a trimeric PAC with one A- and one B-type IFL. The 1H and 13C-DEPTQ-135 NMR spectra and the ECD spectrum of 3 were consistent with those of the reported trimeric PAC, cinnamtannin B1 [epicatechin-(2β→O→7,4β→8)-epicatechin-(4β→8)-epicatechin], which was previously isolated from C. verum.21,24,29 HiFSA was applied to again yield definitive 1H NMR parameters for both the major and the minor conformers of 3 (Table 2, Figure 6). This demonstrates that HiFSA is capable of distinguishing and characterizing multiple conformers found in relatively complex mixtures.
Table 2.
| C no. | 3a (Major rotamer) | 3b (Minor rotamer) | ||
|---|---|---|---|---|
| Unit I | δC | δH (J, Hz) | δC | δH (J, Hz) |
| 2 | 99.93 | 100.12 | ||
| 3 | 67.17 | 3.2818, d (3.43) | 68.34 | 4.0953, d (3.43) |
| 4 | 28.86 | 4.1479, d (3.43) | 29.48 | 4.4537, d (3.43) |
| 5 | 156.75 | 157.15 | ||
| 6 | 98.27 | 5.9651, d (2.34) | 98.27 | 6.0228, d (2.34) |
| 7 | 157.82 | 158.11 | ||
| 8 | 96.53 | 6.0138, d (2.34) | 96.64 | 6.0782, d (2.34) |
| 9 | 154.14 | 154.18 | ||
| 10 | 104.93 | 104.25 | ||
| 1' | 132.44 | 132.59 | ||
| 2' | 115.73 | 7.0317, d (2.17) | 115.70 | 7.1640, d (2.17) |
| 3' | 145.46 | 145.65 | ||
| 4' | 146.60 | 146.74 | ||
| 5' | 115.73 | 6.8239, d (8.27) | 115.60 | 6.8162, d (8.26) |
| 6' | 119.85 | 6.8483, dd (8.27, 2.17) | 119.75 | 7.0380, dd (8.26, 2.17) |
| Unit II | ||||
| 2 | 78.85 | 5.7054, d (0.78) | 78.88 | 5.2571, d (0.56) |
| 3 | 72.56 | 4.1217, dd (1.96, 0.78) | 73.19 | 3.9430, dd (1.93, 0.56) |
| 4 | 38.27 | 4.5593, d (1.96) | 37.96 | 4.6766, d (1.93) |
| 5 | 155.75 | 156.59 | ||
| 6 | 96.03 | 5.8003, s | 96.44 | 6.1082, s |
| 7 | 151.07 | 152.46 | ||
| 8 | 106.38 | 107.13 | ||
| 9 | 151.78 | 152.52 | ||
| 10 | 106.71 | 105.34 | ||
| 1' | 131.77 | 131.60 | ||
| 2' | 116.71 | 7.3167, d (2.08) | 116.08 | 7.0915, dd (2.25, 0.56) |
| 3' | 145.88 | 145.91 | ||
| 4' | 146.27 | 146.22 | ||
| 5' | 116.11 | 6.8426, d (8.19) | 116.08 | 6.7821, dd (8.24, 0.56) |
| 6' | 121.33 | 7.1932, dd (8.19, 2.08) | 120.53 | 6.9281, dd (8.24, 2.25) |
| Unit III | ||||
| 2 | 80.28 | 4.3867, s | 79.73 | 4.9645, s |
| 3 | 67.52 | 3.8613, dd (4.86, 1.92) | 67.06 | 4.2719, dd (4.76, 3.22) |
| 4 | 29.86 | 2.8466, dd (−17.36, 4.86) | 29.68 | 2.9346, dd (−17.37, 4.76) |
| 2.8205, dd (−17.36, 1.92) | 2.7948, dd (−17.37, 3.22) | |||
| 5 | 156.03 | 156.48 | ||
| 6 | 96.41 | 6.1030, s | 97.38 | 5.9055, s |
| 7 | 155.56 | 156.27 | ||
| 8 | 108.82 | 107.60 | ||
| 9 | 155.80 | 154.58 | ||
| 10 | 99.99 | 100.33 | ||
| 1' | 133.17 | 132.14 | ||
| 2' | 115.46 | 6.8227, d (2.03) | 115.22 | 7.1121, dd (2.01, 0.35) |
| 3' | 145.74 | 145.93 | ||
| 4' | 145.31 | 145.66 | ||
| 5' | 115.98 | 6.7518, d (8.16) | 115.98 | 6.7527, dd (8.16, 0.35) |
| 6' | 119.41 | 6.7281, dd (8.16, 2.03) | 119.08 | 6.8873, dd (8.16. 2.01) |
1H and 13C NMR data were acquired in methanol-d4 at 900 and 225 MHz at 298 K, respectively.
The δH and J values were generated via 1H iterative Full Spin Analysis (HiFSA).
Figure 6.
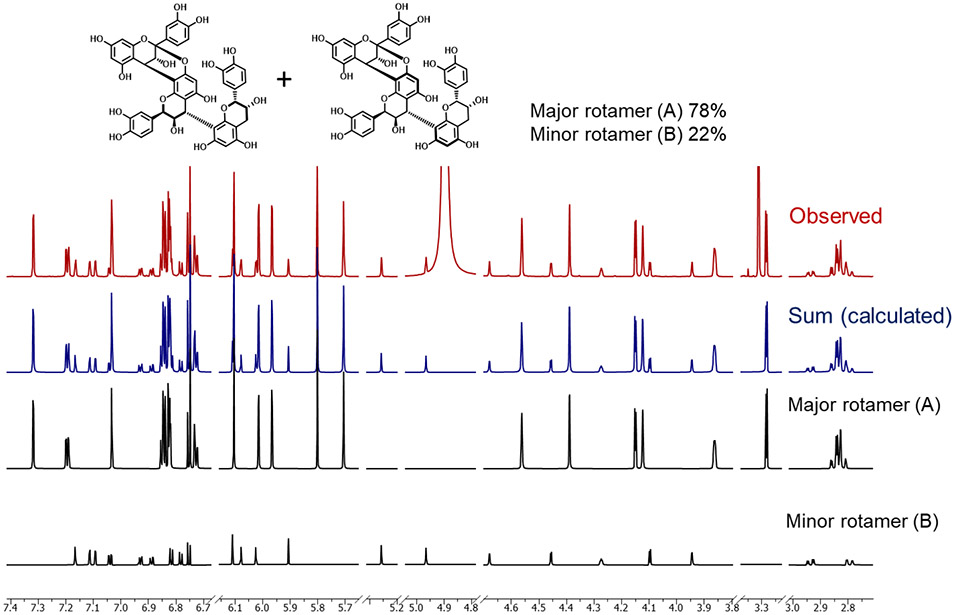
Quantitative and qualitative 1H NMR HiFSA-based determination of the major (A) and minor rotamers (B) of 3. The experimental (observed, red) spectrum was acquired at 900 MHz in methanol-d4.
Atropisomerism in OPACs.
The NMR spectra of OPACs frequently show peak broadening when acquired at room temperature. This is due to sterically hindered rotation along the interflavanyl bonds, which generates conformers and, at certain local energy minima, atropisomers. This dynamic phenomenon and the occurrence of atropisomerism is more frequently observed as the degree of polymerization of OPACs increases and/or the oligomers contain more B-type IFLs. Peak broadening can be overcome by low-temperature NMR experiments (high temperature measurements are also possible, but pose stability and solvent challenges), which enable the acquisition of interpretable spectra.9,11,30-32
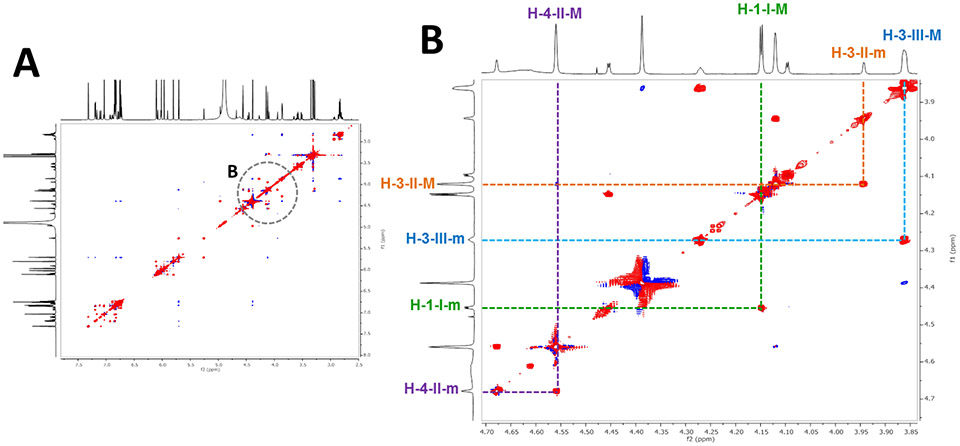
Atropisomerism also produces the occurrence of (typically) pairs of resonances from major and minor rotamers. Such signals can be misinterpreted as arising from impurities, but indeed can be distinguished via exchange correlation peaks in ROESY spectra where such cross peaks appear in-phase with the diagonal (Figure 4). In contrast, the atropisomers interconvert slowly on the NMR time scale.33 As shown for the 1H NMR spectra of 3 at various temperatures (Figure 5), signals from two atropisomers eventually reach coalescence as the temperature increases. This reflects the energy barrier of the rotation about the interflavanyl bond, which requires elevated temperatures to be overcome vs. creates locked-in rotamers at lower temperatures. To calibrate the experimental temperature settings, neat MeOH and ethylene glycol were used as “NMR thermometers”, allowing calculation of the actual temperatures based on the distances between the solvent resonances. While the NMR spectra of 1-3 acquired at RT could be interpreted sufficiently for structure elucidation, low temperature spectra were acquired to compare the chemical shift changes of the major and minor rotamer resonances. This gave conclusive evidence of coalescence and, thereby, the assignment of atropisomer signals.
Figure 4.
The ROESY spectrum (900 MHz) shows exchange correlation cross peaks between the two atropisomers of 3 giving rise to signals that exhibit the same phase as the diagonal (red; “in-phase” cross peaks). The major and minor atropisomers are denoted as M and m, respectively.
Figure 5.
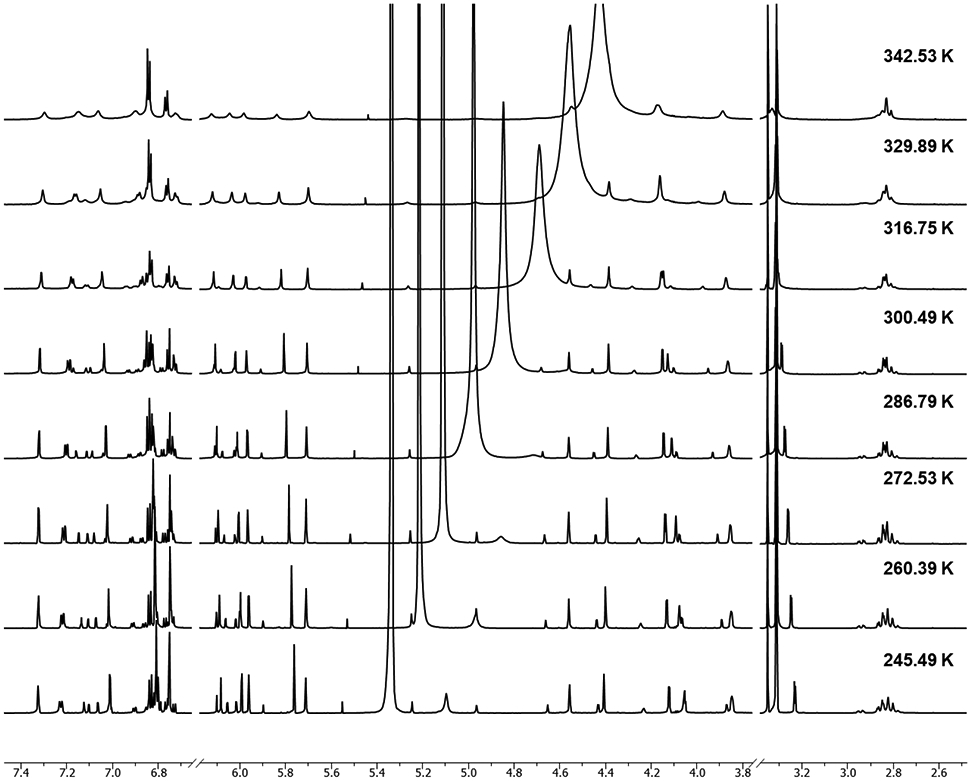
Stacked 1H NMR spectra of 3 acquired at various temperatures in methanol-d4 (800 MHz).
HiFSA-based qNMR (QM-qNMR) of Major and Minor Rotamers of 3.
As the occurrence of rotameric species gives rise to sets of distinct resonances for the same molecule, such as shown above for 3, the 1H NMR spectra of OPACs pose inherent challenges for quantitative NMR (qNMR): conventional peak integration often becomes unfeasible, not only due to severe signal overlap, but also as a result of higher order effects, particularly in the relatively disperse aromatic region, which otherwise would be the most suitable spectral window for qNMR. To overcome these challenges and still quantify the rotamers of 3, quantum mechanical (QM) based quantitative 1H NMR (QM-qHNMR) was applied, utilizing 1H iterative full spin analysis as QM analytical method (Figure 6).34,35 The HiFSA approach considered both structural parameters (δ, J) and signal line shape (ω1/2), and yielded quantum-mechanically calculated spectra of the major and minor rotamers. In a subsequent step, iteration of a composite spectrum was performed until the sum of the two rotamer spectra was in full agreement with the experimental spectrum. The area for H-6s and H-8s had to be excluded from the qNMR calculation as the peak integrations were reduced due to H-D exchange (see discussion above), which would be associated with an overall quantitation error. Collectively, the molar ratio of the rotamers was calculated to be 78% for the major species vs. 22% for the minor species. This result confirms previously reported rotamer proportions that were calculated for the same compound via 1H NMR integral comparison.36
Evaluation of the Dentin Biomodification of OPACs 1-3.
As shown previously, the degree of polymerization (DP) and, importantly, the spatial/3D configuration of PACs are key factors for their dentin biomodification activities. Most favorable bioactivities are observed for trimeric and tetrameric PACs with a suitable size and shape that fits into the interfibrillar gaps between dentin’s collagen fibers, for efficient cross-linking. Compounds 1-3 were isolated from the dentin bioactive fractions by multiple steps of chromatography. They increased the apparent modulus of elasticity (p ≤ 0.001) and reduced biodegradation (p < 0.001) of the dentin matrix, when compared to a control (Figure 7). There were no statistically significant differences among the effects of the three compounds in both biomechanical and biodegradation assays (p ≥ 0.05).
Figure 7.
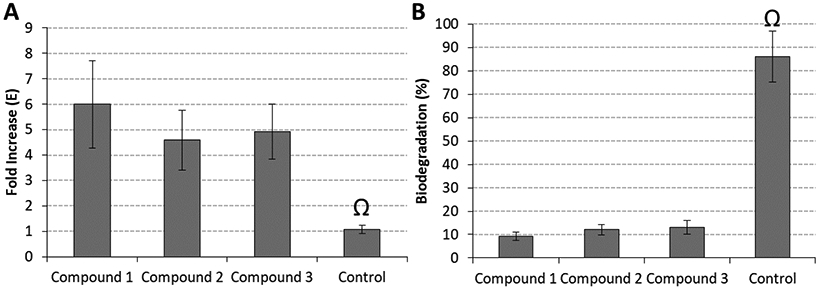
Biomodification potential by two relevant bioassays: (A) fold increase observed in the apparent modulus of elasticity (E) of the dentin matrix; (B) biodegradation rates (in %) of dentin specimens treated with 1–3. The Ω symbol depicts statistically significant differences between groups treated with 1-3 and control for both E (p ≤ 0.001) and biodegradation (p < 0.001).
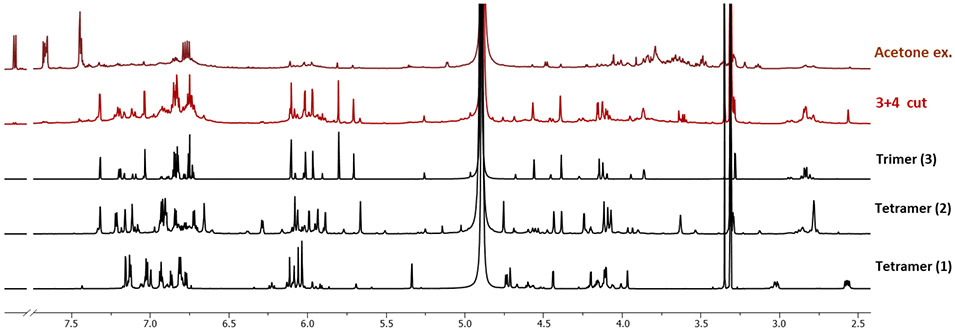
Compounds 2 (parameritannin A1) and 3 (cinnamtannin B1) are the major tetramer and trimer of C. verum bark, respectively, as shown by the stacked 1H NMR spectra in Figure 8 in comparison with the extract. Compiling the dentin biomodification activities and NMR profiles of these isolates, it became evident that increased content of these high-potency trimers and tetramers validate the overarching concept of these medium-DP PACs being responsible for favorable dentin bioactivity. This result confirmed the validity of the overarching concept of our studies, aimed at preparing a trimer- and tetramer-enriched fraction as active constituent for future clinical applications.8
Figure 8.
The 1H NMR spectra of a 70% acetone extract, a trimer and tetramer enriched fraction (3+4 cut), and the isolates 1-3 from C. verum. The fraction 3+4 cut (red) was prepared in a prior study8 and its 1H NMR spectrum is shown for comparison. The 1H NMR spectra of the 70% acetone extract and the 3+4 cut were acquired under the same conditions (concentration, volume, NMR acquisition parameters, 600 MHz, methanol-d4). The 1H NMR spectra of 1-3 were acquired at 900 MHz in methanol-d4.
Conclusions Regarding the Stereochemistry and Inter-flavanyl Linkage Chemistry of PACs.
As a collective result of published and present studies, the 3D conformational differences of OPAC molecules, which reflect both their planar and their specific 3D structure, guide their dentin biomodification potential as examined in two mechanistically distinct bioassays.1,7-9,11 Thus, determination of both the relative and absolute configurations of PACs is critically important when seeking to derive structure activity relationships. Notably, this task needs to be performed with underivatized PACs and without the application of degradation chemistry for structure elucidation, to allow their subsequent biological evaluation. The abundance of stereocenters and resulting structural permutations, paired with the complexity of their (NMR) spectra makes the unambiguous structural analysis of OPACs a demanding task. In order to achieve this, the following is a list of recommended critical check points for the unambiguous stereochemical elucidation of OPACs, which emerged from the present study and in conjunction with our prior OPAC studies.
Doubly-linked A-type dimers have two possible connection types, 2→O→7/4→6 and 2→O→7/4→8. The 2→O→7/4→8 linked structures can be differentiated by the NOE cross-peaks of H-4 (upper unit)/H-2 (lower unit) and H-2',6' (upper unit)/H-6 (lower unit).
A 3,4-trans configuration in the upper unit of A-type dimeric moieties can be confirmed by the NOE correlations between H-3 (upper unit) and H-8 or H-6 (lower unit).
The 4→6 and 4→8 interflavanyl linkages are determined by the 13C chemical shifts of C-6 or C-8 of the lower units. A deshielded resonance for C-6 of a lower unit (as in 4→6 linked OPACs) is typically observed around δC 110-111 ppm, whereas that for C-8 (as in 4→8 linked OPACs) appears at δC 106-108 ppm. However, this general rule has exceptions in the case of structures in which both C-6 and C-8 are substituted simultaneously.20,37 In these cases, additional evidence from NOE cross-peaks [H-8 (unit III, G ring) and H-2'/5' (unit III, H ring) for compound 1] are essential to confirm 4→6 vs. 4→8 interflavanyl linkages.
The relative configurations of C-2/C-3/C-4 in B-type linked structures can be determined by the H,H-coupling constants. The 2,3-cis-3,4-trans configuration is differentiated from the 2,3-cis-3,4-cis configuration based on the value of JH-3,H-4 (≥ 4 Hz) and the low frequency chemical shift of C-2 induced by a γ-gauche effect affecting C-4 in (ent)epicatechin containing structures. On the other hand, the 2,3-trans-3,4-trans configuration can be differentiated from the 2,3-trans-3,4-cis configuration by the value of JH-3,H-4 (3,4-cis: J3,4 = 6.5 Hz, 3,4-trans: J3,4 = 8.3 Hz) in (ent)catechin containing structures.
The ECD curve is used for the determinations of the absolute configurations at C-4s and C-2s. A 4β configuration of the interflavanyl linkage is confirmed by the strong positive CE at 220-240 nm in the ECD spectrum.
The configuration at C-2 is determined based on the CE at 270-280 nm observed in the ECD spectrum: 2α vs. 2β configurations exhibit low-amplitude negative vs positive ECD CEs, respectively. However, due to difficulties with the interpretation of low amplitude CEs in this region, the determination of differential chemical shifts effects (Δδ)7,11 is a more robust method and can confirm this aspect of absolute configurations in a non-destructive manner.
EXPERIMENTAL SECTION
General Experimental Procedures.
The ECD spectra were measured on a Jasco J-710 circular dichroism spectrometer. Mass spectrometry was carried out with an IT-TOF hybrid mass spectrometer (IT-TOF LC-MS, Shimadzu, Kyoto, Japan). The first preparative fractionation was performed on a centrifugal partition chromatography (CPC) extractor, SCPC-250-B (Armen Instrument Gilson Inc. SAS, France), which was equipped with a 250 mL rotor and a 50 mL sample loop. Sephadex LH-20 (Sigma) was used for column chromatography. Preparative HPLC was carried out using a Waters 600 HPLC system equipped with a Waters 2996 photodiode array detector, using a YMC-Pack ODS-AQ (250 × 10 mm, S-5, 12 nm) column. The normal phase HPLC profiles of CPC fractions were obtained using a Phenomenex Develosil Diol 100A (250 × 4.6 mm) column. 1D and 2D NMR experiments were performed on a Bruker 900 MHz AVANCE II spectrometer equipped with a 5-mm TCI cryoprobe with the sample temperature regulated at 25 °C (298 K). Low temperature NMR spectra of 1 and 3 were acquired on a Bruker 800 MHz AVANCE II spectrometer equipped with a TXI RT probe at different temperatures (setting temperatures: 255, 268, 278, 288, 298, 310, 320, and 330 K). To calibrate the temperature, 100% ethylene glycol and 100% MeOH were used for high and low temperatures, respectively. The 1H NMR spectra of the 70 % acetone extract and the trimeric and tetrameric enriched fraction were acquired on a Bruker 600 MHz AVANCE spectrometer equipped with TXI cryoprobe in methanol-d4. The chemical shifts of the residual solvent signals at δH 3.3100 and δC 49.00 were used as the references. The 1H NMR data were processed with MestReNova (ver. 9.0.0-12821, Mestrelab Research, Santiago de Compostela, Spain) using a Lorentzian-Gaussian window function (line broadening = −0.3, Gaussian factor = 0.05) and double zero-filling prior to Fourier transformation.
Plant Material.
The dried powder (484 g) of stem bark of Cinnamomum verum was purchased from Oregon’s Wild Harvest (Oregon’s Wild Harvest, Sandy, Oregon, USA) in 2012 (No. CIN-07011p-OMH01).
Extraction and Isolation.
The dried powder of C. verum (484 g) was extracted with 70 % acetone in water (3 × 1 L) overnight at room temperature. The solvent was evaporated in vacuo to afford a concentrated extract, which was freeze-dried to produce dried powder. The extract (5 g) was subjected to separation on a CPC extractor using the methods as described in a recent report.8 Briefly, the fractionation was performed in the ascending mode (tail to head) using a solvent system consisting of EtOAc/EtOH/water = 6:1:5 v/v. The rotor speed was set at 500 rpm for filling the coil with the stationary phase and changed to 2500 rpm for equilibration with the mobile phase. The stationary retention volume ratio (Sf) was 0.6, which was calculated by (Vcolumn-Vmobile phase)/Vcolumn. The powdered extract (5 g) was dissolved in 50 mL of stationary/mobile phase (50/50) mixture and injected after equilibrium. The fractionation was run in elution-extrusion CPC method.38 The elution was performed (0.4 min/tube, 30 mL/min) with 500 mL of mobile phase, followed by the extrusion with 500 mL of stationary phase affording 80 fractions which were pooled into 8 fractions on the basis of their TLC profiles. The mixture of CPC fraction 4 (CPC4, 150 mg) was chromatographed on Sephadex LH-20 (2 x 45 cm) with 1:4 MeOH/water followed with 1:1 acetone/water and finally with 7:3 acetone/water to afford four subfractions (CPC4S1-CPC4S4). Fraction CPC4S1 was purified by C18 reversed-phase HPLC using an isocratic mixture of MeCN-0.1% formic acid in water (15:85, 2mL/min) as a solvent system to afford compound 1 (5 mg). Compound 2 (8.5 mg) was purified from the CPC fraction 5 by diol normal phase HPLC using a gradient solvent system which was used for the fraction monitoring [A] MeCN/HOAc = 98:2, [B] MeOH/water/HOAc = 95:3:2]. CPC fraction 2 (CPC2, 120 mg) was subjected to Sephadex LH-20 column chromatography (2 x 45 cm) using the same solvent system that was used for CPC5, to provide three subfractions (CPC2S1-CPC2S3). Fraction CPC2S2 was further separated by C18 reversed-phase HPLC, eluted with an isocratic mixture of MeCN-0.1% formic acid in water (15:85, 2mL/min), to yield compound 3 (10 mg). The purities (%, w/w) of 1-3 were calculated as 94.4, 88.6, and 90.3%, respectively, using the 100% qHNMR method (Figures S27-S29, Supporting Information).39
Epicatechin-(2β→O→7,4β→8)-epicatechin-(4β→6)-epicatechin-(2β→O→7,4β→8)-catechin (1):
brown amorphous powder; ECD (MeOH) λmax (Δε) = 228 (+20.84), 272 (−2.53) nm; 1H and 13C NNMR, see Table 1; HRESIMS [M - H]− m/z 1149.2256 (calcd for C60H45O24, 1149.2301).
Epicatechin-(2β→O→7,4β→8)-[epicatechin-(4β→6)]-epicatechin-(4β→8)-epicatechin (parameritannin A1, 2):
brown amorphous powder; ECD (MeOH) λmax (Δε) = 237 (+17.20), 273 (−1.13) nm; 1H and 13C NNMR, see Table 2; HRESIMS [M + H]+ m/z 1153.2597 (calcd for C60H49O24, 1153.2613).
Epicatechin-(2β→O→7,4β→8)-epicatechin-(4β→8)-epicatechin (cinnamtannin B1, 3):
brown amorphous powder; ECD (MeOH) λmax (Δε) = 231 (+54.74), 275 (−5.24) nm; 1H and 13C NNMR, see Table 2; HRESIMS [M + H]+ m/z 865.1965 (calcd for C45H37O18, 865.1980).
Computer-Aided NMR Spectral Analysis.
PERCH NMR software package (ver. 2013.1, PERCH Solutions Ltd., Kuopio, Finland) was used for the 1H iterative Full Spin Analysis (HiFSA) as described in the previous study.40,41 The resulting HiFSA NMR parameters for 1-3 are documented as text files (.pms). For the quantitative analysis of the rotameric population of 3, the HiFSA parameters of the major and minor rotamers were combined into a single .pms file and imported to the PMS module. Subsequent optimization of the calculated NMR spectra against the experimental spectrum of 3 used QMTLS iteration. The relative population of each rotamer was obtained.
Dentin Activity Bioassay for Compounds 1-3.
Two dentin bioassays were conducted after approval by the Institutional Review Board Committee of the University of Illinois at Chicago (protocol No. 2011-0312). A biomechanical assay utilized demineralized dentin matrices (0.5 mm thickness × 1.7 mm width × 6.0 mm length). The apparent modulus of elasticity was assessed under the 3-point bending method7,42 before and after the 1-hour treatment with compounds 1-3 prepared at 0.65 % w/v in HEPES buffer at pH 7.2 (n = 5).5,42 Control groups were kept immersed in buffer only. Data were expressed as fold variation of the apparent modulus of elasticity of the dentin matrix before (baseline) and after treatment. The dentin matrix biodegradation bioassay was carried out with the same dentin specimens (n = 5). Dentin specimens were dry weighed before (M1) and after (M2) exposure to collagenase digestion media, to calculate the percentage weight of biodegradation (%).1,5 Digestion protocol used 2 mL/specimen of bacterial collagenase (100 μg/mL Clostridium histolyticum; Sigma-Aldrich, St. Louis, Missouri, US) in 0.2 M NH4HCO3 buffer (pH 7.9) for 24 h at 37°C. Data were statistically analyzed by one-way ANOVA and Tukey’s post hoc test (α = 0.05).
Supplementary Material
ACKNOWLEDGMENT
This study was funded by grants R01DE021040, R56DE021040, and R01DE028194 from NIDCR/NIH. The authors would like to acknowledge that the purchase of the 800 MHz NMR spectrometer used in these studies was funded by grant P41 GM068944 from NIGMS/NIH awarded to Dr. Peter Gettins.
Footnotes
Supporting Information.
This paper represents part 37 of the series on Residual Complexity and Bioactivity (see http://go.uic.edu/residualcomplexity). The Supporting Information is available free of charge on the ACS Publications website. This includes: the 1D/2D NMR spectra; qHNMR profiles; ECD spectra; PERCH-generated *.pms files (spectra parameter files) of 1-3; the QM-qHNMR analysis result of the major and minor atropisomers of 3.
Binary analytical data (original NMR FIDs, spreadsheets, PMS/MMS files) are available upon request and DOI https://doi.org/10.7910/DVN/F5PJY3.
The authors declare no competing financial interest.
REFERENCES
- 1.Vidal CMP; Leme AA; Aguiar TR; Phansalkar RS; Nam J-W; Bisson J; McAlpine JB; Chen S-N; Pauli GF; Bedran-Russo AK, Langmuir 2014, 30, 14887–14893. [DOI] [PMC free article] [PubMed] [Google Scholar]
- 2.He L; Mu C; Shi J; Zhang Q; Shi B; Lin W, Int. J. Biol. Macromol 2011, 48, 354–359. [DOI] [PubMed] [Google Scholar]
- 3.Bedran-Russo AK; Pashley DH; Agee K; Drummond JL; Miescke KJ, J. Biomed. Mater. Res. Part B Appl. Biomater 2008, 86, 330–334. [DOI] [PubMed] [Google Scholar]
- 4.Aydin B; Leme-Kraus AA; Vidal CMP; Aguiar TR; Phansalkar RS; Nam J-W; McAlpine JB; Chen S-N; Pauli GF; Bedran-Russo AK, Dent. Mater 2019, 35, 328–334. [DOI] [PMC free article] [PubMed] [Google Scholar]
- 5.Aguiar TR; Vidal CMP; Phansalkar RS; Todorova I; Napolitano JG; McAlpine JB; Chen SN; Pauli GF; Bedran-Russo AK, J. Dent. Res 2014, 93, 417–422. [DOI] [PMC free article] [PubMed] [Google Scholar]
- 6.Ferreira D; Slade D, Nat. Prod. Rep 2002, 19, 517–541. [DOI] [PubMed] [Google Scholar]
- 7.Nam J-W; Phansalkar RS; Lankin DC; McAlpine JB; Leme-Kraus AA; Vidal CMP; Gan L-S; Bedran-Russo AK; Chen S-N; Pauli GF, J. Org. Chem 2017, 82, 1316–1329. [DOI] [PMC free article] [PubMed] [Google Scholar]
- 8.Phansalkar RS; Nam J-W; Chen S-N; McAlpine JB; Leme AA; Aydin B; Bedran-Russo AK; Pauli GF, J. Chromatogr. A 2018, 1535, 55–62. [DOI] [PMC free article] [PubMed] [Google Scholar]
- 9.Nam J-W; Phansalkar RS; Lankin DC; Bisson J; McAlpine JB; Leme AA; Vidal CMP; Ramirez B; Niemitz M; Bedran-Russo AK; Chen S-N; Pauli GF, J. Org. Chem 2015, 80, 7495–7507. [DOI] [PMC free article] [PubMed] [Google Scholar]
- 10.Jing S; Zeller WE; Ferreira D; Zhou B; Nam J-W; Bedran-Russo AK; Chen S-N; Pauli GF, J. Agric. Food Chem 2020, in press, DOI 10.1021/acs.jafc.xyz [DOI] [PMC free article] [PubMed] [Google Scholar]
- 11.Phansalkar RS; Nam J-W; Leme-Kraus AA; Gan L-S; Zhou B; McAlpine JB; Chen S-N; Bedran-Russo AK; Pauli GF, J. Nat. Prod 2019, 82, 2387–2399. [DOI] [PMC free article] [PubMed] [Google Scholar]
- 12.Cronje A; Burger JFW; Brandt EV; Kolodziej H; Ferreira D, Tetrahedron Lett. 1990, 31, 3789–3792. [Google Scholar]
- 13.Khan ML; Haslam E; Williamson MP, Magn. Reson. Chem 1997, 35, 854–858. [Google Scholar]
- 14.Kozikowski AP; Tueckmantel W; Hu Y, J. Org. Chem 2001, 66, 1287–1296. [DOI] [PubMed] [Google Scholar]
- 15.Van der Westhuizen JH; Ferreira D; Roux DG, J. Chem. Soc., Perkin Trans. 1 1981, 1220–1226. [Google Scholar]
- 16.Cai Y; Evans FJ; Roberts MF; Phillipson JD; Zenk MH; Gleba YY, Phytochemistry 1991, 30, 2033–2040. [Google Scholar]
- 17.Botha JJ; Young DA; Ferreira D; Roux DG, J. Chem. Soc., Perkin Trans. 1 1981, 1213–1219. [Google Scholar]
- 18.Ding Y; Li X; Ferreira D, J. Nat. Prod 2010, 73, 435–440. [DOI] [PMC free article] [PubMed] [Google Scholar]
- 19.Slade D; Ferreira D; Marais JPJ, Phytochemistry 2005, 66, 2177–2215. [DOI] [PubMed] [Google Scholar]
- 20.Dudek MK; Glinski VB; Davy MH; Sliva D; Kazmierski S; Glinski JA, J. Nat. Prod 2017, 80, 415–426. [DOI] [PubMed] [Google Scholar]
- 21.Kamiya K; Watanabe C; Endang H; Umar M; Satake T, Chem. Pharm. Bull 2001, 49, 551–557. [DOI] [PubMed] [Google Scholar]
- 22.Lin H-C; Lee S-S, J. Nat. Prod 2010, 73, 1375–1380. [DOI] [PubMed] [Google Scholar]
- 23.Chen L; Sun P; Wang T; Chen K; Jia Q; Wang H; Li Y, Agric J. Food Chem. 2012, 60, 9144–9150. [DOI] [PubMed] [Google Scholar]
- 24.Killday KB; Davey MH; Glinski JA; Duan P; Veluri R; Proni G; Daugherty FJ; Tempesta MS, J. Nat. Prod 2011, 74, 1833–1841. [DOI] [PubMed] [Google Scholar]
- 25.Lin G-M; Lin H-Y; Hsu C-Y; Chang S-T, Sci J. Food Agric. 2016, 96, 4749–4759. [DOI] [PubMed] [Google Scholar]
- 26.Torres JL; Lozano C; Julià L; Sánchez-Baeza FJ; Anglada JM; Centelles JJ; Cascante M, Bioorg. Med. Chem 2002, 10, 2497–2509. [DOI] [PubMed] [Google Scholar]
- 27.Jordheim M; Fossen T; Songstad J; Andersen ØM, Agric J. Food Chem. 2007, 55, 8261–8268. [DOI] [PubMed] [Google Scholar]
- 28.Pedersen AT; Andersen M; Aksnes DW; Nerdal W, Magn. Reson. Chem 1993, 31, 972–976. [Google Scholar]
- 29.Nonaka G; Morimoto S; Nishioka I, J. Chem. Soc., Perkin Trans. 1 1983, 2139–2145. [Google Scholar]
- 30.Shoji T; Mutsuga M; Nakamura T; Kanda T; Akiyama H; Goda Y, Agric J. Food Chem. 2003, 51, 3806–3813. [DOI] [PubMed] [Google Scholar]
- 31.Abe Y; Shoji T; Kawahara N; Kamakura H; Kanda T; Goda Y; Ozeki Y, Tetrahedron Lett. 2008, 49, 6413–6418. [Google Scholar]
- 32.Esatbeyoglu T; Jaschok-Kentner B; Wray V; Winterhalter P, Agric J. Food Chem. 2011, 59, 62–69. [DOI] [PubMed] [Google Scholar]
- 33.Henderson TJ; Cullinan DB, Magn. Reson. Chem 2006, 44, 868–880.16791908 [Google Scholar]
- 34.Phansalkar RS; Simmler C; Bisson J; Chen S-N; Lankin DC; McAlpine JB; Pauli GF; Niemitz M, J. Nat. Prod 2017, 80, 634–647. [DOI] [PMC free article] [PubMed] [Google Scholar]
- 35.Napolitano JG; Lankin DC; Graf TN; Friesen JB; Chen S-N; McAlpine JB; Oberlies NH; Pauli GF, J. Org. Chem 2013, 78, 2827–2839. [DOI] [PMC free article] [PubMed] [Google Scholar]
- 36.Dudek MK; Kazmierski S; Stefaniak K; Glinski VB; Glinski JA, Org. Biomol. Chem. 2014, 12, 9837–9844. [DOI] [PubMed] [Google Scholar]
- 37.Lou H; Yuan H; Ma B; Ren D; Ji M; Oka S, Phytochemistry 2004, 65, 2391–2399. [DOI] [PubMed] [Google Scholar]
- 38.Berthod A; Friesen JB; Inui T; Pauli GF, Anal. Chem 2007, 79, 3371–3382. [DOI] [PMC free article] [PubMed] [Google Scholar]
- 39.Pauli GF; Chen S-N; Simmler C; Lankin DC; Gödecke T; Jaki BU; Friesen JB; McAlpine JB; Napolitano JG, J. Med. Chem 2014, 57, 9220–9231. [DOI] [PMC free article] [PubMed] [Google Scholar]
- 40.Napolitano JG; Lankin DC; Chen S-N; Pauli GF, Magn. Reson. Chem 2012, 50, 569–575. [DOI] [PMC free article] [PubMed] [Google Scholar]
- 41.Napolitano JG; Lankin DC; McAlpine JB; Niemitz M; Korhonen S-P; Chen S-N; Pauli GF, J. Org. Chem 2013, 78, 9963–9968. [DOI] [PMC free article] [PubMed] [Google Scholar]
- 42.Vidal CMP; Aguiar TR; Phansalkar RS; McAlpine JB; Napolitano JG; Chen S-N; Araujo LSN; Pauli GF; Bedran-Russo AK, Acta Biomater. 2014, 10, 3288–3294. [DOI] [PMC free article] [PubMed] [Google Scholar]
Associated Data
This section collects any data citations, data availability statements, or supplementary materials included in this article.


