Abstract
PIWI-interacting RNAs (piRNAs) are a class of small non-coding RNAs essential for fertility. In adult mouse testes, most piRNAs are derived from long single-stranded RNAs lacking annotated open reading frames (ORFs). The mechanisms underlying how piRNA sequences are defined during the cleavages of piRNA precursors remain elusive. Here, we show that 80S ribosomes translate the 5´-proximal short ORFs (uORFs) of piRNA precursors. MOV10L1/Armitage RNA helicase then facilitates the translocation of ribosomes into the uORF-downstream regions (UDRs). The ribosome-bound UDRs are targeted by piRNA processing machinery, with the processed ribosome-protected-regions becoming piRNAs. The dual modes of interaction between ribosomes and piRNA precursors underlies the distinct piRNA biogenesis requirements at uORFs and UDRs. Ribosomes also mediate piRNA processing in roosters and green lizards, implying this mechanism is evolutionarily conserved in amniotes. Our results uncover a function for ribosomes on non-coding regions of RNAs and reveal the mechanisms underlying how piRNAs are defined.
Keywords: PIWI-interacting RNA, piRNA, ribosome, translation, testis, germ cell, non-coding RNA, reproduction, short open reading frame, uORF
Introduction
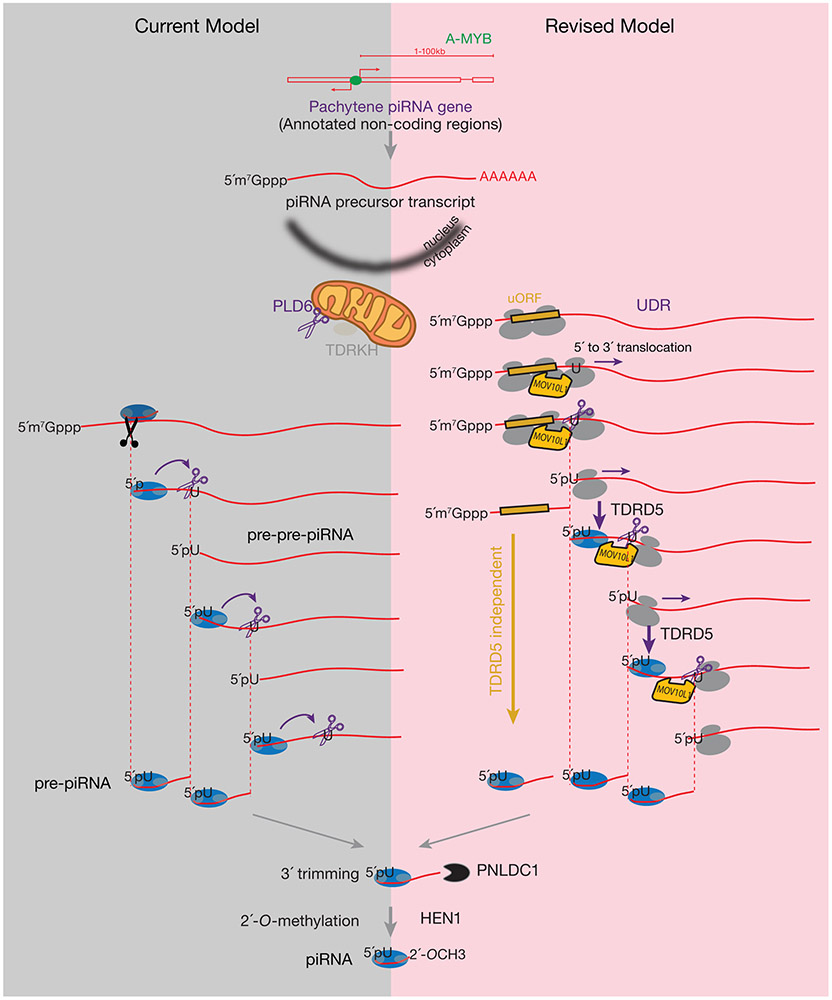
PIWI-interacting RNAs (piRNAs) guide PIWI proteins to target RNAs via base-pair complementarity1-5. piRNAs protect the animal germ-line genome from transposable elements (TEs), making piRNAs essential for fertility from worms to humans1,2,4. The current model for piRNA biogenesis (Extended Data Fig. 1, left) proposes that the single-stranded piRNA precursor is first cleaved via the slicer activity of PIWI proteins directed by complementary “initiator” piRNAs, generating a pre-pre-piRNA with a 5´-monophosphate end (5´P). This is followed by the loading of a PIWI protein onto the 5´-end of the pre-pre-piRNA. PLD6 (Phospholipase D Family Member 6, the mouse homolog of fly Zucchini), an endonuclease localized on the outer membrane of mitochondria, cleaves the pre-pre-piRNA 3´ of the 5´-loaded PIWI protein6. This endonucleolytic cleavage simultaneously generates the 3´-end of a pre-piRNA and the 5´-end of the next, immediately adjacent pre-pre-piRNA6-11. The 5´-loaded PIWI protein is thought to direct the PLD6 endonucleolytic cleavage, fragmentating and generating non-overlapping pre-piRNAs in a 5´-to-3´ stepwise manner, known as phased piRNA biogenesis. Following 3´-end trimming and methylation, pre-piRNAs become mature piRNAs, which requires the 3´-to-5´ exonuclease PNLDC1 (PARN Like, Ribonuclease Domain Containing 1) and a scaffold protein TDRKH (Tudor And KH Domain Containing) in mice6,10,12-14.
Although phased cleavage, which determines the piRNA 5´-ends, is detected in most animals6, studies in flies show that piRNA production, downstream of the initiator piRNA, declines with distance7,8. As a consequence of this low processivity, which may be due to the instability of cleavage products prior to the PIWI loading (Extended Data Fig. 1, left), frequent cleavages from initiator piRNAs are required for robust phased piRNA production in flies8. In contrast to piRNA precursors in flies, which are cryptic transcripts from highly repetitive regions15, mice express an abundant set of non-repetitive piRNAs during the meiotic pachytene stage, known as pachytene piRNAs. Most pachytene piRNAs map to unique sequences in the genome, and their precursors are intergenic RNA polymerase II transcripts containing 5´-caps, spliced exons, and poly(A) tails with a median length >8,000 nt16. Currently, we do not know how these long non-repetitive transcripts are efficiently processed into piRNAs in mice. Here we demonstrate the involvement of ribosomes in defining the position of pachytene piRNA formation.
Results
Ribosomes associate with piRNA precursors
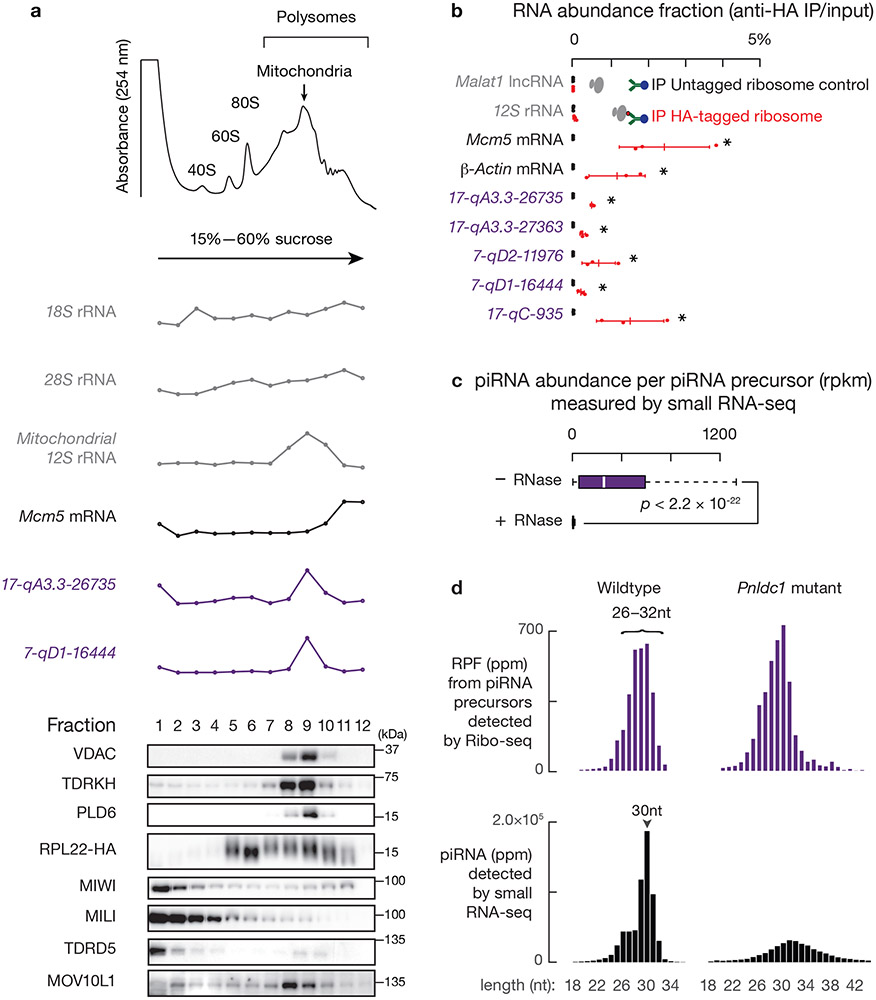
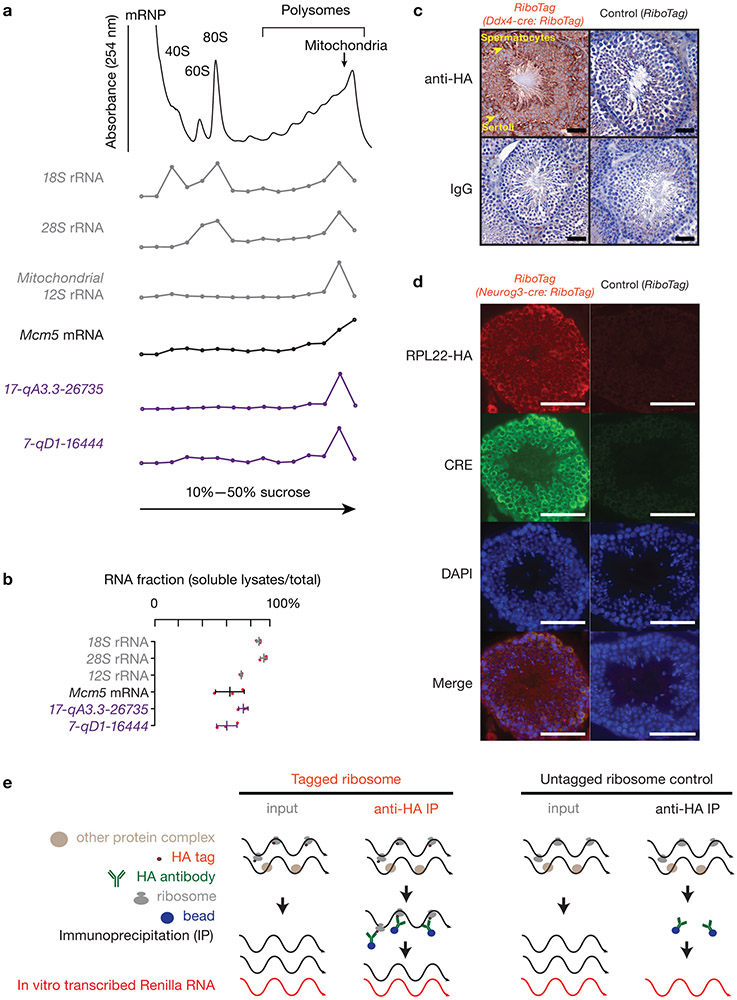
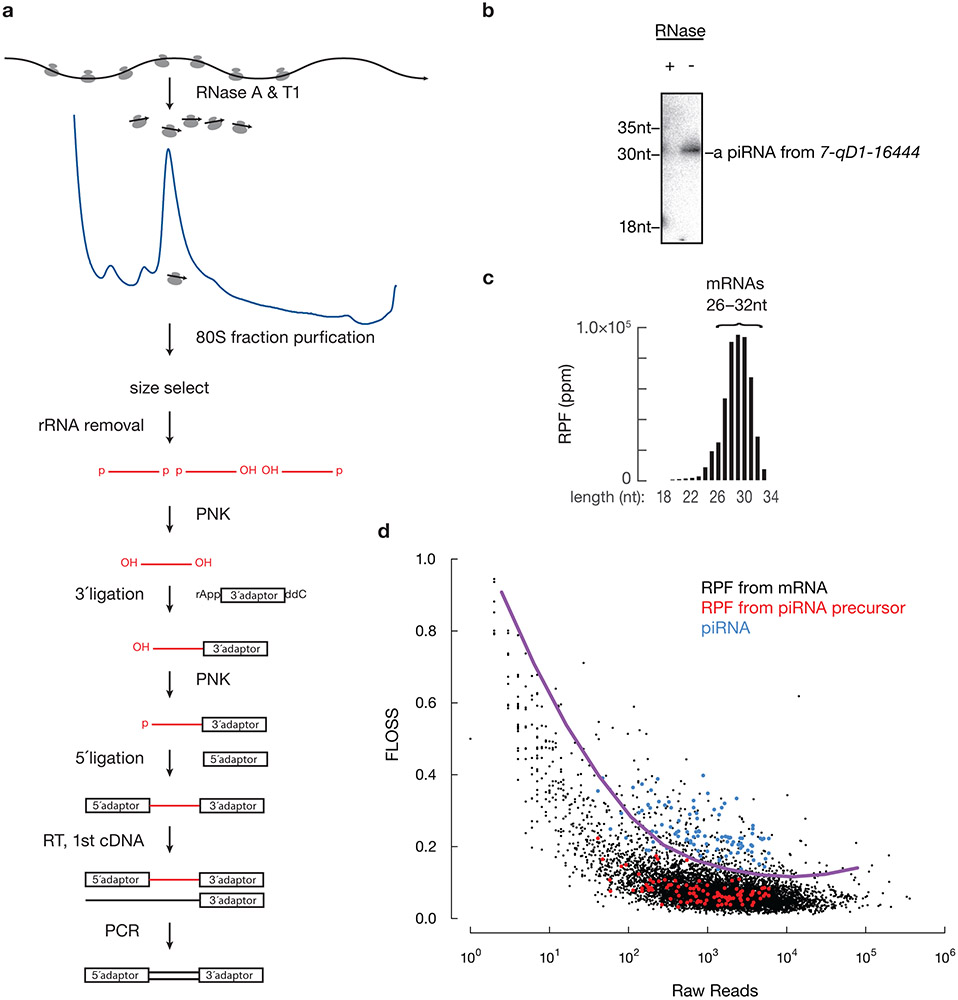
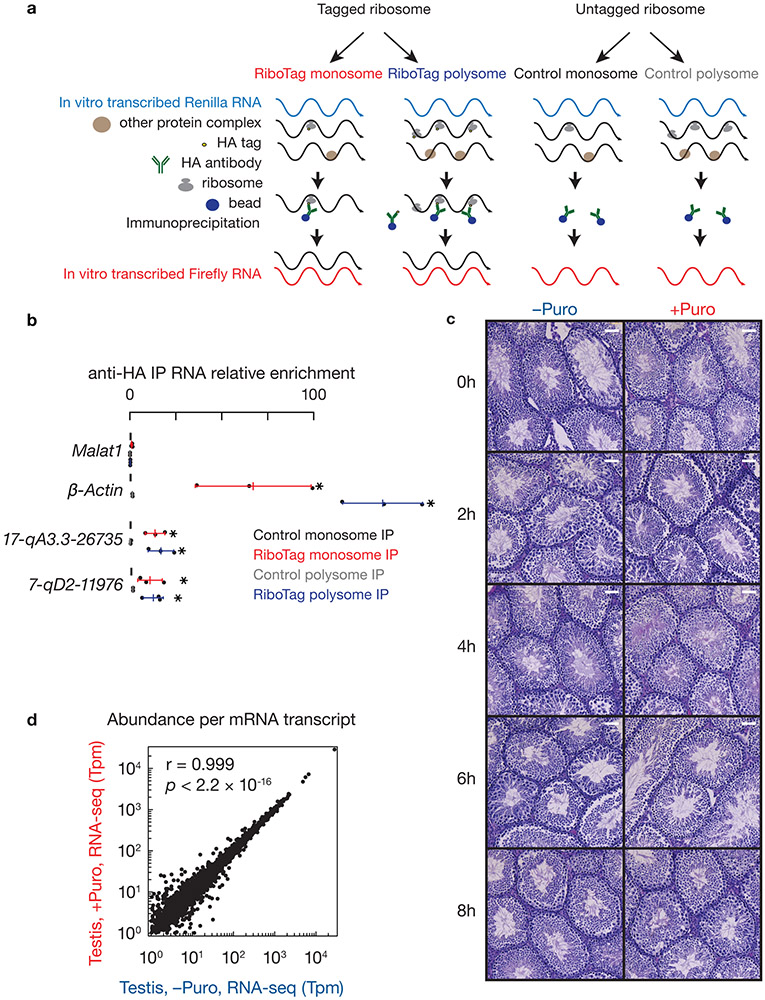
To identify protein-pachytene piRNA precursor complexes in near-physiological conditions, we lysed mouse testes under conditions that preserve mitochondria. Cleared lysates fractionated on sucrose gradients revealed that the majority of piRNA precursors, together with mitochondria-associated piRNA biogenic factors, such as TDRKH and PLD6, co-sedimented with ribosomes in the heavy sucrose fraction (Fig. 1a, Extended Data Fig. 2a,b). Pachytene piRNA precursors were co-immunoprecipitated with affinity-purified ribosomes from RiboTag mice (Fig. 1b, Extended Data Fig. 2c-e), in which we activated the expression of hemagglutinin (HA)-tagged RPL22 (a ribosomal large subunit protein) in germ cells17. We performed Ribo-seq to test whether the ribosomes bind directly to piRNA precursors (Extended Data Fig. 3a). In vitro RNase digestion, used to obtain ribosome protected fragments (RPFs), removed >98% of the mature piRNAs (Fig. 1c, Extended Data Fig. 3b), thus very few mature piRNAs survived to contaminate Ribo-seq library construction. RPFs from piRNA precursors displayed a length distribution (Fig. 1d, upper left) similar to that of the RPFs from mRNAs (Extended Data Fig. 3c), but significantly different (Extended Data Fig. 3d, p value comparing the length distribution < 2.2 x 10⁻¹⁶) from the length distribution of mature piRNAs (Fig. 1d, 24–35nt, lower left). In Pnldc1 mutants that are deficient in 3´ to 5´ exonucleolytic digestion, untrimmed pre-piRNAs displayed a broader size range (24–40nt) (Fig, 1d, lower right)10,12, yet the size distribution of the RPF signals from piRNA precursors remained the same as that in wild-type (Fig. 1d, upper right), confirming that the RPFs obtained from piRNA precursors were not affected by piRNA contamination.
Fig. 1. Pachytene piRNA precursors associate with ribosomes.
a, (upper) A254 absorbance profile of testis lysates from adult mice following separation in 15% to 60% sucrose density gradients. The testes were lysed in amended lysis buffer that preserves mitochondria. Top to bottom: relative abundance of 18S rRNA, 28S rRNA, 12S rRNA, Mcm5 mRNA, and two pachytene piRNA precursors: 17-qA3.3-26735 and 7-qD1-16444. The long transcripts (> 200 nt) were quantified using RT-qPCR, and were normalized to spike-in control RNAs. (lower) Western blot analysis of VDAC (mitochondrial outer membrane protein49), TDRKH (also localized on the outer membrane of clustered mitochondria), PLD6, HA-tagged RPL22, MIWI, MILI, TRDR5 and MOV10L1. Experiments were repeated for at least three times independently with similar results. b, Fraction of RNAs immunoprecipitated using anti-HA antibodies relative to total input RNAs from Ddx4-cre:RiboTag mice (red) and control littermates (RiboTag without Cre, black). (The scheme of the experimental procedure is shown in Extended Data Fig. 2e.) 17-qA3.3-26735, 17-qA3.3-27363, 7-qD2-11976, 7-qD1-16444, and 17-qC-935 are pachytene piRNA precursors. Abundance of transcripts was quantified using RT-qPCR (sample size n = 3 independent biological samples). Data are mean ± standard deviation; *p < 0.05, one-side Student’s t-test. Each data point was overlaid as dot plots. c, Boxplots of pachytene piRNA abundance per piRNA precursor with and without RNaseA&T1 treatment. Box plots: 25th and 75th percentiles; whiskers: 5th and 95th percentiles; midline, median (the same definition was used throughout the manuscript). Sample size n = 100 pachytene piRNA precursors. p value was determined by two-side paired Wilcoxon signed-rank test. Rpkm, reads per kilobase pair per million reads mapped to the genome. d, Length histograms of RPFs from pachytene piRNA precursors (upper) and of pachytene piRNAs (bottom) in the testis of wildtype (left) and Pnldc1 mutants (right). Ppm, parts per million. See also Extended Data Fig. 2, 3. Statistical source data are provided in Source Data Fig.1. Unprocessed blots are provided in Source Data Fig 1.
Ribosomes translate uORFs of piRNA precursors
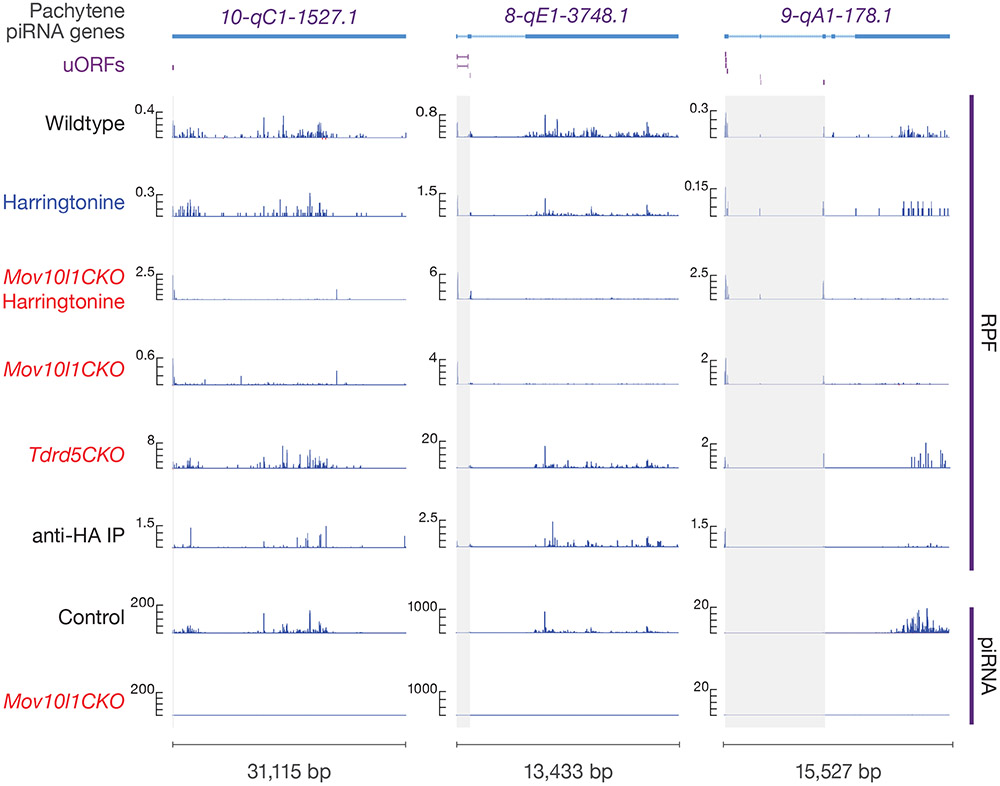
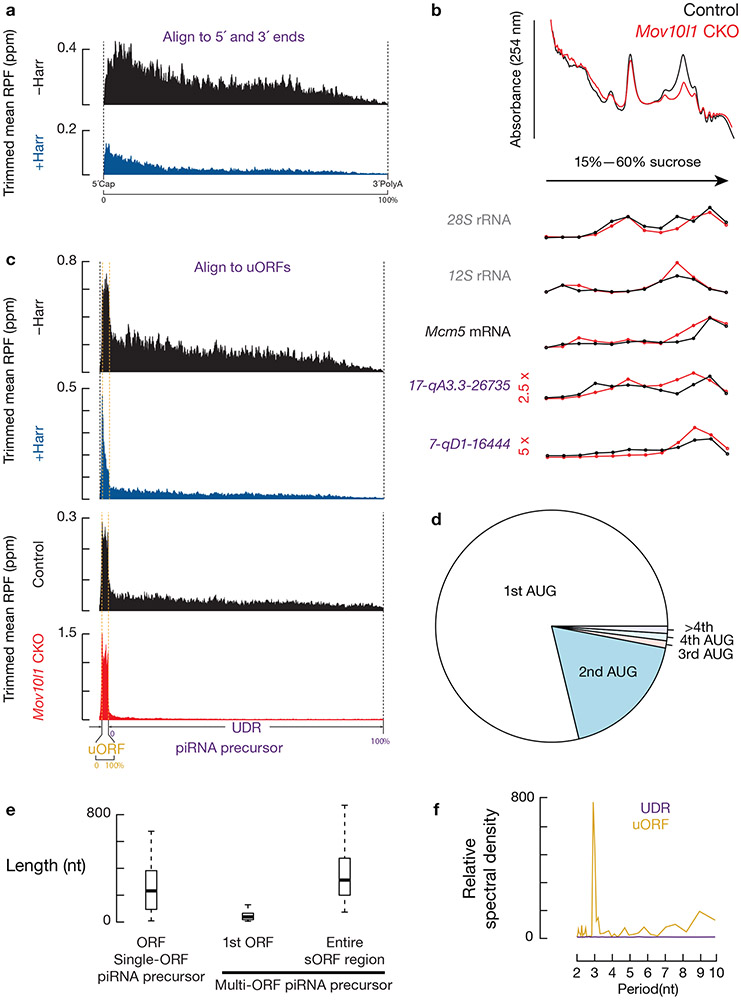
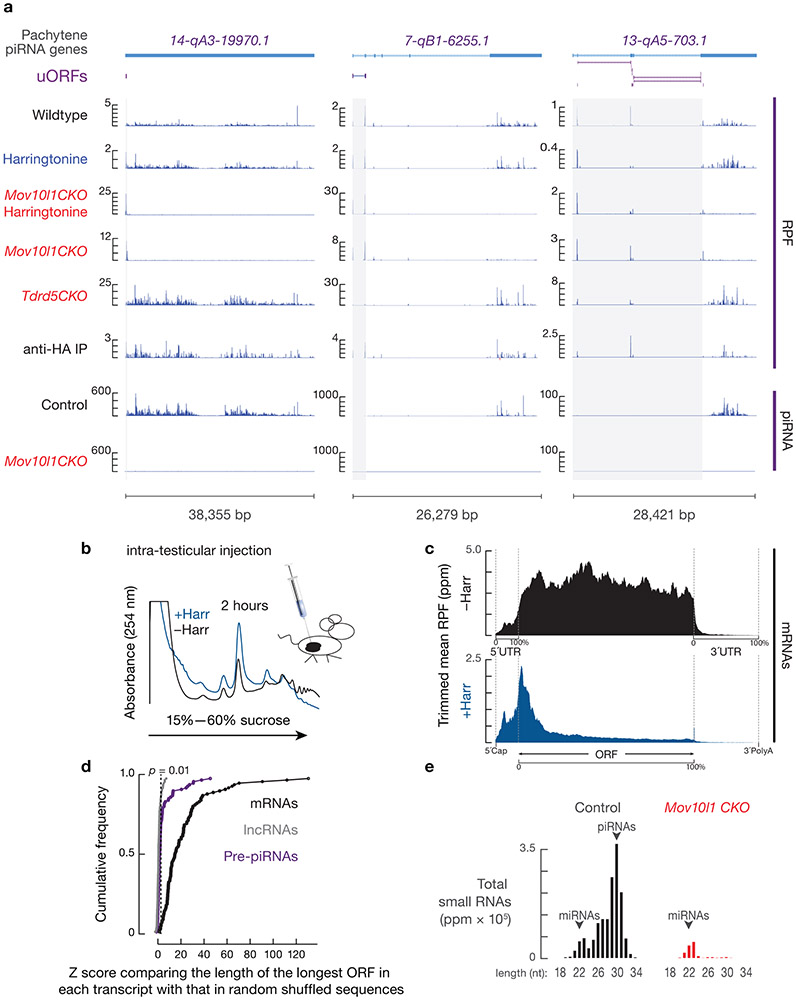
RPF signals were distributed over the length of piRNA precursors (Fig. 2, 3a, upper, Extended Data Fig. 4a). These signals could be: (i) footprints of unknown protein-RNA complexes; (ii) ribosomes loaded from the 5´-end of precursors that spread along their length; or, (iii) ribosomes loaded promiscuously throughout the precursors. To distinguish among these possibilities, we performed Ribo-seq on testes treated with harringtonine, a translation inhibitor. Harringtonine binds to the A site of newly assembled ribosomes, blocking early elongation18 and allowing initiating ribosomes to accumulate at start codons19. Because pachytene piRNA biogenesis cannot be recapitulated in cultured cells, we developed a surgical procedure to directly inject harringtonine into the testes of anesthetized mice (Extended Data Fig. 4b). After a 2-hour treatment, we observed a substantial decrease in overall polysome assembly (Extended Data Fig. 4b) and an enrichment of RPFs at the translation initiation sites of mRNAs (Extended Data Fig. 4c), indicating successful penetration into spermatocytes. Ribosomes also accumulated near the 5´-ends of the piRNA precursors (Fig. 2, 3a, lower, Extended Data Fig. 4a). Although pachytene piRNA precursors lack long open reading frames (Extended Data Fig. 4d), our data suggest that ribosomes may have been recruited to previously undetected ORFs.
Fig. 2. Ribosomes bind pervasively to piRNA precursors.
Four examples of Pachytene piRNA Genes. Browser views of piRNA precursor loci with normalized reads of RPFs and piRNAs. Grey shades indicate uORFs defined in this study. Ppm, parts per million. Harr, harringtonine. See also Extended Data Fig. 4a.
Fig. 3. Ribosomes translate the uORFs of piRNA precursors.
a, Aggregated data for ribosome occupancy on piRNA-producing transcripts (10% trimmed mean) from untreated testes (upper) and harringtonine treated testes (lower). Signals are aligned to the transcriptional start site (5´cap) and site of polyadenylation (3´PolyA). Ribo-seq across 26–32 nt was used to detect ribosome occupancy. The x-axis shows the median length of these regions. Ppm, parts per million. Harr, harringtonine. b, A254 absorbance profile of testis lysates following separation in 15% to 60% sucrose density gradients from Mov10l1 CKO (Mov10l1CKO/Δ Neurog3-cre, Red) and control (Mov10l1CKO/Δ, Black). From top to bottom, plots show the relative abundance of 28S rRNA, 12S rRNA, Mcm5 mRNA, and two piRNA precursors: 17-qA3.3-26735 and 7-qD1-16444. The long transcripts (>200 nt) were quantified using RT-qPCR and normalized to spike-in control RNAs. c, Aggregated data for ribosome occupancy on piRNA-producing transcripts from untreated testes and harringtonine treated testes (upper two panels), and Mov10l1CKO/Δ control testis and Mov10l1CKO/Δ Neurog3-cre testis (lower two panels). Signals are further aligned to the uORF regions. Dotted lines show the translation start codon (uORF Start) and stop codon (uORF End). d, Pie chart showing fraction of AUG start sites at absolute positions of AUG codons on transcripts (nearly three fourths of AUG start sites are the first AUG on the transcript). e, Boxplots of the ORF length. Sample size n = 39 single-ORF pachytene piRNA precursors; sample size n = 61 multi-ORF pachytene piRNA precursors. f, Discrete Fourier transformation of the distance spectrum of 5´-ends of RPFs across uORFs (gold) and UDRs (purple) of pachytene piRNA precursors in wild-type testes. RPFs were from a publicly available dataset constructed by an independent laboratory42. See also Extended Data Fig. 4b-e, 5. Statistical source data are provided in Source Data Fig.3.
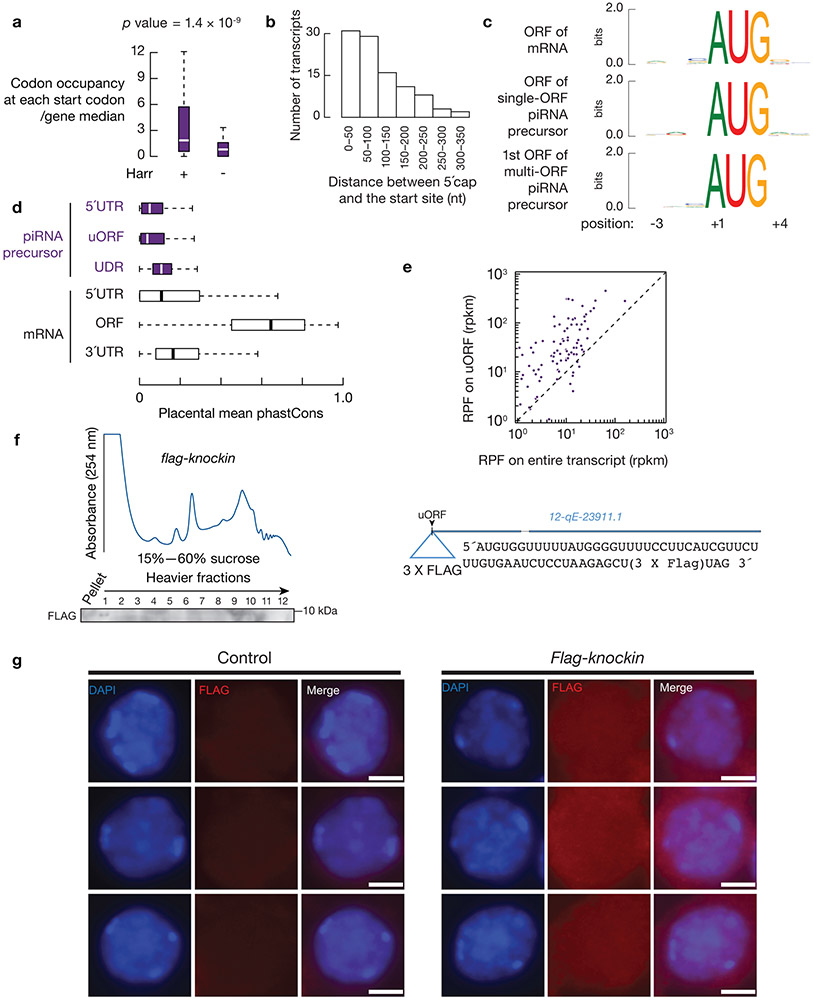
To identify putative ORFs in piRNA precursors, we used RNA helicase MOV10L1-deficient germ cells which lack mature piRNAs (Extended Data Fig. 4e) and exhibit piRNA precursor accumulation (Fig. 3b) as a result of blocked downstream piRNA processing20-22, thus avoiding any residual piRNAs contaminating Ribo-seq signals. We found that piRNA precursors from Mov10l1 conditional knock-out (CKO) testes co-sedimented with ribosomes (Fig. 3b), indicating that MOV10L1 genetically acts downstream of the ribosome-piRNA precursor interaction. We found that translation initiated at conventional start sites on piRNA precursors, as shown by discrete peaks of ribosome occupancy over AUG codons in piRNA precursors following harringtonine treatment in Mov10l1 CKO testes (Fig. 2, Extended Data Fig. 4a). In wild-type mice, ribosomes also accumulated at the identified start codons on piRNA precursors upon harringtonine treatment (p = 1.4 x 10⁻⁹, Extended Data Fig. 5a), indicating that these sites were not specific to Mov10l1 mutants. The start sites generally fell within a median distance of 82.5 nt of the 5´-cap of piRNA precursors (Extended Data Fig. 5b) at one of the first AUG codons in the transcript (Fig. 3d), consistent with the canonical cap-dependent translation initiation pathway23.
Ribosomes bound to piRNA precursors in Mov10l1 CKO testes without harringtonine treatment were restricted to either one or more short ORFs near the 5´-ends of piRNA precursors (Fig. 2, 3c, lower two panels, Extended Data Fig. 4a). We monitored ribosome occupancy after the start codon in Mov10l1 CKO testes and quantified signal decline using ribosome release scores (RRS), which measure the enrichment of RPF signals at ORFs versus 3´-downstream regions24. We used the stop codon from ORFs with the highest RRSs among all putative ORFs on the piRNA precursors as the boundary for the entire ORF regions. On 39 of the 100 piRNA precursors, ribosome occupancy declined significantly after reaching the first stop codon (single-ORF transcripts) (representatives showed in Fig. 2, Extended Data Fig. 4a, left), whereas on the other 61 multi-ORF precursors, ribosomes continued to spread without a substantial decline in density downstream of the first ORF (representatives shown in Fig. 2 and Extended Data Fig. 4a, right). The median distance from the start codon of the first ORF of the multi-ORF precursors to the stop codon of the ORF with the highest RRS was 313 nt (Fig. 3e). These entire regions were annotated as “ORFs” for the multi-ORF precursors. The first ORF (median length 39nt) of multi-ORF precursors was significantly shorter than the ORF of single-ORF precursors (median length 232nt, p = 2.6 x 10⁻¹⁵, Fig. 3e). This is consistent with the notion that ORF length is an important factor for reinitiation as translation initiation factors dissociate during early elongation25. Given their similarity to upstream ORFs (uORFs) in the 5´-UTRs of mRNAs26 and lncRNAs19, as shown by their small size, 5´-proximal location, weak KOZAK motifs (Extended Data Fig. 5c), and lack of conservation (Extended Data Fig. 5d), we therefore refer to piRNA precursor 5´proximal short ORFs as uORFs.
In wild-type mice, after re-aligning the RPF signals using the uORFs defined in Mov10l1 CKO testes, we detected a higher ribosome occupancy at the uORFs relative to the overall transcript (Fig. 3c, upper 2 panels, Extended Data Fig. 5e). In these uORFs we observed a three-nucleotide periodicity in RPF reads from wild-type mouse testes (Fig. 3f), indicating that elongating ribosomes translate these uORFs. To visualize the translation product, we fused a FLAG epitope to the C-terminus of the peptide from uORF of a piRNA precursor, 12-qE-23911.1, at its endogenous locus using CRISPR/Cas927. In the testes of flag-knockin mice, we detected a FLAG-tagged micropeptide of the correct size by western blotting (Extended Data Fig. 5f), and determined its localization in pachytene spermatocytes by immunostaining (Extended Data Fig. 5g). Thus, unlike piRNA biogenesis in flies where piRNA precursors shuttle from the nucleus to perinuclear granules to enter piRNA biogenesis directly28 and appear to be processed without translation11, piRNA precursors in mice first engage ribosomes, through the translation of uORFs.
Ribosomes translating into UDRs depends on MOV10L1 helicase
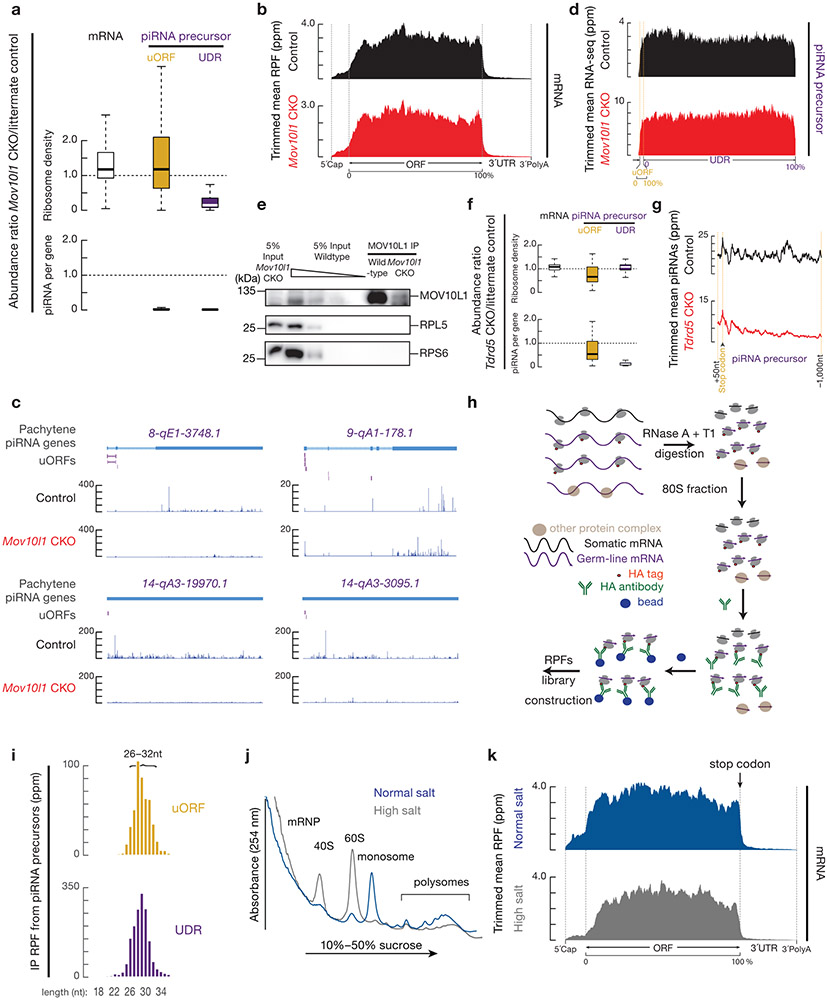
The RPF signals extended through the uORF-downstream regions (UDRs) in wild-type and control testes for Mov10l1 CKO (Fig. 2, 3a,c, 4a, Extended Data Fig. 4a,6a). The restriction of ribosomal signals within uORFs of piRNA precursors in the Mov10l1 CKO was not observed in mRNAs (Fig. 4a, Extended Data Fig. 6a,b), suggesting it was not a ubiquitous effect due to developmental arrest. We ruled out both stop codon-proximal endonucleolytic cleavage (Extended Data Fig. 6c) and robust expression of shorter isoforms of piRNA precursors (Extended Data Fig. 6d) in Mov10l1 CKO testis as causes of decreased UDR ribosome abundance. Since MOV10L1 co-sediments with piRNA precursors (Fig. 1a), we also eliminated the possibility that the UDR signals in Ribo-seq were contaminants from MOV10L1 footprints, as shown by the finding that MOV10L1 only transiently binds to piRNA precursors, and that cross-linking would have been required to capture such interactions20. We also ruled out the possibility that MOV10L1-dependent RPF signals on UDR are due to stop-codon read-through. While, such a read-through mechanism resulting in C-terminal protein extension has been reported in flies29, it is rarely seen in vertebrates30. Moreover, the RPFs on UDRs do not display codon periodicity (Fig. 3f).
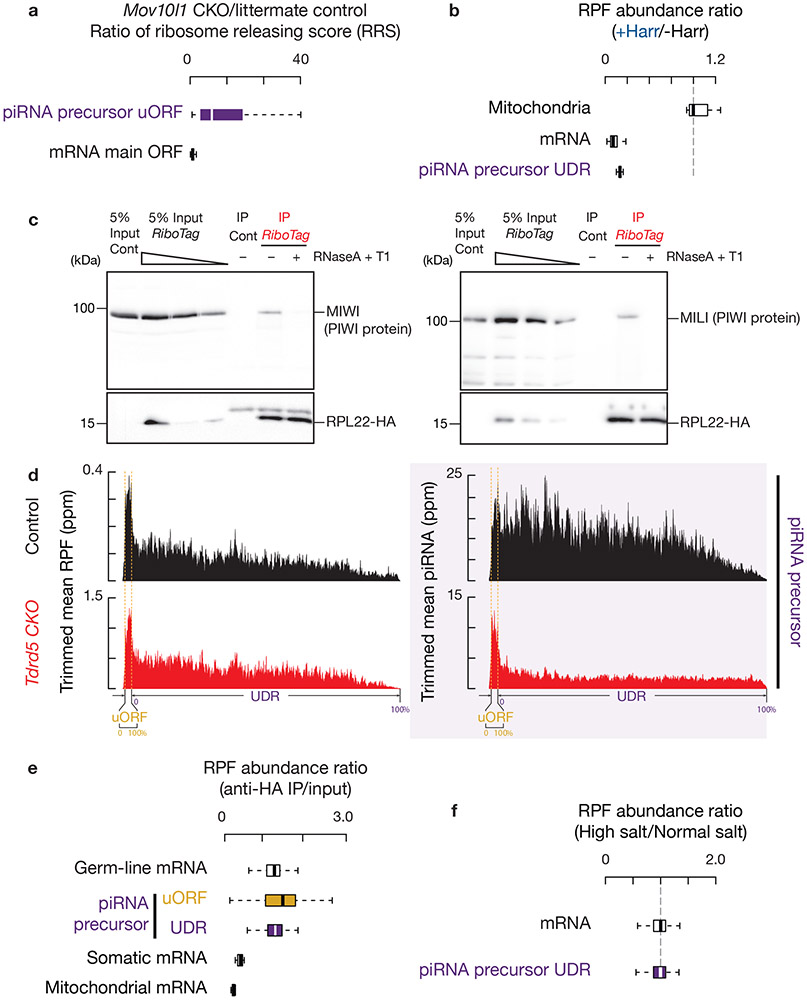
Fig. 4. Ribosomes translate into UDRs of piRNA precursors.
a, The change in ribosome release score (RRS, (CountORF/Count3´ trailer) RPFs/(CountORF/Count3´ trailer) RNA-seq reads) per gene in Mov10l1 CKO mutants compared to littermate controls in testes. Experiments have been repeated for three biological replicates and mean is used for plotting. Sample size n = 100 pachytene piRNA precursors; sample size n = 115 pachytene expressed mRNAs. b, Boxplots of change in RPF abundance per gene with harringtonine treatment versus no treatment. Experiments have been repeated for two biological replicates and mean is used for plotting. Sample size n = 100 pachytene piRNA precursor UDRs; sample size n = 115 pachytene expressed mRNAs; sample size n = 7 mitochondria encoding mRNAs. c, MIWI western blot (left), MILI western blot (right). Cont, control (untagged ribosome, RiboTag without Cre). Experiments were repeated for at least three times independently with similar results. d, RPF abundance (left) and piRNA abundance (right) on piRNA-producing transcripts (10% trimmed mean). Control (upper) and Tdrd5 CKO (lower). e, Boxplots of RFP abundance in anti-HA IP versus input (before IP). Experiments have been repeated for three biological replicates and mean is used for plotting. The Ribo-seq libraries before (input) and after anti-HA IP were normalized to reads mapping to mRNA protein-coding regions. Sample size n = 115 germ-line mRNAs, the same set of mRNAs as pachytene expressed mRNAs. Sample size n = 19 somatic mRNAs. Sample size n = 100 pachytene piRNA precursor UDRs and uORFs. Sample size n = 115 pachytene expressed mRNAs. Sample size n = 7 mitochondria encoding mRNAs. (The scheme of the experimental procedure is shown in Extended Data Fig. 6h.). f, Boxplots of change in RPF abundance per gene with high-salt treatment versus no treatment. Experiments have been repeated from two biological samples and mean is used for plotting. Sample size n = 100 pachytene piRNA precursor UDRs. Sample size n = 115 pachytene expressed mRNAs. See also Extended Data Fig. 6. Statistical source data are provided in Source Data Fig.4. Unprocessed blots are provided in Source Data Fig 4.
The UDR RPF signals could either be ribosomes or other RNA-protein complexes associated with piRNA processing that behave like ribosomes in our assays. To distinguish between these possibilities, we first quantified the RPF abundance ratios in harringtonine-treated and untreated conditions, using mitochondrial coding regions as negative controls31. We found that the UDRs were significantly depleted of RPF signals after blocking the transition from initiation to elongation (Fig. 4b, p < 2.2 x 10⁻¹⁶), similar to mRNA coding regions (p < 2.2 x 10⁻¹⁶). The rapid run-off of the RPF signals at the UDRs argues against the possibility of promiscuous internal translation initiation at UDRs, and suggests that the excursion of these complexes, even if they are not ribosomes, requires active translation.
Although we did not detect a stable interaction between MOV10L1 and ribosomes (Extended Data Fig. 6e), we found that both of the two PIWI proteins in adult testes, MILI and MIWI co-immunoprecipitated with ribosomes (Fig. 4c). RNase treatment of the lysates, which preserves 80S ribosome integrity (Extended Data Fig. 3a), disrupted the PIWI-ribosome co-IP (Fig. 4c), indicating they are bridged by RNA. To further rule out the possibility that these RPF signals are protected piRNAs or PIWI footprints, we tested for their presence under conditions that partially disrupt piRNA production. The recently reported Tdrd5 mutants have normal piRNA formation near the 5´-ends of piRNA precursors, but defective spreading of piRNA production towards the 3´-ends of piRNA precursors32. It had been unclear what separates the near-5´ and towards-3´ biogenesis pathways or why the two pathways have distinct requirements. We found that piRNAs derived from uORFs were still produced in Tdrd5 mutants, but the UDR piRNAs were depleted (Fig. 4d, right, Extended Data Fig. 6f,g), indicating that uORF piRNAs do not require TDRD5 for their production whereas UDR piRNAs do. We performed Ribo-seq of Tdrd5 mutant testes, and found that the RPF signals spread into UDRs despite diminished piRNA levels (Fig. 4d, left). The higher UDR RPF abundance in Tdrd5 mutants was due to increased transcript levels as the density of ribosomes did not change (Extended Data Fig. 6f). In sum, the UDR RPF signals are not from piRNAs or PIWI-loaded intermediates.
It remained possible that the UDR RPF signals originate from other unknown protein-RNA complexes that function upstream of TDRD5 and downstream of MOV10L1. Considering the rapid processing of piRNA precursors, if such protein-RNA complexes existed, they must bind transiently to piRNA precursors and should not contribute substantially to the RPF signals. To assess this possibility, we performed Ribo-seq on adult RiboTag mice. In these experiments, we affinity-purified the RNase A and T1-digestion products before sequencing (Extended Data Fig. 6h). The RNase treatment eliminated mature piRNAs (Fig. 1c) and disrupted the interaction between ribosomes and PIWI proteins (Fig. 4c). After IP, RPFs from somatic mRNAs (Sertoli cells and Leydig cells) (Fig. 4e) were not retained, consistent with the germ line-specific expression of the RiboTag (Extended Data Fig. 2c,d). Sequences from mitochondrial coding transcripts were also depleted (Fig. 4e), as they are translated by untagged 55S mitochondrial ribosomes. In contrast, sequences from the uORFs and UDRs of pachytene piRNA precursors were retained, similar to RPFs from mRNAs that are also expressed in pachynema (Fig. 4e). Moreover, UDR RPFs displayed a length distribution that was similar to that of RPFs from uORFs (Extended Data Fig. 6i). Furthermore, upon high salt treatment (Extended Data Fig. 6j,k), ribosomes on UDRs of piRNA precursors did not decrease in comparison to ribosomes on mRNAs (Fig. 4f, p = 0.9), indicating that UDR ribosomes translocate with nascent polypeptide chains33-35, a signature of active translation. Taken together, these results indicate that the UDR RPF signals were bona fide ribosomal footprints.
Ribosomes accumulate at the future piRNA sites on piRNA precursors
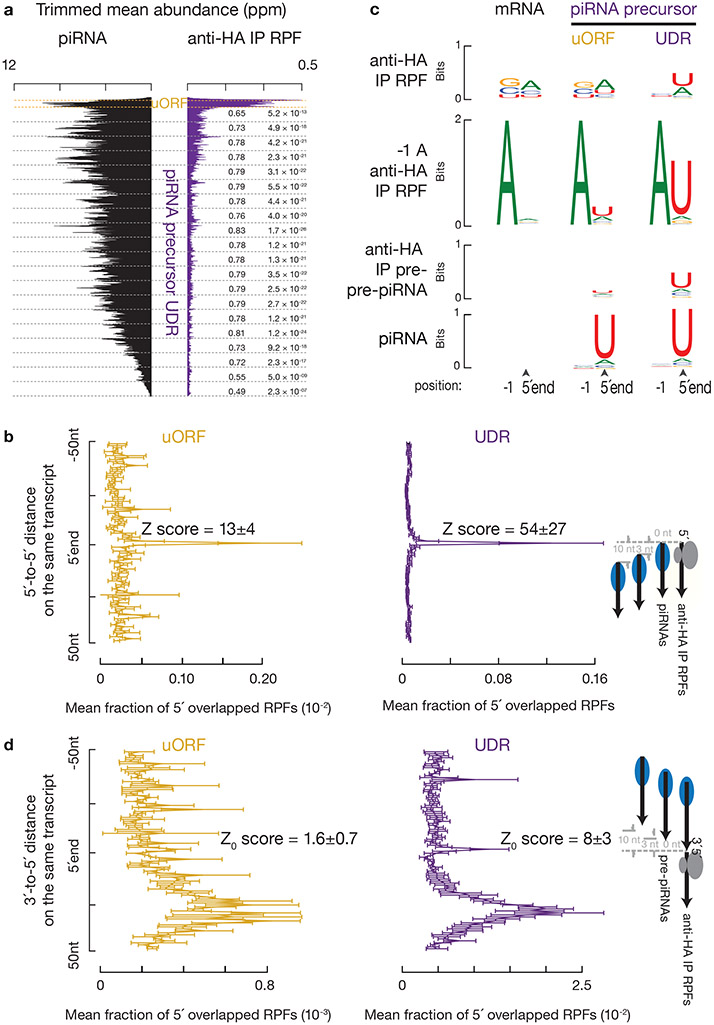
Considering that MOV10L1-dependent ribosome spreading occurs genetically upstream of TDRD5-dependent piRNA formation, we investigated whether the ribosome-bound UDRs are precursors for piRNAs. We found that the abundance of RPFs from each UDR correlated significantly with the abundance of mature piRNAs (r = 0.98, p < 2.2 x 10⁻¹⁶). To rule out the possibility that UDR RPFs and piRNAs were correlated simply because of their independent correlations with piRNA precursors, we performed partial correlation analyses36 between RPF abundance and piRNA abundance while controlling for the abundance of piRNA precursors measured by RNA-seq. We split each piRNA precursor UDR into 20 non-overlapping windows, and found that the piRNA abundance from each window correlated with RPF abundance (Fig. 5a). These correlations combined with the genetic data indicate that regions bound by UDR ribosomes are processed into piRNAs.
Fig. 5. Endonucleolytic cleavage targets ribosomes on piRNA precursors.
a, Aggregated data for piRNAs (left) and ribosome occupancy (right) on pachytene piRNA-producing transcripts (10% trimmed mean). UDRs of each transcript (sample size n = 100 pachytene piRNA precursor UDRs) were split to 20 non-overlapping windows, and the partial Spearman’s correlation efficient and the corresponding p-value based on two-sided Spearman’s correlation test for each window were listed. RPFs and piRNAs are correlated in all 20 bins controlling for piRNA precursor after Bonferroni adjustment for multiple comparisons. b, Distance spectrum of 5´-ends of anti-HA immunoprecipitated RPFs from uORFs (left) and from UDRs (right) that overlap piRNAs in adult testis (sample size n = 3 independent biological samples). Data are mean ± standard deviation. The Z scores indicate how many standard deviations an element is from the mean; Z-score > 3.3 corresponds to p < 0.01 according to a two-sided Z-test. c, Sequence logos depicting nucleotide bias at 5´-ends and 1 nt upstream of 5´-ends of the following species. Top to bottom: anti-HA immunoprecipitated RPF species, anti-HA immunoprecipitated RPF species with a 5´-upstream A, anti-HA immunoprecipitated 5´P RNA species from degradome sequencing, and piRNAs, which map to mRNAs and piRNA precursor uORFs and UDRs, respectively. d, Distance spectrum of 5´-ends of anti-HA immunoprecipitated RPFs from uORFs (left) and from UDRs (right) that overlap with the 3´-ends of pre-piRNAs in Pnldc1 mutant testis (sample size n = 3 independent biological samples)10. Data are mean ± standard deviation. Z-score > 3.3 corresponds to p < 0.01. See also Extended Data Fig. 7, 8. Statistical source data are provided in Source Data Fig.5.
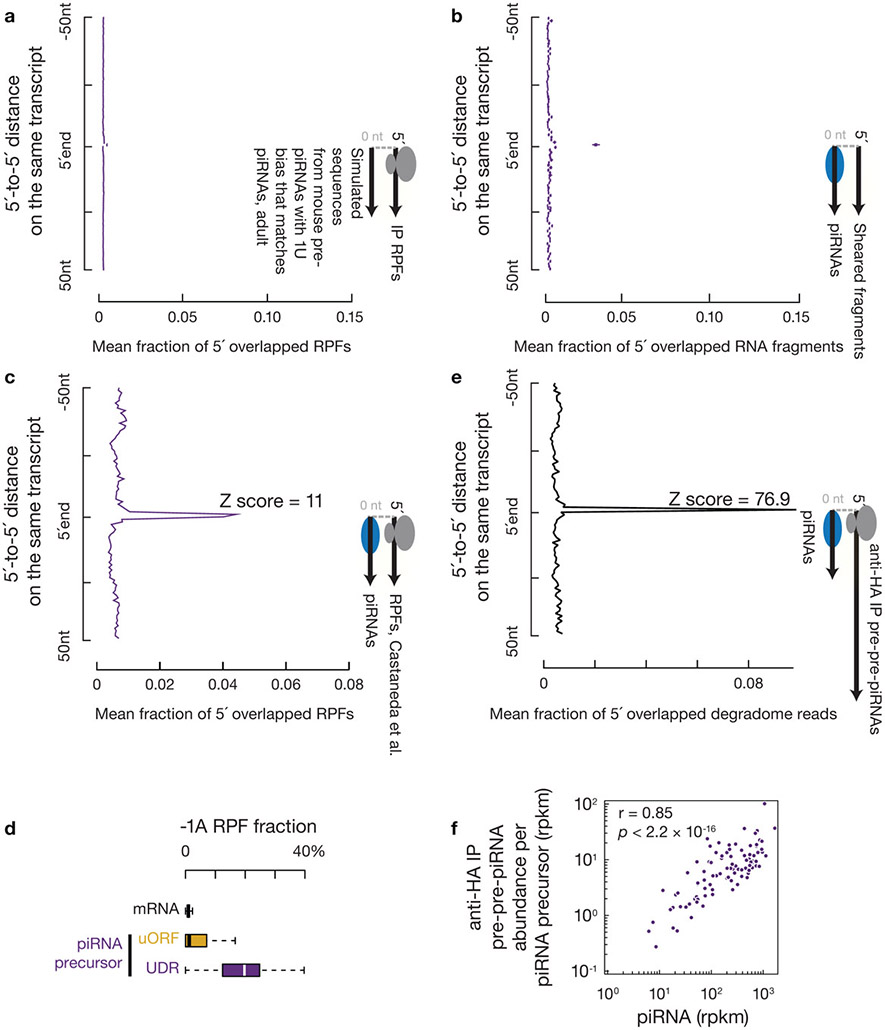
We found that the UDR ribosomes accumulated at sites of future piRNAs. We aligned piRNAs to RPFs, and plotted the 5´-ends of RPFs that overlapped with piRNAs (Fig. 5b). The first nucleotide of UDR RPFs overlapped with the first nucleotide of piRNAs significantly more than with nucleotides residing 50 nucleotides upstream or downstream (Fig. 5b, right). We ruled out the possibility that this overlap could occur by chance or be due to ligation bias (Extended Data Fig. 7a-c). Consistent with their 5´-overlap, we found that the 5´-ends of the RPFs from UDRs displayed a 1U bias, reminiscent of the piRNA 1U bias (Fig. 5c, upper and lower panels). These results indicate that ribosomes dwell on piRNA precursors at sites that will become future piRNAs.
Endonucleolytic cleavage targets ribosome-bound UDRs
We found that the 5´-ends of UDR ribosome-protected RNA regions are already processed in vivo. UDR RPFs lack a signature of in vitro digestion by RNaseT1 (cleavage after G) and RNaseA (cleavage after U and C)37,38 as shown by RPFs from uORFs or mRNAs (Fig. 5c, upper), the nucleotide situated immediately upstream of which should be depleted of A. This minus-one A (−1A) depletion was characteristic of RPFs from mRNA ORFs (a median of 0.9% of RPFs per mRNA ORF had −1A), but not of UDR RPFs (Extended Data Fig. 7d, with a median number of 19.8%). The 1U bias in −1A RPFs was more pronounced than the 1U bias observed in total RPFs from UDRs (Fig. 5c, 77±13% vs. 58±10%, n=3). As pachytene piRNA precursors have an ApU dinucleotide frequency of 6%, this 1U bias after an upstream A reflects context-dependent cleavage that manifests a high preference for a U after the cleavage site, a feature of in vivo piRNA processing. Taken together, the detection of in vivo processed UDR RPFs and their positioning at future piRNA sites suggest that ribosomes bind to pre-pre-piRNAs with flush ends at 5´ extremities.
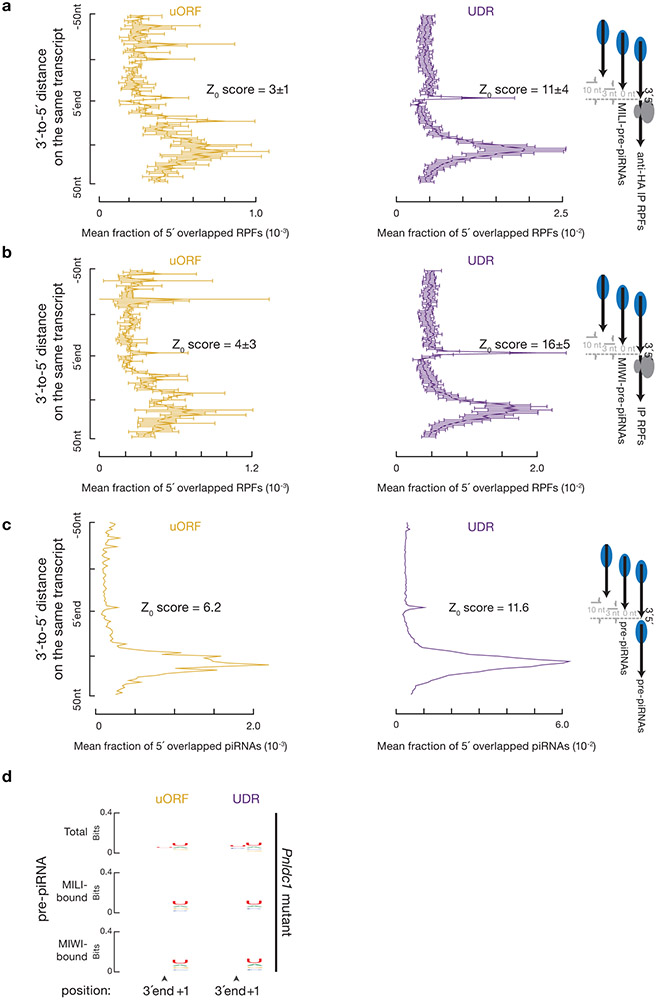
Consistent with the 5´-ends of UDR RPFs having been cleaved by the piRNA processing machinery, ribosome-bound pre-pre-piRNAs with 5´P were captured without in vitro RNase digestion (Extended Data Fig. 7e,f). These pre-pre-piRNAs could be formed by one of two possible mechanisms. A phased cleavage occurs at the 5´-end of ribosome-bound regions, or an endonucleolytic cleavage is followed by digestion via a 5´-to-3´ exonuclease until reaching the 5´-end of ribosome-bound regions. The latter possibility is unlikely here because neither known-exonucleases nor ribosome-binding can generate the 1U bias detected in the UDR RPFs. If a 5´-to-3´ exonuclease digestion is required to generate in vivo ribosome footprints, we would not detect the phasing signature at nucleotide position zero when measuring the distance between the 3´-ends of pre-piRNAs and the 5´-ends of RPFs. Analyzing pre-piRNAs from Pnldc1 mutants6,10, we detected a phasing signature between the 3´-ends of pre-piRNAs and the 5´-ends of RPF (assessed using Z0 score, Fig. 5d, right, Extended Data Fig. 8a-b, right), suggesting that cleavage at the 5´-ends of ribosome-bound regions generates both the 3´-ends of pre-piRNAs and the 5´-ends of the next piRNAs. These data, which argue against the role of a 5´-to-3´ exonuclease, indicate that ribosomes guide phased piRNA production.
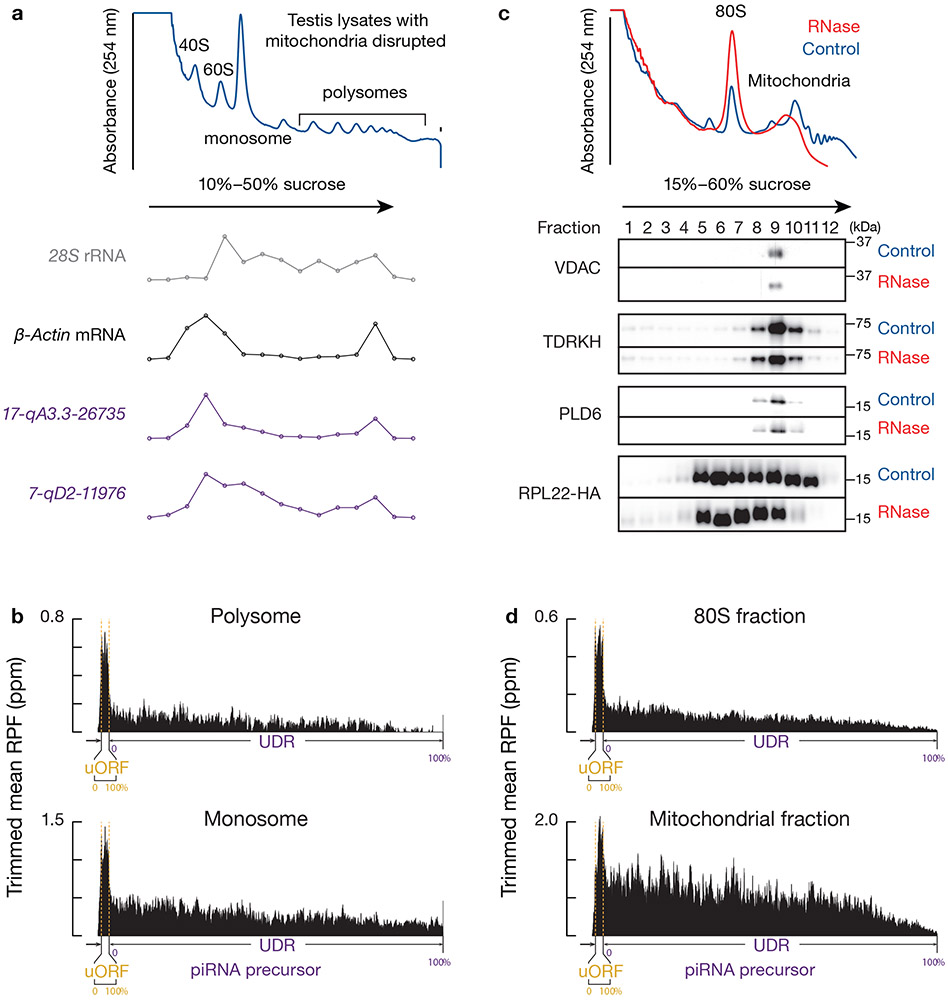
While phased piRNA production occurs at uORFs (Extended Data Fig. 8c,d), unlike UDR RPFs, uORF RPFs undergo little endonucleolytic cleavage. uORF RPFs have a −1A depletion (Fig. 5c, Extended Data Fig. 7d), and have a significantly less pronounced 5´-overlap with mature piRNAs than UDR RPFs (Fig. 5b, p < 0.05). We did not detect any obvious phasing signature between the 3´-ends of pre-piRNAs and the 5´-ends of RPFs (Fig. 5d, left, Extended Data Fig. 8a-b, left). Consistent with the lack of in vivo processing on uORF RPFs, we detected two populations of ribosomes: polysomes enriched for uORF ribosomes, and monosomes enriched for UDR ribosomes (Fig. 6a,b, Extended Data Fig. 9a,b). Considering the length of uORFs, their protection by polysome binding may explain why uORFs lack endonucleolytic cleavage. These two populations were only separated under the conventional lysis conditions that disrupt mitochondria, as the cleaved monosomes still co-sediment with mitochondria (Fig. 6c,d). Taken together, our results indicate that the involvement of ribosomes in phased cleavage mostly occurs at UDRs.
Fig. 6. Two populations of ribosomes at uORFs and UDRs.
a, A254 absorbance profile of 10% to 50% sucrose density gradients of testis lysates from adult mouse that was lysed in conventional lysis buffer disrupted mitochondria. Compared to the amended lysis condition that preserve mitochondria (Fig. 1a, Extended Data Fig. 2a), less prominent polysome peaks were observed here. From top to bottom, the relative abundance of 28S rRNA, β-Actin mRNA, and two pachytene piRNA precursors (17-qA3.3-26735 and 7-qD2-11976). The long transcripts (>200nt) were quantified using RT-qPCR. They were normalized to spike-in controls. b, Aggregated data for ribosome occupancy on pachytene piRNA precursors (10% trimmed mean) using Ribo-seq data from polysome fraction (left) and monosome fraction (right). c, (upper) A254 absorbance profile of testis lysates lysed in mitochondria preserved lysis condition from adult mice following separation in 15% to 60% sucrose density gradients with (red) and without (blue) RNase treatment. (lower) Western blot analysis of VDAC, TDRKH, PLD6 and HA-tagged RPL22. Experiments have been repeated for at least three times independently with similar results. d, Aggregated data for ribosome occupancy on pachytene piRNA precursors (10% trimmed mean) using Ribo-seq data from 80S fraction (left) and mitochondria fraction (right). See also Extended Data Fig. 9a,b. Statistical source data are provided in Source Data Fig.6. Unprocessed blots are provided in Source Data Fig 6.
Disrupting translation compromises piRNA biogenesis
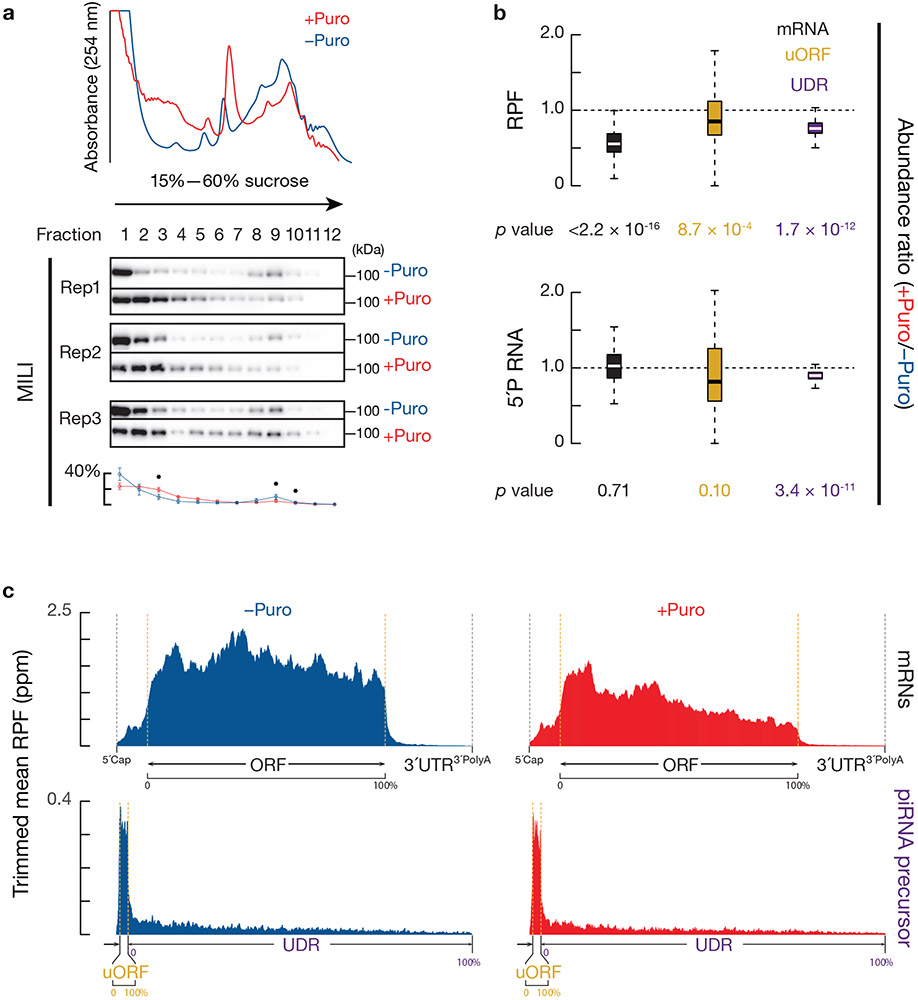
To verify a role for ribosomes in piRNA biogenesis, we developed procedures to: (1) block ribosome loading on piRNA precursors in vivo; and (2), monitor the dynamics of piRNA production by capturing pre-pre-piRNAs using degradome sequencing. Puromycin prematurely terminates peptide synthesis35. Following puromycin treatment for 2 hours, we observed a decrease in overall polysome assembly (Fig. 7a) without pleiotropic effects (Extended Data Fig. 9c). Using Ribo-seq, we found that RPFs at mRNA protein coding regions decreased significantly (Fig. 7b, upper) with the signals further declining toward the 3´-ends of ORFs (Fig. 7c). RPFs from both uORFs and UDRs of piRNA precursors also significantly decreased upon puromycin treatment (Fig. 7b, upper). The decrease of RPF signals on the UDRs is unlikely propagated from the uORF RPF decrease as the decrease is evenly across the entire UDRs (Fig. 7c).
Fig. 7. Decrease in piRNA processing intermediates upon temporal ribosome depletion.
a, (upper) A254 absorbance profile of testis lysates from adult mice with (red) and without (blue) puromycin treatment following separation in 15% to 60% sucrose density gradients. (lower) Western blot analysis of MILI with barplots showing their quantification (n = 3 independent biological samples; mean ± standard deviation); *p < 0.05, one-side Student’s paired t-test. Puro, puromycin. b, Boxplots of RPF abundance ratios (upper) and degradome abundance ratios (lower) of puromycin treated versus untreated testis from mRNA coding regions (gold) and from piRNA precursor uORFs and UDRs (purple). Lower panel shows 5´P decay intermediates from pachytene-expressed mRNA (gold) and pre-pre-piRNAs from uORFs and from UDRs (purple). Sample size n = 100 pachytene piRNA precursor UDRs and uORFs. Sample size n = 115 pachytene expressed mRNAs. p value was determined by two-side paired Wilcoxon signed-rank test. c, Aggregated data for ribosome occupancy on mRNAs (top) pachytene piRNA precursors (bottom) from untreated testis (left), and from puromycin treated testis (right) (10% trimmed mean).
See also Extended Data Fig. 9c,d. Statistical source data are provided in Source Data Fig.7. Unprocessed blots are provided in Source Data Fig 7.
Puromycin significantly decreased the abundance of pre-pre-piRNAs that are derived from the UDRs (Fig. 7b, lower, p = 3.4 x 10⁻¹¹). Puromycin also caused a redistribution of MILI proteins with a significant decrease in the mitochondria fraction where piRNA precursors are processed (Fig. 7a). Moreover, upon temporal ribosome depletion, we did not detect a change in the abundance of pre-pre-piRNAs derived from uORFs (Fig. 7b, lower, p = 0.10), the abundance of the 5´P decay intermediates from mRNAs (Fig. 7b, lower, p = 0.71), or the total mRNAs in the transcriptome as measured by RNA sequencing (Extended Data Fig. 9d), further indicating that the pre-pre-piRNA decrease is an early event and specific to UDRs. In summary, piRNA biogenesis at UDRs is compromised when ribosomes are dissociated from UDRs, suggesting that efficient piRNA processing at UDRs requires ribosomes.
Ribosome-mediated piRNA biogenesis is evolutionarily conserved
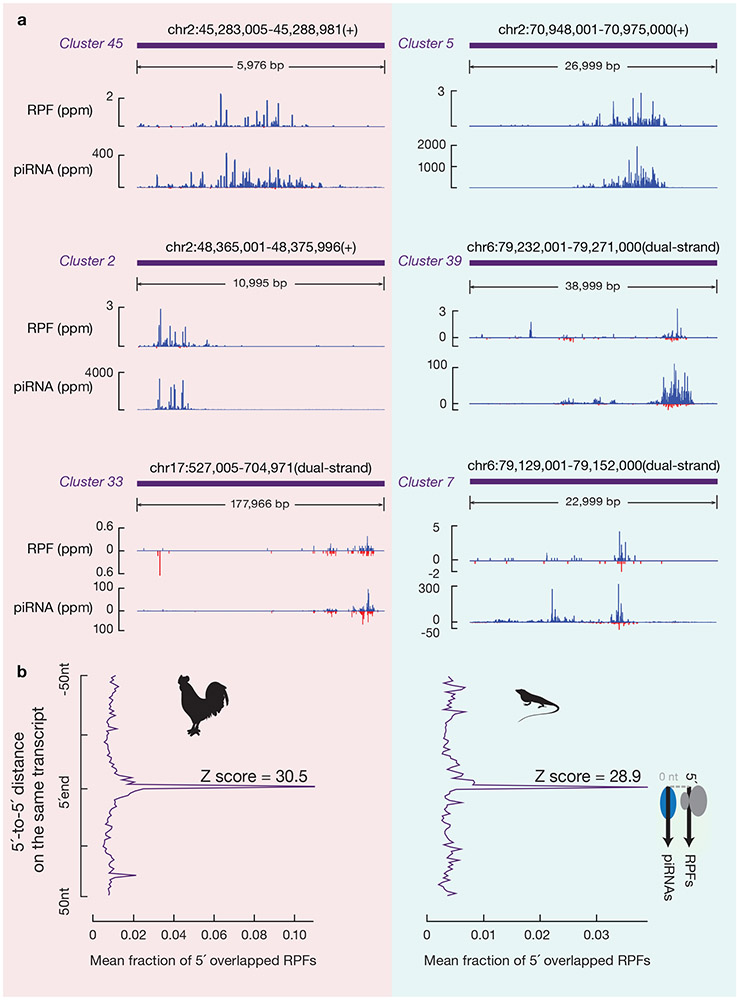
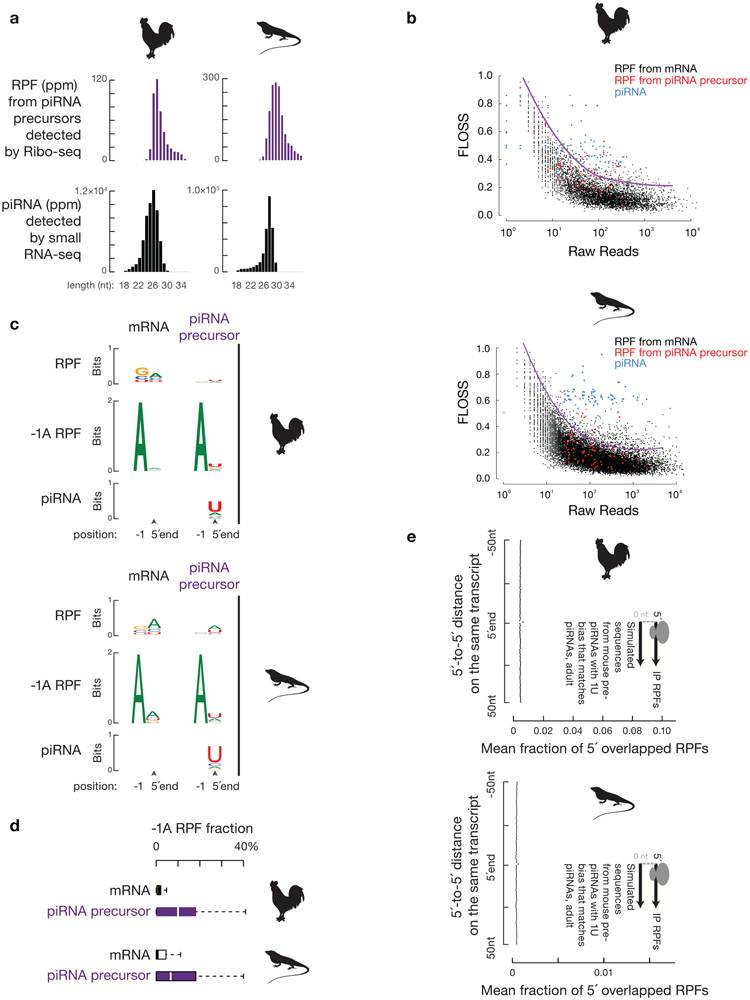
To assess whether the function of ribosomes in defining the position of piRNA formation is evolutionarily conserved for pachytene piRNAs, we performed similar experiments in roosters (Gallus gallus) and green lizards (Anolis carolinensis). Both animals express abundant non-repetitive pachytene piRNAs16,39. As was observed in mice, RPFs from roosters and green lizards were also distributed throughout piRNA precursors (Fig. 8a). The length of these RPFs, which ranged from 26–32 nt40, exhibited a significant difference from that of their piRNAs16 (Extended Data Fig. 10a,b, p value comparing the length distribution ≤ 1.1 x 10⁻⁸). 5´ in vivo processed RPFs (lack of −1A depletion, with a 1U bias, Extended Data Fig. 10c,d) from piRNA precursors also accumulated at future piRNA sites (Fig. 8b, Extended Data Fig. 10e). Moreover, there was a significant partial correlation between piRNA abundance and RPF abundance from each piRNA-producing locus, while controlling for the piRNA precursor levels measured by RNA-seq (ρ ≥ 0.54, p ≤ 6.5 x 10⁻⁹). Thus, as in mice, piRNAs from roosters and green lizards are also derived from in vivo 5´-processed ribosomal protected regions, and this processing likely is evolutionarily conserved throughout amniotes.
Fig. 8. A conserved role for ribosomes in piRNA biogenesis.
a, Normalized reads of RPFs and piRNAs mapping to three representative piRNA producing loci of roosters (left) and green lizards (right) (for dual strand clusters, Blue represents Walston strand mapping reads; Red represents Crick strand mapping reads). b, Distance spectrum of 5´-ends of RPFs that overlap piRNAs in rooster testis (upper) and lizard testis (lower).
See also Extended Data Fig. 10. Statistical source data are provided in Source Data Fig.8.
Discussion
Here, we reveal a conserved mechanism by which ribosomes participate in defining the position of piRNAs on long single-stranded RNAs. We show that ribosomes populate piRNA precursors via two distinct but interconnected mechanisms. First, ribosomes translate the 5´ uORFs of piRNA precursors by conventional translation mechanisms. Second, ribosomes translate into the piRNA precursor UDRs facilitated by MOV10L1 helicase. Endonucleolytic cleavages target ribosome-bound UDRs, with the 5´-ends of in vivo processed RPFs becoming piRNA 5´-ends (Extended Data Fig. 1, right). The biphasic involvement of ribosomes on piRNA precursors explains how piRNA biogenesis near the 5´-ends of piRNA precursors can be genetically separated from downstream piRNA biogenesis through disruption of the Tdrd5 gene32. Considering that ribosomes appear to not participate in defining the positions of piRNAs from uORFs, and that the non-repetitive pachytene piRNAs from long intergenic regions are only found in vertebrates, ribosome-mediated piRNA biogenesis may be a relatively recent evolutionary innovation.
PIWI proteins have been reported to co-sediment with ribosomes41. However, because of the overlapping length-range between RPFs (26–32 nt) and piRNAs (24–35 nt), RPFs derived from piRNA precursors seen in mouse testes were interpreted as contaminants42. In addition to our evolutionarily studies in roosters and green lizards, in which RPF length-range barely overlaps with that of piRNAs, the possibility of piRNA contamination in our RPF data has been effectively eliminated by the following results. First, the in vitro RNase digestion used to obtain RPFs removes >98% of mature piRNAs, as shown by small RNA sequencing and northern blotting. Second, RPFs from piRNA precursors display a length distribution that is significantly different from the length distribution of mature piRNAs, but similar to the length distribution of RPFs from mRNAs. Third, piRNA precursor RPFs are immunoprecipitated with ribosomes in RiboTag-expressing lysates. Fourth, piRNA precursor RPF signals respond to the translation inhibitors harringtonine and puromycin. Fifth, while piRNAs are produced at the uORF regions, the uORF RPFs do not show a 1U bias, whereas the UDR RPFs do. Sixth, the RPF signals spread into UDRs despite diminished UDR piRNA levels in Tdrd5 mutants. Therefore, while previous connections noted between the piRNA pathway and translational machinery have been viewed as controversial, we clearly demonstrate pervasive binding of ribosomes throughout piRNA precursors.
We report an unconventional function of ribosomes in small non-coding RNA formation. While ribosomes on piRNA precursors are unlikely to produce biologically meaningful peptides, they display an evolutionarily conserved function in producing piRNAs that are essential for reproduction. The translational status of UDR ribosomes is supported by their resistance to high-salt treatment, run-off after harringtonine treatment, and dissociation upon puromycin treatment. The lack of codon periodicity at UDRs (Fig. 3f) does not contradict their translational status, which has been reported when ribosomes translate transcripts with more than one reading frame43 or undergo random translation44. After harringtonine treatment, more ribosomes remain on UDRs in comparison to ribosomes on mRNA CDSs (Fig. 4b, p < 2.2 x 10⁻¹⁶), suggesting translation reinitiation on UDRs. Such downstream initiation is likely to be inefficient, explaining why less RPF signals on UDRs are detected than those on uORFs. Unlike mRNAs with uORFs, there are no long ORFs downstream of uORFs on piRNA precursors, which suggests ribosomes reinitiate processively throughout UDRs. The unusual translational status may provide the specificity that distinguishes pachytene piRNA precursors from other RNAs.
Both genetical (Mov10l1 mutation) and biochemical (puromycin treatment) blockage of UDR translation compromises UDR piRNA production, suggesting that ribosomes facilitate phased piRNA production on pachytene piRNA precursors. Based on our findings, we reason that the involvement of ribosomes may participate in piRNA production in three ways. First, the binding of ribosomes on the cleaved products stabilizes the cleavage products for PIWI loading. Since the 5´-end-loaded PIWI protein triggers the next endonucleolytic cleavage, ribosomes sustain the stepwise 5´-to-3´ fragmentation in piRNA biogenesis. Second, that elongating ribosomes themselves act as strong helicases45,46 able to remove secondary structures and RNA-binding proteins. Third, ribosomes provide a platform for biogenic and regulatory proteins to bind to pachytene piRNA precursors. Considering that artificially tethering Armitage, the Drosophila homolog of MOV10L1, to a transcript is sufficient to initiate phased piRNA biogenesis47,48, our work raises the possibility that MOV10L1 recognizes translating piRNA precursors.
In summary, we have identified ribosomes as a critical player in pachytene piRNA biogenesis. Our work reveals how piRNA biogenic factors coordinate with ribosomes to recognize and achieve highly efficient piRNA production from non-repetitive long RNAs. The unusual translation state of pachytene piRNA precursors shed light on their evolutionarily origins and germ-line specific translational controls.
Methods
Animals
All experiments were reviewed and approved by the University of Rochester’s University Committee on Animal Resources, performed in an PHS Assured and AAALAC, Int. accredited facility, and the study is compliant with all relevant ethical regulations regarding animal research. Mice of the following strains C57BL/6J (Jackson Labs, Bar Harbor, ME, USA; stock number 664); Rpl22tm1.1Psam on a C57BL/6J background (Jackson Labs; stock number 011029)17; Mov10l1tm1.1Jw on a mixed 129X1/SvJ × C57BL/6J background21; Tg(Neurog3-cre)C1Able/J on a B6.FVB(Cg) background (Jackson Labs; stock number 006333)50; and Tg(Ddx4-cre)1Dcas on a 129X1/SvJ background (Jackson Labs; stock number 006954) were genotyped as described51. Comparisons of compound mutants and controls involving Mov10l1 mutation or a RiboTag allele were performed using male siblings from individual litters at adult stage. Male Plndc1mut mice on a C57BL/6J background10 and Tdrd5tm1a mice on a C57BL/6J background32 at adult stage were raised at Michigan State University according to NIH guidelines for animal care. Testes from adult green lizards (Carolina Biological Supply Company, Burlington, NC, USA) were used for Ribo-seq. Araucana strain testes from one-year old roosters were used for polysome gradients.
Generation of flag knockin mice
Flag-knockin mice were generated using CRISPR-Cas9-mediated genome editing. Guide RNA was designed and ordered from Synthego (Redwood City, California, USA), guide for flag-knockin mice (5´ ACGTTTGGCACTAAGCTCTT AGG 3´). Homologous recombination (HR) DNA repair template was ordered from Integrated DNA Technologies (IDT, Coralville, Iowa, USA), template for flag-knockin mice (5´TCTGCATGTGGTTTTTATGGGGTTTTCCTTCATCGTTCTTTGTGAATCTCCTAAGAGCTGACTACAAAGACCATGACGGTGATTATAAAGATCATGACATCGATTACAAGGATGACGATGACAAGGCTTAGTGCCAAACGTATCCTAGGGAAACAGGTAGCTTGTTTTCTAAAAAGCTTGAGTAGAAA3´). Embryo microinjection into FVBxB62J F1 hybrid zygotes was performed as previously described27, using 50 ng/ul of sgRNA, 25 ng/ul of HR DNA repair template, 50 ng/ul of Cas9 mRNA (TriLink Biotechnologies) and 50 ng/ul of Cas9 HiFi protein (IDT). We genotyped the flag-knockin mice using the primer sets, loci12F430, 5´GTCAGTGCTCACTTGGGATATG3´, and Flag_Rev, 5ĆCTTGTCATCGTCATCCTTGTA3´, which yield a 390bp amplicon.
Small RNA sequencing library construction
Small RNA libraries were constructed and sequenced as previously described16 using oxidation to enrich for piRNAs by virtue of their 2´-O-methyl-modified 3´ termini. The oxidation procedure selects against in vitro-digested products with a 3´ phosphate. A 25-mer RNA with 2´-O-methyl-modified 3´ termini (5´-UUACAUAAGAUAUGAACGGAGCCCmG −3´) was used as a spike-in control. Single-end, 50 nt sequencing was performed using a HiSeq 2000 instrument (Illumina, San Diego, CA, USA).
Polysome gradient
Polysome profiling was performed with modifications enabling mitochondrial analysis. Fresh testes were lysed in 1 ml amended lysis buffer (250 mM Sucrose, 10 mM Tris-HCl, pH 7.5, 5 mM MgCl2, 100 mM KCl, 1 mM EGTA, 1 mM DTT, 100 μg/ml cycloheximide, and 1× Protease-Inhibitor Cocktail). Lysates were homogenized with a pellet pestle for a total of ten strokes, and incubated at 4°C with inverted rotation for 10 min. The lysates were centrifuged at 1,300 g for 10 min at 4°C; the supernatants were recovered, and the lysing step was repeated on the pellet to increase the yield. Absorbance at 260 nm was measured. Five A260 absorbance units were loaded on a 10%–50% (w/v) linear sucrose gradient prepared in buffer (20 mM HEPES-KOH, pH 7.4, 5 mM MgCl2, 100 mM KCl, 2 mM DTT, 100 μg/ml cycloheximide) and centrifuged in a SW-40ti rotor at 35,000 rpm for 2 h 40 min at 4°C. Alternatively, three A260 absorbance units were loaded on a 15%–60% (w/v) linear sucrose gradient and centrifuged in a SW-55ti rotor at 40,000 rpm for 2 h 30 min at 4°C. Samples were collected from the top of the gradient using a gradient Fractionation system (Brandel, Boca Raton, FL, USA; BR-188) while monitoring absorbance at 254 nm.
For conventional lysis condition, testes were flash frozen in liquid nitrogen, and lysed in 1 ml of conventional lysis buffer (10 mM Tris-HCl, pH 7.5, 5 mM MgCl2, 100 mM KCl, 1% Triton X-100, 2 mM DTT, 100 μg/ml cycloheximide and 1× Protease-Inhibitor Cocktail).
For high salt treatment, the cleared tissue lysates from conventional lysis buffer were adjusted to a final concentration of 500 mM KCl, and incubated on ice for 1 hour. The sucrose gradient buffer for high salt treated sample was also adjusted to 500 mM KCl.
Synthetic spike-in RNAs were added to each collected fraction before RNA purification. RNA was purified by Trizol (Ambion, Waltham, MA, USA) using the Direct-zol™ RNA MiniPrep plus Kit (Zymo Research, Irvine, CA, USA).
Proteins in each fraction were concentrated by methanol/chloroform protein precipitation52. The protocol was optimized to produce >80% yield.
Ribosome profiling (Ribo-seq)
Ribo-seq was performed as previously described40. The testes were lysed in conventional lysis condition. Cleared testis lysates were incubated with 60 units of RNase T1 (Fermentas, Waltham, MA, USA) and 100 ng of RNase A (Ambion) per A260 unit for 30 min at room temperature. Samples were loaded on sucrose gradients, and after centrifugation, the fractions corresponding to 80S monosomes were recovered for library construction.
The Ribo-seq in Fig. 6c,d were performed under the amended lysis conditions that preserve mitochondria, and after in vitro RNase digestion, both 80S peak and mitochondrial peak were recovered for library construction.
RNA sequencing
Strand-specific RNA-seq libraries were constructed following the TruSeq RNA sample preparation protocol as previously described16,40. rRNAs were depleted from total RNAs with complementary DNA oligomers (IDT) and RNaseH (Invitrogen, Waltham, MA, USA)53. Single-end sequencing (126 nt) of libraries was performed on a HiSeq 2000.
Degradome-seq library construction
Degradome-seq library construction was performed as described previously54 with modification. The RNAs were first oxidized at room temperature for 30 minutes with sodium periodate (Sigma, St. Louis, MO, USA) to block the 3´-ends from ligation, and were then size-selected to isolate RNA ≥ 200 nt (DNA Clean & Concentrator™-5, Zymo Research). 5´ adaptors were attached using T4 RNA ligase (Ambion) at 20°C for 3 hours. The ligated products were subjected to rRNA depletion with complementary DNA oligomers (IDT) and RNaseH (invitrogen)53,55. The rRNA depleted ligation products were reverse transcribed using a degenerate primer (5´-GCACCCGAGAATTCCANNNNNNNNC-3´). cDNA was amplified by PCR using KAPA HIFI Hotstart polymerase (Kapa Biosystems, Wilmington, MA, USA), and 250–350 nt dsDNA was isolated on 8% native PAGE gels. An Illumina HiSeq 2000 was used to perform single-end sequencing.
Histology and immunostaining
For histologic analysis, testes were fixed in Bouin's solution overnight, embedded in paraffin, and sectioned at 4 μm. Following standard protocols, sections were deparaffinized, rehydrated, and then stained with Hematoxylin and Eosin.
For immunostaining, testes were fixed in 4% paraformaldehyde overnight followed by embedding in paraffin. The following primary antibodies were used: mouse monoclonal anti-HA antibody (ascites fluid, 1:2000 dilution; Covance, Princeton, NJ, USA; MMS-101P) and mouse IgG isotype control (the same antibody concentration as anti-HA, Abcam, Cambridge, UK; ab37355). Detection was with HRP-conjugated anti-mouse IgG.
For cryosections, we followed a previously described protocol56. Rabbit anti-CRE antibody (1:200 dilution; Cell Signaling Technology, Danvers, MA, USA; 12830S) and mouse monoclonal anti-HA antibody (ascites fluid, 1:2000 dilution; Covance, MMS-101P) were used. Secondary antibodies conjugated with either Alexa Fluor 488 or 594 (Molecular Probes, Eugene, OR, USA) were used at a dilution of 1:500.
FLAG immunostaining was performed on squashed spermatocytes as previously described57. Seminiferous tubules were fixed in 2% paraformaldehyde containing 0.1% Triton X-100 for 10min at room temperature, placed on a slide coated with 1 mg/ml poly-L-lysine (Sigma) with a small drop of fixative, and gently minced with tweezers, and squashed. The coverslip was removed after freezing in liquid nitrogen. The slides were later rinsed three times for 5min in PBS and incubated for 12 hours at 4°C with mouse anti-FLAG (1:25; Sigma F1804). Secondary antibodies conjugated with Alexa Fluor 594 (Molecular Probes, Eugene, OR, USA) were used at a dilution of 1:500.
Immunoprecipitation from mouse testes
For anti-HA immunoprecipitation from RiboTag mouse testes, testes were homogenized and immunoprecipitation was performed as described previously17 with minor modifications (Extended Data Fig. 2e,9a). A sample of the lysate before IP (10%) was saved as input. Anti-HA Magnetic Beads (Pierce, Biotechnology, Waltham, MA, USA) were added to the testis lysates, and lysates were incubated overnight at 4°C. Total RNAs on the beads and in the input were purified by Trizol. In Extended Data Fig. 2e, an in vitro transcribed spike-in RNA was added into the washed beads as well as the input. In Extended Data Fig. 9a, an in vitro transcribed spike-in RNA was added after washing according to the estimated amount of total RNAs in the input.
To determine whether interactions between PIWI proteins and ribosomes were RNA dependent, after overnight incubation, the beads were incubated with 60 units of RNase T1 (Fermentas) and 100 ng of RNase A (Ambion) per A260 unit for 30 min at RT prior to the washing step of the immunoprecipitation.
Western Blotting
For protein detection, concentrated proteins from each fraction were dissolved in 4 M Urea in 1x SDS-sample buffer (50 mM Tris-HCl, pH 6.8, 2% [w/v] sodium dodecyl sulfate, 10% [v/v] glycerol, 1% [v/v] β-mercaptoethanol, 12.5 mM EDTA, 0.02% [w/v] bromophenol blue) and resolved by electrophoresis on 10% SDS-polyacrylamide gels. The proteins were transferred to a 0.45 μm PVDF membrane (EMD Millipore, Billerica, MA, USA), and the blot was probed with anti-HA mouse monoclonal antibody (Covance, MMS-101P, 1:2000), anti-VDAC rabbit antibody (EMD Millipore, PC548, 1:10000), anti-TDRKH rabbit antibody (Proteintech Group, Inc, Rosemont, IL, USA; 13528-1-AP, 1:2000), anti-PLD6 rabbit antibody (MBL International, Way Woburn, MA, USA; M207-3, 1:500), anti-MIWI rabbit antibody (Abcam, ab12337, 1:2000), anti-MILI rabbit antibody (Abcam, ab36764, 1:2000), anti-TDRD5 rabbit antibody (home-made from Chen Lab, 1:1000), anti-RPS6 rabbit antibody (Cell Signaling, 2217, 1:1000), anti-RPL5 rabbit antibody (Bethyl, A303-933A, 1:1000), or anti-MOV10L1 rabbit antibody (gift from Wang Lab, 1:250), and then detected with sheep anti-mouse IgG-HRP (GE Healthcare, Little Chalfont, UK; NA931V, 1:10,000), donkey anti-rabbit IgG-HRP (GE Healthcare, NA934V, 1:10,000) or anti-rabbit IgG-HRP VeriBlot (Abcam, ab131366, 1:1000) for immunoprecipitated MOV10L1 blotting (Abcam, ab131366, 1:1000).
For FLAG-tagged micropeptide detection, 15% SDS-polyacrylamide gels and a 0.20 μm PVDF membrane (EMD Millipore, Billerica, MA, USA) were used. The blot was probed with anti-FLAG mouse monoclonal antibody (Sigma, F3165, 1:1000)
Quantitative reverse transcription PCR (qRT–PCR)
Extracted RNAs were treated with Turbo DNase (Thermo Fisher, Waltham, MA, USA) for 20 mins at 37°C, and were then size-selected to isolate RNA > 200 nt (DNA Clean & Concentrator™-5, Zymo Research) before reverse transcription using All-in-One cDNA Synthesis SuperMix (Bimake, Houston, TX, USA). Quantitative PCR (qPCR) was performed using the ABI Real-Time PCR Detection System with SYBR Green qPCR Master Mix (Bimake). Data were analyzed using DART-PCR58. Spike-in RNA was used to normalize RNAs in different fractions. Supplementary Table 1 lists the qPCR primers. At least three biological replicates were used in each sample, and Student’s t test was applied for statistical analysis.
Northern hybridization
Total RNAs (10 μg) were resolved on a 0.4 mm thick, 15% denaturing polyacrylamide sequencing gel. Before loading, the gel was pre-run for 40 min at 35 W, providing a surface temperature of 35°–40°C at the time of loading. Samples were denatured in formamide loading dye at 95°C for 5 min prior to loading. Gels were run at 35 W for ~2 h, achieving a surface temperature of 45°–50°C. After electrophoresis, the lower portion of the gel, which included 15–35 nt RNA, was transferred at 20 V for 1 h onto a Hybond-N+ membrane (Amersham Biosciences, Piscataway, NJ, USA) in 0.5× TBE (Tris-Borate-EDTA) buffer using a semi-dry transfer system (Transblot SD, Bio-Rad, Hercules, CA, USA). The RNAs were crosslinked to the membrane using 1-ethyl-3-(3-dimethylaminopropyl) carbodiimide (EDC)59 (EDC cross-linking selects against in vitro-digested products with 5´ OH), and were pre-hybridized in Church buffer for at least 1 hour at 37°C. DNA oligonucleotide probe (antisense to a piRNA from 7-qD1-16444, 5´-GCTTGTAGAGGAAAAGACACTGTTTCTCA-3´) (Integrated DNA Technologies, Coralville, IA, USA) was 5´ 32P-radiolabeled using T4 PNK (New England Biolabs, Ipswich, MA, USA) and γ-32P-ATP (450 μCi per reaction, specific activity ~6000 Ci/mmol; Perkin Elmer, Waltham, MA, USA). After labeling, unincorporated nucleotides were removed using a Sephadex G-25 spin column (GE Healthcare, Pittsburgh, PA, USA), and the probes were added to the Church buffer and hybridized overnight at 37°C. Membranes were washed three times for 10 min in 2×SSC containing 0.1 % SDS (w/v) at 37°C, and were exposed to storage phosphor screens (Fuji, Minato, Tokyo, Japan).
Intra-testicular injection
The mice were anesthetized with Ketamine/Xylazine mixture (Ketamine 100 mg/kg; Xylazine 25 mg/kg) via intraperitoneal injection. After complete anesthesia, testes were exteriorized with a longitudinal incision around 1 cm at the center of abdomen. The tunica albuginea was penetrated using a sharp 26 G needle (BD, Franklin Lakes, NJ, USA, 30511) 1 mm from the vascular pedicle, and the needle was withdrawn to generate path for introducing a blunt end Hamilton needle (Hamilton, Reno, NV, USA, 7786-02). PBS containing 0.02% Fast Green FCF (Thermo Fisher Scientific, Waltham, MA, USA) with harringtonine (LKT labs, 0.5 μg/μl in a total volume of 10 μl) or puromycin dihydrochloride (Invitrogen, 2.5 μg/μl in a total volume of 10 μl) was slowly injected using a Hamilton microsyringe (1705RN) into one testis, and vehicle control without drug was injected into the other testis. The needle was held in place for 30 seconds before removal to prevent back flow of the solution. Successful completion of injection was indicated by testis filled with green solution. The testes were returned to the abdominal cavity after injection. The incisions were sutured. At the end point, the mice were euthanized by cervical dislocation, and the testes were collected.
General bioinformatics analyses
Analyses were performed using piPipes v1.460. All data from the small RNA sequencing, ribosome profiling (Ribo-seq), RNA sequencing, and degradome sequencing were analyzed using the latest mouse genome release mm10 (GCA_000001635.7), chicken genome release galGal5 (GCA_000002315.3) and green lizard genome release anoCar2 (GCA_000090745.1). Generally, one mismatch is allowed for genome mapping. For mouse transcriptome annotation, 100 pachytene piRNA precursors defined in our previous studies with mm916 were converted to mm10 coordinates with using liftOver61 with minor manual correction (Supplementary Table 2). We selected 115 A-MYB-driven mRNAs by their decreased expression in A-Myb mutants compared to heterozygous controls at 17.5 dpp (q < 0.01) and by the presence of A-MYB ChIP-seq peaks within 500 bp of their transcription start sites16. For genes with alternative transcripts, the most abundant transcript involving that gene was selected. Testis somatic RNAs enriched in Sertoli cells and Leydig cells were selected based on previous findings62. We have previously assembled mRNAs, and have defined piRNA clusters for chicken transcriptome annotation40. The top 100 most abundant rooster piRNA clusters were used for analysis in this study. We used the top 100 most abundant green-lizard piRNA clusters defined previously for analysis in this study (we excluded the cluster 1, which overlaps with rRNA coding regions)39. Statistics pertaining to the high-throughput sequencing libraries constructed for this study are provided in Supplementary Table 3-6.
For small RNA sequencing, libraries were normalized to the sum of total miRNA reads; spike-in RNA was used to normalize the libraries with and without RNase treatment. Uniquely mapping reads >23 nt were selected for further piRNA analysis. We analyzed previously published small RNA libraries from adult wild-type mouse testis (GSM1096604)16, mouse Tdrd5 CKO, control testis (SRP093845)32, mouse Pnldc1 KO testis (SRP095532)10, MILI and MIWI IP from Pnldc1 KO spermatocytes (PRJNA421205)12, adult rooster wild-type testis (GSM1096613)16, and adult green-lizard testis (SRR5420128)39. We report piRNA abundance either as parts per million reads mapped to the genome (ppm), or as reads per kilobase pair per million reads mapped to the genome (rpkm) using a pseudo count of 0.001. To ensure precision of the mapping, a piRNA is counted only when the 5´-end of the piRNA maps to the uORF or UDR of a transcript.
For RNA-seq reads, the expression per transcript was normalized to the top quartile of expressed transcripts per library as previously described16, and the tpm (transcripts per million) value was quantified using the Salmon algorithm63. We analyzed previously published RNA-seq libraries from adult wild-type mouse testis (GSM1088420)16, adult rooster wild-type testis (GSM2454693)16, and adult green-lizard testis (SRR5420127)39.
Ribo-seq analysis followed the modified small RNA pipeline including the junction mapping reads as previously described40. Uniquely mapping reads between 26 nt and 32 nt were selected for further analysis. Libraries from different developmental stages were normalized to the sum of reads mapping to mRNA protein-coding regions, assuming that mRNA translation was largely unchanged during spermatogenesis. Libraries from harringtonine treatment were further normalized to the sum of reads mapping to mitochondrial coding sequences as previously described31. Libraries from puromycin treatment were further normalized to the sum of reads mapping to the 5´-UTR of mRNAs, based on the previous report that ribosomes on uORFs of mRNAs are resistant to puromycin treatment64. We analyzed published Ribo-seq libraries from mouse wild-type testis at 21 dpp (GSM1234252)42 and from adult rooster wild-type testis (GSM2454692)40.
Degradome reads were aligned to the genome using TopHat 2.0.1265. Reads were mapped uniquely using the ‘-g 1’ flag. Uniquely mapping reads were selected for further analysis. Libraries were normalized to the sum of reads mapping to mRNA protein-coding regions, assuming that mRNA cleavage was largely unchanged during spermatogenesis.
5´-end overlap analysis and phasing analysis
Reads were mapped to the transcriptome, and their relative positions on transcripts were reported. For alternative transcription with overlapping annotations, we chose the longest transcript. We calculated the distance spectrum of 5´-ends of Set A (RPFs or degradome reads) that overlapped with Set B (piRNAs or simulated sequences) as follows: For each read b in Set B, we identified all the reads in Set A whose 5´-ends overlapped within the 50 nt region upstream of b including the 5´-end of b and 50 nt downstream of b (100 nt window of b reads). We assigned the b spectrum as the fractions of 5´-ends of a reads distributed across the 100 nt window of b reads. The height of the b spectrum at each nucleotide position in the 100 nt window of b reads was based on the number of a reads whose 5´-ends overlapped at this position divided by the total number of a reads whose 5´-ends overlapped with the 100 nt window of b reads. The sum of all b spectra was then divided by the total number of reads in Set B. We defined this average fraction of 5´-ends of a reads that overlapped with the 100 nt window of b reads as the distance spectrum of 5´-ends of Set A that overlap Set B.
This analysis avoids double counting when the 5´-end of a read in Set A maps to more than one position in Set B, and the positional extension of Set B is on the transcript rather than the genome (source code available on Github https://gist.github.com/nimezhu/d8734d2ae6c1619218f1). The Z-score for overlap at the 5´-end position was calculated using the spectral value at positions −50–−1 and 2–50 as background.
For phasing analysis, we calculated the distance spectrum of 5´-ends of Set A (RPFs or pre-piRNA reads) that overlapped with the 3´-end of Set B (pre-piRNA reads). Z0 scores for phasing were calculated as previously described6 with modification using distances from −10 to −1 and from 1 to 10 as background.
Nucleotide periodicity
Nucleotide periodicity was computed as previously described40,66. We first aligned the RPFs to each other using 5´-end overlap analysis, and reported the distance spectrum. An annotated ORF was not a prerequisite for this analysis as the distance spectrum of RPFs from mRNAs already showed a 3-nt periodicity pattern. We then transformed the distance spectrum using the “periodogram” function from the GeneCycle package67 with the “clone” method. The relative spectral density was calculated by normalizing to the value at the first position.
Generating simulated sequences as negative controls
We generated a random pool of 28-mer sequences using a sliding window of 1 nucleotide from 5´ to 3´ of the piRNA precursors. We then sampled from this 28-mer pool to match the first nucleotide composition of the real reads. These simulated sequences from piRNA precursors were used as random controls for piRNAs (source code available upon request).
ORF analysis
We restricted our analysis to ORFs initiated by an AUG start codon as described previously23. We first defined all the ORFs of pachytene piRNAs; we did not include any AUGs within 3 nt of the 5´-end of the transcript. We defined the sites of AUG-mediated initiation as previously described23,68 with modification. We used Ribo-seq data from harringtonine-treated Mov10l1 CKO mutant testes. We identified codons in which A site occupancy on the +1 codon was greater than the occupancy on the +3 codon and greater than the sum of occupancy on the −2 and −1 codons. Among these AUG harringtonine peaks, we selected the peak closest to the 5´-end.
We recognize that ribosome signals do not necessarily drop after the first stop codon. Therefore, we defined the translation termination sites using the ribosome release score (RRS)24. We calculated the RRSs across all possible ORFs within a pachytene piRNA precursor, and then analyzed the ORF having the highest RRS (maximum RRS). In our analysis, we defined the ORF with the highest RRS as the last ORF of the coding region.
Using AUG peaks and maximum RRS, we defined the coding regions of piRNA precursors with manual correction for transcripts with alternative isoforms or containing repetitive regions. In these cases, at least one criterial AUG peak or the maximum RRS was used to define the coding region. To define middle ORFs between the first ORF and the last ORF, we required that they had AUG harringtonine peaks.
Fragment Length Organization Similarity Score (FLOSS)
Fragment length organization similarity scores (FLOSS) were calculated as described previously23. We first corrected the P site offset (12 nt) of ribosome footprint 5´-ends, and then computed a reference length distribution histogram (26–32 nt) by counting uniquely mapping ribosome footprints on mRNA CDS. The f(l) was defined as the fraction of length l footprints among all footprints. When applying the calculation to piRNAs, we first downsampled the piRNAs to match the number of reads of RPFs from piRNA precursors. We compared the FLOSS of RPFs from piRNA precursors with the FLOSS of downsampled piRNAs using paired Wilcoxon signed-rank test.
Statistics and Reproducibility
Statistical analyses were performed in R 3.5.069. The significance of the differences was calculated by Wilcoxon signed-rank test except as indicated in the text. The significance of correlation was performed using partial correlation analysis in addition to simple correlations36. The replicate numbers and sample sizes were listed in the figure legends. Box plots: 25th and 75th percentiles; whiskers: 5th and 95th percentiles; midline, median (the same definition was used throughout the manuscript). Sample size n = 100 pachytene piRNA precursors, uORFs, and UDRs. Sample size n = 115 pachytene expressed mRNAs, mRNA ORFs, and germ-line mRNAs.
Extended Data
Extended Data Fig. 1. Comparison of the current model (left panel) of pachytene piRNA biogenesis and the revised model (right panel).
The grey bubbles represent the large and small subunits of ribosomes. The blue bubbles represent PIWI proteins. Grey circle in PIWI proteins on the left represents MID domain that recognizes the 5´-phosphate (5´P)70,71, on the right represents PAZ domain, in between represents PIWI domain. In both models, piRNA precursors are synthesized by RNA polymerase II, and contain the 5´-cap, exons, introns, and a poly(A) tail. The transcription of pachytene piRNA genes is controlled by A-MYB. The 5´-end-loaded PIWI proteins specify the endonuclease PLD6 cleavage site, determine the 5´- and 3´-ends of pre-piRNAs, and generate strings of head-to-tail phased piRNAs that will be further trimmed and methylated. In the revised model, ribosomes associate with precursors in a canonical fashion through initiating at the start codon near the 5´-cap. Facilitated by MOV10L1, ribosomes translate into the UDRs (Purple arrows). Ribosome-bound UDRs are targeted by PLD6-mediated cleavage. The cleavage of piRNA precursors upstream of the ribosome E site (at the exit site of the mRNA ribosome channel) does not prevent the ribosome from translating towards the 3´-end of the piRNA precursors. The cleavage machinery, generating 1U bias, appears to pause the ribosomes, leading to the detection of in vivo processed RPFs dwelling at future piRNA sites at the steady-state. As ribosomes translocate, they can release the 5´P of pre-pre-piRNAs for PIWI loading that guides stepwise phased piRNA production. piRNA biogenesis at the UDRs requires TDRD5 protein. Transcripts containing ORFs are translated by polysome, and they are processed to piRNAs in a distinct manner that does not require TDRD5 (Gold arrows).
Extended Data Fig. 2. Ribosomes associate with pachytene piRNA precursors.
a, A254 absorbance profile of testis lysates from adult mice following separation in 10% to 50% sucrose density gradients. The testes were lysed in amended lysis buffer that preserves mitochondria. Top to bottom, relative abundance of 18S rRNA, 28S rRNA, 12S rRNA, Mcm5 mRNA, and two pachytene piRNA precursors: 17-qA3.3-26735 and 7-qD1-16444. For Extended Data Figure 2 a, c, d, experiments have been repeated for at least three times independently with similar results. b, Fraction of RNAs in lysates relative to total RNAs in both lysates and pellets. The long transcripts were quantified using RT-qPCR (three independent biological samples; mean ± standard deviation, n = 3 independent experiments). Quantification of piRNA precursors in pellets during lysate preparation revealed that 63 ± 9% of 7-qD1-16444 and 77 ± 4% of 17-qA3.3-26735 precursors were present in soluble lysates, as were 65 ± 13% of Mcm5 mRNA and 75 ± 1% of 12S rRNA. Each data point was overlaid as dot plots. c, Immunohistochemical staining on 6-μm testis sections from Ddx4-cre:RiboTag mice (left 2 panels) and control littermates (without Ddx4-cre, right 2 panels) using anti-HA (upper 2 panels) and mouse IgG isotype control (bottom 2 panels). HA expression in Ddx4-cre:RiboTag mice (upper left) was most prominent in the cytosol of spermatocytes (marked with arrow), but not in Sertoli cells (marked with arrow). No staining was seen in RiboTag control testis (upper right) or sections probed using mouse IgG isotype control as the primary antibody (bottom two panels). Scale bar, 50 μm. d, Immunostaining of testis cryosections from Neurog3-cre:RiboTag mice (left) and from control littermates (without Neurog3-cre, right) using anti-HA, anti-CRE, DAPI, and merged (top to bottom). Scale bar, 75 μm. e, Schematic of affinity purification procedure for ribosome-associated RNAs. In vitro transcribed Renilla RNA was used as a spike-in for normalization. Statistical Source Data are provided in Source Data Extended Data Figure 2.
Extended Data Fig. 3. Ribosomes directly bind to pachytene piRNA precursors.
a, Schematic of Ribo-seq library construction. b, Northern hybridization of a piRNA from a pachytene piRNA precursor, 7-qD1-16444. Total RNAs from equal amounts of testis lysates treated with or without RNaseA&T1 were resolved by electrophoresis and detected by northern hybridization. The intensity of probe signals has been confirmed to be linear with respect to the amount of RNA (r > 0.99). c, Length histogram of RPFs from mRNA protein coding regions. d, Fragment length analysis plot of total RPF reads per transcript and FLOSS relative to the nuclear coding sequence average from wild-type testes. Fragment Length Organization Similarity Score (FLOSS) was computed as previously described23. For different raw read counts, to detect extremely large FLOSS values, outlier cutoffs were calculated using Tukey’s fences method and smoothed using LOESS regression. The purple curve shows the smoothed cutoff line. piRNAs were downsampled to match the read number of RPFs from piRNA precursors before calculating FLOSS. Statistical Source Data are provided in Source Data Extended Data Figure 3. Unprocessed blots are provided in Source Data Extended Data Figure 3.
Extended Data Fig. 4. RPF signals on piRNA precursors respond to translation inhibitors.
a, Examples of pachytene piRNA genes with single uORF (two on the left), and pachytene piRNA genes with multiple uORF (one on the right). Browser views of piRNA precursor loci with normalized reads of RPFs and piRNAs. Grey shades highlight the uORF regions. Ppm, parts per million. b, A254 absorbance profile of testis lysates from adult mice with (blue) and without (black) harringtonine treatment following separation in 15% to 60% sucrose density gradients. Harr, harringtonine. c, Aggregated data for RPF abundance on pachytene expressed mRNAs from untreated testis (top), and from harringtonine treated testis (bottom) across 5´TRs, ORFs, and 3´-UTRs of pachytene-expressed mRNAs. The x-axis shows the median length of these regions, and the y-axis represents the 10% trimmed mean of relative abundance. d, Cumulative distribution of Z scores comparing lengths of the longest ORFs from mRNAs (black line), lncRNAs (grey line), and pachytene piRNA precursors (pre-piRNAs) (purple line) with the length of the predicted longest ORF from the random shuffled background. Given a sequence X, its nucleotides were shuffled to generate a sequence Y. The length N of the longest ORF in Y was counted. After repeating this procedure 10,000 times, the Empirical Null Distribution of ORF lengths conditioned on the nucleotide distribution of X was obtained. The Z score of the ORF length of X was calculated based on this empirical null distribution. The dashed line denotes a Z-score of 2.58, which corresponds to p = 0.01 according to a two-side Z-test. The 29 ORFs from piRNA precursor transcripts with a Z score > 2.58 were from transposons embedded in the transcripts. e, Length histograms of total testis small RNAs from Control (Mov10l1CKO/Δ, left) and Mov10l1 CKO (Mov10l1CKO/Δ Neurog3-cre, right). Statistical Source Data are provided in Source Data Extended Data Figure 4.
Extended Data Fig. 5. uORFs on the piRNA precursors recruit ribosomes through canonical translation initiation.
a, Boxplots of RPF abundance at each start codon relative to the median density across the gene with and without harringtonine (Harr) treatment. The occupancy at a codon 20, 40, and 60 positions downstream of the start codon is depicted as a control. Sample size n = 100 pachytene piRNA precursors. Experiments have been repeated from two independent biological samples and mean is used for plotting. p value was determined by two-side paired Wilcoxon signed-rank test. b, Histogram of the distance from the 5´-cap to the start codon. AUG start sites typically fall in the first few hundred nt of transcripts. c, Sequence logos depicting the KOZAK consensus sequences. The start codons of single-ORF transcripts displayed weaker KOZAK consensus sequence with the critical A at the −3 position and the critical G at the +4 position. The A at the AUG codon being the +1. The start codons of the first ORFs for multi-ORF transcripts lack the critical A at the −3 position and the critical G at the +4 position. d, Boxplots of the mean PhastCons score72 (probability that each nucleotide belongs to a conserved element) of the genomic regions of putative 5´-UTR, uORF, and UDR of pachytene piRNA precursors, and 5´-UTR, ORF, and 3´-UTR of pachytene expressed mRNAs among placental mammals. Sample size n = 100 pachytene piRNA precursors; Sample size n =115 pachytene expressed mRNAs. e, Scatterplots of RPF abundance in ORFs relative to the overall abundance on the transcript from adult wild-type testes. f, A254 absorbance profile of testis lysates from Flag-knockin mice following separation in 15% to 60% sucrose density gradients. Western blot analysis of the FLAG-tagged micropeptide from testes of flag-knockin mice with anti-FLAG antibodies. Scheme of the flag-knockin mice was listed on the right. Experiments have been repeated for two times independently with similar results. g, Immunolabeling of squashed pachytene spermatocytes from flag-knockin mice and from control mice. Three examples of each genotype were shown using anti-FLAG, DAPI, and merged. Statistical Source Data are provided in Source Data Extended Data Figure 5. Unprocessed blots are provided in Source Data Extended Data Figure 5.
Extended Data Fig. 6. UDR RPFs are bona fide ribosome footprints.
a, Boxplots of the change in ribosome density (upper) or piRNA abundance (lower) per gene in Mov10l1 mutants (Mov10l1CKO/Δ Neurog3-cre, lower) compared to littermate controls (Mov10l1CKO/Δ, upper) in testes. Experiments in a and f have been repeated for three biological replicates and mean is used for plotting. Sample sizes in a and f, n = 100 pachytene piRNA precursors; n =115 pachytene expressed mRNAs. b, Aggregated data for RPF abundance on mRNAs (10% trimmed mean). c, Browser views of piRNA precursor loci with normalized degradome reads. No degradome peak around stop codon was observed. d, Aggregated data for RNA-seq abundance on pachytene piRNA precursors (10% trimmed mean). e, Western blot analyses of RPL5 (Ribosomal large subunit component), RPS6 (Ribosomal small subunit component), and MOV10L1. Experiments have been repeated for two times independently with similar results. f, Boxplots of the change in ribosome density (upper) or piRNA abundance (lower) per gene in Tdrd5 mutants compared to littermate controls in testes. The piRNAs were analyzed using publicly available datasets32. g, Metagene analysis of piRNA abundance from 50 nt upstream stop codon to 1,000 nt downstream stop codon. h, Schematic of affinity purification of germ-line specific RPFs. i, Length histograms of anti-HA immunoprecipitated RPFs from uORF (top) and UDR (bottom) pachytene piRNA precursors in testis. j, A254 absorbance profile of 15% to 60% sucrose density gradients of adult mouse testis lysed in conventional lysis conditions in which mitochondria were disrupted. Normal salt (blue) and high salt (grey). The substantial decrease in the monosome peak with high salt treatment confirms that the high salt buffer can dissociate translation-inactive ribosomes73. k, Aggregated data for RPF abundance on mRNAs (10% trimmed mean) (normal salt, upper, and high salt, lower). The high salt treatment releases the ribosomes at the stop codon of mRNAs as these terminated ribosomes have released their nascent polypeptides. Statistical Source Data are provided in Source Data Extended Data Figure 6. Unprocessed blots are provided in Source Data Extended Data Figure 6.
Extended Data Fig. 7. Ribosomes bind piRNA precursors at the future piRNA sites.
a, Boxplots of distance spectra of 5´-ends of anti-HA immunoprecipitated RPFs from adult testis that overlap simulated sequences. The 5´-end overlap analyses between RPFs and simulated sequences were computed 10,000 times (sample size n = 10,000 5´-end overlap analyses). b, Boxplots of distance spectra of 5´-ends of sheared RNA fragments that overlap piRNAs of adults. The sheared RNA fragments were randomly downsampled 10,000 times to match the read numbers of RPFs immunoprecipitated from adult testis (sample size n = 10,000 5´-end overlap analyses). c, Distance spectrum of 5´-ends of RPFs from a publicly available dataset42 that overlap piRNAs from our dataset. We believe the higher accessibility of RNase I (used in42) compared to RNaseT1&A (used in this study) sometimes clipped one nucleotide from the 5´-end and resulted in a peak at the second position. Experiments have been repeated from two independent biological samples and mean is used for plotting. Higher accessibility of RNase I compared to Xrn1 has been reported66. d, Boxplots of the fraction of RPF with a 5´ upstream A in total RPFs per transcript. Mean of three biological replicates of anti-HA immunoprecipitated RPFs from adult testis were used. e, Distance spectra of 5´-ends of anti-HA immunoprecipitated degradome reads that overlap piRNAs in adults. f, Scatterplots of piRNA abundance versus 5´P RNA abundance (anti-HA immunoprecipitated degradome reads) from adults per pachytene piRNA precursors (sample size n = 100 pachytene piRNA precursors). Rpkm, reads per kilobase pair per million reads mapped to the genome. The partial Spearman’s correlation efficient and the corresponding p-value based on two-sided Spearman’s correlation test were listed, controlling for the piRNA precursor level measured by RNA-seq. Statistical Source Data are provided in Source Data Extended Data Figure 7.
Extended Data Fig. 8. Phased cleavages occur on ribosome-bound piRNA precursors.
a, Distance spectrum of 5´-ends of anti-HA immunoprecipitated RPFs from uORFs (left) and from UDRs (right) that overlap 3´-ends of MILI-bound pre-piRNAs in Pnldc1 mutant testis (three biological replicates). Data are mean ± standard deviation. b, Distance spectrum of 5´-ends of anti-HA immunoprecipitated RPFs from uORFs (left) and from UDRs (right) that overlap 3´-ends of MIWI-bound pre-piRNAs in Pnldc1 mutant testis (three biological replicates)6. Data are mean ± standard deviation. c, Distance spectrum of 5´-ends of piRNAs from uORFs (left) and from UDRs (right) that overlap 3´-ends of pre-piRNAs in Pnldc1 mutant testis6. Experiments have been repeated for two biological replicates and mean is used for plotting. d, Sequence logos depicting the nucleotide bias at 3´-ends and 1 nt downstream of the 3´-ends of total pre-piRNA species (top), MILI-bound pre-piRNA species (middle), and MIWI-bound pre-piRNA species (bottom) from Pnldc1 mutants. Statistical Source Data are provided in Source Data Extended Data Figure 8.
Extended Data Fig. 9. Dual mode interactions between ribosomes and piRNA precursors at uORFs and UDRs.
a, Schematic of affinity purification procedure for ribosome-associated RNAs. Renilla RNA was used as a negative control. Firefly RNA was used as a spike-in for normalization. b, RNA enrichment in affinity-purified ribosomes versus control monosome IP from littermates (without Cre). The abundance of transcripts was quantified using qRT-PCR with three independent biological samples (mean ± standard deviation; n = 3 independent experiments). *p < 0.05 by one-side Student’s t-test comparing the RNAs in vivo with the in vitro-added negative control. Each data point was overlaid as dot plots. c, Histology of testis sections with (right) and without (left) puromycin treatment harvested at different time points. Experiments have been repeated for two times independently with similar results. Puromycin did not disrupt seminiferous tubule structures or lead to visible morphological changes up to 8 hours after intra-testicular injection. Scale bar, 50 μm. d, Scatterplot of mRNA abundance between untreated and puromycin treated adult mouse testis. Each data point represents an mRNA. Sample size n = 8,623 mRNAs. Tpm, transcripts per million. Pearson’s correlation and the corresponding p-value based on two-sided Pearson’s correlation test is listed. Statistical Source Data are provided in Source Data Extended Data Figure 9.
Extended Data Fig. 10. Ribosome-mediated piRNA biogenesis is conserved.
a, Length histograms of RPFs from piRNA producing loci (upper) and of piRNAs (bottom) in the testis of roosters (left) and green lizards (right). Ppm, parts per million. b, Fragment length analysis plot of total RPF reads per transcript and FLOSS relative to the nuclear coding sequence average from testes of roosters (upper) and green lizards (bottom). For different raw read counts, to detect extremely large FLOSS values, outlier cutoffs were calculated using Tukey’s fences method and smoothed using LOESS regression. piRNAs were downsampled to match the read number of RPFs from piRNA precursors before calculating FLOSS. c, Sequence logos depicting the nucleotide bias at 5´-ends and 1 nt upstream of the 5´-ends of total RPF species (top) and RPF species with a 5´-upstream A (bottom) from roosters and green lizards. d, Boxplots of the fraction of RPF with a 5´-upstream A in total RPFs per transcript in roosters (upper) and green lizards (lower). Sample size n = 9,461 rooster mRNAs; sample size n = 95 rooster piRNA clusters. Sample size n = 14,680 lizard mRNAs; sample size n = 94 lizard piRNA clusters. e, Boxplots of distance spectra of 5´-ends of anti-HA immunoprecipitated RPFs from adult testis that overlap simulated sequences. The 5´-end overlap analyses between RPFs and simulated sequences were computed 10,000 times for roosters (upper) and green lizards (lower) (sample size n =10,000 5´-end overlap analyses). Statistical Source Data are provided in Source Data Extended Data Figure 10.
Supplementary Material
Supplementary Table 1: PCR Primers
Supplementary Table 2: Pachytene piRNA precursors
Supplementary Table 3: Ribo-seq data statistics
Supplementary Table 4: Small RNA-seq data statistics
Supplementary Table 5: RNA-seq data statistics
Supplementary Table 6: Degradome-seq data statistics
Acknowledgments
We thank: P. Zamore, M. Moore, E. Sheppard, K. Kleene and B. Wright, Q. Chen, P. Mu, M. Frohman, P. S. Brookes, G. Xiao, C. Beckham, and Cornell stem cell and transgenic core facility for help with the experiments; L. Maquat, E. Phizicky, D. Ermolenko, A. Korostelev, A. Jacobson, J. Lin, C. Roy, P. Yao, D. Mathews, D. Anderson, and J. R. Lozada for discussions; N. Chen for clipart used for rooster; UR pathology core; UR Genomics Research Center; B. Zhang; Z. Guo; G, Zhang; W, Fang; and members of the Li laboratory. This work was supported in part by National Institutes of Health grants K99/R00HD078482, R35GM128782, and Agriculture and Food Research Initiative Competitive Grant no. 2018-67015-27615 from the USDA National Institute of Food and Agriculture to X.Z.L. C.C. Is supported by a National Institutes of Health grant R01HD084494.
Footnotes
Code availability
All computational codes used in this study can be obtained from the author on reasonable request. Ribo-seq pipeline was developed for this study, which is available in the following link (https://github.com/LiLabZhaohua/RiboSeqPipeline). 5´-end overlap analysis was performed using our own script, which is available in the following link (https://gist.github.com/nimezhu/d8734d2ae6c1619218f1).
The authors declare no competing financial interests.
Data availability
Deep-sequencing (RNA–seq, small RNA-seq, Ribo-seq and degradome sequencing) data that support the findings of this study have been deposited in the Gene Expression Omnibus (GEO) under accession codes GSE65786.
All other data supporting the findings of this study are available from the corresponding author on reasonable request.
References
- 1.Aravin AA & Hannon GJ Small RNA silencing pathways in germ and stem cells. Cold Spring Harb Symp Quant Biol 73, 283–290 (2008). [DOI] [PubMed] [Google Scholar]
- 2.Farazi TA, Juranek SA & Tuschl T The growing catalog of small RNAs and their association with distinct Argonaute/Piwi family members. Development (2008). [DOI] [PubMed] [Google Scholar]
- 3.Kim VN, Han J & Siomi MC Biogenesis of small RNAs in animals. Nat Rev Mol Cell Biol 10, 126–139 (2009). [DOI] [PubMed] [Google Scholar]
- 4.Thomson T & Lin H The biogenesis and function of PIWI proteins and piRNAs: progress and prospect. Annu Rev Cell Dev Biol 25, 355–376 (2009). [DOI] [PMC free article] [PubMed] [Google Scholar]
- 5.Cenik ES & Zamore PD Argonaute proteins. Curr Biol 21, R446–9 (2011). [DOI] [PubMed] [Google Scholar]
- 6.Gainetdinov I, Colpan C, Arif A, Cecchini K & Zamore PD A Single Mechanism of Biogenesis, Initiated and Directed by PIWI Proteins, Explains piRNA Production in Most Animals. Mol Cell 71, 775–790.e5 (2018). [DOI] [PMC free article] [PubMed] [Google Scholar]
- 7.Han BW, Wang W, Li C, Weng Z & Zamore PD Noncoding RNA. piRNA-guided transposon cleavage initiates Zucchini-dependent, phased piRNA production. Science 348, 817–821 (2015). [DOI] [PMC free article] [PubMed] [Google Scholar]
- 8.Mohn F, Handler D & Brennecke J Noncoding RNA. piRNA-guided slicing specifies transcripts for Zucchini-dependent, phased piRNA biogenesis. Science 348, 812–817 (2015). [DOI] [PMC free article] [PubMed] [Google Scholar]
- 9.Homolka D, Pandey RR, Goriaux C, Brasset E, Vaury C, Sachidanandam R, Fauvarque MO & Pillai RS PIWI slicing and RNA elements in precursors instruct directional primary piRNA biogenesis. Cell Rep 12, 418–428 (2015). [DOI] [PubMed] [Google Scholar]
- 10.Ding D, Liu J, Dong K, Midic U, Hess RA, Xie H, Demireva EY & Chen C PNLDC1 is essential for piRNA 3’ end trimming and transposon silencing during spermatogenesis in mice. Nat Commun 8, 819 (2017). [DOI] [PMC free article] [PubMed] [Google Scholar]
- 11.Ishizu H, Iwasaki YW, Hirakata S, Ozaki H, Iwasaki W, Siomi H & Siomi MC Somatic Primary piRNA Biogenesis Driven by cis-Acting RNA Elements and trans-Acting Yb. Cell Rep 12, 429–440 (2015). [DOI] [PubMed] [Google Scholar]
- 12.Nishimura T, Nagamori I, Nakatani T, Izumi N, Tomari Y, Kuramochi-Miyagawa S & Nakano T PNLDC1, mouse pre-piRNA Trimmer, is required for meiotic and post-meiotic male germ cell development. EMBO Rep 19, (2018). [DOI] [PMC free article] [PubMed] [Google Scholar]
- 13.Zhang Y, Guo R, Cui Y, Zhu Z, Zhang Y, Wu H, Zheng B, Yue Q, Bai S, Zeng W, Guo X, Zhou Z, Shen B, Zheng K, Liu M, Ye L & Sha J An essential role for PNLDC1 in piRNA 3’ end trimming and male fertility in mice. Cell Res 27, 1392–1396 (2017). [DOI] [PMC free article] [PubMed] [Google Scholar]
- 14.Saxe JP, Chen M, Zhao H & Lin H Tdrkh is essential for spermatogenesis and participates in primary piRNA biogenesis in the germline. EMBO J 32, 1869–1885 (2013). [DOI] [PMC free article] [PubMed] [Google Scholar]
- 15.Andersen PR, Tirian L, Vunjak M & Brennecke J A heterochromatin-dependent transcription machinery drives piRNA expression. Nature 549, 54–59 (2017). [DOI] [PMC free article] [PubMed] [Google Scholar]
- 16.Li XZ, Roy CK, Dong X, Bolcun-Filas E, Wang J, Han BW, Xu J, Moore MJ, Schimenti JC, Weng Z & Zamore PD An ancient transcription factor initiates the burst of piRNA production during early meiosis in mouse testes. Mol Cell 50, 67–81 (2013). [DOI] [PMC free article] [PubMed] [Google Scholar]
- 17.Sanz E, Yang L, Su T, Morris DR, McKnight GS & Amieux PS Cell-type-specific isolation of ribosome-associated mRNA from complex tissues. Proc Natl Acad Sci U S A 106, 13939–13944 (2009). [DOI] [PMC free article] [PubMed] [Google Scholar]
- 18.Fresno M, Jiménez A & Vázquez D Inhibition of translation in eukaryotic systems by harringtonine. Eur J Biochem 72, 323–330 (1977). [DOI] [PubMed] [Google Scholar]
- 19.Ingolia NT, Lareau LF & Weissman JS Ribosome profiling of mouse embryonic stem cells reveals the complexity and dynamics of mammalian proteomes. Cell 147, 789–802 (2011). [DOI] [PMC free article] [PubMed] [Google Scholar]
- 20.Vourekas A, Zheng K, Fu Q, Maragkakis M, Alexiou P, Ma J, Pillai RS, Mourelatos Z & Wang PJ The RNA helicase MOV10L1 binds piRNA precursors to initiate piRNA processing. Genes Dev 29, 617–629 (2015). [DOI] [PMC free article] [PubMed] [Google Scholar]
- 21.Zheng K, Xiol J, Reuter M, Eckardt S, Leu NA, McLaughlin KJ, Stark A, Sachidanandam R, Pillai RS & Wang PJ Mouse MOV10L1 associates with Piwi proteins and is an essential component of the Piwi-interacting RNA (piRNA) pathway. Proc Natl Acad Sci U S A 107, 11841–11846 (2010). [DOI] [PMC free article] [PubMed] [Google Scholar]
- 22.Zheng K & Wang PJ Blockade of pachytene piRNA biogenesis reveals a novel requirement for maintaining post-meiotic germline genome integrity. PLoS Genet 8, e1003038 (2012). [DOI] [PMC free article] [PubMed] [Google Scholar]
- 23.Ingolia NT, Brar GA, Stern-Ginossar N, Harris MS, Talhouarne GJ, Jackson SE, Wills MR & Weissman JS Ribosome profiling reveals pervasive translation outside of annotated protein-coding genes. Cell Rep 8, 1365–1379 (2014). [DOI] [PMC free article] [PubMed] [Google Scholar]
- 24.Guttman M, Russell P, Ingolia NT, Weissman JS & Lander ES Ribosome profiling provides evidence that large noncoding RNAs do not encode proteins. Cell 154, 240–251 (2013). [DOI] [PMC free article] [PubMed] [Google Scholar]
- 25.Pöyry TA, Kaminski A & Jackson RJ What determines whether mammalian ribosomes resume scanning after translation of a short upstream open reading frame. Genes Dev 18, 62–75 (2004). [DOI] [PMC free article] [PubMed] [Google Scholar]
- 26.Somers J, Pöyry T & Willis AE A perspective on mammalian upstream open reading frame function. Int J Biochem Cell Biol 45, 1690–1700 (2013). [DOI] [PMC free article] [PubMed] [Google Scholar]
- 27.Singh P, Schimenti JC & Bolcun-Filas E A mouse geneticist’s practical guide to CRISPR applications. Genetics 199, 1–15 (2015). [DOI] [PMC free article] [PubMed] [Google Scholar]
- 28.Zhang F, Wang J, Xu J, Zhang Z, Koppetsch BS, Schultz N, Vreven T, Meignin C, Davis I, Zamore PD, Weng Z & Theurkauf WE UAP56 couples piRNA clusters to the perinuclear transposon silencing machinery. Cell 151, 871–884 (2012). [DOI] [PMC free article] [PubMed] [Google Scholar]
- 29.Dunn JG, Foo CK, Belletier NG, Gavis ER & Weissman JS Ribosome profiling reveals pervasive and regulated stop codon readthrough in Drosophila melanogaster. Elife 2, e01179 (2013). [DOI] [PMC free article] [PubMed] [Google Scholar]
- 30.Loughran G, Chou MY, Ivanov IP, Jungreis I, Kellis M, Kiran AM, Baranov PV & Atkins JF Evidence of efficient stop codon readthrough in four mammalian genes. Nucleic Acids Res 42, 8928–8938 (2014). [DOI] [PMC free article] [PubMed] [Google Scholar]
- 31.Ingolia NT Ribosome Footprint Profiling of Translation throughout the Genome. Cell 165, 22–33 (2016). [DOI] [PMC free article] [PubMed] [Google Scholar]
- 32.Ding D, Liu J, Midic U, Wu Y, Dong K, Melnick A, Latham KE & Chen C TDRD5 binds piRNA precursors and selectively enhances pachytene piRNA processing in mice. Nat Commun 9, 127 (2018). [DOI] [PMC free article] [PubMed] [Google Scholar]
- 33.Guydosh NR & Green R Dom34 rescues ribosomes in 3’ untranslated regions. Cell 156, 950–962 (2014). [DOI] [PMC free article] [PubMed] [Google Scholar]
- 34.Mills EW, Wangen J, Green R & Ingolia NT Dynamic regulation of a ribosome rescue pathway in erythroid cells and platelets. Cell Rep 17, 1–10 (2016). [DOI] [PMC free article] [PubMed] [Google Scholar]
- 35.Blobel G & Sabatini D Dissociation of mammalian polyribosomes into subunits by puromycin. Proc Natl Acad Sci U S A 68, 390–394 (1971). [DOI] [PMC free article] [PubMed] [Google Scholar]
- 36.Kim S ppcor: An R package for a fast calculation to semi-partial correlation coefficients. Communications for statistical applications and methods 22, 665 (2015). [DOI] [PMC free article] [PubMed] [Google Scholar]
- 37.Volkin E & Cohn WE On the structure of ribonucleic acids. II. The products of ribonuclease action. J Biol Chem 205, 767–782 (1953). [PubMed] [Google Scholar]
- 38.Sato K & Egami F The specificity of T1 ribonuclease. C R Seances Soc Biol Fil 151, 1792–1796 (1957). [PubMed] [Google Scholar]
- 39.Zhang B, Mao YS, Diermeier SD, Novikova IV, Nawrocki EP, Jones TA, Lazar Z, Tung CS, Luo W, Eddy SR, Sanbonmatsu KY & Spector DL Identification and Characterization of a Class of MALAT1-like Genomic Loci. Cell Rep 19, 1723–1738 (2017). [DOI] [PMC free article] [PubMed] [Google Scholar]
- 40.Sun YH, Xie LH, Zhuo X, Chen Q, Ghoneim D, Zhang B, Jagne J, Yang C & Li XZ Domestic chickens activate a piRNA defense against avian leukosis virus. Elife 6, (2017). [DOI] [PMC free article] [PubMed] [Google Scholar]
- 41.Grivna ST, Pyhtila B & Lin H MIWI associates with translational machinery and PIWI-interacting RNAs (piRNAs) in regulating spermatogenesis. Proc Natl Acad Sci U S A 103, 13415–13420 (2006). [DOI] [PMC free article] [PubMed] [Google Scholar]
- 42.Castaneda J, Genzor P, van der Heijden GW, Sarkeshik A, Yates JR, Ingolia NT & Bortvin A Reduced pachytene piRNAs and translation underlie spermiogenic arrest in Maelstrom mutant mice. EMBO J 33, 1999–2019 (2014). [DOI] [PMC free article] [PubMed] [Google Scholar]
- 43.Michel AM, Choudhury KR, Firth AE, Ingolia NT, Atkins JF & Baranov PV Observation of dually decoded regions of the human genome using ribosome profiling data. Genome Res 22, 2219–2229 (2012). [DOI] [PMC free article] [PubMed] [Google Scholar]
- 44.Young DJ, Guydosh NR, Zhang F, Hinnebusch AG & Green R Rli1/ABCE1 Recycles Terminating Ribosomes and Controls Translation Reinitiation in 3’UTRs In Vivo. Cell 162, 872–884 (2015). [DOI] [PMC free article] [PubMed] [Google Scholar]
- 45.Takyar S, Hickerson RP & Noller HF mRNA helicase activity of the ribosome. Cell 120, 49–58 (2005). [DOI] [PubMed] [Google Scholar]
- 46.Qu X, Wen JD, Lancaster L, Noller HF, Bustamante C & Tinoco I The ribosome uses two active mechanisms to unwind messenger RNA during translation. Nature 475, 118–121 (2011). [DOI] [PMC free article] [PubMed] [Google Scholar]
- 47.Pandey RR, Homolka D, Chen KM, Sachidanandam R, Fauvarque MO & Pillai RS Recruitment of Armitage and Yb to a transcript triggers its phased processing into primary piRNAs in Drosophila ovaries. PLoS Genet 13, e1006956 (2017). [DOI] [PMC free article] [PubMed] [Google Scholar]
- 48.Rogers AK, Situ K, Perkins EM & Toth KF Zucchini-dependent piRNA processing is triggered by recruitment to the cytoplasmic processing machinery. Genes Dev 31, 1858–1869 (2017). [DOI] [PMC free article] [PubMed] [Google Scholar]
- 49.Colombini M A candidate for the permeability pathway of the outer mitochondrial membrane. Nature 279, 643–645 (1979). [DOI] [PubMed] [Google Scholar]
- 50.Schonhoff SE, Giel-Moloney M & Leiter AB Neurogenin 3-expressing progenitor cells in the gastrointestinal tract differentiate into both endocrine and non-endocrine cell types. Dev Biol 270, 443–454 (2004). [DOI] [PubMed] [Google Scholar]
- 51.Gallardo T, Shirley L, John GB & Castrillon DH Generation of a germ cell-specific mouse transgenic Cre line, Vasa-Cre. Genesis 45, 413–417 (2007). [DOI] [PMC free article] [PubMed] [Google Scholar]
- 52.Wessel D & Flügge UI A method for the quantitative recovery of protein in dilute solution in the presence of detergents and lipids. Anal Biochem 138, 141–143 (1984). [DOI] [PubMed] [Google Scholar]
- 53.Morlan JD, Qu K & Sinicropi DV Selective depletion of rRNA enables whole transcriptome profiling of archival fixed tissue. PLoS One 7, e42882 (2012). [DOI] [PMC free article] [PubMed] [Google Scholar]
- 54.Moran Y, Fredman D, Praher D, Li XZ, Wee LM, Rentzsch F, Zamore PD, Technau U & Seitz H Cnidarian microRNAs frequently regulate targets by cleavage. Genome Res 24, 651–663 (2014). [DOI] [PMC free article] [PubMed] [Google Scholar]
- 55.Adiconis X, Borges-Rivera D, Satija R, DeLuca DS, Busby MA, Berlin AM, Sivachenko A, Thompson DA, Wysoker A, Fennell T, Gnirke A, Pochet N, Regev A & Levin JZ Comparative analysis of RNA sequencing methods for degraded or low-input samples. Nat Methods 10, 623–629 (2013). [DOI] [PMC free article] [PubMed] [Google Scholar]
- 56.Kim Y, Fedoriw AM & Magnuson T An essential role for a mammalian SWI/SNF chromatin-remodeling complex during male meiosis. Development 139, 1133–1140 (2012). [DOI] [PMC free article] [PubMed] [Google Scholar]
- 57.Page J, Suja JA, Santos JL & Rufas JS Squash procedure for protein immunolocalization in meiotic cells. Chromosome Res 6, 639–642 (1998). [DOI] [PubMed] [Google Scholar]
- 58.Peirson SN, Butler JN & Foster RG Experimental validation of novel and conventional approaches to quantitative real-time PCR data analysis. Nucleic Acids Res 31, e73 (2003). [DOI] [PMC free article] [PubMed] [Google Scholar]
- 59.Pall GS & Hamilton AJ Improved northern blot method for enhanced detection of small RNA. Nat Protoc 3, 1077–1084 (2008). [DOI] [PubMed] [Google Scholar]
- 60.Han BW, Wang W, Zamore PD & Weng Z piPipes: a set of pipelines for piRNA and transposon analysis via small RNA-seq, RNA-seq, degradome- and CAGE-seq, ChIP-seq and genomic DNA sequencing. Bioinformatics 31, 593–595 (2015). [DOI] [PMC free article] [PubMed] [Google Scholar]
- 61.Hinrichs AS, Karolchik D, Baertsch R, Barber GP, Bejerano G, Clawson H, Diekhans M, Furey TS, Harte RA, Hsu F, Hillman-Jackson J, Kuhn RM, Pedersen JS, Pohl A, Raney BJ, Rosenbloom KR, Siepel A, Smith KE, Sugnet CW, Sultan-Qurraie A, Thomas DJ, Trumbower H, Weber RJ, Weirauch M, Zweig AS, Haussler D & Kent WJ The UCSC Genome Browser Database: update 2006. Nucleic Acids Res 34, D590–8 (2006). [DOI] [PMC free article] [PubMed] [Google Scholar]
- 62.Sanz E, Evanoff R, Quintana A, Evans E, Miller JA, Ko C, Amieux PS, Griswold MD & McKnight GS RiboTag analysis of actively translated mRNAs in Sertoli and Leydig cells in vivo. PLoS One 8, e66179 (2013). [DOI] [PMC free article] [PubMed] [Google Scholar]
- 63.Patro R, Duggal G, Love MI, Irizarry RA & Kingsford C Salmon provides fast and bias-aware quantification of transcript expression. Nat Methods 14, 417–419 (2017). [DOI] [PMC free article] [PubMed] [Google Scholar]
- 64.Fritsch C, Herrmann A, Nothnagel M, Szafranski K, Huse K, Schumann F, Schreiber S, Platzer M, Krawczak M, Hampe J & Brosch M Genome-wide search for novel human uORFs and N-terminal protein extensions using ribosomal footprinting. Genome Res 22, 2208–2218 (2012). [DOI] [PMC free article] [PubMed] [Google Scholar]
- 65.Trapnell C, Pachter L & Salzberg SL TopHat: discovering splice junctions with RNA-Seq. Bioinformatics 25, 1105–1111 (2009). [DOI] [PMC free article] [PubMed] [Google Scholar]
- 66.Pelechano V, Wei W & Steinmetz LM Widespread co-translational RNA decay reveals ribosome dynamics. Cell 161, 1400–1412 (2015). [DOI] [PMC free article] [PubMed] [Google Scholar]
- 67.Wichert S, Fokianos K & Strimmer K Identifying periodically expressed transcripts in microarray time series data. Bioinformatics 20, 5–20 (2004). [DOI] [PubMed] [Google Scholar]
- 68.Stern-Ginossar N, Weisburd B, Michalski A, Le VT, Hein MY, Huang SX, Ma M, Shen B, Qian SB, Hengel H, Mann M, Ingolia NT & Weissman JS Decoding human cytomegalovirus. Science 338, 1088–1093 (2012). [DOI] [PMC free article] [PubMed] [Google Scholar]
- 69.Team, R. C. R: A language and environment for statistical computing. R Foundation for Statistical Computing, Vienna, Austria. 2013. (2014). [Google Scholar]
- 70.Cora E, Pandey RR, Xiol J, Taylor J, Sachidanandam R, McCarthy AA and Pillai RS, 2014. The MID-PIWI module of Piwi proteins specifies nucleotide-and strand-biases of piRNAs. Rna, 20(6), pp.773–781. [DOI] [PMC free article] [PubMed] [Google Scholar]
- 71.Boland A, Huntzinger E, Schmidt S, Izaurralde E and Weichenrieder O, 2011. Crystal structure of the MID-PIWI lobe of a eukaryotic Argonaute protein. Proceedings of the National Academy of Sciences, 108(26), pp.10466–10471. [DOI] [PMC free article] [PubMed] [Google Scholar]
- 72.Margulies EH, Blanchette M, Haussler D, Green ED and NISC Comparative Sequencing Program, 2003. Identification and characterization of multi-species conserved sequences. Genome research, 13(12), pp.2507–2518. [DOI] [PMC free article] [PubMed] [Google Scholar]
- 73.Liu B and Qian SB, 2016. Characterizing inactive ribosomes in translational profiling. Translation, 4(1), p.e1138018. [DOI] [PMC free article] [PubMed] [Google Scholar]
Associated Data
This section collects any data citations, data availability statements, or supplementary materials included in this article.
Supplementary Materials
Supplementary Table 1: PCR Primers
Supplementary Table 2: Pachytene piRNA precursors
Supplementary Table 3: Ribo-seq data statistics
Supplementary Table 4: Small RNA-seq data statistics
Supplementary Table 5: RNA-seq data statistics
Supplementary Table 6: Degradome-seq data statistics
Data Availability Statement
Deep-sequencing (RNA–seq, small RNA-seq, Ribo-seq and degradome sequencing) data that support the findings of this study have been deposited in the Gene Expression Omnibus (GEO) under accession codes GSE65786.
All other data supporting the findings of this study are available from the corresponding author on reasonable request.


