

Abstract
Background
Although confirmed disability progression (CDP) is a common outcome in multiple sclerosis (MS) clinical trials, its predictive value for long-term outcomes is uncertain.
Objective
To investigate whether CDP at month 24 predicts subsequent disability accumulation in MS.
Methods
The Comprehensive Longitudinal Investigation of Multiple Sclerosis at Brigham and Women’s Hospital includes participants with relapsing-remitting MS or clinically isolated syndrome with Expanded Disability Status Scale (EDSS) scores ≤5 (N = 1214). CDP was assessed as a predictor of time to EDSS score 6 (EDSS 6) and to secondary progressive MS (SPMS) using a Cox proportional hazards model; adjusted models included additional clinical/participant characteristics. Models were compared using Akaike’s An Information Criterion.
Results
CDP was directionally associated with faster time to EDSS 6 in univariate analysis (HR = 1.61 [95% CI: 0.83, 3.13]). After adjusting for month 24 EDSS, CDP was directionally associated with slower time to EDSS 6 (adjusted HR = 0.65 [0.32, 1.28]). Models including CDP had worse fit statistics than those using EDSS scores without CDP. When models included clinical and magnetic resonance imaging measures, T2 lesion volume improved fit statistics. Results were similar for time to SPMS.
Conclusions
CDP was less predictive of time to subsequent events than other MS clinical features.
Keywords: Disability progression, long-term follow-up, multiple sclerosis, outcome measures
Introduction
Disability accumulation in patients with multiple sclerosis (MS) is most commonly measured using the Expanded Disability Status Scale (EDSS). The EDSS is a 0‒10 ordinal scale with half steps that combines 7 functional system scores.1 Given the ordinal nature of the EDSS, simple analysis of change scores can be challenging because a change in 1 unit reflects a different amount of disability accumulation depending on initial level of the scale, and the time between EDSS transitions varies based on initial EDSS level.2 In addition to the unequal steps of the scale, disability accumulation can occur for multiple reasons in MS. Disability accumulation can be due to relapses,3 but disability that continues to increase for a specified period of time may indicate MS progression. Progression is difficult to assess using cross-sectional EDSS measurements because it is challenging to distinguish between the two underlying causes of disability accumulation from a single measurement. Moreover, analysis of the placebo arms of 31 randomized controlled trials showed that the rate of EDSS improvement can be significant, sometimes equivalent to the rate of EDSS worsening, in both relapsing-remitting and secondary progressive MS (SPMS) populations.4 At the same time, EDSS has been shown to overestimate the accumulation of permanent disability by up to 30%, highlighting its instability and inaccuracy.5
To overcome this challenge, most clinical trials investigating a treatment effect on disability accumulation have used confirmed disability progression (CDP) on EDSS as the outcome of interest.6 CDP requires that a participant in a clinical trial experience a specified increase on the EDSS that is maintained for at least 3 or 6 months depending on the study design. The specified increase on the EDSS is an increase of at least 1.5 points for baseline EDSS of 0, an increase on the EDSS of at least 1 point for baseline EDSS between 1 and 5, or an increase of at least 0.5 point for a baseline EDSS at least 5.5. For clinical trials of relapsing MS (RMS), CDP is often a secondary outcome with annualized relapse rate as the primary outcome; however, CDP is usually the primary outcome for clinical trials within a population with progressive MS.
Even though CDP is the most common measure of disability accumulation in MS clinical trials, the value of CDP in terms of predicting long-term disability accumulation is not yet well understood. The goal of this analysis was to classify participants based on the presence or absence of disability accumulation over a 2-year period and assess the predictive information in this outcome relative to other clinical, radiological, and patient-reported outcome (PRO) measures.
Methods
Participants
All participants enrolled in the Comprehensive Longitudinal Investigation of Multiple Sclerosis at Brigham and Women’s Hospital and the Partners MS Center (CLIMB) were eligible for this analysis.7 CLIMB participants have clinical visits with a complete neurological exam and EDSS ratings every 6 months and brain magnetic resonance imaging (MRI) scans every year. In addition, a subgroup of participants completes PRO instruments every year. The study began following participants in 2000 and has been approved by the Brigham and Women’s Hospital Institutional Review Board with all participants providing written informed consent.
For this analysis, we identified participants enrolled in CLIMB from 29 February 2000 through 24 March 2016 who met the following inclusion criteria: (1) 2 clinical visits 24 months apart, with the second visit occurring between 640 and 820 days after the first visit; (2) at least 1 additional visit between the 2 visits identified in criterion 1 that occurred at least 150 days prior to the second visit; (3) at least 1 visit after the 24-month visit; (4) diagnosis of relapsing-remitting, clinically isolated syndrome (CIS), clinically silent MS, or suspected MS at first clinic visit contributing to this analysis; (5) EDSS ≤5 at first clinic visit; and (6) MRI measurement at first clinic visit. A CONSORT diagram showing the sample selection is provided in Supplementary Figure 1.
Predictors
The predictors assessed in our analyses were clinical, radiological, and PRO variables. Because different subsets of participants had radiological and PRO data available, the sample size contributing to specific analyses varied. Participants that had disability accumulation at the 2 visits following the initial visit were included in the CDP group at the month 24 (CDP24) analysis. If there was an additional CLIMB visit between these two visits, the disability accumulation was required to remain at all time points to be classified as confirmed disability accumulation. Disability accumulation was assessed using the common definition of an increase on the EDSS of at least 1 point for baseline EDSS between 1 and 5 or an increase of at least 1.5 points for baseline EDSS of 0. Participants who did not meet these criteria were classified as not having CDP at month 24 (noCDP24).
For this study, we used MRIs collected on a 1.5 T scanner, which was used at our center until 2014. The scans are collected and processed using the template-driven segmentation (TDS+) pipeline to obtain measures of lesion burden (T2 lesion volume [T2LV]) and brain atrophy (brain parenchymal fraction [BPF]).8 For this project, the MRI measurements from the pipeline were used without further manual correction.
Finally, a subset of CLIMB participants completed PROs on a yearly basis, including a measure of fatigue and a brief cognitive screening test. The measure of fatigue was the modified fatigue impact scale (MFIS), which is a commonly used measure in MS that includes 21 questions to measure the physical, mental, and psychological components of fatigue.9 The brief cognitive screening test was the symbol digit modalities test (SDMT), which is a 90-second speed of information processing test. The SDMT has been shown to have good reliability and validity, and it is sensitive to MS-related cognitive dysfunction.10,11
Outcomes
To assess the predictive value of CDP, we analyzed 3 outcome measures. First, we analyzed the time to the first visit with an EDSS of 6 or greater. Participants who reached an EDSS of 6 prior to the month 24 visit (n = 32) could not contribute to this analysis; thus, 1182 participants were included. Second, we analyzed the time to the first visit with a physician-classified SPMS diagnosis. Of the eligible participants, 35 reached SPMS prior to the month 24 visit; thus, 1179 participants contributed to this analysis. Third, we analyzed the time to the next EDSS progression after the month 24 measurement.
Statistical analysis
The summary statistics for the CDP24 and noCDP24 groups at both baseline and month 24 were calculated showing mean and standard deviation for continuous or ordinal variables and proportions for dichotomous variables. For the analyses of the time to events, a set of Cox proportional hazards models were fit with 3 groups of predictors. First, we fit a set of models with only clinical predictors (CDP24, EDSS at month 0, and EDSS at month 24). Second, we fit a set of models with the clinical predictors from model 1 and 2 radiological predictors (T2LV at month 24 and BPF at month 24). Third, we fit a set of models with the clinical predictors from model 1, MFIS at month 24, and SDMT at month 24. For each of the 3 sets of models, we estimated the hazard ratio for each of the predictors with the associated 95% confidence intervals (CIs). Further, we calculate Akaike’s An Information Criteria (AIC) and concordance (which measures the model’s ability to distinguish between low- and high-risk participants, quantified by the C statistics, with C = 50% and C = 100% being random and perfect prediction, respectively) to compare the models based on the same participant subsets to determine the best combination of clinical disability measures for modeling time to further disability accumulation.
Results
Characteristics of participants
Of the 1214 eligible participants, 120 experienced CDP24 and 1094 did not meet the criteria (Table 1). At the baseline visit, those who had disease progression had slightly higher age, but otherwise the groups were similar. In fact, the participants who had subsequent disease progression had slightly lower EDSS at the baseline visit. At month 24, those with disease progression were higher in age and had greater EDSS scores compared with those who did not have disease progression. The participants who progressed also had larger lesion volume and higher MFIS.
Table 1.
Demographic and disease characteristics of participants at first visit.
| Month 0 in CDP24 participants n = 120 |
Month 0 in noCDP24 participants n = 1094 |
Month 24 in CDP24 participants n = 120 |
Month 24 in noCDP24 participants n = 1094 |
|
|---|---|---|---|---|
| Age, years | 43.11 (11.76); n = 120 | 41.78 (10.61); n = 1094 | 45.14 (11.77); n = 120 | 43.79 (10.62); n = 1094 |
| Disease duration | 9.23 (8.66); n = 120 | 8.92 (8.53); n = 1094 | 11.26 (8.67); n = 120 | 10.93 (8.54); n = 1094 |
| EDSS | 1.16 (1.25); n = 120 | 1.40 (1.09); n = 1094 | 3.07 (1.51); n = 120 | 1.32 (1.17); n = 1094 |
| 1.5T BPF TDS+ | 0.86 (0.05); n = 68 | 0.87 (0.05); n = 625 | 0.86 (0.04); n = 33 | 0.86 (0.06); n = 430 |
| 1.5T T2LV TDS+ | 5.18 (5.23); n = 68 | 4.38 (3.57); n = 625 | 5.34 (7.45); n = 33 | 3.99 (3.5); n = 430 |
| MFIS | 29.56 (19.47); n = 18 | 25.52 (16.89); n = 233 | 29.3 (18.27); n = 30 | 24.45 (16.55); n = 309 |
| SDMT | 55.67 (10.22); n = 18 | 55.66 (10.51); n = 198 | 54.9 (14.49); n = 30 | 56.57 (11.44); n = 311 |
For each variable, mean, standard deviation (in parenthesis), and sample size are shown.
BPF: brain parenchymal fraction; CDP24: confirmed disease progression at 24 months; EDSS: Expanded Disability Status Scale; MFIS: modified fatigue impact scale; noCDP24: no confirmed disease progression at 24 months; SDMT: symbol digit modalities test; T2LV: T2 lesion volume; TDS: template-driven segmentation.
Time to EDSS 6
The CDP24 group had a faster time to EDSS 6 than the noCDP24 group, as shown in Figure 1. Although CDP24 was directionally associated with a faster time to EDSS 6 in the univariate analysis (hazard ratio [HR]=1.61), CDP24 was associated with a slower time to EDSS 6 after adjusting for month 24 EDSS (HR = 0.65; Table 2). Further, the fit statistics demonstrated that a model including the EDSS scores at months 0 and 24 led to a better fit compared with the models using CDP24, demonstrating a loss of information from using CDP24 as compared with using the EDSS. Further, the Kaplan-Meier curves showing the time to EDSS 6 among participants classified into quartiles based on the predicted Cox proportional hazards regression score showed greater separation compared with the CDP24 vs. noCDP24 curves (Supplemental Figure 2). Similar results were observed when radiological predictors (month 24 BPF and T2LV) or fatigue/cognitive predictors (standardized month 24 MFIS or standardized month 24 SDMT) were included. The HR associated with CDP24 is systematically reduced when month 24 EDSS is also included in the models. EDSS scores at months 0 and 24 were consistently associated with faster time to EDSS 6. Month 24 T2LV and MFIS were associated with faster time to EDSS 6 in all models, while SDMT was associated with longer time to EDSS 6.
Figure 1.
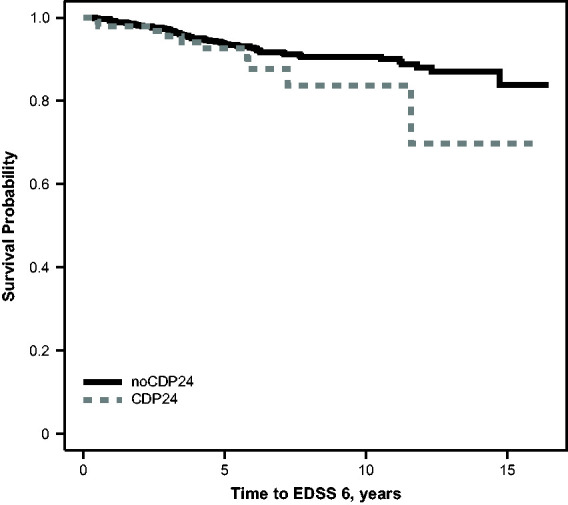
Kaplan–Meier curve comparing time to EDSS 6 in participants with and without confirmed disability progression by month 24. CDP24: confirmed disability progression at month 24; EDSS 6: Expanded Disability Status Scale score of 6.
Table 2.
Association between clinical, MRI, and PRO predictors and time to EDSS 6.
| Models with clinical predictors (n = 1182) | Models with radiological predictors (n = 456) | Models with fatigue and cognitive functioning predictors (n = 324) | |
|---|---|---|---|
| Model set 1 | |||
| CDP24 | 1.61 (0.83, 3.13); P = 0.16 |
1.48 (0.52, 4.20); P = 0.46 |
2.53 (0.87, 7.41); P = 0.089 |
| Month 24 BPF | 0.98 (0.96, 1.00); P = 0.10 |
||
| Month 24 T2LV | 1.08 (1.04, 1.13); P = 0.0002 |
||
| Standardized month 24 MFIS | 1.83 (1.28, 2.61); P = 0.0009 |
||
| Standardized month 24 SDMT | 0.59 (0.42, 0.84); P = 0.003 |
||
| AIC | 1077.9 | 479.7 | 301.5 |
| Concordance | 0.52 | 0.66 | 0.76 |
| Model set 2 | |||
| CDP24 | 0.65 (0.32, 1.28); P = 0.21 |
0.84 (0.32, 2.20); P = 0.73 |
1.07 (0.33, 3.43); P = 0.91 |
| Month 24 EDSS | 2.49 (2.07, 3.00); P < 0.001 |
2.60 (1.95, 3.46); P < 0.001 |
1.84 (1.31, 2.60); P = 0.0005 |
| Month 24 BPF | 0.97 (0.94, 1.01); P = 0.11 |
||
| Month 24 T2LV | 1.07 (1.02, 1.12); P = 0.007 |
||
| Standardized month 24 MFIS | 1.42 (0.96, 2.10); P = 0.081 |
||
| Standardized month 24 SDMT | 0.71 (0.48, 1.06); P = 0.091 |
||
| AIC | 991.9 | 437.9 | 292.5 |
| Concordance | 0.77 | 0.79 | 0.81 |
| Model set 3 | |||
| Month 24 EDSS | 1.91 (1.52, 2.4); P < 0.001 |
1.86 (1.28, 2.69); P = 0.001 |
1.55 (1.07, 2.25); P = 0.020 |
| Month 0 EDSS | 1.59 (1.23, 2.07); P < 0.001 |
1.74 (1.18, 2.58); P = 0.006 |
1.53 (1.01, 2.31); P = 0.040 |
| Month 24 BPF | 0.98 (0.94, 1.01); P = 0.20 |
||
| Month 24 T2LV | 1.07 (1.01, 1.12); P = 0.006 |
||
| Standardized month 24 MFIS | 1.33 (0.89, 1.98); P = 0.16 |
||
| Standardized month 24 SDMT | 0.77 (0.51, 1.16); P = 0.21 |
||
| AIC | 980.8 | 430.4 | 288.6 |
| Concordance | 0.78 | 0.82 | 0.82 |
AIC: Akaike’s An Information Criterion; BPF: brain parenchymal fraction; CDP24: confirmed disease progression at 24 months; EDSS: Expanded Disability Status Scale; MFIS: modified fatigue impact scale; MRI: magnetic resonance imaging; PRO: patient-reported outcome; SDMT: symbol digit modalities test; T2LV: T2 lesion volume.
Results show HR, the 95% CI (in parenthesis), and P values corresponding to each variable and each model specification.
Time to SPMS
The estimated time to SPMS among the CDP24 group and the noCDP24 group is shown in Figure 2, and the regression analyses are presented in Table 3. CDP24 was associated with a much faster time to SPMS in the univariate analysis (HR = 3.40), but the association was attenuated conditional on the month 24 EDSS value (HR = 1.13). As with time to EDSS 6, the fit statistics demonstrated that a model including the months 0 and 24 EDSS scores led to a better fit compared with either model using CDP24, demonstrating again a loss of information from using CDP24. Months 0 and 24 EDSS were consistently associated with faster time to SPMS. Similar results were observed when radiological predictors (month 24 BPF and T2LV) or fatigue/cognitive predictors (month 24 MFIS or SDMT) were included. Similar to the models for time to EDSS 6, month 24 T2LV and MFIS were associated with a faster time to SPMS across all models, while SDMT was associated with longer time to SPMS.
Figure 2.
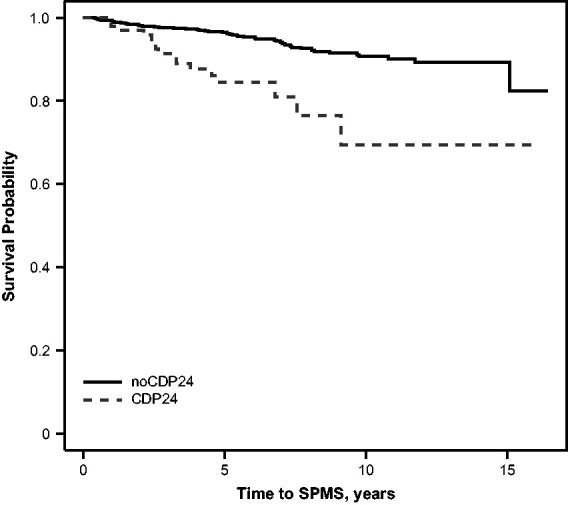
Kaplan–Meier curve comparing the time to physician-defined SPMS in participants with and without confirmed disability progression. CDP24: confirmed disability progression at month 24; SPMS: secondary progressive multiple sclerosis.
Table 3.
Association between clinical, MRI, and PRO predictors and time to SPMS.
| Models with clinical predictors (n = 1179) | Models with radiological predictors (n = 446) | Models with fatigue and cognitive functioning predictors (n = 320) | |
|---|---|---|---|
| Model set 1 | |||
| CDP24 | 3.40 (1.94, 5.95); P < 0.001 |
3.64 (1.50, 8.86); P = 0.004 |
3.95 (1.32, 11.9); P = 0.014 |
| Month 24 BPF | 0.97 (0.95, 0.99); P = 0.015 |
||
| Month 24 T2LV | 1.08 (1.03, 1.13); P = 0.001 |
||
| Standardized month 24 MFIS | 1.99 (1.27, 3.12); P = 0.003 |
||
| Standardized month 24 SDMT | 0.66 (0.43, 0.999); P = 0.0497 |
||
| AIC | 914.3 | 373.5 | 223.3 |
| Concordance | 0.58 | 0.73 | 0.79 |
| Model set 2 | |||
| CDP24 | 1.13 (0.58, 2.20); P = 0.71 |
1.36 (0.52, 3.51); P = 0.53 |
1.65 (0.45, 6.06); P = 0.45 |
| Month 24 EDSS | 1.92 (1.61, 2.29); P < 0.001 |
2.12 (1.61, 2.78); P < 0.001 |
1.69 (1.16, 2.46); P = 0.006 |
| Month 24 BPF | 0.96 (0.94, 0.99); P = 0.009 |
||
| Month 24 T2LV | 1.08 (1.02, 1.13); P = 0.005 |
||
| Standardized month 24 MFIS | 1.72 (1.05, 2.81); P = 0.032 |
||
| Standardized month 24 SDMT | 0.80 (0.50, 1.28); P = 0.34 |
||
| AIC | 868.4 | 349.2 | 218.8 |
| Concordance | 0.76 | 0.78 | 0.82 |
| Model set 3 | |||
| Month 24 EDSS | 1.74 (1.44, 2.10); P < 0.001 |
1.98 (1.47, 2.67); P < 0.001 |
1.62 (1.13, 2.34); P = 0.009 |
| Month 0 EDSS | 1.34 (1.03, 1.73); P = 0.029 |
1.33 (0.90, 1.95); P = 0.15 |
1.41 (0.91, 2.20); P = 0.12 |
| Month 24 BPF | 0.97 (0.94, 0.99); P = 0.016 |
||
| Month 24 T2LV | 1.07 (1.01, 1.13); P = 0.018 |
||
| Standardized month 24 MFIS | 1.63 (0.98, 2.71); P = 0.058 |
||
| Standardized month 24 SDMT | 0.92 (0.56, 1.50); P = 0.73 |
||
| AIC | 863.8 | 347.6 | 217.1 |
| Concordance | 0.76 | 0.79 | 0.83 |
AIC: Akaike’s An Information Criterion; BPF: brain parenchymal fraction; CDP24: confirmed disease progression at 24 months; EDSS: Expanded Disability Status Scale; MFIS: modified fatigue impact scale; MRI: magnetic resonance imaging; PRO: patient-reported outcome; SDMT: symbol digit modalities test; T2LV: T2 lesion volume.
Results show HR, the 95% CI (in parenthesis) and P-values corresponding to each variable and each model specification.
Time to subsequent disability accumulation
The estimated time to subsequent disability accumulation among the CDP24 group and the noCDP24 group is shown in Figure 3, and the regression analyses using a combination of CDP and EDSS values are presented in Table 4. Participants who experienced CDP24 had a longer time to subsequent disability accumulation in univariate analysis (HR = 0.51), but the association was attenuated after accounting for month 24 EDSS (HR = 0.73). Once again, the fit statistics demonstrated that a model including the months 0 and 24 EDSS scores led to a better fit compared with either model using CDP24. Months 0 and 24 EDSS were associated, respectively, with longer and faster time to subsequent disability accumulation. When radiologic predictors or fatigue/cognitive predictors were included, there was a systematic increase in the HR of CDP24 when adjusting for month 24 EDSS. T2LV was associated with time to subsequent disability accumulation across all of the models including the radiological predictors and MFIS was associated with faster time to subsequent disability accumulation.
Figure 3.
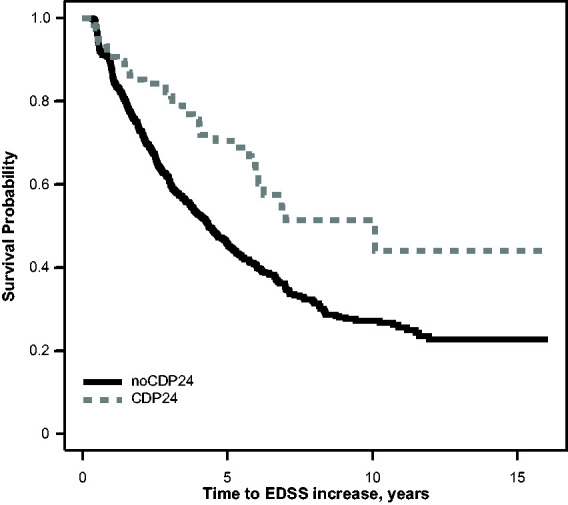
Kaplan–Meier curve comparing the time to EDSS increase after the month 24 visit in participants with and without confirmed disability progression. CDP24: confirmed disability progression at month 24; EDSS: Expanded Disability Status Scale.
Table 4.
Association between clinical, MRI, and PRO predictors and time to EDSS increase after the month 24 visit.
| Models with clinical predictors (n = 1214) | Models with radiological predictors (n = 463) | Models with fatigue and cognitive functioning predictors (n = 329) | |
|---|---|---|---|
| Model set 1 | |||
| CDP24 | 0.51 (0.37, 0.70); P < 0.001 |
0.43 (0.25, 0.76); P = 0.004 |
0.58 (0.33, 1.02); P = 0.058 |
| Month 24 BPF | 0.99 (0.98, 1.01); P = 0.35 |
||
| Month 24 T2LV | 1.05 (1.02, 1.08); P = 0.0002 |
||
| Standardized month 24 MFIS | 1.12 (0.97, 1.30); P = 0.13 |
||
| Standardized month 24 SDMT | 0.98 (0.84, 1.13); P = 0.77 |
||
| AIC | 7945.7 | 3043.8 | 2078.6 |
| Concordance | 0.53 | 0.59 | 0.55 |
| Model set 2 | |||
| CDP24 | 0.73 (0.52, 1.03); P = 0.071 |
0.61 (0.34, 1.12); P = 0.11 |
0.93 (0.50, 1.72); P = 0.81 |
| Month 24 EDSS | 0.79 (0.73, 0.85); P < 0.001 |
0.77 (0.68, 0.86); P < 0.001 |
0.75 (0.64, 0.88); P = 0.0003 |
| Month 24 BPF | 0.99 (0.98, 1.01); P = 0.30 |
||
| Month 24 T2LV | 1.06 (1.04, 1.09); P < 0.001 |
||
| Standardized month 24 MFIS | 1.23 (1.06, 1.44); P = 0.007 |
||
| Standardized month 24 SDMT | 0.90 (0.77, 1.05); P = 0.17 |
||
| AIC | 7904.9 | 3025.4 | 2067.1 |
| Concordance | 0.59 | 0.61 | 0.61 |
| Model set 3 | |||
| Month 24 EDSS | 0.66 (0.6, 0.72); P < 0.001 |
0.64 (0.56, 0.74); P < 0.001 |
0.70 (0.59, 0.82); P < 0.001 |
| Month 0 EDSS | 1.32 (1.2, 1.45); P < 0.001 |
1.30 (1.12, 1.52); P = 0.001 |
1.15 (0.96, 1.36); P = 0.12 |
| Month 24 BPF | 0.99 (0.98, 1.01); P = 0.41 |
||
| Month 24 T2LV | 1.06 (1.03, 1.08); P < 0.001 |
||
| Standardized month 24 MFIS | 1.21 (1.03, 1.41); P = 0.018 |
||
| Standardized month 24 SDMT | 0.91 (0.78, 1.06); P = 0.24 |
||
| AIC | 7875.74 | 3017.0 | 2064.8 |
| Concordance | 0.61 | 0.63 | 0.61 |
AIC: Akaike’s An Information Criterion; BPF: brain parenchymal fraction; CDP: confirmed disease progression; EDSS: Expanded Disability Status Scale; MFIS: modified fatigue impact scale; MRI: magnetic resonance imaging; PRO: patient-reported outcome; SDMT: symbol digit modalities test; T2LV: T2 lesion volume.
Results show HR, the 95% CI (in parenthesis) and O values corresponding to each variable and each model specification.
Discussion
Our analysis investigated whether CDP at month 24 was predictive of subsequent disability accumulation in participants with MS. Although CDP24 was associated with time to EDSS 6 and time to SPMS in univariate analysis, this association was attenuated after accounting for month 24 EDSS. When assessing time to subsequent disability accumulation, CDP24 was associated with a reduced hazard in univariate analysis, but this association was also attenuated after accounting for month 24 EDSS. For all 3 outcomes, the models using CDP24 had worse model fit compared with the models using the EDSS measurements at months 0 and 24. All of these results were consistent across models that also included radiological measures and fatigue/cognitive measures.
The primary analysis for this study was time to EDSS 6; this is a common clinical endpoint for long-term studies in MS. In the univariate analysis, we observed that participants with CDP24 had a faster time to EDSS 6, which was expected because these participants with CDP24 recently experienced disability progression. Interestingly, after accounting for month 24 EDSS, the association changed direction, demonstrating that CDP24 was protective. This finding is likely driven by the fact that participants at a specific EDSS level in the CDP24 group recently arrived at this disability level, while participants at a specific EDSS level in the noCDP24 group had already achieved this level of disability. For example, the noCDP24 group with a month 24 EDSS score of 3 would likely have had an EDSS of 3 for at least the previous 24 months (since the beginning of the study), if not much longer, while the CDP24 group with a month 24 EDSS score of 3, by definition, had to have reached an EDSS of 3 more recently. If the accumulation of disability requires a specific amount of time and the EDSS represents discrete changes in our measurement of disability, we would expect people in the noCDP24 group to progress faster than those in the CDP24 group conditional on the month 24 EDSS score, as the results herein indicate. In addition, the model including month 0 EDSS and month 24 EDSS had improved model fit compared with either model including CDP24. This result is consistent with previous work by our group showing that using EDSS scores directly improved power to detect treatment effects on disability accumulation.12
CDP24 was found to have a stronger association with time to SPMS than with time to EDSS 6. In the multivariable model, the association with CDP24 was attenuated and the confidence interval included a wide range of values showing both a positive and a negative association with time to SPMS, but this association remained stronger compared with that for time to EDSS 6. The stronger association may be driven by the uncertain clinical definition of SPMS. In this study, the physician classification of the disease was used to define the visit when a participant transitioned from RMS to SPMS. Several participants were classified as transitioning from RMS to SPMS even though the EDSS remained below 6. This may indicate that physicians who observed CDP24 considered that the participant might be more susceptible to future transition to SPMS, which may partly explain why CDP24 had a stronger association with this outcome.
For time to subsequent disability accumulation, the univariate analysis showed a negative association between CDP24 and subsequent disability. In the multivariable analysis, the association was attenuated, but CDP24 remained negatively associated. These results are consistent with the results of the time to EDSS 6 analysis controlling for EDSS at month 24 because participants who have a disability transition may be less likely to have a second disability accumulation in the short term. The decreased hazard of subsequent EDSS accumulation for increasing EDSS is consistent with our recent study showing that the time between EDSS levels is larger at higher points on the scale.13
When radiological measures, fatigue, and cognitive functioning were added to the regression models, the main conclusions regarding CDP24 remained valid. In addition, T2LV was shown to be consistently associated with time to disability accumulation. T2LV has been shown to be a marker of disability accumulation in multiple systematic reviews of clinical trials.14,15 In a longitudinal, retrospective study, T2LV at year 1 was predictive of EDSS at year 10. In addition, annualized T2LV change was predictive of Multiple Sclerosis Severity Scale score at year 10.16 Fatigue is the most common symptom in patients with MS, affecting up to 90% at some point during the course of the disease.9,17–19 A study from the New York State MS Consortium registry found that patients with moderate-to-severe fatigue were significantly more likely to experience worsening physical and psychosocial limitations.20 Across all of the models, an increased fatigue score was associated with an increased hazard of disability accumulation, demonstrating that increased fatigue may be indicative of a poor disease prognosis even after accounting for present disability level. The association between SDMT score and disability accumulation was not as consistent, but the direction of the association showed that higher SDMT scores, which indicate better cognitive performance, were associated with a lower hazard of disability accumulation. These results are consistent with existing research on SDMT. A 10-year retrospective longitudinal study reported cognitive impairment, measured by SDMT, as a predictor of disability progression and SPMS conversion in newly diagnosed patients with RMS. Patients with cognitive impairment at MS diagnosis were 3 times more likely to reach EDSS 4 and twice as likely to convert to SPMS compared with cognitively preserved patients.21
Although CDP24 identifies patients who have experienced disability accumulation, our results may show that MS in patients who experience CDP24 may not be progressive, given the limited predictive information CDP24 provides in the presence of EDSS. Recent work has also shown the potential challenges in measuring disability accumulation and improvement on the EDSS.22 This analysis showed that outcomes using the Timed 25-Foot Walk or Nine-Hole Peg Test might lead to better identification of progression in SPMS patients.
Our study has several limitations that warrant further discussion. First, the CLIMB study includes a sample of participants with MS from a single tertiary care MS center, which may not be representative of a larger population of patients with MS. Further, the CLIMB participants had a lower rate of CDP24 than shown in clinical trials, which is consistent with the milder disease course seen in previous CLIMB studies. Therefore, our conclusions may not generalize to patients with more severe disease. Second, only a subset of participants had radiological or fatigue/cognitive information, so we had less power to detect the impact of predictors in these groups. Third, participants could be seen by different providers over the course of the study; thus, changes in the EDSS could have been due to differences in provider assessments rather than change in disability. Fourth, this study included a large number of analyses so the P values should be interpreted cautiously given the multiple comparisons; future studies in other cohorts will be needed to validate the results. Fifth, participants who converted from RMS to SPMS or reached an EDSS of at least 6 in the first 24-month period were excluded from the analysis of the time to each of these events. Removing these participants led to a smaller rate of conversion in the sample than would have been observed had all events been incorporated, but these events could not be included since the participants did not meet the entry criteria for the study. Finally, participants also could change treatment during follow-up. Although we believe that changes in treatment do not affect these findings, the rate of disability accumulation in this sample might not reflect the rate observed in studies where participants with MS are required to remain on the same treatment.
Overall, we show that CDP24 progression provides limited predictive power regarding subsequent disability accumulation in participants with MS based on 3 different outcome measures. Alternative measures of disability provide more information regarding subsequent disease course.
Conflict of interests
The author(s) declared the following potential conflicts of interest with respect to the research, authorship, and/or publication of this article:
Brian Healy, PhD, has received grant support from Analysis Group, Celgene (Bristol Myers Squibb), Verily, Novartis, Merck Serono, and Genzyme and is employed by Brigham and Women’s Hospital.
Bonnie I. Glanz, PhD, has received research support from Merck Serono and Verily and is employed by Brigham and Women’s Hospital.
Elyse Swallow, MPP, James Signorovitch, PhD, and Kaitlin Hagan, PhD, are employed by Analysis Group.
Diego Silva, MD, and Corey Pelletier, PhD, are employed by Bristol Myers Squibb.
Tanuja Chitnis, MD, has provided advisory board/consulting services to Biogen Idec, Merck Serono, Novartis, Sanofi, Bayer, Celgene (Bristol Myers Squibb), and Alexion; has received research support from Verily, Merck Serono, and Novartis; and is employed by Brigham and Women’s Hospital.
Howard Weiner, MD, has received grant support from the National Institutes of Health, the National Multiple Sclerosis Society, Verily, Google Life Sciences, EMD Serono, Biogen, Teva, and Novartis; has received grant support and provided consulting services to Sanofi and Genentech; has provided personal, consulting, and/or advising services to Tilos, Tiziana, IM Therapeutics, vTv Therapeutics, and MedDay and is employed at Brigham and Women’s Hospital.
Data sharing statement
Data requests may be submitted to Celgene, a Bristol Myers Squibb company, at https://vivli.org/ourmember/celgene/ .
Supplemental Material
Supplemental material, sj-pdf-1-mso-10.1177_2055217321999070 for Confirmed disability progression provides limited predictive information regarding future disease progression in multiple sclerosis by Brian C Healy, Bonnie I Glanz Brigham and Women’s Hospital, Boston, MA, USA Elyse Swallow, James Signorovitch, Kaitlin Hagan Analysis Group, Boston, MA, USADiego Silva, CoreyPelletier Bristol Myers Squibb, Princeton, NJ, USA Tanuja Chitnis and HowardWeiner Brigham and Women’s Hospital, Boston, MA, USA in Multiple Sclerosis Journal – Experimental, Translational and Clinical
Acknowledgements
The authors received medical writing support from Analysis Group, Boston, MA, and editorial support from Analysis Group and from Peloton Advantage, LLC , an OPEN Health company, Parsippany, NJ, sponsored by Bristol Myers Squibb, Princeton, NJ. The authors, however, directed and are fully responsible for all content and editorial decisions for this manuscript.
Footnotes
Funding: The author(s) disclosed receipt of the following financial support for the research, authorship, and/or publication of this article: This work was supported by Bristol Myers Squibb, Princeton, NJ, USA.
ORCID iDs: Brian C Healy https://orcid.org/0000-0001-5272-2425
Tanuja Chitnis https://orcid.org/0000-0002-9897-4422
Supplemental Material: Supplemental material for this article is available online.
Contributor Information
Bonnie I Glanz, Brigham and Women’s Hospital, Boston, MA, USA.
Kaitlin Hagan, Analysis Group, Boston, MA, USA.
Corey Pelletier, Bristol Myers Squibb, Princeton, NJ, USA.
Howard Weiner, Brigham and Women’s Hospital, Boston, MA, USA.
References
- 1.Kurtzke JF. Rating neurologic impairment in multiple sclerosis: an expanded disability status scale (EDSS). Neurology 1983; 33: 1444–1452. [DOI] [PubMed] [Google Scholar]
- 2.Healy BC, Engler D, Glanz B, et al. Assessment of definitions of sustained disease progression in relapsing-remitting multiple sclerosis. Mult Scler Int 2013; 2013: 189624. [DOI] [PMC free article] [PubMed] [Google Scholar]
- 3.Lublin FD, Baier M, Cutter G. Effect of relapses on development of residual deficit in multiple sclerosis. Neurology 2003; 61: 1528–1532. [DOI] [PubMed] [Google Scholar]
- 4.Ebers G, Heigenhauser L, Daumer M, et al. Disability as an outcome in MS clinical trials. Neurology 2008; 71: 624–631. [DOI] [PubMed] [Google Scholar]
- 5.Kalincik T, Cutter G, Spelman T, et al. Defining reliable disability outcomes in multiple sclerosis. Brain 2015; 138: 3287–3298. [DOI] [PubMed] [Google Scholar]
- 6.Ontaneda D, Thompson AJ, Fox RJ, et al. Progressive multiple sclerosis: prospects for disease therapy, repair, and restoration of function. Lancet 2017; 389: 1357–1366. [DOI] [PubMed] [Google Scholar]
- 7.Gauthier SA, Glanz BI, Mandel M, et al. A model for the comprehensive investigation of a chronic autoimmune disease: the multiple sclerosis CLIMB study. Autoimmun Rev 2006; 5: 532–536. [DOI] [PubMed] [Google Scholar]
- 8.Wei X, Warfield SK, Zou KH, et al. Quantitative analysis of MRI signal abnormalities of brain white matter with high reproducibility and accuracy. J Magn Reson Imaging 2002; 15: 203–209. [DOI] [PubMed] [Google Scholar]
- 9.Fisk JD, Pontefract A, Ritvo PG, et al. The impact of fatigue on patients with multiple sclerosis. Can J Neurol Sci 1994; 21: 9–14. [PubMed] [Google Scholar]
- 10.Benedict RH, DeLuca J, Phillips G, Multiple Sclerosis Outcome Assessments Consortium et al. Validity of the symbol digit modalities test as a cognition performance outcome measure for multiple sclerosis. Mult Scler 2017; 23: 721–733. [DOI] [PMC free article] [PubMed] [Google Scholar]
- 11.Parmenter BA, Weinstock-Guttman B, Garg N, et al. Screening for cognitive impairment in multiple sclerosis using the symbol digit modalities test. Mult Scler 2007; 13: 52–57. [DOI] [PubMed] [Google Scholar]
- 12.Healy B, Chitnis T, Engler D. Improving power to detect disease progression in multiple sclerosis through alternative analysis strategies. J Neurol 2011; 258: 1812–1819. [DOI] [PubMed] [Google Scholar]
- 13.Zurawski J, Glanz BI, Chua A, et al. Time between expanded disability status scale (EDSS) scores. Mult Scler Relat Disord 2019; 30: 98–103. [DOI] [PubMed] [Google Scholar]
- 14.Sormani MP, Bonzano L, Roccatagliata L, et al. Surrogate endpoints for EDSS worsening in multiple sclerosis. A meta-analytic approach. Neurology 2010; 75: 302–309. [DOI] [PubMed] [Google Scholar]
- 15.Fahrbach K, Huelin R, Martin AL, et al. Relating relapse and T2 lesion changes to disability progression in multiple sclerosis: a systematic literature review and regression analysis. BMC Neurol 2013; 13: 180. [DOI] [PMC free article] [PubMed] [Google Scholar]
- 16.Popescu V, Agosta F, Hulst HE, MAGNIMS Study Group et al. Brain atrophy and lesion load predict long term disability in multiple sclerosis. J Neurol Neurosurg Psychiatry 2013; 84: 1082–1091. [DOI] [PubMed] [Google Scholar]
- 17.Krupp LB, Alvarez LA, LaRocca NG, et al. Fatigue in multiple sclerosis. Arch Neurol 1988; 45: 435–437. [DOI] [PubMed] [Google Scholar]
- 18.Colosimo C, Millefiorini E, Grasso MG, et al. Fatigue in MS is associated with specific clinical features. Acta Neurol Scand 1995; 92: 353–355. [DOI] [PubMed] [Google Scholar]
- 19.Hadjimichael O, Vollmer T, Oleen-Burkey M, North American Research Committee on Multiple Sclerosis. Fatigue characteristics in multiple sclerosis: the North American Research Committee on Multiple Sclerosis (NARCOMS) survey. Health Qual Life Outcomes 2008; 6: 100. [DOI] [PMC free article] [PubMed] [Google Scholar]
- 20.Vaughn CB, Kavak KS, Dwyer MG, et al. Fatigue at enrollment predicts EDSS worsening in the New York state multiple sclerosis consortium. Mult Scler 2020; 26: 99–108. [DOI] [PubMed] [Google Scholar]
- 21.Moccia M, Lanzillo R, Palladino R, et al. Cognitive impairment at diagnosis predicts 10-year multiple sclerosis progression. Mult Scler 2016; 22: 659–667. [DOI] [PubMed] [Google Scholar]
- 22.Koch MW, Mostert J, Repovic P, et al. Reliability of outcome measures in clinical trials in secondary progressive multiple sclerosis. Neurology 2021; 96: e111–e120. [DOI] [PubMed] [Google Scholar]
Associated Data
This section collects any data citations, data availability statements, or supplementary materials included in this article.
Supplementary Materials
Supplemental material, sj-pdf-1-mso-10.1177_2055217321999070 for Confirmed disability progression provides limited predictive information regarding future disease progression in multiple sclerosis by Brian C Healy, Bonnie I Glanz Brigham and Women’s Hospital, Boston, MA, USA Elyse Swallow, James Signorovitch, Kaitlin Hagan Analysis Group, Boston, MA, USADiego Silva, CoreyPelletier Bristol Myers Squibb, Princeton, NJ, USA Tanuja Chitnis and HowardWeiner Brigham and Women’s Hospital, Boston, MA, USA in Multiple Sclerosis Journal – Experimental, Translational and Clinical