

Abstract
Purpose:
To determine the accuracy of CT number and calcium score of a kV-independent technique based on an artificial 120 kV reconstruction, and its potential to reduce radiation dose.
Methods:
Anthropomorphic chest phantoms were scanned on a third-generation dual-source CT system equipped with the artificial 120 kV reconstruction. First, a phantom module containing a 20-mm diameter hydroxyapatite (HA) insert was scanned inside the chest phantoms at different tube potentials (70–140 kV) to evaluate calcium CT number accuracy. Next, three small HA inserts (diameter/length = 5 mm) were inserted into a pork steak and scanned inside the phantoms to evaluate calcium score accuracy at different kVs. Finally, the same setup was scanned using automatic exposure control (AEC) at 120 kV, and then with automatic kV selection (auto-kV). Phantoms were also scanned at 120 kV using a size-dependent mA chart. CT numbers of soft tissue and calcium were measured from different kV images. Calcium score of each small HA insert was measured using commercial software.
Results:
The CT number difference from 120 kV was small with tube potentials from 90 to 140 kV for both soft tissue and calcium (maximal difference of 4/5 HU, respectively). Consistent calcium scores were obtained from images of different kVs compared to 120 kV, with a relative difference <8%. Auto-kV provided a 25–34% dose reduction compared to AEC alone.
Conclusion:
A kV-independent calcium scoring technique can produce artificial 120 kV images with consistent soft tissue and calcium CT numbers compared to standard 120 kV examinations. When coupled with auto-kV, this technique can reduce radiation by 25–34% compared to that with AEC alone, while providing consistent calcium scores as that of standard 120 kV examinations.
Keywords: Agatston score, automatic exposure control, calcium score, cardiac CT, dose reduction
1. INTRODUCTION
Coronary artery calcium score, or Agatston score,1 has been widely used for assessing risk of developing coronary artery disease-related events. Clinically, the calcium score can be used to classify patients at intermediate risk for heart disease into more appropriate risk categories, and help physicians determine the need for medication or other intervention.2–4 The calcium score is calculated based on the amount of calcification in the vessel walls of coronary arteries observed in a cardiac computed tomography (CT) scan. A higher score indicates a larger amount of calcium deposition and increased risk for a future cardiac event.
Historically, calcium scoring requires a stringent scan acquisition protocol with 120 kV tube potential and a series of fixed CT number thresholds.5 Because the x-ray tube potential affects the incident spectra and consequently the CT number of various types of tissues including calcified plaque, the CT number thresholds in calcium scoring established based on a 120 kV tube potential cannot be readily applied to examinations performed with other tube potentials.5–7 Recently, lower tube potential has been used in CT examinations of other body parts, such as an abdomen CT exam, to reduce patient radiation dose.8,9 Consequently, the strict requirement on tube potential in calcium scoring makes it challenging to employ a reduced tube potential to reduce patient radiation dose. On the other hand, because calcium scoring is a screening technique, it is important to keep the radiation dose level as low as possible.
Recently, a kV-independent calcium scoring technique has been developed, which can correct for the CT number of calcified vessel plaque in images acquired with other tube potentials, and generate artificial 120 kV images for the purpose of calcium scoring. This technique could allow a lower tube potential for calcium scoring and therefore reduce patient radiation dose. In this work, we performed a series of phantom experiments to assess the CT number accuracy of images generated using this technique; we evaluated its performance in calculating calcium scores for different phantom sizes, as well as its potential for radiation dose reduction. As will be demonstrated, this technique can benefit patients undergoing coronary calcium scoring CT examinations by considerably reducing radiation dose, while maintaining accurate calcium scores.
2. MATERIALS AND METHODS
All experiments were performed on a 192-slice third generation CT system (Somatom Force, Siemens Healthcare, Forchheim, Germany) running the software (VB10) equipped with the kV-independent calcium scoring function. This technique is implemented as a dedicated reconstruction kernel (Sa36) with equivalent image sharpness as the standard calcium scoring kernel (Qr36) for 120 kV on that system model. It is based on an iterative beam hardening correction technique. Tissues with CT numbers higher than a preset threshold are considered as calcified tissues. The image of calcified tissues are then used to update the original projection data after correcting for the kV-dependent attenuation difference between 120 kV and other tube potentials based on a voltage-dependent look-up table in the projection domain. With said correction, this technique is capable of producing images with CT numbers of bone and calcification materials equivalent to that acquired with 120 kV tube potential from a noncontrast CT examination performed with a tube potential of 70 to 140 kV.
2.A. CT number accuracy
To investigate the performance of this dedicated reconstruction kernel, we performed a series of phantom experiments on an anthropomorphic thoracic CT phantom (QRM GmbH., Moehrendorf, Germany), without and with extension rings to emulate a small (30 cm × 20 cm in size), medium (35 cm × 25 cm), and large size (40 cm × 30 cm) patient.10 To evaluate the CT number accuracy of calcium tissue, a phantom module including a 20 mm diameter, 200 mg/mL hydroxyapatite (HA) cylinder was placed in the phantom and scanned with eight tube potentials from 70 to 140 kV (10 kV increment), with the maximal tube current per rotation available for each tube potential. This was done to minimize the effect of noise in the phantom measurement. Scans were performed in axial mode and the longitudinal collimation was 96 × 0.6 mm. Each scan was repeated three times. The CT number of the HA insert was measured with a circular region of interest (ROI) with a 12 mm diameter across four slices.
2.B. Calcium score accuracy
Next, three HA cylinders (5 mm diameter and 5 mm length), with HA concentrations of 200, 400, and 800 mg/mL, respectively, were inserted into a piece of pork steak and placed within the anthropomorphic chest phantoms to mimic coronary calcification. An axial CT image of the medium-sized chest phantom is shown in Fig. 1. Note that the HA cylinders were inserted at different longitudinal locations and only one of the HA inserts (400 mg/mL) is shown in this slice. The phantoms were scanned with eight tube potentials from 70 to 140 kV using a sequential acquisition mode. Each scan was performed with maximal tube current per rotation allowed on the system and was repeated three times. The CT number of soft tissue was then measured with a circular ROI, 24 mm in diameter, across 25 slices. Note that the phantom setup including a pork steak was used in this study to investigate the effect of realistic soft tissue in patients, as the other phantom material may not accurately mimic CT numbers of soft tissue at different tube potentials.
FIG. 1.
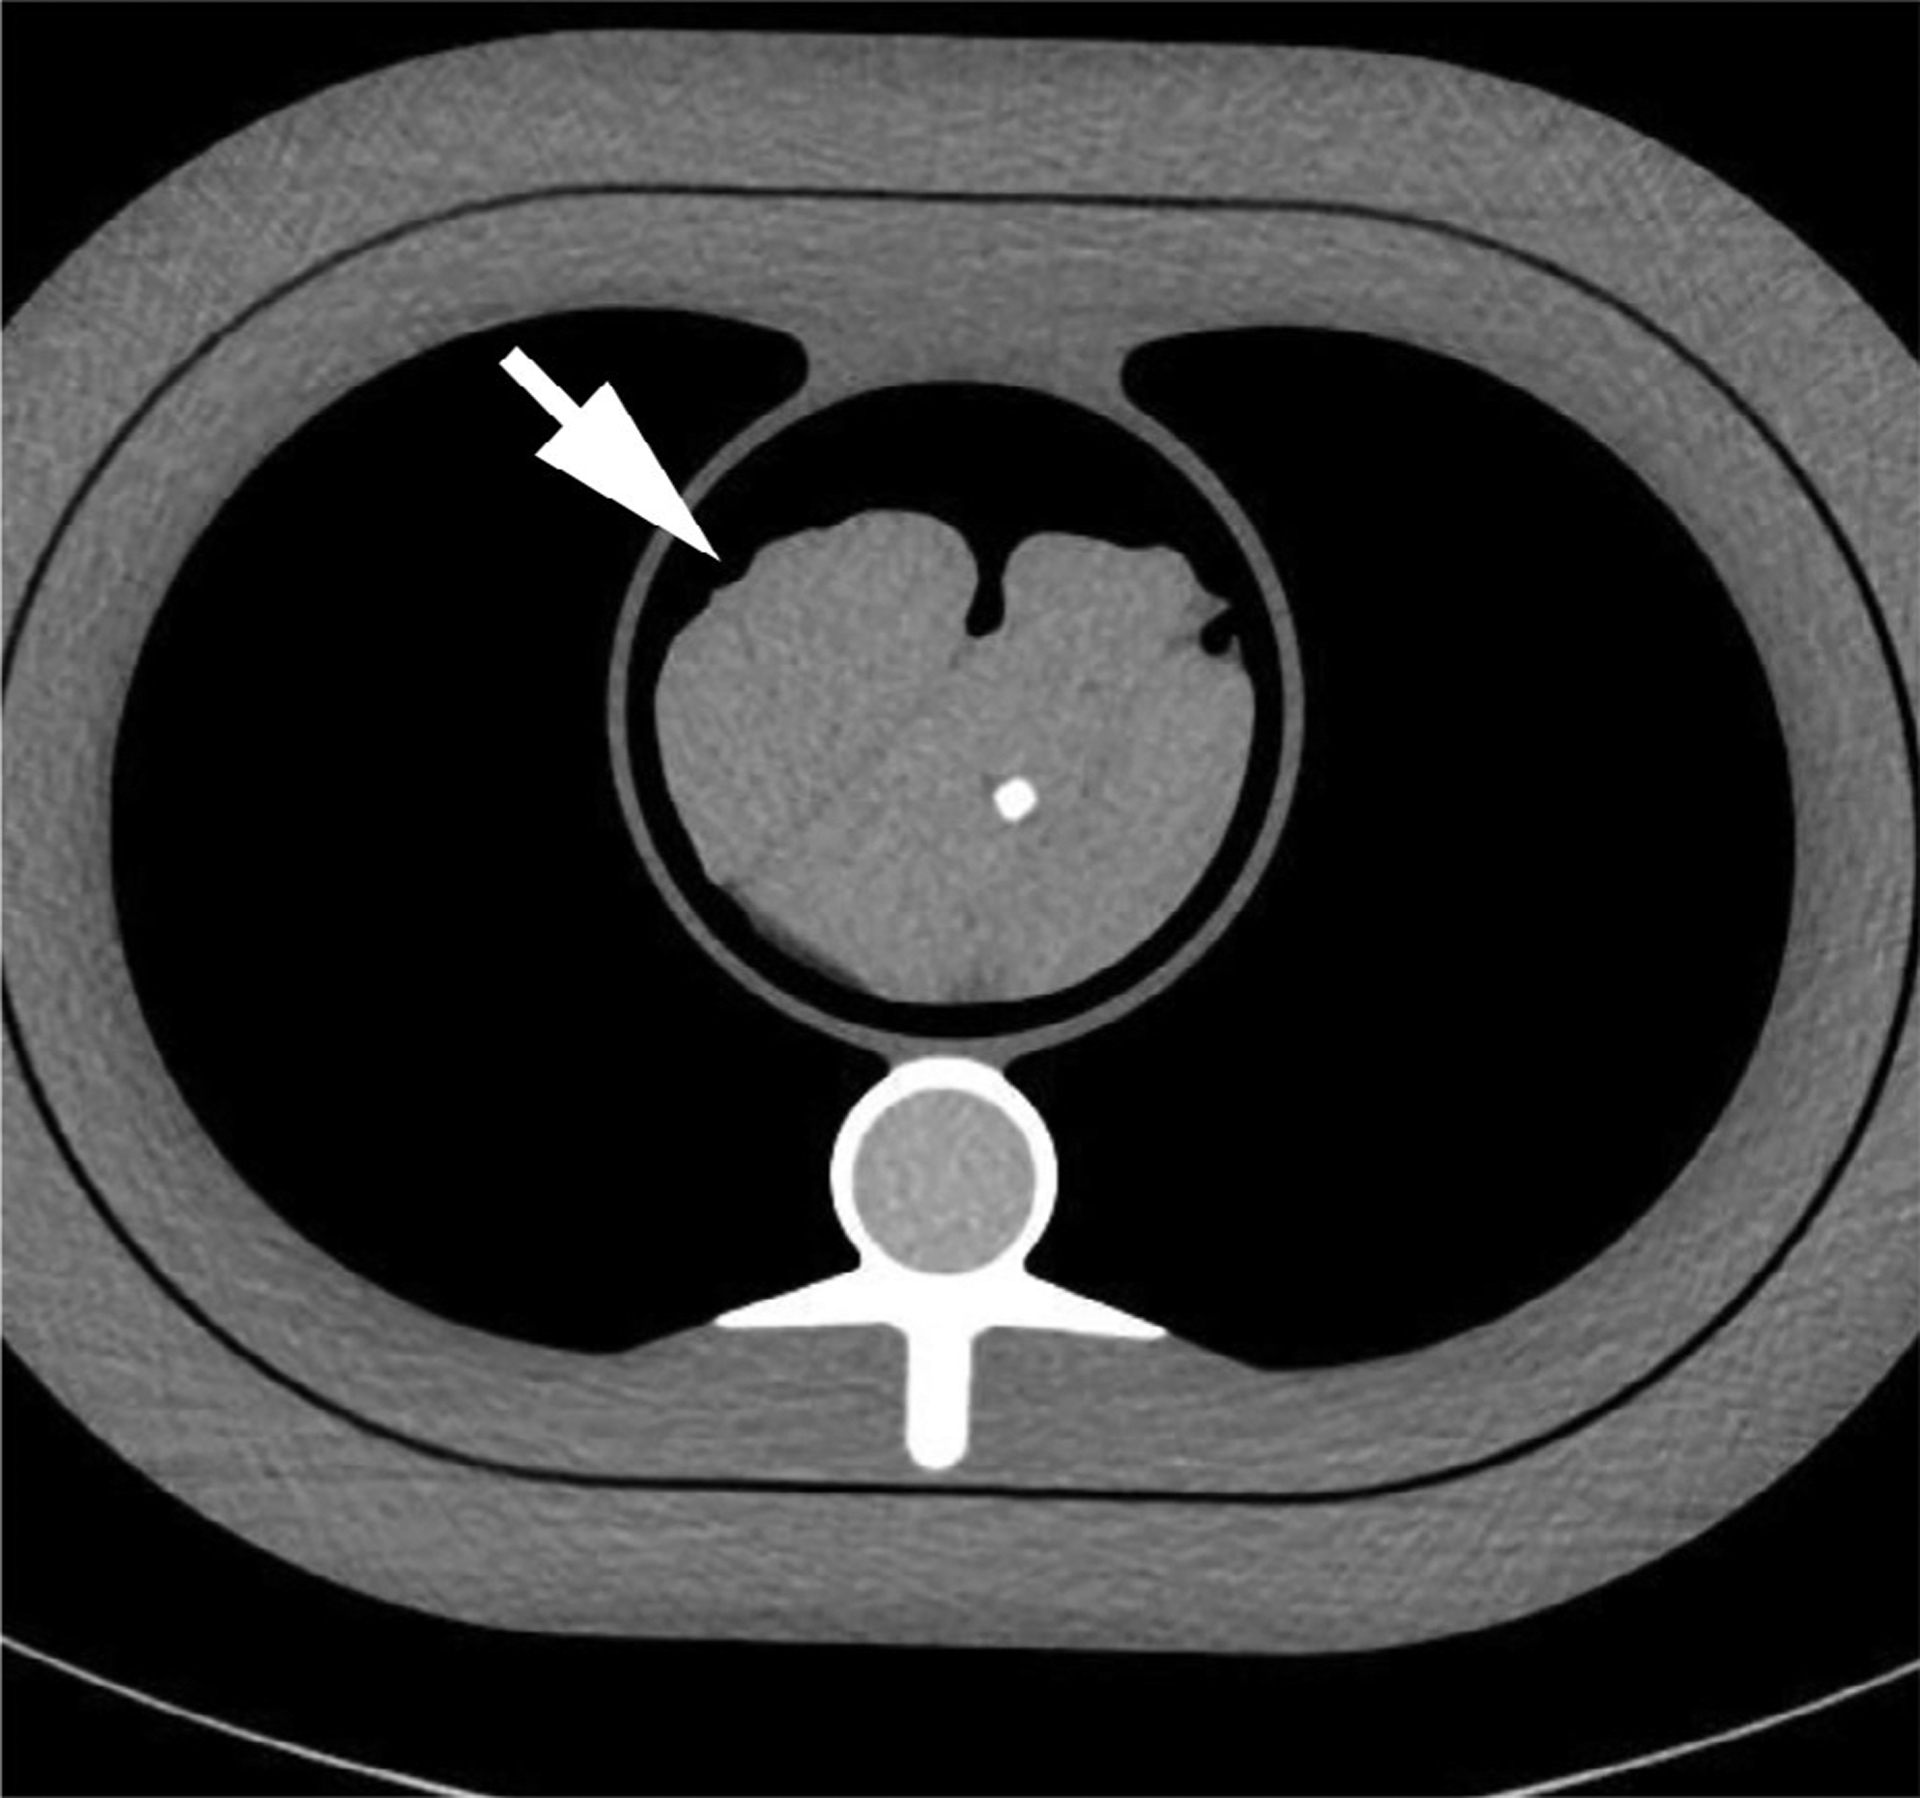
Computed tomography image showing the phantom setup including an anthropomorphic chest phantom and a pork steak (arrow) with hydroxyapatite inserts inside. Note that the hydroxyapatite (HA) cylinders were inserted at different longitudinal locations and only one of the HA inserts (400 mg/mL) is shown in this slice.
2.C. Radiation dose reduction
The phantoms were then scanned with automatic exposure control (AEC) enabled (CareDose4D, Siemens Healthcare) and a quality reference mAs (QRM) per rotation of 180/150/120/90 mAs/rot, respectively. The QRM is an image quality indicator and is set equal to the effective mAs that produces the desired image quality on a standard-sized patient (approximately 70–80 kg). To evaluate the capability of this technique in patient radiation dose reduction, the same scans were repeated with the same QRM settings, but with automatic kV selection enabled (CarekV, Siemens Healthcare). A reference tube potential of 120 kV and CarekV setting of 4 (default setting) was used. For comparison, the phantoms were scanned at 120 kV using a size-based technique chart used at our practice, which was designed to target the noise levels recommended by the International Consortium on Standardization in Cardiac CT for each phantom size.10 Each scan was repeated three times.
All images acquired at different tube potentials were reconstructed with the dedicated reconstruction kernel (Sa36) at 3 mm slice thickness and 1.5 mm slice increments. Images were also reconstructed with a standard quantitative kernel (Qr36) previously designed for calcium scoring. The calcium score of each HA insert for each data set was calculated using commercial software (Syngo.Via, VB20, Siemens). The default calcium detection threshold for calcium score (130 HU) was used in all cases.
3. RESULTS
The CT numbers of soft tissue and HA insert (200 mg/mL) were measured from images acquired on small, medium, and large size phantoms with different tube potentials, and are summarized in Fig. 2. The soft tissue CT numbers were consistent with that of 120 kV across tube potentials from 70 to 140 kV, with the maximal mean difference of 4 HU. The CT numbers of the HA insert at different kVs were also consistent with that of 120 kV down to 90 kV, with the maximal difference of 5 HU. A slight drop of HA CT number was observed when tube potential was lower than 90 kV, with the maximal difference of 18 HU observed on the small phantom with 70 kV tube potential. The different behavior of soft tissue and calcium component with lower kVs could be explained by their difference in x-ray attenuation especially in low energy range. Calcified tissue has a higher photoelectric attenuation component and therefore stronger energy dependence. Examples of phantom images without and with the kV-independent calcium score reconstruction (artificial 120 kV) are shown in Fig. 3. Note that, without artificial 120 kV reconstruction [Fig. 3(a)], the HA insert in the 90 kV image appears to be brighter (due to lower kV) than that of the artificial 120 kV [Fig. 3(b)] and the real 120 kV images [Fig. 3(c)].
FIG. 2.
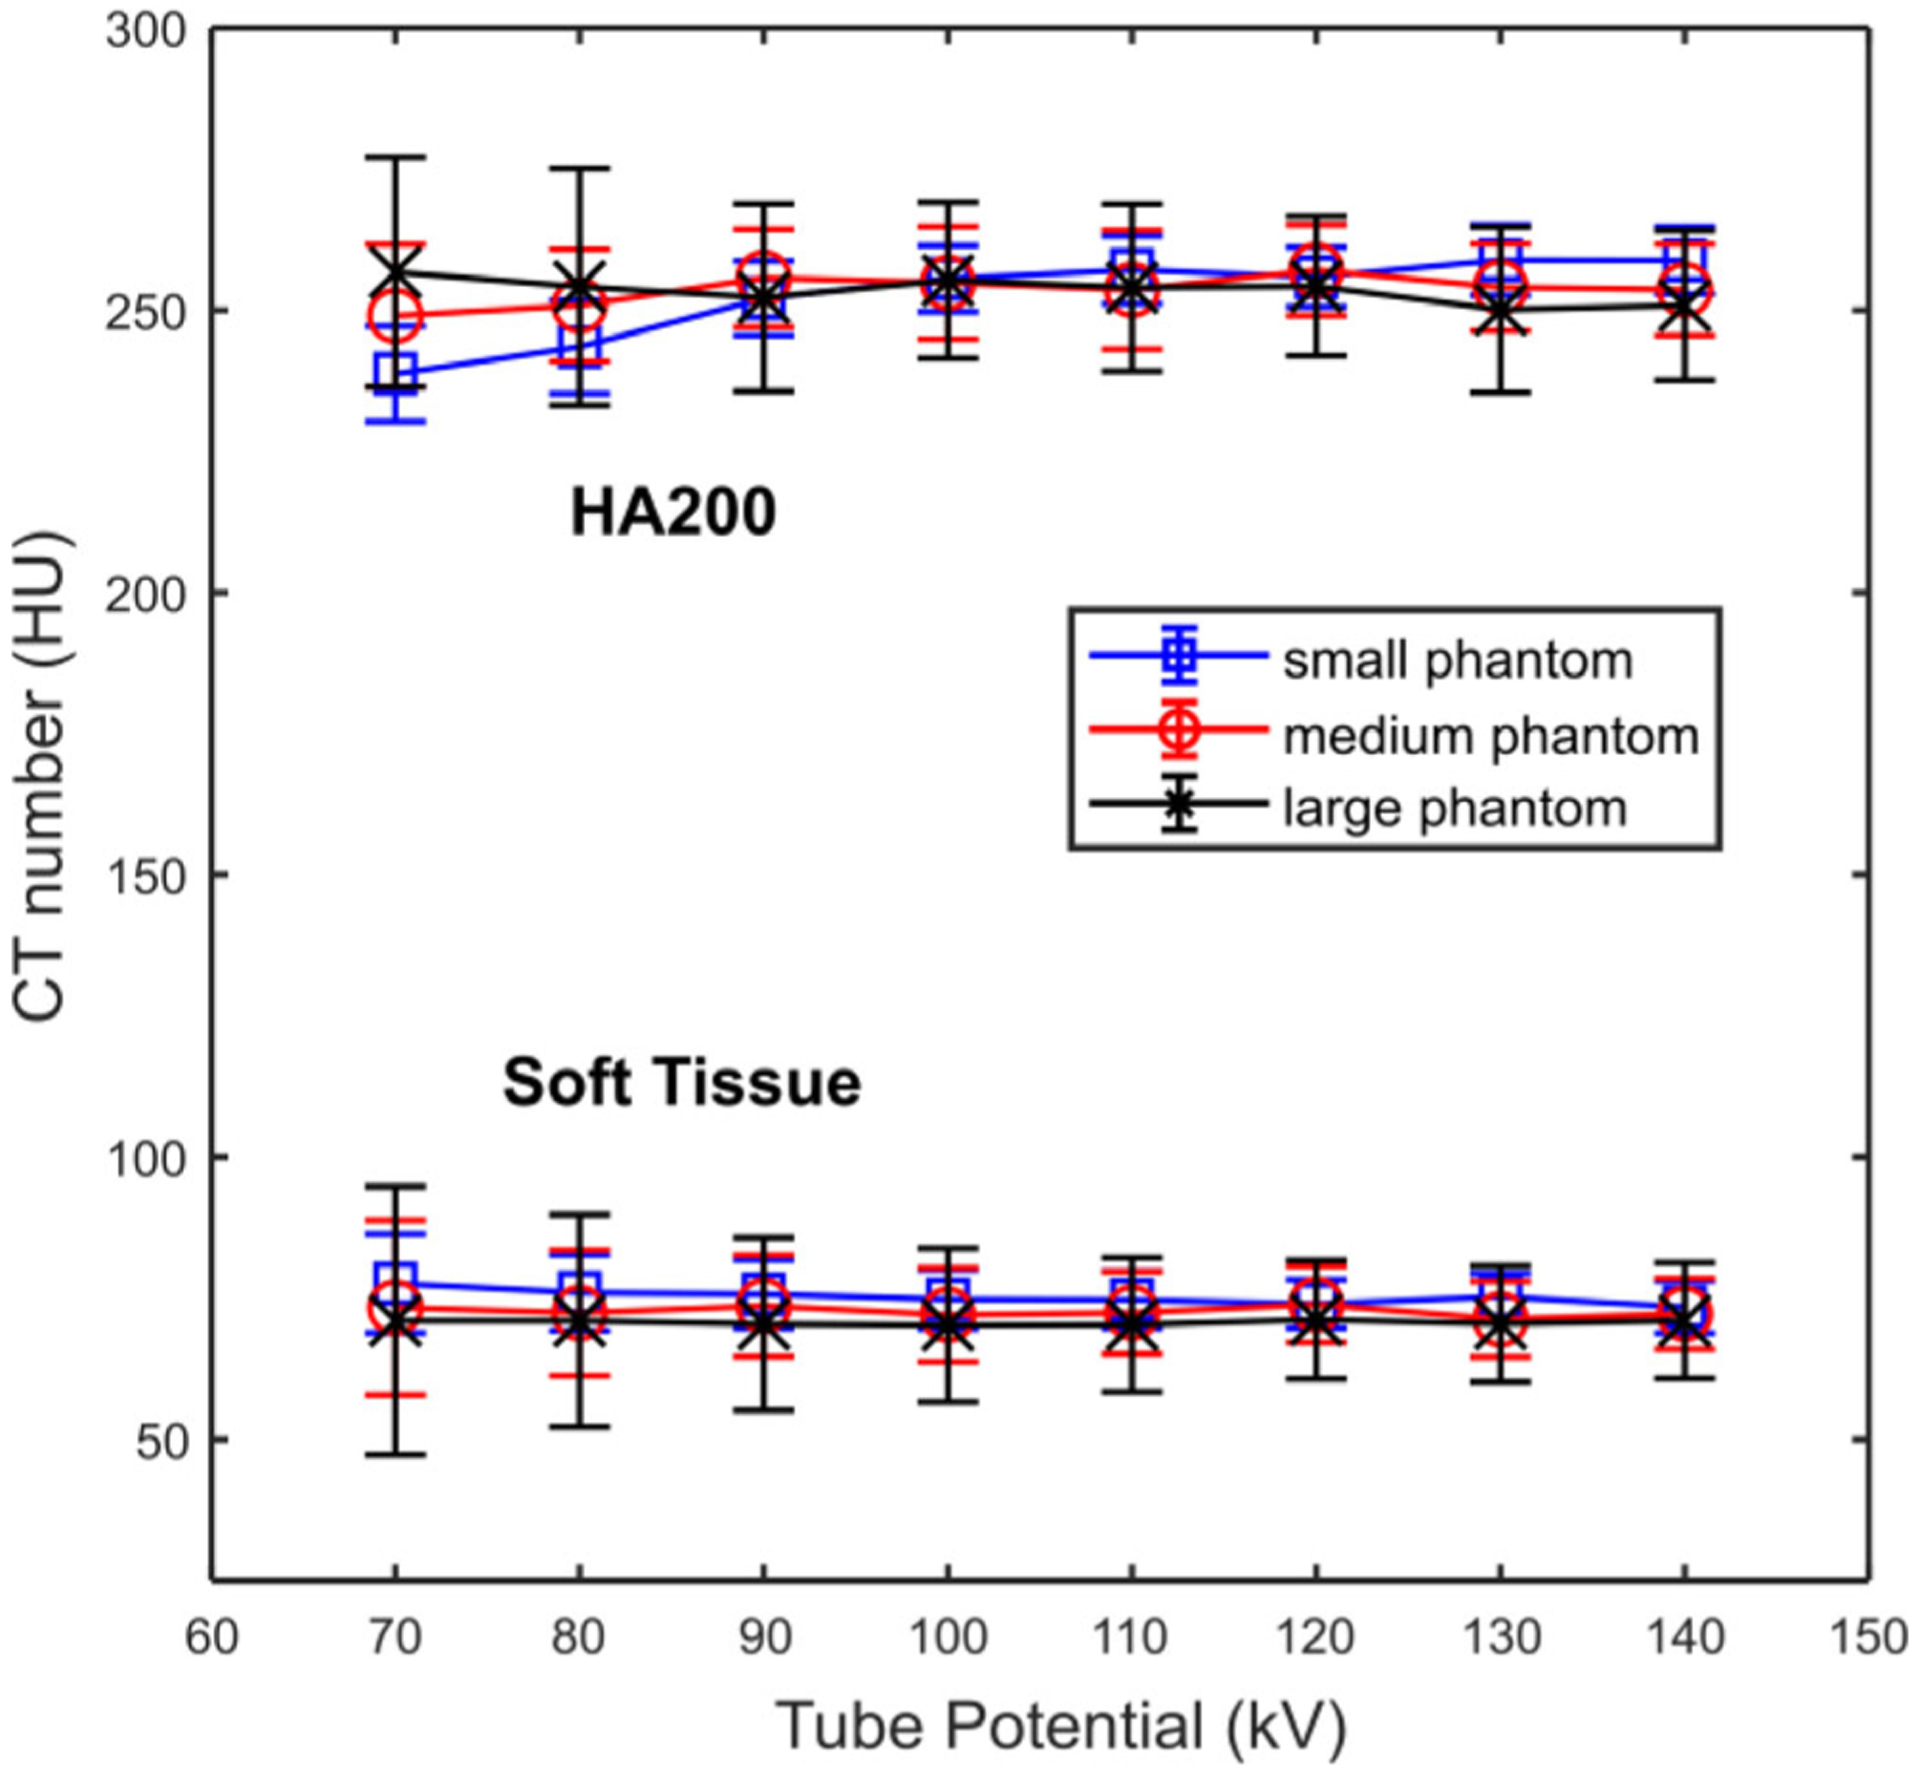
Computed tomography numbers of soft tissue and a hydroxyapatite (HA) insert (200 mg HA/mL) measured from images acquired on small, medium, and large phantoms scanned with different tube potentials (70 to 140 kV) and reconstructed with a dedicated kV-independent calcium score kernel.
FIG. 3.
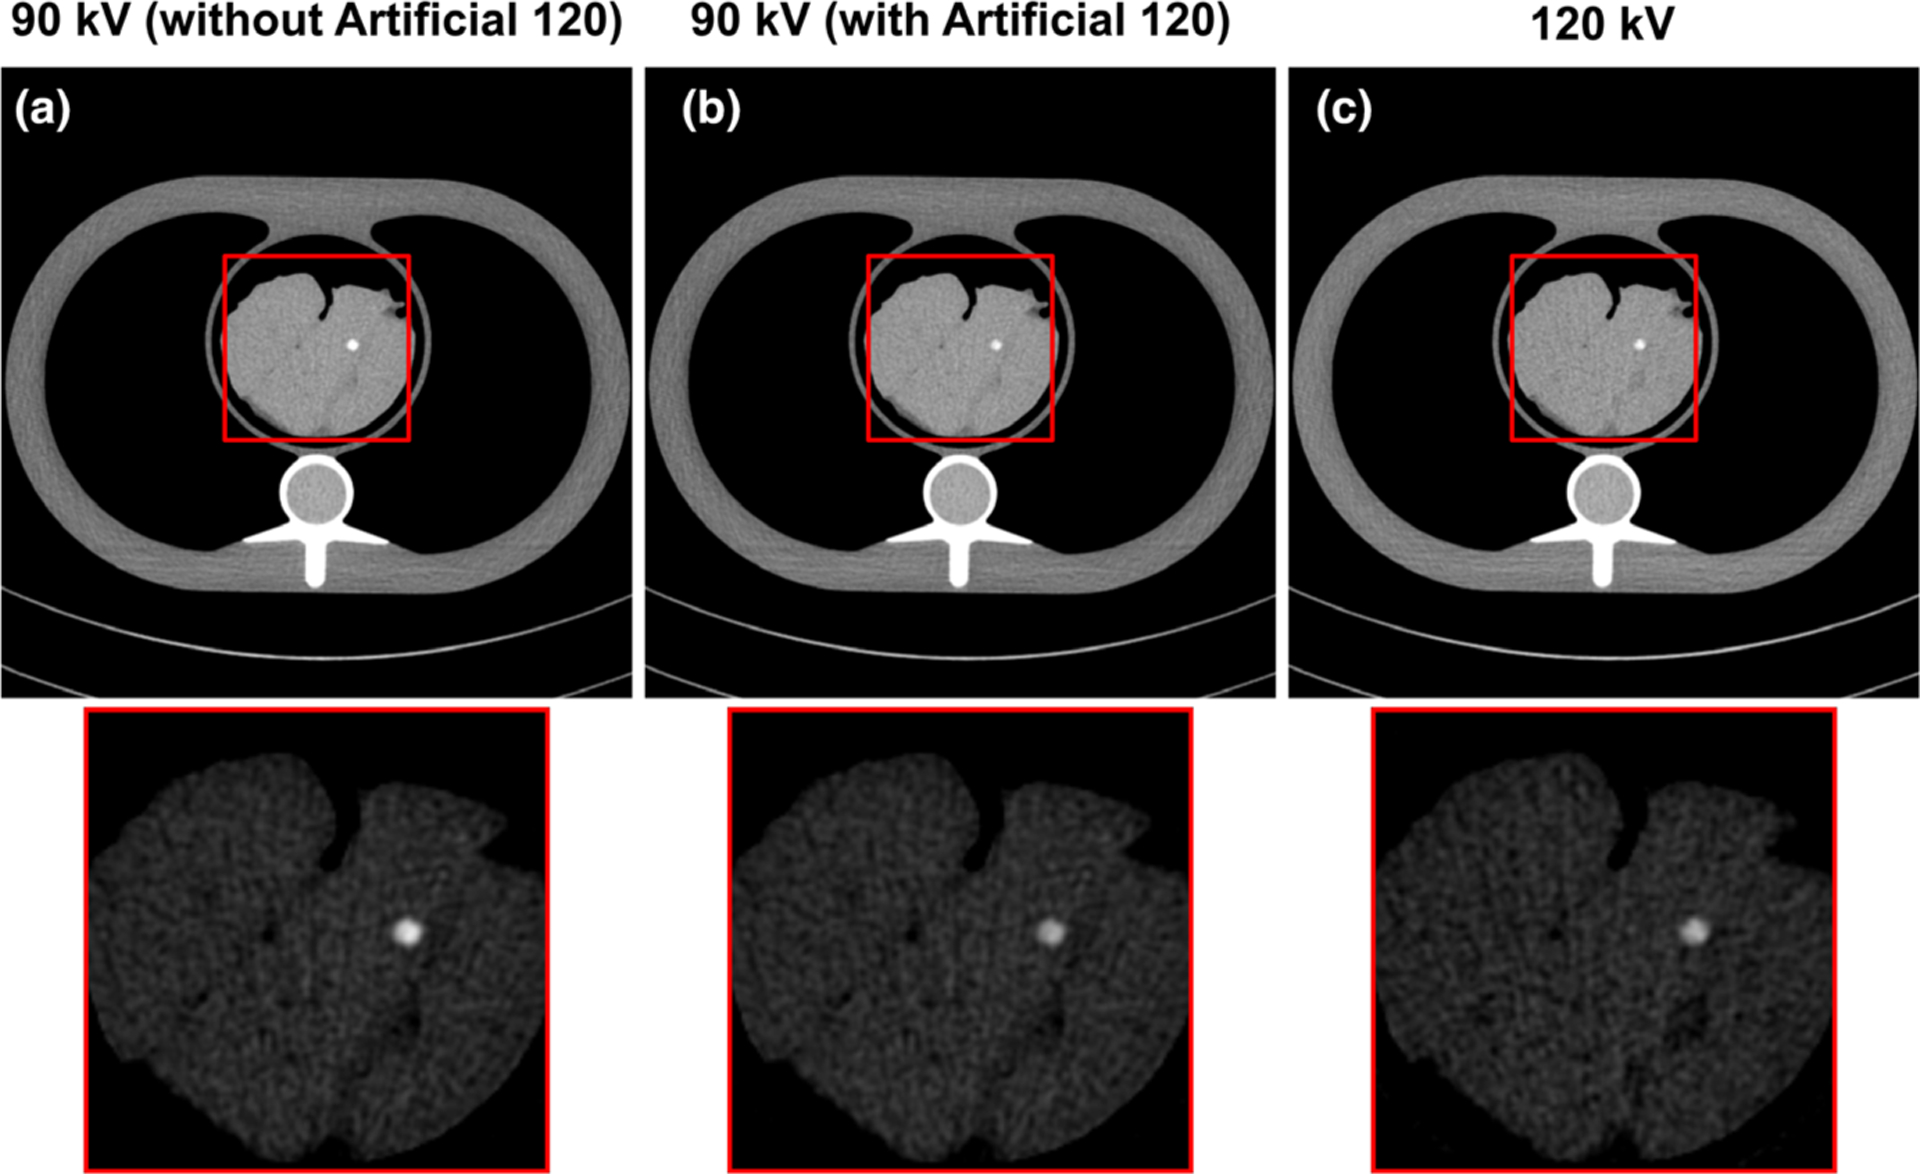
Examples of phantom images acquired at 90 kV and reconstructed without (a) and with (b) the kV-independent calcium score kernel (artificial 120 kV), compared to the phantom image acquired at 120 kV (c). The display window width (WW) and level (WL) of magnified insets were adjusted to highlight the difference in hydroxyapatite insert computed tomography number (WW/WL = 450/40 HU and 450/250 HU for full scale images and magnified insets). Note that the hydroxyapatite (HA) cylinders were inserted at different longitudinal locations and only one of the HA inserts (400 mg/mL) is shown in this slice.
Figure 4 shows the calcium scores of the three HA inserts (200, 400, 800 mg HA/mL, respectively) calculated from images acquired with different tube potentials. Relative consistent score numbers were observed for the low and medium (HA200 and HA400) concentration HA inserts, while a drop of score was noted for the high concentration HA insert (HA800). Overall, the calcium score calculated from other kVs using this kV-independent calcium scoring technique was relatively consistent compared to the baseline 120 kV for a tube potential higher than 90 kV, with the differences in calcium scores <13.8 for the 200 and 400 mg HA/mL inserts, representing a relative change less than 8%. A calcium score difference of 22 was observed for the 800 mg HA/mL insert, representing a 7% relative change compared to the baseline 120 kV. Hence, with a tube potential from 90 to 140 kV, the maximal score differences were lower than 8% of that measured at 120 kV for all three HA concentrations.
FIG. 4.
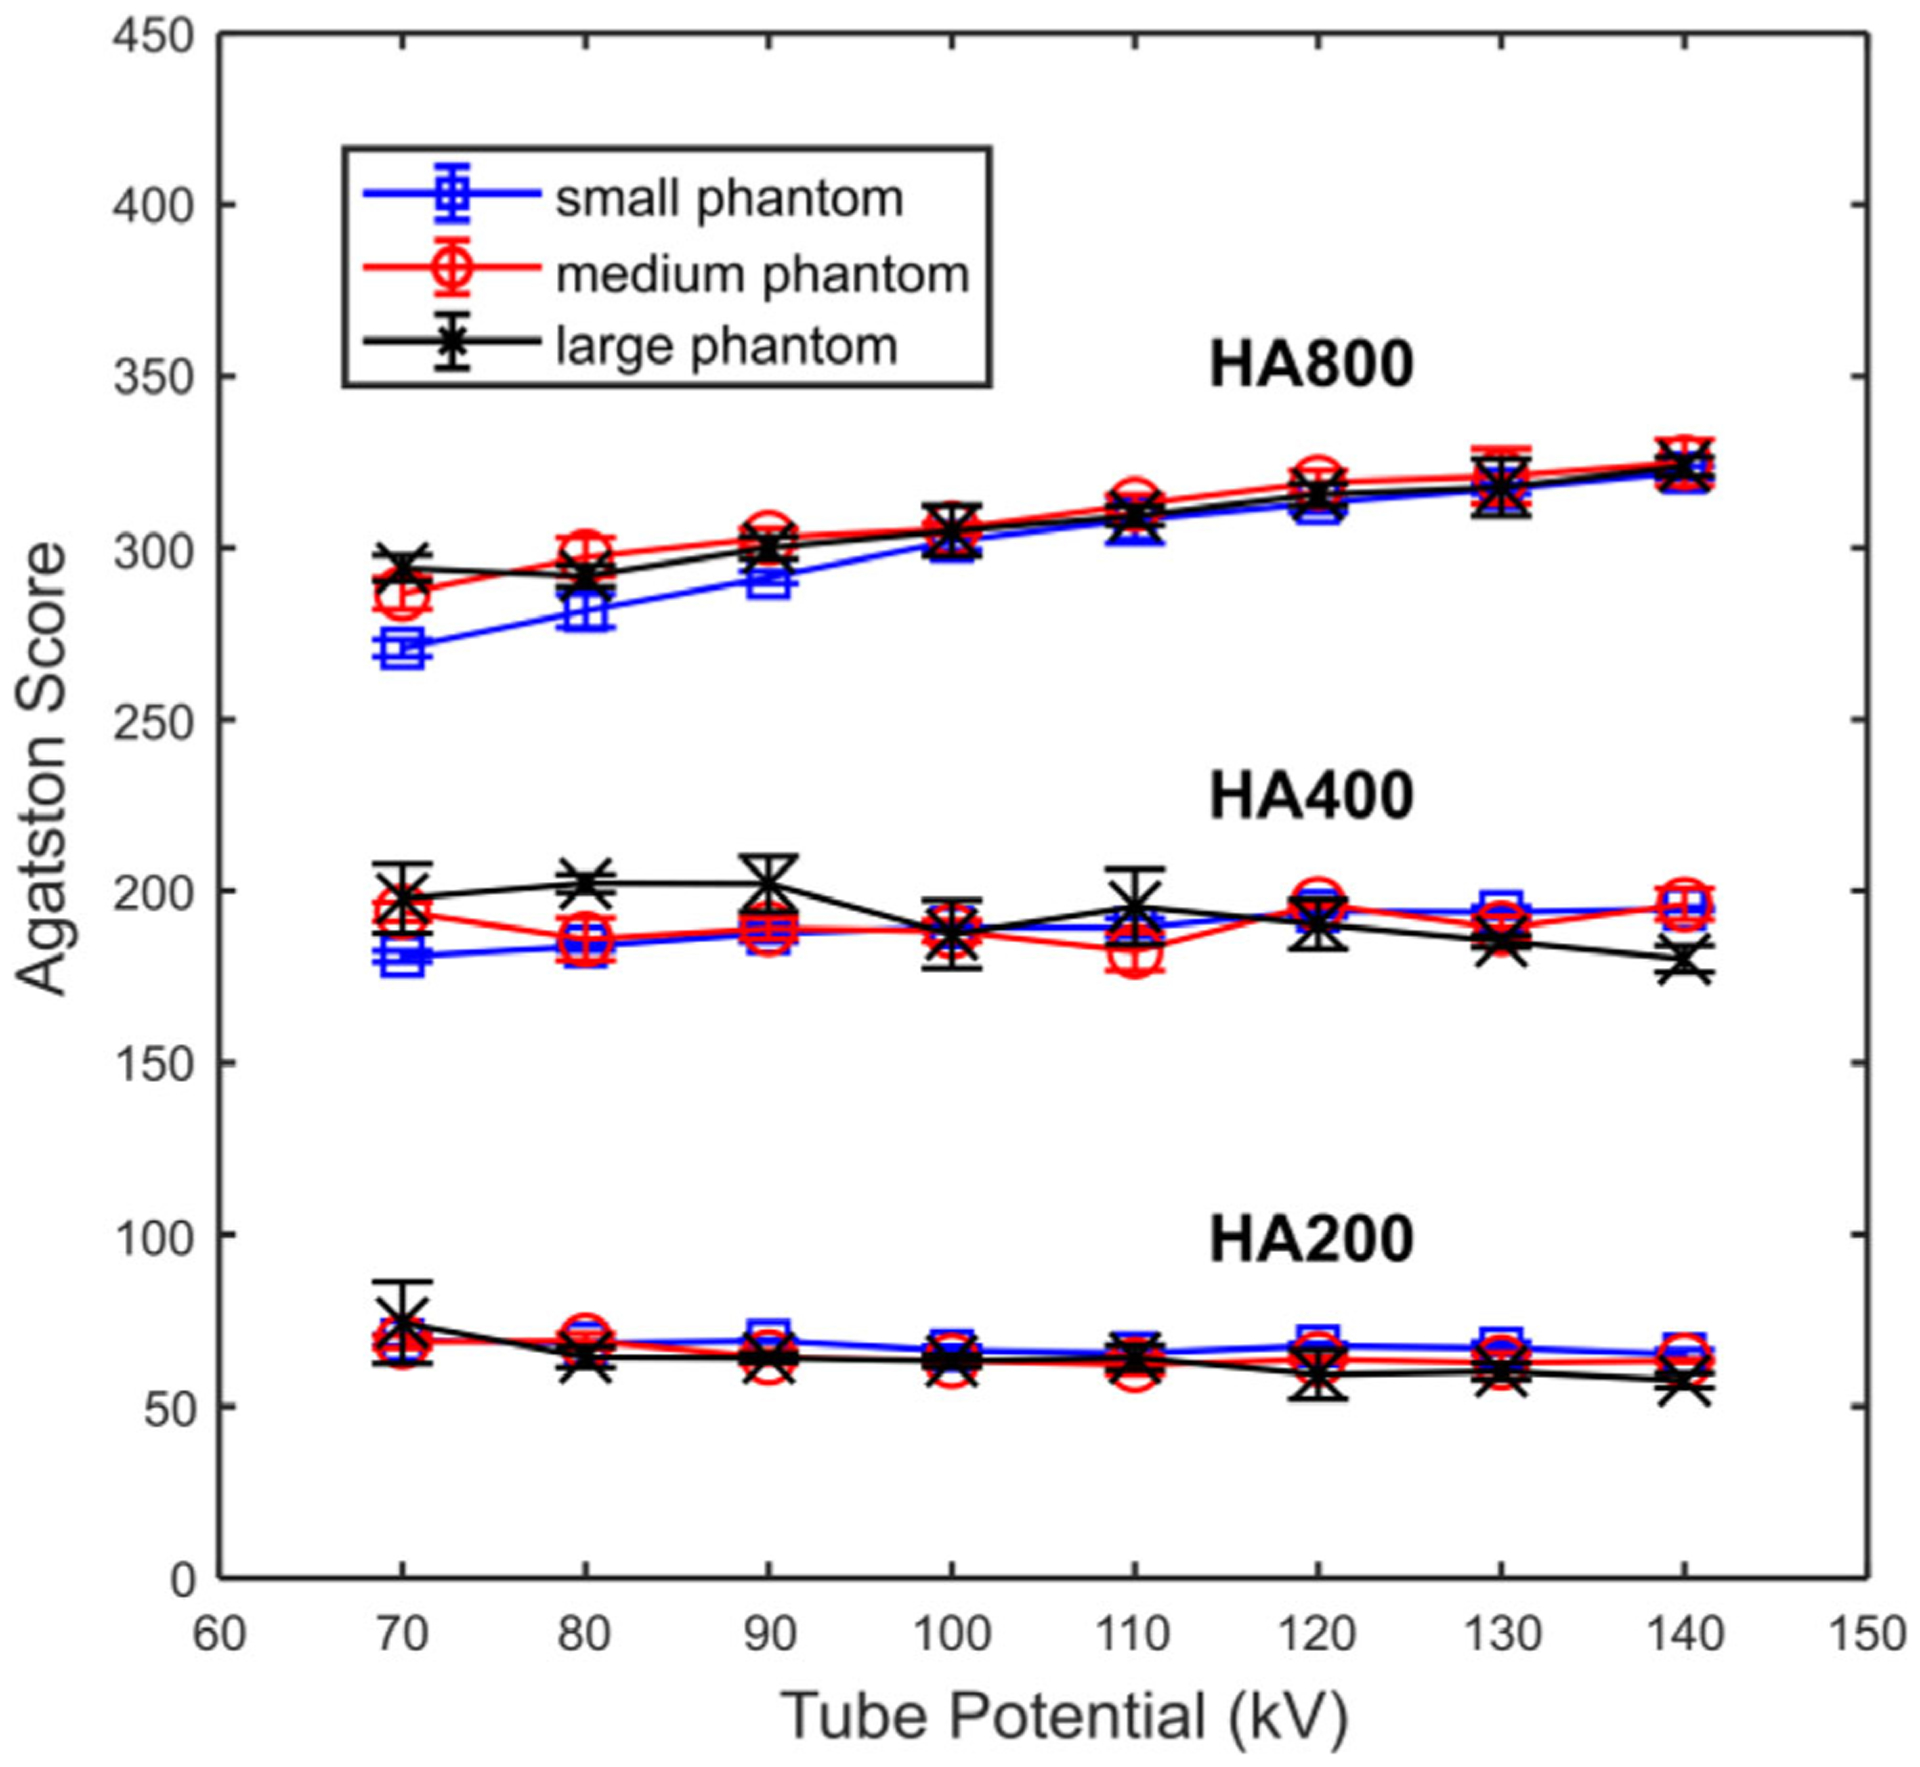
Agatston scores of three hydroxyapatite inserts (HA concentration = 200, 400, 800 mg/mL) measured from images acquired with different tube potentials on small, medium, and large phantoms. Scores were determined using the kV-independent calcium scoring technique.
Figure 5 shows the calcium scores measured from images acquired with different QRM values (90 to 180 mAs) using the AEC tube current modulation technique (CareDose4D) before (a to c) and after (d to f) enabling the automatic tube potential selection (CarekV) function. The calcium scores measured from images acquired with 120 kV using the clinical technique chart is also shown for comparison. Overall, the calcium score was relatively consistent compared to the baseline 120 kV technique chart for both CareDose4D and CarekV data sets. However, there was an increase of calcium score as QRM decreased from 180 to 90 mAs, most noticeable for the 200 mg/mL HA insert (HA200) and large size phantom. When the calcium score measured from 120 kV images using the clinical technique chart as a baseline, the root mean square error (RMSE) of calcium score for each acquisition setting was calculated, and the relative RMSE values, normalized to the scores of the 120 kV technique chart, were summarized (shown in Fig. 6). The results in Fig. 6 demonstrate an increase of relative RMSE as QRM decreased, especially for the 200 mg/mL HA insert. Previous studies have shown that the percentage difference in calcium scores for the same patient and the same scanner can be around the level of 20%.10–13 Figure 6 shows that the QRM value can be reduced down to 150 and 120 mAs for CareDose4D and CarekV, respectively, while keeping relative RMSE below the 20% threshold.
FIG. 5.
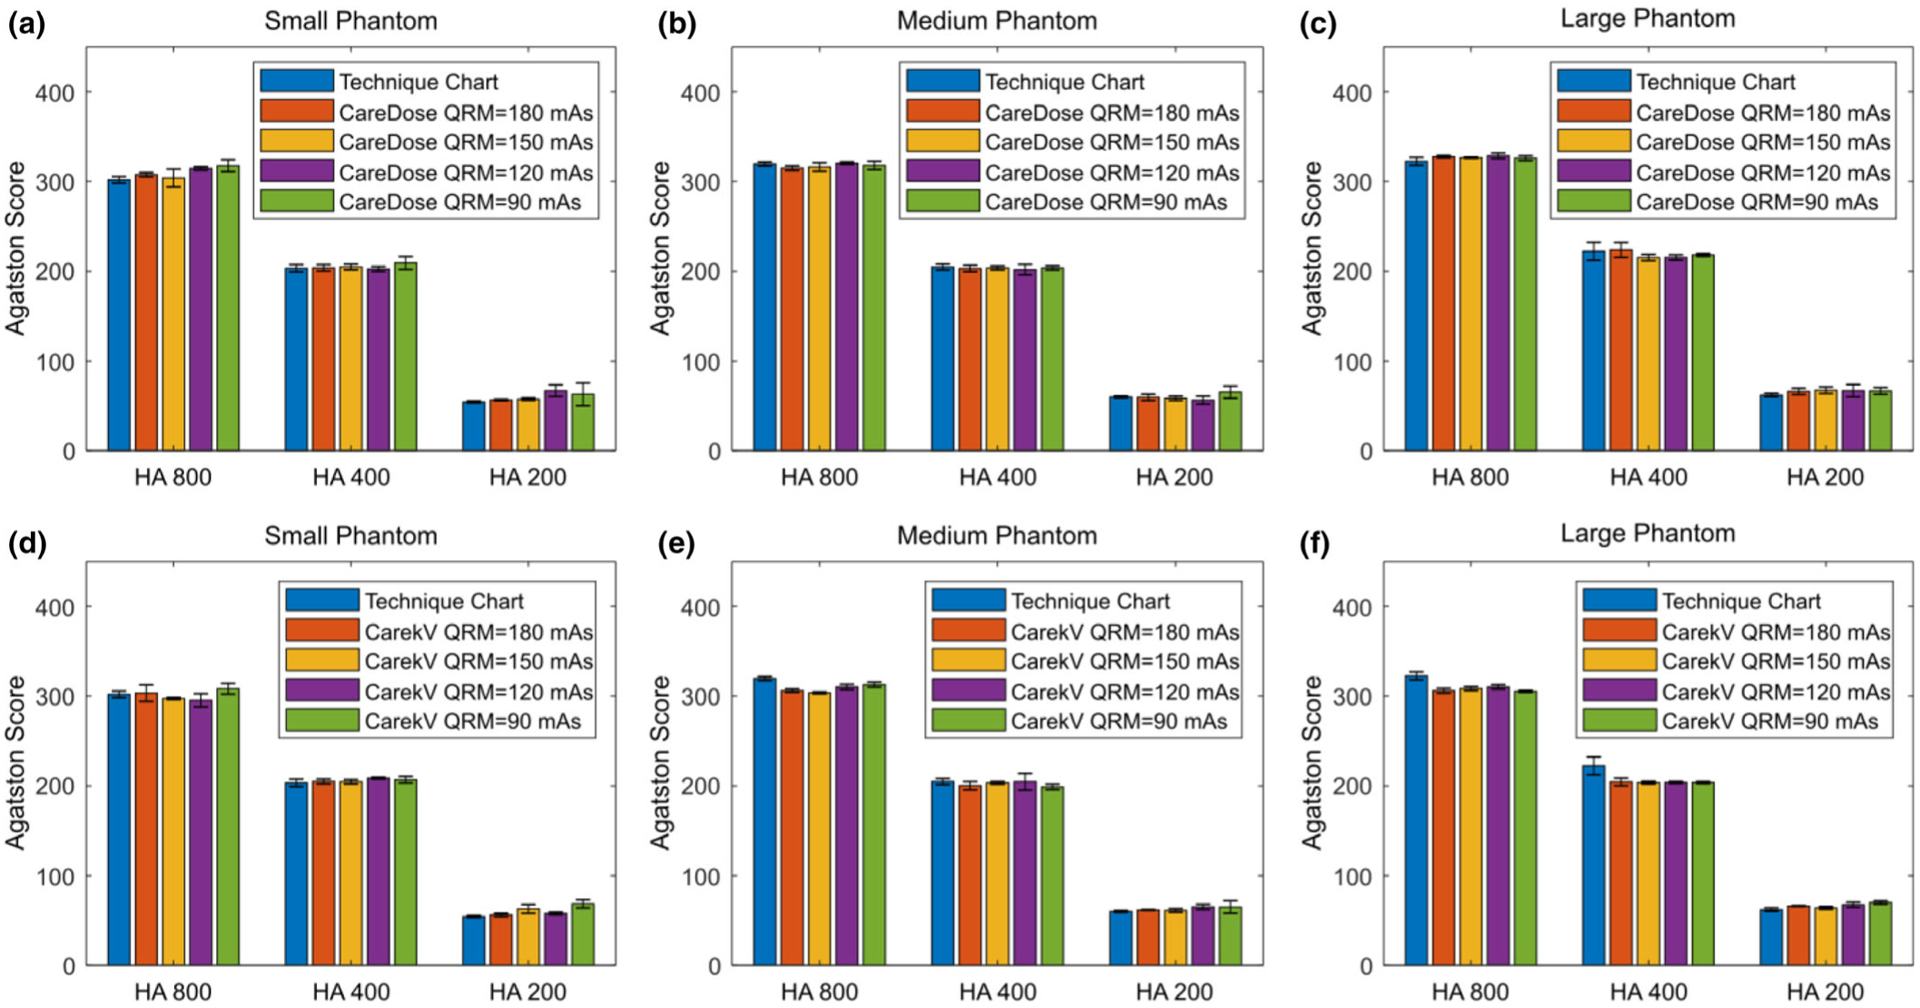
Agatston scores of three hydroxyapatite (HA) inserts (HA concentration = 200, 400, 800 mg/mL) measured from images acquired on small (a, d), medium (b, e), and large (c,f ) phantoms using automatic exposure control with tube current modulation (CareDose, a–c) and different QRM (180 to 90 mAs), and with automatic tube potential selection (CarekV, d–f) and the same QRM. Scores were determined using the kV-independent calcium scoring technique.
FIG. 6.
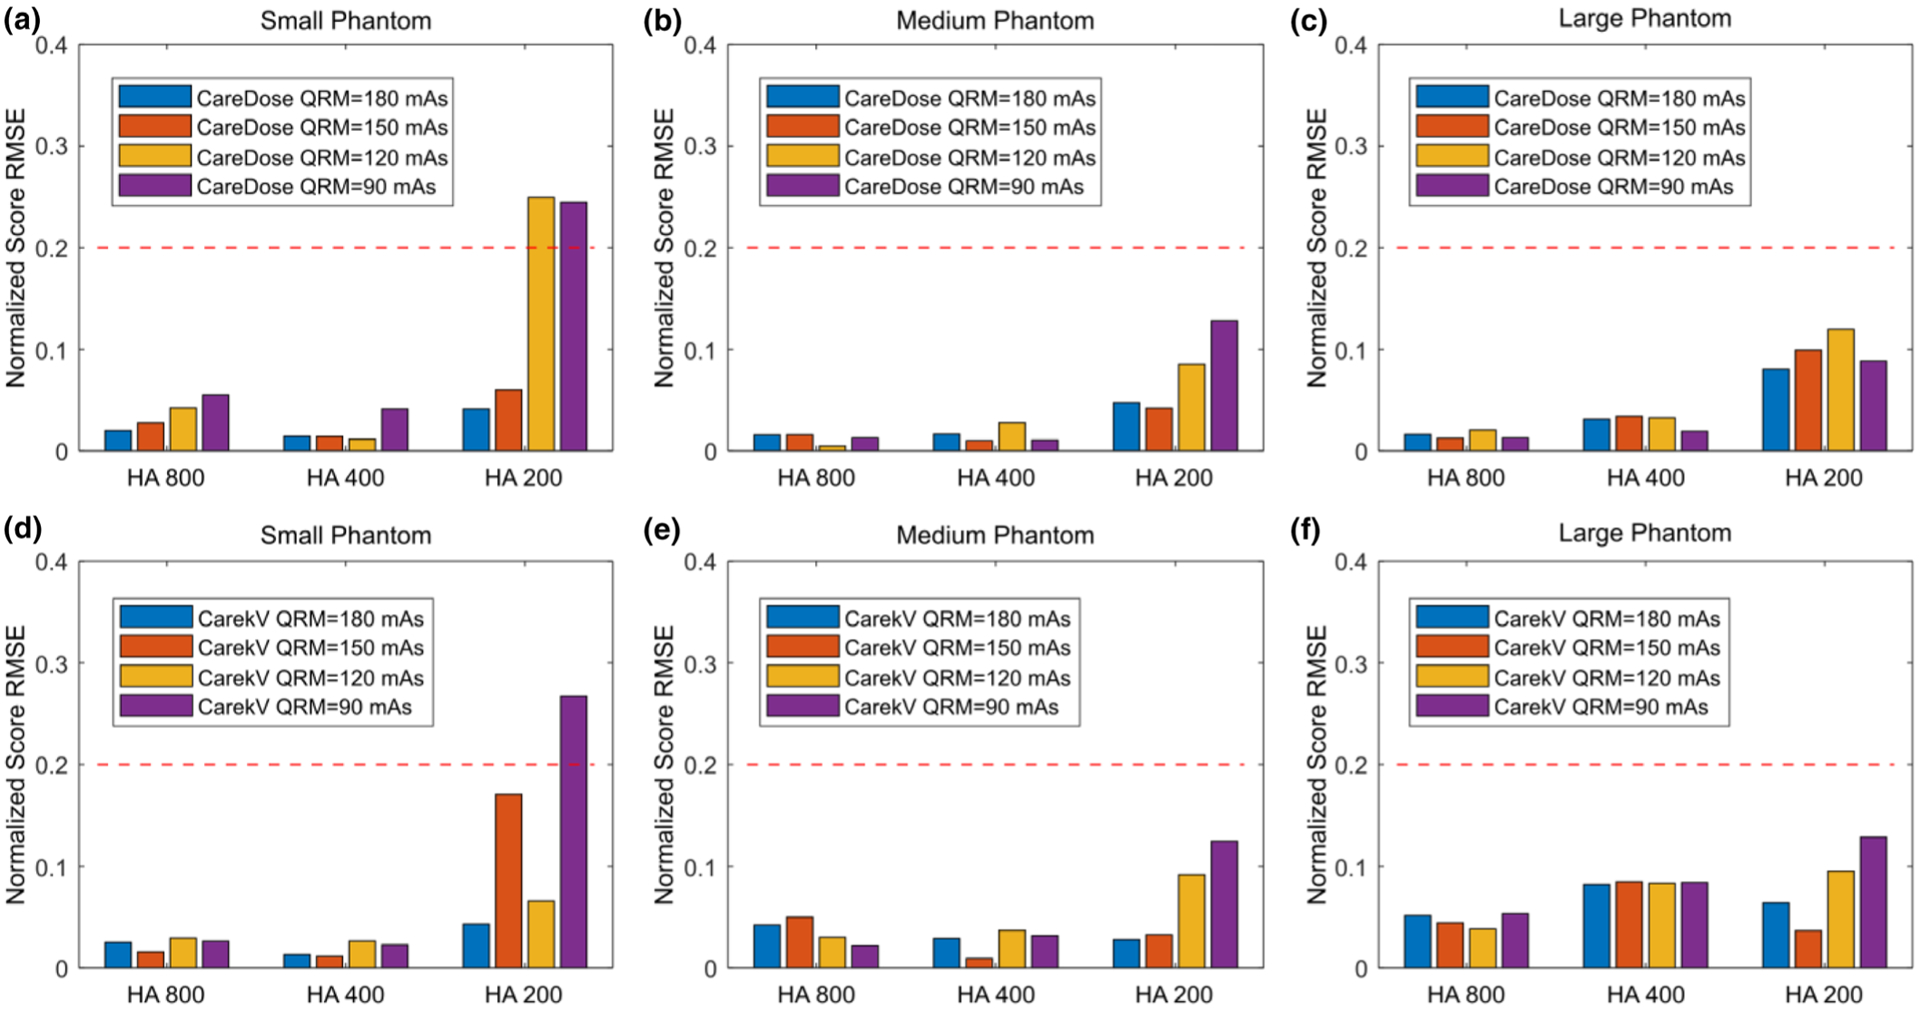
Root mean square error (RMSE) of Agatston scores for three hydroxyapatite (HA) inserts (HA concentration = 200, 400, 800 mg/mL) measured from images acquired on small (a, d), medium (b, e), and large (c, f) phantoms using automatic exposure control with tube current modulation (CareDose, a–c) and different QRM (180 to 90 mAs), and with automatic tube potential selection (CarekV, d–f) and the same QRM. The score RMSE values were normalized to the score measured in images acquired with 120 kV and the technique chart. The red-dashed line indicates 20% RMSE value. Scores were determined using the kV-independent calcium scoring technique.
Figure 7 shows radiation dose in terms of the volume CT dose index (CTDIvol), 32 cm for the patient size-specified 120 kV technique chart, with AEC at 120 kV (CareDose4D, QRM = 150 mAs) and with automatic kV selection (CarekV, QRM = 120 mAs). The figure demonstrates that the use of AEC reduces CTDI compared to the baseline 120 kV with the technique chart. Compared to CareDose4D, a further reduction of CTDI can be achieved using automatic kV selection (CarekV), and was 34%, 29%, and 25% for small, medium, and large phantoms, respectively.
FIG. 7.
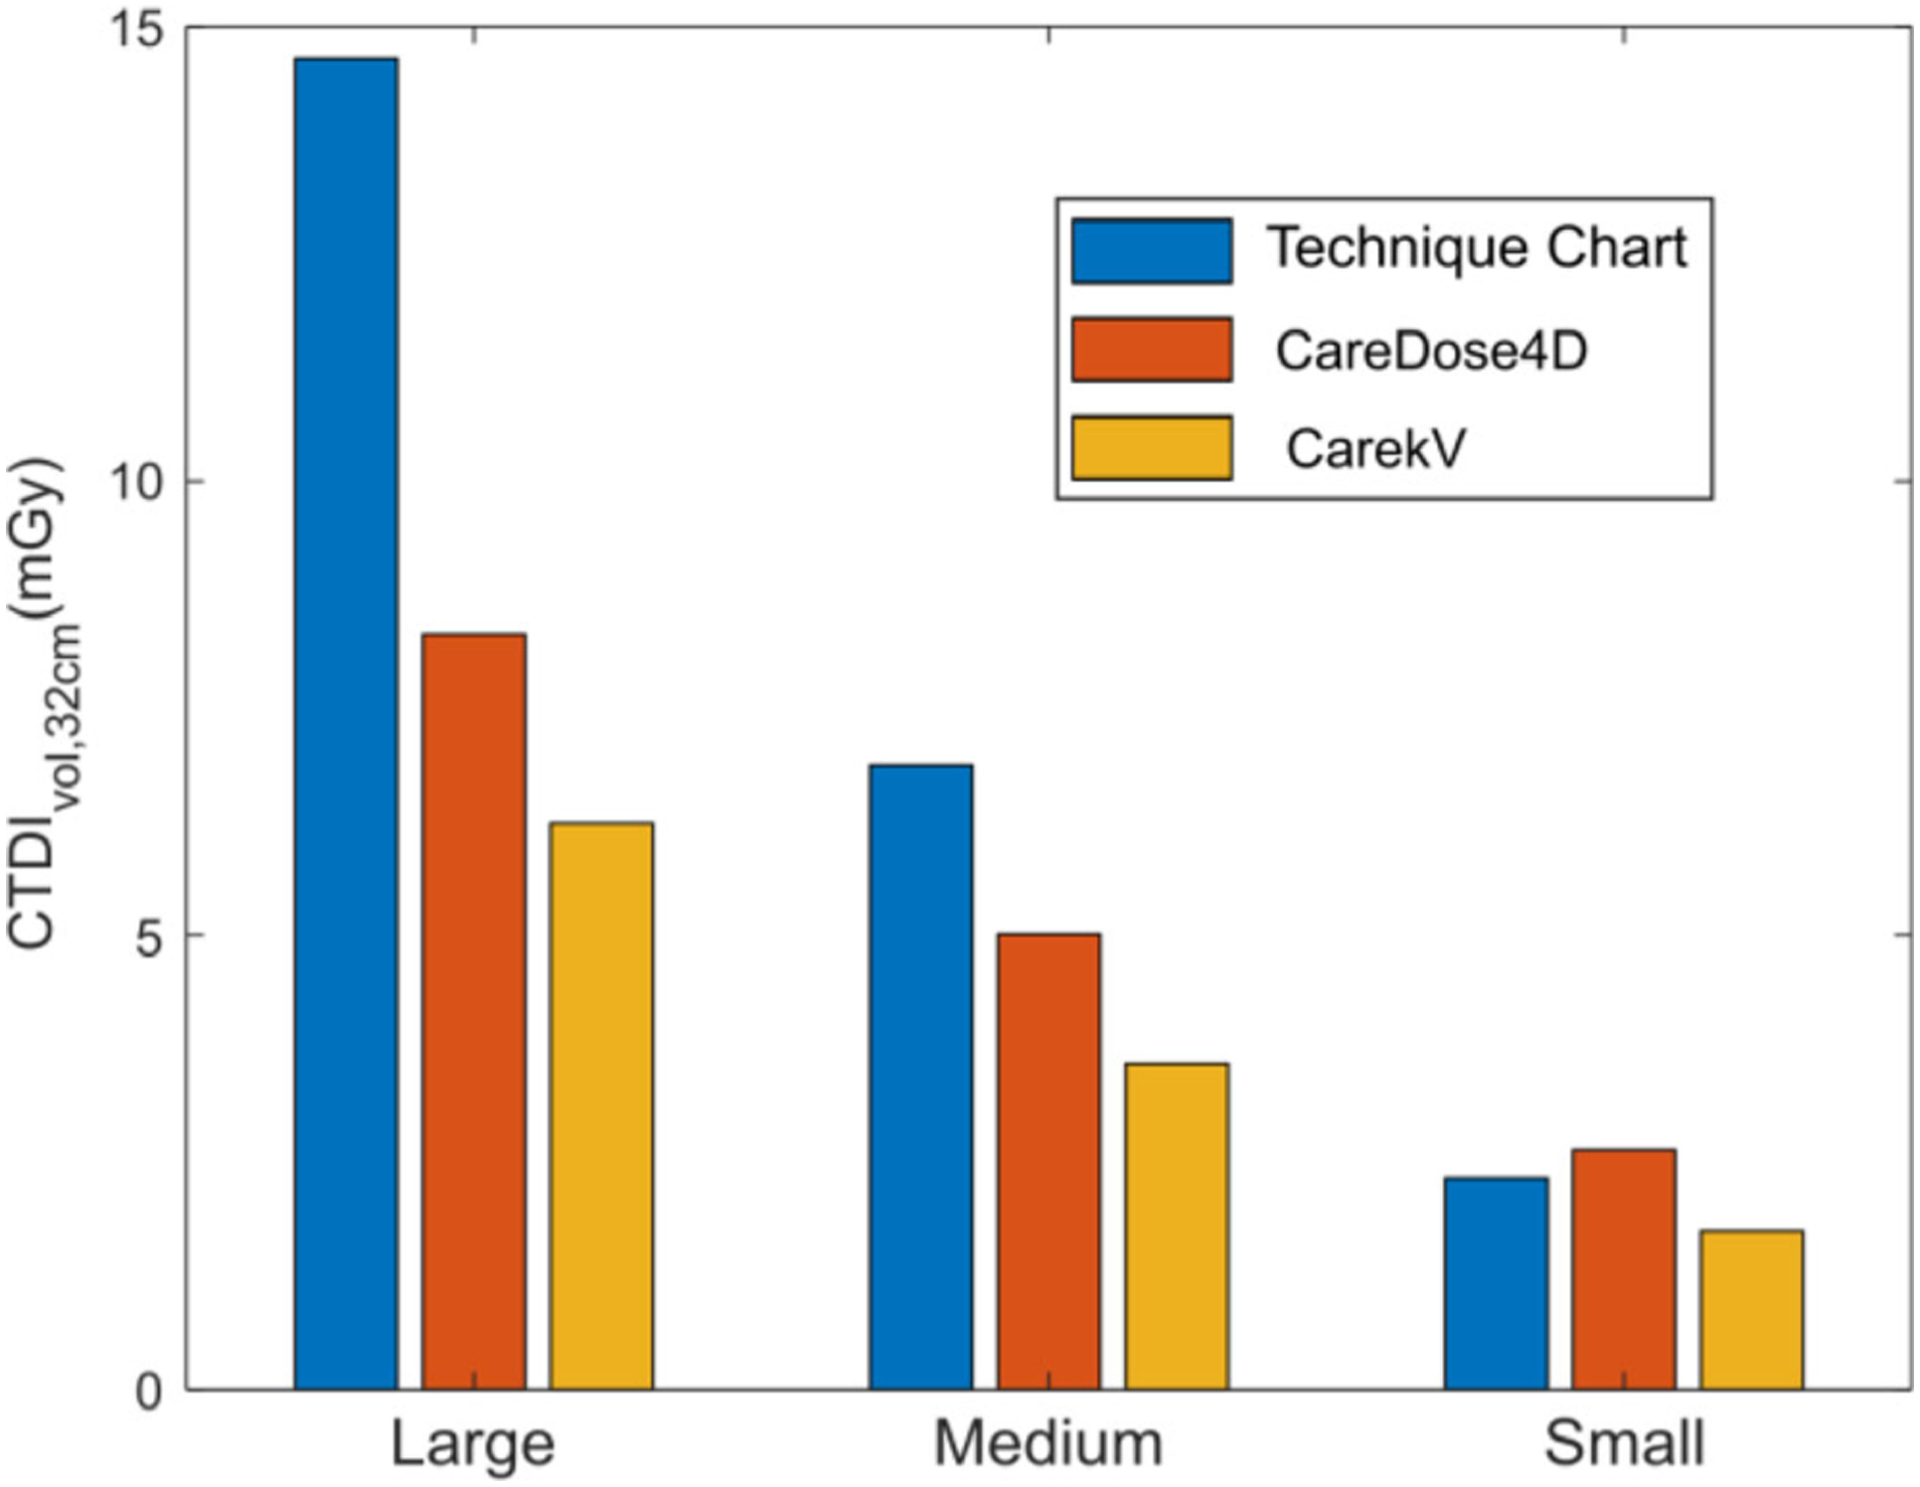
Volume of computed tomography dose index (CTDIvol) for large, medium, and small phantoms comparing the clinical technique chart at 120 kV, the automatic tube current modulation (CareDose, QRM = 150 mAs), and the automatic kV selection (CarekV, QRM = 120 mAs) with QRM values determined from the previous root mean square error analysis.
4. DISCUSSION
In this study, we investigated the accuracy and dose reduction potential of a kV-independent calcium scoring technique available on a state-of-the-art commercial CT system. Calcium score is an important tool in the evaluation of patients’ risk for future cardiac events. Despite being a screening technique, calcium score relies on a fixed tube potential as Agatston score is defined based on fixed CT number thresholds that were established at 120 kV, which limits the use of the automatic tube potential selection technique for radiation dose reduction as widely employed in other CT examinations. The kV-independent calcium scoring technique studied in this work may provide a promising solution to that challenge.
As demonstrated in Fig. 2, the CT numbers of soft tissue and calcium component were preserved using this technique, despite that a tube potential other than 120 kV was used. The CT numbers were consistent for tube potentials ranging from 90 and 140 kV, while a decrease of calcium CT number was observed for a tube potential lower than 90 kV. Nevertheless, with proper configuration (with CarekV setting as “4”), a tube potential higher than 90 kV can be ensured even for the smallest phantom size used in this work. It therefore allows a constant calcium and soft tissue CT number for various object sizes. The preserved calcium and soft tissue CT numbers lead to consistent calcium scores across different tube potentials with relative change <8% for tube potentials from 90 to 140 kV. Accurate calcium scoring at different kVs allows radiation dose reduction through the use of automatic tube potential selection. Our phantom experiment indicated that, compared to the technique chart aiming at maintaining constant image noise for different patient sizes, the use of automatic tube current modulation (i.e., CareDose4D) alone reduced radiation dose by 43% and 27% for large and medium size phantoms, respectively, and maintained a comparable radiation dose for the smallest phantom. The use of automatic kV selection (i.e., CarekV) provided an additional dose reduction of 25% to 34% (Fig. 7) without affecting calcium scores when compared to the case with automatic tube current modulation alone. Note that the CarekV function requires CareDose4D to be enabled, and therefore it is always applied together with CareDose4D.
In this study, meat steak was used to emulate cardiac tissue in lieu of other commercially available CT phantom materials, for example, the phantom insert produced by the same company of the chest phantom (QRM GmbH). Based on our experience, that phantom insert does demonstrate a kV-dependent CT number with maximal difference of 18 HU across difference kVs. This is different from the behavior of real soft tissue, which showed a consistent CT number across different kVs, as seen in Fig. 2. Due to different atomic composition, the CT number of a certain phantom material may not accurately represent the intrinsic property of real soft tissue under different x-ray spectra (i.e., for different tube potentials). This difference in CT number can cause bias in calcium score calculation. We therefore chose to use meat steak as a more realistic soft tissue model. The calcium score encountered in clinical cases can range from absence (0), mild (<99), moderate (100 to 400), to severe (>400),14 while the phantom used in our study covered from mild (60) to moderate (200) and moderate-to-severe (300) ranges. Therefore the phantoms we used were representative of the calcium score encountered in practice.
In our experiment setup, the HA cylinders were inserted randomly into the meat steak. However, the locations of inserts should not affect the results of the kV-independent reconstruction, as the beam hardening correction step integrated with this technique can account for the cross talk between different calcium inserts. Since beam hardening correction is performed in the projection domain on a ray-by-ray basis, having single or multiple inserts within the same axial plane would not cause major difference. To demonstrate this point, consider the case in which multiple calcium inserts are present at the same z location. For each individual ray, there could be two possible scenarios: (a) x-ray passes through one single insert (no overlap), or (b) x-ray passes through multiple inserts (with overlap). The first scenario is the same as having one single insert in the axial plane. The second scenario can also be considered as having a single insert but with attenuation equal to the sum of the attenuations from multiple inserts located within the x-ray path. Therefore, it is also equivalent to having a single insert from a beam hardening correction perspective. Consequently, we do not expect major difference between the cases with single or multiple inserts in the same axial slice.
Recently, an independent phantom study was also performed to evaluate this kV-independent calcium scoring technique.15 Compared to the phantom used in that work, the experiment setup in our study allowed us to evaluate the effect of different tube potentials on the CT number of true soft tissue, and to resolve the bias in calcium score due to the different x-ray attenuation of artificial soft tissue phantom material compared to real soft tissue, as mentioned above. Additionally, in our study, we further evaluated the dose reduction potential of this technique by gradually lowering the QRM in the CarekV setting. With this experiment, we were able to demonstrate the capability of this technique in reducing radiation dose while still yielding accurate calcium score. We believe these results are valuable reference for medical physicists and radiologists when implementing this technique in clinical practice.
The images analyzed in this study were reconstructed using the conventional filtered back projection reconstruction technique. It is widely accepted that iterative image reconstruction can potentially improve image quality by reducing image noise and may further reduce radiation dose.16–19 However, it has been demonstrated that the use of iterative image reconstruction may affect calcium score.20–24 In this study, iterative reconstruction was not used in order to assess the potential of the kV-independent calcium scoring technique in radiation dose reduction, without bringing in other confounding factors. Further study is required to investigate the effect of iterative reconstruction on calcium score and radiation dose reduction. Note that iterative reconstruction and the use of automatic tube potential selection are two independent dose reduction techniques. They can play complementary roles and can potentially be implemented together to further reduce radiation dose.
One limitation of this study is that it was performed with static phantoms while motion may exist in patient calcium scoring examinations. ECG gating is typically used in the calcium score examinations to minimize motion. However, by performing a phantom study without ECG gating and patient motion, we were able to observe the effect of this technique alone, without bringing in the other confounding factors like cardiac motion or arrhythmia. We believe this is the strength of this work since we are able to rule out the effect of other factors and only focus on the performance of this technique itself. In addition, the impact of motion is essentially the same for 120 kV or other tube potentials and the kV-independent technique is applied to the projection data before reconstruction. Therefore, it is expected that the results shown in static phantoms can be readily extended to clinical examinations with motion. Recently, an independent study was conducted in which a group of patients who were scanned twice, one with 120 kV and the other using the kV-independent technique,25 and its results showed agreement of calcium scores between the two scans. Results from that work were consistent with our phantom study and the two studies provide complimentary information to each other. Note that another strength of our study is that phantom scans were performed at multiple dose levels to determine the lowest radiation dose without sacrificing CT number accuracy and calcium score accuracy, which is challenging for patient studies.
The presented technique is intended for calcium Agatston scoring which is therefore the focus in this work. In literature, other strategies have also been proposed to assess the amount of coronary calcification in lieu of Agatston score, such as coronary calcium volume26,27 and mass scores.28 Various studies have demonstrated that these alternatives might be more robust against interscan and inter system variations compared to Agatston score7,10,29–32 and may not be subject to the same tube potential constraint, therefore allowing automatic tube potential selection to be used.5 However, given the simplicity of the Agatston score and the absence of a well-established database based on these alternative techniques, calcium Agatston score remains the most widely used calcium scoring technique for risk assessment in the clinic.7,33
5. CONCLUSION
In this work, we investigated a kV-independent calcium scoring technique for its score accuracy and potential in radiation dose reduction based on phantom experiments. It was demonstrated that this technique, when coupled with automatic tube current modulation and kV selection, yielded a 25–34% reduction in CTDIvol compared to tube current modulation alone, while providing consistent calcium scores. Consequently, this technique may benefit patients by reducing radiation dose while maintaining accurate calcium scores.
ACKNOWLEDGMENT
The authors thank Desiree J. Lanzino, PT, PhD, for her help in editing the manuscript.
Footnotes
CONFLICT OF INTERESTS
Dr. Cynthia H McCollough is the recipient of a research grant from Siemens Healthineers. The other authors have no conflict to disclose.
This work was presented at 2019 RSNA Annual Meeting, Chicago, IL.
Contributor Information
Shengzhen Tao, Department of Radiology, Mayo Clinic, Jacksonville, FL, USA.
Ahmed Halaweish, Siemens Healthineers, 40 Liberty Blvd., Malvern, PA, USA.
Bernhard Schmidt, Siemens Healthineers, Siemensstraße 1, Forchheim 91301, Germany.
REFERENCES
- 1.Agatston AS, Janowitz WR, Hildner FJ, Zusmer NR, Viamonte M, Detrano R. Quantification of coronary-artery calcium using ultrafast computed-tomography. J Am Coll Cardiol. 1990;15:827–832. [DOI] [PubMed] [Google Scholar]
- 2.Hecht HS, Budoff MJ, Berman DS, Ehrlich J, Rumberger JA. Coronary artery calcium scanning: clinical paradigms for cardiac risk assessment and treatment. Am Heart J. 2006;151:1139–1146. [DOI] [PubMed] [Google Scholar]
- 3.Oudkerk M, Stillman AE, Halliburton SS, et al. Coronary artery calcium screening: current status and recommendations from the European Society of Cardiac Radiology and North American Society for Cardiovascular Imaging. Intl J Cardiovasc Imaging. 2008;24:645–671. [DOI] [PMC free article] [PubMed] [Google Scholar]
- 4.Polonsky TS, McClelland RL, Jorgensen NW, et al. Coronary artery calcium score and risk classification for coronary heart disease prediction. Jama-J Am Med Assoc. 2010;303:1610–1616. [DOI] [PMC free article] [PubMed] [Google Scholar]
- 5.Alluri K, Joshi PH, Henry TS, Blumenthal RS, Nasir K, Blaha MJ. Scoring of coronary artery calcium scans: history, assumptions, current limitations, and future directions. Atherosclerosis. 2015;239:109–117. [DOI] [PubMed] [Google Scholar]
- 6.Marwan M, Mettin C, Pflederer T, et al. Very low-dose coronary artery calcium scanning with high-pitch spiral acquisition mode: comparison between 120-kV and 100-kV tube voltage protocols. J Cardiovasc Comput. 2013;7:32–38. [DOI] [PubMed] [Google Scholar]
- 7.Willemink MJ, van der Werf NR, Nieman K, Greuter MJW, Koweek LM, Fleischmann D. Coronary artery calcium: a technical argument for a new scoring method. J Cardiovasc Comput. 2019;13:347–352. [DOI] [PubMed] [Google Scholar]
- 8.Lee KH, Lee JM, Moon SK, et al. Attenuation-based automatic tube voltage selection and tube current modulation for dose reduction at contrast-enhanced liver CT. Radiology. 2012;265:437–447. [DOI] [PubMed] [Google Scholar]
- 9.Mayer C, Meyer M, Fink C, et al. Potential for radiation dose savings in abdominal and chest CT using automatic tube voltage selection in combination with automatic tube current modulation. Am J Roentgenol. 2014;203:292–299. [DOI] [PubMed] [Google Scholar]
- 10.Allmendinger T, Hamann A. Agatston score: Calcium quantification with arbitrary tube voltage; 2018. Available via https://www.siemens-healthineers.com/computed-tomography/clinical-imaging-solutions/cardiovascular-imaging#CLINICAL_USE
- 11.McCollough CH, Ulzheimer S, Halliburton SS, Shanneik K, White RD, Kalender WA. Coronary artery calcium: a multi-institutional, multimanufacturer international standard for quantification at cardiac CT. Radiology. 2007;243:527–538. [DOI] [PubMed] [Google Scholar]
- 12.Wang S, Detrano RC, Secci A, et al. Detection of coronary calcification with electron-beam computed tomography: evaluation of interexamination reproducibility and comparison of three image-acquisition protocols. Am Heart J. 1996;132:550–558. [DOI] [PubMed] [Google Scholar]
- 13.Yoon HC, Goldin JG, Greaser LE, Sayre J, Fonarow GC. Interscan variation in coronary artery calcium quantification in a large asymptomatic patient population. Am J Roentgenol. 2000;174:803–809. [DOI] [PubMed] [Google Scholar]
- 14.Yoon HC, Greaser LE, Mather R, Sinha S, McNitt-Gray MF, Goldin JG. Coronary artery calcium: alternate methods for accurate and reproducible quantitation. Acad Radiol. 1997;4:666–673. [DOI] [PubMed] [Google Scholar]
- 15.Paolo Raggi, Callister Tracy Q, Cooil Bruce, He Zuo-Xiang, Lippolis Nicholas J, Russo Donald J, Zelinger Alan, Mahmarian John J. Identification of patients at increased risk of first unheralded acute myocardial infarction by electron-beam computed tomography. Circulation. 2000;101:850–855. [DOI] [PubMed] [Google Scholar]
- 16.Booij R, van der Werf NR, Budde RPJ, Bos D, van Straten M. Dose reduction for CT coronary calcium scoring with a calcium-aware image reconstruction technique: a phantom study. Eur Radiol. 2020;30:3346–3355. [DOI] [PMC free article] [PubMed] [Google Scholar]
- 17.Cho YJ, Schoepf UJ, Silverman JR, et al. Iterative image reconstruction techniques cardiothoracic computed tomography applications. J Thorac Imag. 2014;29:198–208. [DOI] [PubMed] [Google Scholar]
- 18.Fareed A, Vavere AL, Zimmermann E, et al. Impact of iterative reconstruction vs. filtered back projection on image quality in 320-slice CT coronary angiography. Medicine. 2017;96:e8452. [DOI] [PMC free article] [PubMed] [Google Scholar]
- 19.Geyer LL, Schoepf UJ, Meinel FG, et al. State of the art: iterative CT reconstruction techniques. Radiology. 2015;276:338–356. [DOI] [PubMed] [Google Scholar]
- 20.Padole A, Khawaja RDA, Kalra MK, Singh S. CT radiation dose and iterative reconstruction techniques. Am J Roentgenol. 2015;204:W384–W387. [DOI] [PubMed] [Google Scholar]
- 21.Gebhard C, Fiechter M, Fuchs TA, et al. Coronary artery calcium scoring: influence of adaptive statistical iterative reconstruction using 64-MDCT. Int J Cardiol. 2013;167:2932–2937. [DOI] [PubMed] [Google Scholar]
- 22.Kurata A, Dharampal A, Dedic A, et al. Impact of iterative reconstruction on CT coronary calcium quantification. Eur Radiol. 2013;23:3246–3252. [DOI] [PubMed] [Google Scholar]
- 23.van der Werf NR, Willemink MJ, Willems TP, Greuter MJW, Leiner T. Influence of iterative reconstruction on coronary calcium scores at multiple heart rates: a multivendor phantom study on state-of-the-art CT systems. Int J Cardiovas Imag. 2018;34:947–957. [DOI] [PubMed] [Google Scholar]
- 24.van Osch JAC, Mouden M, van Dalen JA, et al. Influence of iterative image reconstruction on CT-based calcium score measurements. Int J Cardiovas Imag. 2014;30:961–967. [DOI] [PubMed] [Google Scholar]
- 25.Willemink MJ, Takx RAP, de Jong PA, et al. The impact of CT radiation dose reduction and iterative reconstruction algorithms from four different vendors on coronary calcium scoring. Eur Radiol. 2014;24:2201–2212. [DOI] [PubMed] [Google Scholar]
- 26.Vingiani V, Abadia AF, Schoepf UJ, et al. Individualized coronary calcium scoring at any tube voltage using a kV-independent reconstruction algorithm. Eur Radiol. 2020;30:5834–5840. [DOI] [PubMed] [Google Scholar]
- 27.Callister TQ, Cooil B, Raya SP, Lippolis NJ, Russo DJ, Raggi P. Coronary artery disease: Improved reproducibility of calcium scoring with an electron-beam CT volumetric method. Radiology. 1998;208:807–814. [DOI] [PubMed] [Google Scholar]
- 28.Callister TQ, Raggi P, Cooil B, Lippolis NJ, Russo DJ. Effect of HMG-CoA reductase inhibitors on coronary artery disease as assessed by electron-beam computed tomography. New Engl J Med. 1998;339: 1972–1978. [DOI] [PubMed] [Google Scholar]
- 29.Hong C, Bae KT, Pilgram TK. Coronary artery calcium: accuracy and reproducibility of measurements with multi-detector row CT - assessment of effects of different thresholds and quantification methods. Radiology. 2003;227:795–801. [DOI] [PubMed] [Google Scholar]
- 30.Groen JM, Greuter MJ, Schmidt B, Suess C, Vliegenthart R, Oudkerk M. The influence of heart rate, slice thickness, and calcification density on calcium scores using 64-slice multidetector computed tomography - a systematic phantom study. Invest Radiol. 2007;42:848–855. [DOI] [PubMed] [Google Scholar]
- 31.Hoffmann U, Siebert U, Bull-Stewart A, et al. Evidence for lower variability of coronary artery calcium mineral mass measurements by multi-detector computed tomography in a community-based cohort - consequences for progression studies. Eur J Radiol. 2006;57:396–402. [DOI] [PubMed] [Google Scholar]
- 32.Rutten A, Isgum I, Prokop M. Coronary calcification: effect of small variation of scan starting position on Agatston, volume, and mass scores. Radiology. 2008;246:90–98. [DOI] [PubMed] [Google Scholar]
- 33.van Ooijen PMA, Vliegenthart R, Witteman JCM, Oudkerk M. Influence of scoring parameter settings on Agatston and volume scores for coronary calcification. Eur Radiol. 2005;15:102–110. [DOI] [PubMed] [Google Scholar]
- 34.Blaha MJ, Mortensen MB, Kianoush S, Tota-Maharaj R, Cainzos-Achirica M. Coronary artery calcium scoring is it time for a change in methodology? Jacc-Cardiovasc Imag. 2017;10:924–937. [DOI] [PubMed] [Google Scholar]