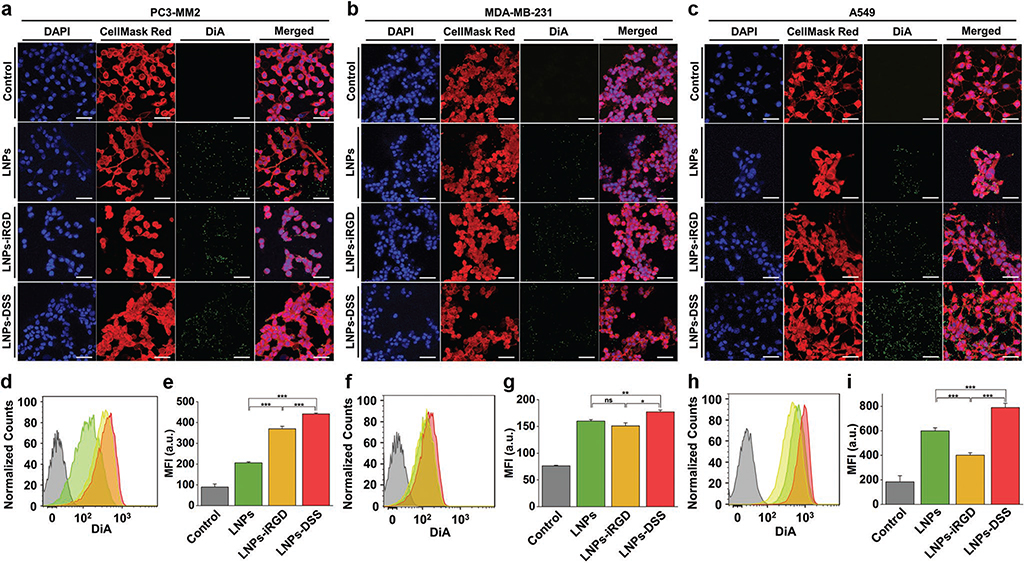
Figure 5.
In vitro cellular interaction studies using a 2D cell culture model: Confocal fluorescence microscopy images of a) PC3-MM2, b) MDA-MB-231, and c) A549 cell lines, after incubation with 100 μg mL−1 of bare and peptide-functionalized DiA@LNPs for 3 h at 37 °C. DAPI (blue), DiA (green), and CellMask Red (red) were used to stain the nucleus, the LNPs, and the cell membrane, respectively. The merged panels show the association of the LNPs with the cell membrane. Scale bars are 50 μm. Quantitative cellular uptake by flow cytometry, after incubation of 100 μg mL−1 of LNPs with d) PC3-MM2, f) MDA-MB-231, and h) A549, for 3 h at 37 °C in which the LNPs (green) LNPs-iRGD (yellow), and LNPs-DSS (red) were compared to the untreated control (gray). MFI quantification for e) PC3-MM2, g) MDA-MB-231, and i) A549 before and after treatment with the DiA@LNPs. At least 10 000 events were collected for each measurement. The error bars represent mean ± s.d. (n = 3). Statistical significance was set at probabilities of *p < 0.05, **p < 0.01, and ***p < 0.001, and ns is nonsignificant.

