Abstract
Background
The aim of the study was to assess whether the configuration of primary soft-tissue sarcoma (STS) on MRI correlates with the grade of malignancy.
Patients and methods
71 patients with histologically proven STS were included. Primary STS were examined for configuration, borders, and volume on MRI. The tumors were divided into high-grade (G3), intermediate-grade (G2) and low-grade (G1) STS according to the grading system of the French Federation of Cancer Centers Sarcoma Group (FNCLCC).
Results
30 high-grade, 22 intermediate-grade and 19 low-grade primary STS lesions were identified. High- and intermediate-grade (G3/2) STS significantly most often appeared as polycyclic/multilobulated tumors (p < 0.001 and p = 0.002, respectively). Low-grade (G1) STS mainly showed an ovoid/nodular or streaky configuration (p = 0.008), and well-defined borders. The appearance of high-, intermediate- and low-grade STS with an ovoid/nodular configuration were mainly the same on MRI. All streaky G3/2 sarcoma and 17 of 20 patients with polycyclic/multilobulated G3 sarcoma showed infiltrative borders. High-grade streaky and polycyclic/multilobulated STS are larger in volume, compared to intermediate- and low-grade STS.
Conclusions
Configuration of STS on MRI can indicate the grade of malignancy. Higher-grade (G2/3) STS most often show a polycyclic/multilobulated configuration, while low-grade STS are mainly ovoid/nodular or streaky. Infiltrative behavior might suggest higher-grade STS in streaky and polycyclic/multilobulated STS.
Key words: soft-tissue sarcoma, MRI, configuration, FNCLCC, malignancy, prediction
Introduction
Soft-tissue sarcomas (STS) comprise a heterogeneous group of malignancies, accounting for only about 1% of all cancers.1 More than 50 histologic subtypes of STS have been identified, with pleomorphic sarcoma, liposarcoma, leiomyosarcoma, synovial sarcoma, and malignant peripheral nerve sheath tumors being the most common.2,3 STS mostly originate in the extremities but can occur at any site in the body.3 Different risk factors for the development of STS have been reported, for example, radiation therapy and radiation-induced sarcoma.4,5 While sonography is still sometimes used for screening of STS6, MRI has become the most important imaging modality these days for pre- and post-operative evaluation of STS, as it can evaluate tumoral characteristics and extent of disease very well.3,7,8,9 The two most common systems for grading STS are those of the French Federation of Cancer Centers Sarcoma Group (FNCLCC) and the National Cancer Institute in the U.S. Of the two, the FNCLCC system is superior in predicting distant metastasis and tumor mortality.2,10 According to this system, STS are divided into three grades of malignancy: G1 (low-grade), G2 (intermediate-grade), and G3 (high-grade). Knowledge of the STS grade is very relevant because it influences the therapy options and helps determine which treatment should be implemented.11,12 Furthermore, the STS grade is reported to be a valuable predictor of STS recurrence and of the benefit of adjuvant chemotherapy.13 A relatively new morphological aspect on MRI is to characterize STS by their configurations.14,15 Therefore, the purpose of this study was to determine whether the grade of malignancy can be predicted by the configuration of primary STS on MRI and whether low-, intermediate and high-grade STS can be distinguished by tumor configuration on MRI.
Patients and methods
Patients
Altogether 163 patients with STS were identified in whom pre- and/or post-therapeutic imaging had been performed between 2008 and 2020. Patients with other examination than MRI were excluded (n = 21), as were patients with lack of pre-therapeutic MRI (n = 42) and patients with lipo-, angio- and retroperitoneal sarcomas (n = 29). Finally, 71 primary STS were included in this study. Information on the histological subtypes of STS were deliberately not included in our study in order to prevent any assessments of the degree of malignancy by knowing the subtype. However, histological STS grades were derived from all available pathological reports and all included STS were classified by their grade of malignancy. Consecutively, primary STS were divided into three groups according to the FNCLCC grading system: G1 (low-grade), G2 (intermediate) and G3 (high-grade). G3 and G2 sarcoma were both regarded as higher-grade tumors. Nevertheless, the two grades were examined separately.
Imaging
The configuration of the tumors was divided into polycyclic/multilobulated, fascicular, ovoid/nodular, streaky, and fusiform. Furthermore, the tumors were examined for contrast enhancement (homogeneous or heterogeneous), borders (infiltrative or well-defined), and volume on MRI. The volume was measured from length, width, and height.
For imaging, a 1.5-Tesla MRI system (MAGNETOM Symphony, Siemens Healthineers) was employed. The MRI protocol included the following sequences: axial T2-weighted (TE: 64– 114ms, TR: 3010–5840ms, FOV: 22–44 cm2), axial T1-weighted (TE: 10–14 ms, TR: 587–868 ms, FOV: 22–44 cm2), axial proton density-weighted (PDw) (TE: 26–36ms, TR: 2740–4610ms, FOV: 22–40 cm2), coronal Turbo-Inversion Recovery Magnitude (TIRM) (TE: 68–77ms, TR: 4410–6980 ms, FOV: 37–45 cm2), axial (10–12 ms, TR: 645–865ms, FOV: 22–44 cm2), coronal (TE: 10 13ms, TR: 533–1440ms, FOV: 37–45 cm2), and sagittal (TE: 10–13ms, TR: 577–866ms, FOV: 22–37 cm2) T1-weighted after administering a contrast agent intravenously. Additionally, in some recent examinations diffusion-weighted-images (DWI) were available.
Two musculoskeletal radiologists, with a minimum of five years of experience in diagnosing sarcoma reviewed each MRI, with findings reached by consensus.
Statistical data
Data are given as median values with range (minimum to maximum) or mean and standard deviation (SD). Parametric and nonparametric tests to compare group values (χ2-test, Mann-Whitney U-test, ANOVA) were performed as indicated. Statistical significance for all tests was set at a level of p < 0.05. Statistical analysis was done using the IBM-SPSS version 22.0 software package (IBM, Armonk, NY, USA).
Ethics approval
The study was conducted in accordance with and was approved by the responsible IRB/Ethics Committee.
Results
Patient’s mean age was 55.7 years (SD: 18.2, Min.: 10, Max.: 88). In all, 71 primary STS were included, and 30 high-grade, 22 intermediate-grade and 19 low-grade primary STS lesions were identified (Table 1). Primary STS significantly most often occurred in the extremities (p < 0.001), while the thigh represented the predominant localization of STS (Figure 1). Most of the high-grade (G3) and intermediate-grade (G2) primary STS showed a polycyclic/multilobulated configuration (p < 0.001 and p = 0.002, respectively; Table 1; Figure 2 and 3), while low-grade primary STS (G1) were mostly ovoid/ nodular (Figure 4 and 5) or streaky (Figure 6; p = 0.008). G3 polycyclic/multilobulated STS were significantly more often infiltrative, compared to G2 polycyclic/multilobulated STS (p = 0.014). For ovoid/nodular primary STS, no significant difference was observed between high-, intermediate and low-grade STS regarding contrast enhancement and borders. Streaky G3 and G2 sarcoma were all infiltrative, while streaky G1 sarcoma mostly showed well-defined borders. High-grade streaky and polycyclic/multilobulated STS are larger (not significant) in volume, compared to intermediate- and low-grade STS.
Table 1.
Overview of configuration of high-grade (G3), intermediate-grade (G2) and low-grade (G1) soft-tissue sarcomas (STS). Additional information on tumor infiltration (infiltrative or well-defined), contrast enhancement (homogeneous or heterogeneous), and volume in “cm3” is shown
| Configuration of STS | G3 (number, contrast enhancement, infiltration) | Volume G3 (cm3) | G2 (number, contrast enhancement, infiltration) | Volume G2 (cm3) | G1 (number, contrast enhancement, infiltration) | Volume G1 (cm3) |
| Polycyclic/ multilobulated | 20* 19 heterogeneous 17 infiltrative | Median: 765.9**** (Min. 15.6, Max. 4572.5, SD: 1176.5) | 13** 11 heterogeneous 7 well-defined | Median: 114.8 (Min. 6, Max. 334, SD: 94.6) | 3 all homogeneous all well-defined | Median: 198.1 (Min. 15.8, Max. 447.2, SD: 223.3) |
| Fascicular | 1 | - | 2 | - | ||
| Ovoid/nodular | 4 all homogeneous 3 well-defined | Median: 9 (Min. 3.3, Max. 20.3, SD: 9.8) | 5 all homogeneous all well-defined | Median: 26.5 (Min. 2.6, Max. 41.4, SD: 17.7) | 8*** all homogeneous all well-defined | Median: 11.2 (Min. 1.6, Max. 25.4, SD: 7.7) |
| Streaky | 4 all homogeneous all infiltrative | Median: 49.4 (Min. 5.6, Max. 130.9, SD: 70.7) | 2 all homogeneous all infiltrative | Median 7.9 (Min. 7.1, Max. 8.6, SD: 1.1) | 5*** all homogeneous 4 well-defined | Median: 4.4 (Min. 2.6, Max. 6.5, SD: 1.4) |
| Fusiform | 1 | - | 2 | 1 | - | |
| Total | 30 | 22 | 19 |
p-values are marked with “*”; †soft tissue sarcoma; *p<0.001, **p=0.002, ***p=0.008, ****p=0.051
Figure 1.
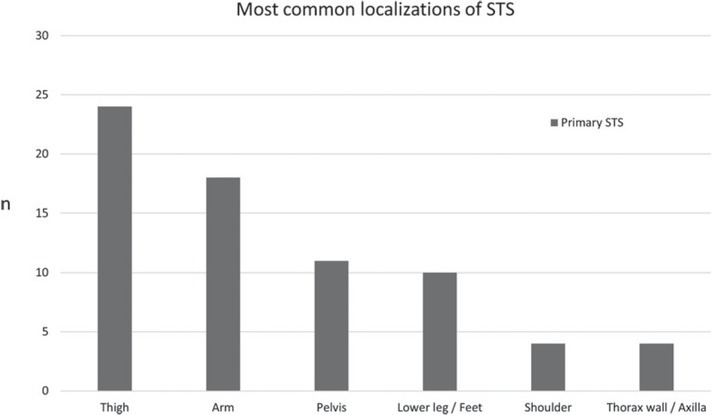
Overview of most common localizations of primary soft-tissue sarcoma (STS), shown as number of cases “n”.
Figure 2.
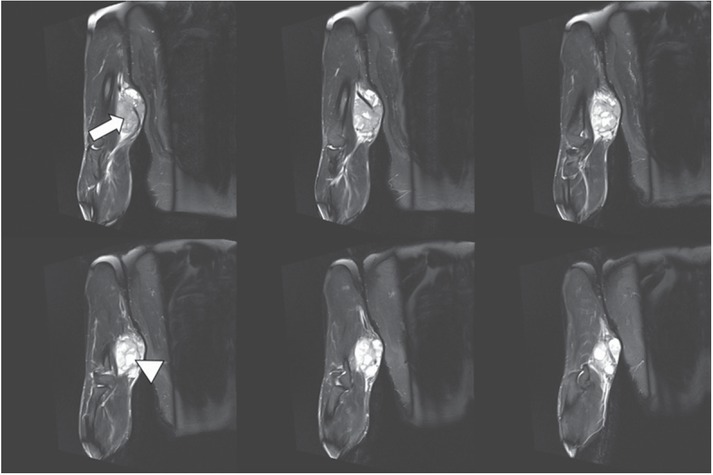
1.5-T MRI of the arm (proton density [PD] fat saturation [FS]: 6 consecutive slices of 3 mm) of a 54-year-old patient. The higher-grade polycyclic/multilobulated sarcoma in the upper arms shows solid (white arrow) and cystic (white arrowhead) components.
Figure 3.

1.5-T MRI of the pelvis (A) proton density [PD] axial, (B) contrast-enhanced T1 fat saturation [FS] axial, (C) PD sagittal) of a 49-year-old patient. The higher-grade polycyclic/multilobulated sarcoma in the right pelvis (white arrow) shows heterogeneous contrast enhancement (black arrow), infiltrative behavior (black arrowhead), and solid components within cystic tissue (white arrowhead).
Figure 4.
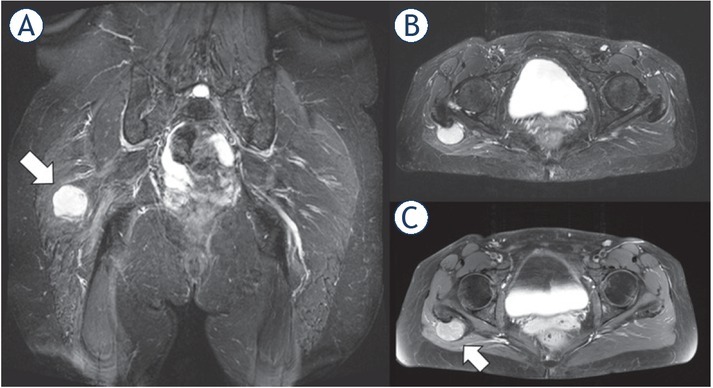
1.5-T MRI of the pelvis (A) proton density [PD] fat saturation [FS]: coronal, (B) PD FS axial, (C) contrast-enhanced T1 FS axial) of a 51-year-old patient. The low-grade sarcoma in the right gluteal region (white arrow) shows an ovoid/nodular configuration and well-defined borders.
Figure 5.
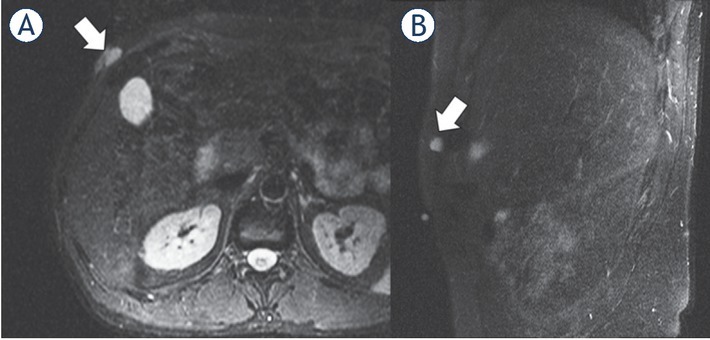
1.5-T MRI of the abdomen (A) contrast-enhanced T1 axial, (B) contrast-enhanced T1 sagittal) of a 41-year-old patient. The low-grade sarcoma in the right abdominal wall (white arrow) presents with a ovoid/nodular configuration.
Figure 6.
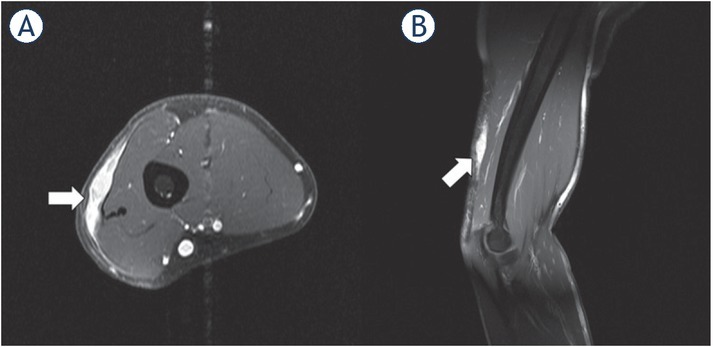
1.5-T MRI of the upper arm (A) contrast-enhanced T1 axial, (B) contrast-enhanced T1 sagittal) of a 48-year-old patient. The higher-grade sarcoma in the subcutaneous tissue (white arrow) has a streaky configuration and shows slight infiltration of the surrounding subcutaneous tissue.
Discussion
In this study we wanted to assess whether low, intermediate and high-grade STS can be distinguished by tumor configuration on MRI and whether one or the other configuration might already suggest the grade of malignancy. STS comprise a group of rare malignancies of the soft tissue that may occur anywhere in the body1 but mainly develop in the extremities and especially in adults.16,17 In our study the most prominent site of primary STS is the extremities, where STS mainly occurred in the thigh, followed by the arm. The FNCLCC uses a scoring system to grade STS. Accordingly, this scoring system includes information on tumor differentiation, mitotic count, and tumor necrosis and then classifies STS into three grades: G1 (low-grade), G2 (intermediate) and G3 (high-grade).18,19 As the distinction between G2 and G3 STS is not always clear in the routine clinical setting, both sarcoma grades are often considered as “higher-grade”. The grade of STS is a highly valuable parameter for assessing therapy. In patients with higher-grade STS, neoadjuvant chemotherapy is often considered, while it is not administered for low-grade STS.20 In contrast, surgery alone is often selected as the first therapeutic option in low-grade STS.18,21 As a standard diagnostic procedure, needle biopsy is performed before initiating treatment.22 However, percutaneous biopsy sometimes misses the grade of STS, which in turn can be represent a missed opportunity for neoadjuvant chemotherapy or radiation therapy.18 This shows the importance of imaging in the diagnostic workup and for STS grading, especially by using MRI.23
MRI represents a valuable imaging modality in pre- and postoperative screening of STS, the advantages of which lie in the absence of ionizing radiation and its relatively high contrast resolution compared to PET-CT or CT.18 Only few previous studies have investigated the issue of distinguishing between low-, intermediate- and high-grade STS by tumor characteristics on MRI. However, there have been reports of a correlation between tumor margins or contrast enhancement with the STS grade, for example.24 In the literature, MRI signal characteristics of low- and high-grade STS were also examined; however, they lacked specific descriptions of the imaging and signal characteristics of most STS.25,26 Additionally, MRI signal characteristics of STS are often misleading.27 Therefore, we did not focus on the signal characteristics of STS in this study. Notably, no previous investigations have focused on the configuration of low- and higher-grade STS on MRI for grading STS. Our data suggest that by focusing on the configuration of STS it is possible to distinguish between G1 and G2/3 STS, especially when they show a polycyclic configuration. It becomes more difficult with other configurations, such as ovoid/nodular or streaky. Primary STS with an ovoid/nodular configuration usually shows the same appearance in low-, intermediate and high-grade STS.
Previous authors mainly associated higher-grade STS to an infiltration of the tumor-surrounding tissue. Our findings show that higher-grade STS may show well-defined borders as well, especially in ovoid/nodular STS.20,28 In the case of streaky STS, infiltration of the surrounding tissue can be used as a characteristic for differentiating between G3/2 and G1 STS, as all higher-grade STS show infiltrative borders, while the borders of low-grade STS are mostly well-defined. Furthermore, our data shows that in polycyclic/multilobulated STS the proportion of infiltrative sarcomas increases with the grade of malignancy (G1 to G3). While in G1 polycyclic/multilobulated STS all tumors are well-defined, G3 sarcomas with the same configuration are mainly infiltrative.
For the evaluation of STS, contrast material is routinely administered.24 In our study contrast-enhanced MRI was performed in all patients as well. As radiologists have been aiming to restrict the use of contrast media for some time, especially due to reported adverse events after gadolinium-based contrast agent administration29, the question arises as to whether a contrast medium is needed for the diagnosis of STS. As mentioned, it is possible to distinguish between higher- and low-grade STS on MRI, especially when they show a polycyclic/multilobulated configuration. In these cases, the use of a contrast agent is questionable and this issue should be investigated in further studies.
Contrary to previous data, the size of STS cannot determine the grade of STS, as in our study no significant differences in the volumes of higher- and low-grade STS were found, even if polycyclic/multilobulated G3 STS show a not significant larger volume, compared to G2/1 sarcoma.30,31
We cannot guarantee that a polycyclic/multilobulated configuration will always verify a higher-grade STS, but we were able to show that the configuration of STS can give an indication of STS grade, which ultimately leads to more targeted diagnostic tests and earlier therapy. Our study has some limitations. The main limitations are the retrospective design and the single-center approach. As STS is a rare tumor, the inclusion of almost similar numbers of patients in a prospective study would take a long time. In addition, the benefit would be disproportionate to the additional time that would be spent. A multicenter study approach could improve this study, as the comparison of non-polycyclic/-multilobulated STS configurations could be better investigated. Therefore, further studies on this topic should be multicenter in design. Another limitation of this study is the lack of diffusion weighted images (DWI), which were only available in a few and mainly recent examinations.
Conclusions
Configuration of STS on MRI can indicate the grade of malignancy, as higher-grade (G2/3) STS significantly most often show a polycyclic/multilobulated configuration, while low-grade STS (G1) are mainly ovoid/nodular or streaky. Furthermore, infiltrative behavior might suggest higher-grade STS in streaky and polycyclic/multilobulated STS. For ovoid/nodular configurations, high-, intermediate and low-grade STS cannot be distinguished on MRI.
Disclosure
No potential conflicts of interest were disclosed.
References
- 1.Clark MA, Fisher C, Judson I, Thomas JM. Soft-tissue sarcomas in adults. N Engl J Med. 2005;353:701–11. doi: 10.1056/NEJMra041866. [DOI] [PubMed] [Google Scholar]
- 2.Demetri GD, Antonia S, Benjamin RS, Bui MM, Casper ES, Conrad EU. Soft tissue sarcoma. J Natl Compr Canc Netw. 2010;8:630–74. doi: 10.6004/jnccn.2010.0049. et al. [DOI] [PubMed] [Google Scholar]
- 3.Cormier JN, Pollock RE. Soft tissue sarcomas. CA Cancer J Clin. 2004;54:94109. doi: 10.3322/canjclin.54.2.94. [DOI] [PubMed] [Google Scholar]
- 4.Patel SR. Radiation-induced sarcoma. Curr Treat Options Oncol. 2000;1:25861. doi: 10.1007/s11864-000-0037-6. [DOI] [PubMed] [Google Scholar]
- 5.Brady MS, Gaynor JJ, Brennan MF. Radiation-associated sarcoma of bone and soft tissue. Arch Surg. 1992;127:1379–85. doi: 10.1001/archsurg.1992.01420120013002. [DOI] [PubMed] [Google Scholar]
- 6.Arya S, Nagarkatti DG, Dudhat SB, Nadkarni KS, Joshi MS, Shinde SR. Soft tissue sarcomas: ultrasonographic evaluation of local recurrences. Clin Radiol. 2000;55:193–7. doi: 10.1053/crad.1999.0343. [DOI] [PubMed] [Google Scholar]
- 7.Patel DB, Matcuk Jr GR. Imaging of soft tissue sarcomas. Chin Clin Oncol. 2018;7:35. doi: 10.21037/cco.2018.07.06. [DOI] [PubMed] [Google Scholar]
- 8.Ilaslan H, Schils J, Nageotte W, Lietman SA, Sundaram M. Clinical presentation and imaging of bone and soft-tissue sarcomas. Cleve Clin J Med. 2010;77(Suppl 1):S2–7. doi: 10.3949/ccjm.77.s1.01. [DOI] [PubMed] [Google Scholar]
- 9.Wu JS, Hochman MG. Soft-tissue tumors and tumorlike lesions: a systematic imaging approach. Radiology. 2009;253:297–316. doi: 10.1148/radiol.2532081199. [DOI] [PubMed] [Google Scholar]
- 10.Guillou L, Coindre J-M, Bonichon F, Nguyen BB, Terrier P, Collin F. Comparative study of the National Cancer Institute and French Federation of Cancer Centers Sarcoma Group grading systems in a population of 410 adult patients with soft tissue sarcoma. J Clin Oncol. 1997;15:350–62. doi: 10.1200/JCO.1997.15.1.350. et al. [DOI] [PubMed] [Google Scholar]
- 11.Verweij J, Baker LH. Future treatment of soft tissue sarcomas will be driven by histological subtype and molecular abberations. Eur J Cancer. 2010;46:863–8. doi: 10.1016/j.ejca.2010.01.016. [DOI] [PubMed] [Google Scholar]
- 12.Grimer R, Judson I, Peake D, Seddon B. Guidelines for the management of soft tissue sarcomas. Sarcoma. 2010;2010:506182. doi: 10.1155/2010/506182. [DOI] [PMC free article] [PubMed] [Google Scholar]
- 13.Italiano A, Le Cesne A, Mendiboure J, Blay JY, Piperno-Neumann S, Chevreau C. Prognostic factors and impact of adjuvant treatments on local and metastatic relapse of soft-tissue sarcoma patients in the competing risks setting. Cancer. 2014;120:3361–9. doi: 10.1002/cncr.28885. et al. [DOI] [PubMed] [Google Scholar]
- 14.Sedaghat S, Schmitz F, Sedaghat M, Nicolas V. Appearance of recurrent dermatofibrosarcoma protuberans in postoperative MRI follow-up. J Plast Reconstr Aesthet Surg. 2020;73:1960–65. doi: 10.1016/j.bjps.2020.08.089. [DOI] [PubMed] [Google Scholar]
- 15.Sedaghat S, Schmitz F, Krieger A, Sedaghat M, Reichardt B. Appearance of recurrent adult fibrosarcoma of the soft tissue and loco-regional post-treatment changes on MRI follow-up. Eur J Plast Surg. 2020 doi: 10.1007/s00238-020-01669-1. [DOI] [Google Scholar]
- 16.Brennan MF, Alektiar KM, Maki RG. Sarcomas of the soft tissue and bone. Section 1: Soft tissue sarcoma. In: Devita VT, Hellman S, Rosenberg SA, editors. Cancer: principles and practice of oncology, 6th edition. Philadelphia: Lippincott, Williams & Wilkins; pp. 1841–91. p. –. [Google Scholar]
- 17.Weiss SW, Goldblum JR, Folpe AL. Enzinger and Weiss’s soft tissue tumors. 5th edition. Philadelphia PA: Elsevier Health Sciences; 2007. [Google Scholar]
- 18.Wang X, Jacobs MA, Fayad L. Therapeutic response in musculoskeletal soft tissue sarcomas: evaluation by MRI. NMR Biomed. 2011;24:750–63. doi: 10.1002/nbm.1731. [DOI] [PMC free article] [PubMed] [Google Scholar]
- 19.Coindre J-M. Grading of soft tissue sarcomas: review and update. Arch Pathol Lab Med. 2006;130:1448–53. doi: 10.1043/1543-2165(2006)130[1448:GOSTSR]2.0.CO;2. [DOI] [PubMed] [Google Scholar]
- 20.Zhao F, Ahlawat S, Farahani SJ, Weber KL, Montgomery EA, Carrino JA, Fayad LM. Can MR imaging be used to predict tumor grade in soft-tissue sarcoma? Radiology. 2014;272:192–201. doi: 10.1148/radiol.14131871. [DOI] [PubMed] [Google Scholar]
- 21.Lietman SA. Soft-tissue sarcomas: overview of management, with a focus on surgical treatment considerations. Cleve Clin J Med. 2010;77:S13. doi: 10.3949/ccjm.77.s1.03. [DOI] [PubMed] [Google Scholar]
- 22.Welker JA, Henshaw RM, Jelinek J, Shmookler BM, Malawer MM. The percutaneous needle biopsy is safe and recommended in the diagnosis of musculoskeletal masses: outcomes analysis of 155 patients at a sarcoma referral center. Cancer. 2000;89:2677–86. doi: 10.1002/1097-0142(20001215)89:12<2677::aid-cncr22>3.0.co;2-l. [DOI] [PubMed] [Google Scholar]
- 23.Yang J, Frassica FJ, Fayad L, Clark DP, Weber KL. Analysis of nondiagnostic results after image-guided needle biopsies of musculoskeletal lesions. Clin Orthop Relat Res. 2010;468:3103–11. doi: 10.1007/s11999-010-1337-1. [DOI] [PMC free article] [PubMed] [Google Scholar]
- 24.Engellau J, Bendahl P-O, Persson A, Domanski HA, Åkerman M, Gustafson P. Improved prognostication in soft tissue sarcoma: independent information from vascular invasion, necrosis, growth pattern, and immunostaining using whole-tumor sections and tissue microarrays. Hum Pathol. 2005;36:994–1002. doi: 10.1016/j.humpath.2005.07.008. et al. [DOI] [PubMed] [Google Scholar]
- 25.Brisse HJ, Orbach D, Klijanienko J. Soft tissue tumours: imaging strategy. Pediatr Radiol. 2010;40:1019–28. doi: 10.1007/s00247-010-1592-z. [DOI] [PubMed] [Google Scholar]
- 26.Liang C, Mao H, Tan J, Ji Y, Sun F, Dou W. Synovial sarcoma: Magnetic resonance and computed tomography imaging features and differential diagnostic considerations. Oncol Lett. 2015;9:661–6. doi: 10.3892/ol.2014.2774. et al. [DOI] [PMC free article] [PubMed] [Google Scholar]
- 27.am de Schepper, Beuckeleer L de, Vandevenne J, Somville J. Magnetic resonance imaging of soft tissue tumors. European radiology. 2000;10:213–23. doi: 10.1007/s003300050037. [DOI] [PubMed] [Google Scholar]
- 28.Liu Q-Y, Li H-G, Chen J-Y, Liang B-L. Correlation of MRI features to histopathologic grade of soft tissue sarcoma. Chin J Cancer. 2008;27:856–60. [PubMed] [Google Scholar]
- 29.McDonald JS, Hunt CH, Kolbe AB, Schmitz JJ, Hartman RP, Maddox DE. Acute adverse events following gadolinium-based contrast agent administration: a single-center retrospective study of 281 945 injections. Radiology. 2019;292:620–7. doi: 10.1148/radiol.2019182834. et al. [DOI] [PubMed] [Google Scholar]
- 30.Am De S, Ramon FA, Degryse HR. Statistical analysis of MRI parameters predicting malignancy in 141 soft tissue masses. Rofo. 1992;156:587–91. doi: 10.1055/s-2008-1032948. [DOI] [PubMed] [Google Scholar]
- 31.Tung GA, Davis LM. The role of magnetic resonance imaging in the evaluation of the soft tissue mass. Crit Rev Diagn Imaging. 1993;34:239. [PubMed] [Google Scholar]


