

Abstract
Background
In the setting of cirrhotic liver, the diagnosis of hepatocellular carcinoma (HCC) is straightforward when typical imaging findings consisting of arterial hypervascularity followed by portal-venous washout are present in nodules larger than 1 cm. However, due to the complexity of hepatocarcinogenesis, not all HCCs present with typical vascular behaviour. Atypical forms such as hypervascular HCC without washout, isovascular or even hypovascular HCC can pose diagnostic dilemmas. In such cases, it is important to consider also the appearance of the nodules on diffusion-weighted imaging and hepatobiliary phase. In this regard, diffusion restriction and hypointensity on hepatobiliary phase are suggestive of malignancy. If both findings are present in hypervascular lesion without washout, or even in iso- or hypovascular lesion in cirrhotic liver, HCC should be considered. Moreover, other ancillary imaging findings such as the presence of the capsule, fat content, signal intensity on T2-weighted image favour the diagnosis of HCC. Another form of atypical HCCs are lesions which show hyperintensity on hepatobiliary phase. Therefore, the aim of the present study was to provide an overview of HCCs with atypical enhancement pattern, and focus on their magnetic resonance imaging (MRI) features.
Conclusions
In order to correctly characterize atypical HCC lesions in cirrhotic liver it is important to consider not only vascular behaviour of the nodule, but also ancillary MRI features, such as diffusion restriction, hepatobiliary phase hypointensity, and T2-weighted hyperintensity. Fat content, corona enhancement, mosaic architecture are other MRI feautures which favour the diagnosis of HCC even in the absence of typical vascular profile.
Key words: hepatocellular carcinoma, liver cirrhosis, magnetic resonance imaging, diffusion magnetic resonance imaging
Introduction
Hepatocellular carcinoma (HCC) is the most common primary hepatic malignancy, and the fifth cause of cancer mortality worldwide.1, 2 In more than 90% of cases, HCC occurrs in a cirrhotic liver.3, 4 The diagnosis of HCC at an early stage is of great clinical importance since curative treatments such as resection, transplantation, or local ablation therapy are possible.5, 6 In order to achieve this goal American Association for the Study of Liver Disease (AASLD) recommends ultrasound follow-up every six months for high risk patients.7, 8 In case nodule larger than 1cm is detected, the patient should undergo further examination with computed tomography (CT) or magnetic resonance imaging (MRI). The presence of arterial hyperenhancement, followed by washout in the portal-venous or delayed phase, is sufficient for the diagnosis of HCC in the setting of cirrhotic liver without the need for tissue biopsy.7, 9 In addition to CT and MRI, contrast-enhanced ultrasound (CEUS) is relatively new imaging modality, which allows real-time depiction of the typical vascular profile of HCC.10 CEUS is used in several indications in cirrhotic liver: to characterize nodules detected on surveillance US allowing prompt evaluation, and thus avoiding unnecessary further imaging in case of benign lesions; to add additional information to CT and MRI in case of suspected arterioportal shunts; and to provide more information for indeterminate nodules on CT and MRI prior to considration of liver biopsy.11 Nevertheless CEUS has some limitations including inability for HCC staging. Thus, once malignancy is detected CT or MRI is necessary for staging disease.12
If nodules detected in cirrhotic liver are smaller than 1cm, an ultrasound follow-up at 3-months intervals is adviced, in order to detect lesion growth.8 Although typical enhancement pattern is highly specific (97-99%), it has low sensitivity, as 30% of HCCs have an atypical enhancement due to immature neovascularization.13 According to previous publications, the incidence of atypical enhancement pattern was most frequent among small and well-differentiated HCCs.9, 13 Thus, some HCCs are misdiagnosed, since they do not exhibit these specific imaging criteria, presenting as either iso/ hypovascular lesions, rim-enhancing lesions, or hypervascular lesions without washout.14
Therefore, we sought herein to provide an overview of atypical manifestations of HCC in term of vascular behaviour, and focus on their MRI features that might be used for establishing an accurate diagnosis.
Hepatocarcinogenesis
Cirrhosis may be caused by chronic viral hepatitis, chronic alcohol abuse, different inherited and acquired metabolic diseases with nonalcoholic fatty liver disease (NAFLD) arising as a new epidemic liver disease in modern world.15 Among all etiologies, the risk for HCC development is highest in patients with chronic viral hepatitis.16 Many recent studies have shown that the risk of HCC is reduced among patients with hepatitis C viral infection who achieve sustained virological response (SVR) with interferon-based antiviral therapy.17 However contradictory data exist on the risk of HCC in patients receiving new direct-acting antivirals (DAA).18 Namely in contrast to interferon, these drugs can also be used in patients with advanced liver disease in whom cirrhosis has already developed.19 Additionally, DAA lead to distortion of immune system which not only cause rapid decrease in viral overload but also alters inflammatory profile which can accelerate the growth of already existing preclinical cancer.20 The role of imaging in these subset of patients is early detection of HCC as the most important complication of longstanding cirrhosis.
It is widely accepted that in cirrhotic liver HCC develops through multistep process of hepatocarcinogenesis starting from low grade dysplastic nodules (DN), followed by high grade DN, early HCC, and finally progressed HCC.21, 22 Low grade DNs are vaguely or distinctly nodular lesions with mild increase in cell density, no cytologic atypia, and morphologically indistinguishable from surrounding regenerative nodules.23 However, this distinction is clinically not so important as low grade DN have only slightly elevated risk of further dedifferentiation.23 In contrast, high grade DNs are premalignant lesions with cellular and architectural atypia. Rare unpaired arteries are also found in most of high grade DNs. Early HCC is defined as well-differentiated lesion, lacking fibrous pseudocapsule, characterized by five major histological features: (1) increased cell density; (2) various number of portal tracts within the nodule; (3) frequent acinar and/or pseudoglandular pattern; (4) common diffuse fatty change; and (5) varying number of unpaired arteries.24 Diffuse fatty change is seen in 40% of tumors less than 2 cm in diameter.15 Nevertheless, all these features may also be present in high grade DNs, thereby an accurate differentiation among these lesions and early HCC is very difficult, even on pathological examination.25 To date, the presence of stromal invasion is regarded to be the most important pathological finding for distinction of early HCC from dysplastic nodule.25 Progressed HCC are distinctly nodular lesions, which in contrast to early HCC, have a propensity for microvascular invasion and metastasis.23 Although pathologists have reached the consensus on histological characteristics of cirrhotic nodules, precise radiological criteria for identification of early atypically enhancing HCC are still missing.26
The hallmark of hepatocarcinogenesis are changes in nodule vascularization. At the beginning of hepatocarcinogenesis the nodules show arterial hypovascularity with portal perfusion still present.27 Subsequently, both arterial and portal blood perfusion decrease.27, 28 This step is followed by an increase of arterial vascularity to an isovascular pattern, and at the end to a hypervascular pattern.29 Hypervascularity is a result of formation of numerous unpaired arteries.22 Nodule-in-nodule type is specific hemodynamic pattern, characterized by development of spots of arterial hypervascularity in a hypovascular background.30 Due to insufficient number of unpaired arteries, typical vascular enhancement including arterial hypervascularity, and portal-venous washout is frequently absent in early HCCs.31 Therefore, the detection of these nodules on conventional MRI remains very difficult. Previous studies have shown that early HCCs are biologically less aggressive lesions, with much lower incidence of microvascular invasion compared to small hypervascular HCCs.32 Since early HCC has a great chance for surgical cure and low risk of recurrence, it is of great clinical importance to detect these lesions, and correctly characterize them.33, 34, 35
Imaging diagnosis of hepatocellular carcinoma
Current guidelines for HCC diagnosis
According to international guidelines published by AASLD and European Association for the Study of Liver (EASL), non-invasive diagnosis of HCC in cirrhotic patients is based on the detection of arterial hyperenhancement followed by washout in portal-venous phase.36 Although this vascular behavior is recognized as radiological hallmark for HCC diagnosis, it has low sensitivity, as 30% of HCCs have an atypical enhancement due to immature neovascularization.37, 38 Atypical enhancement pattern is usually present in small and well-differentiated HCCs.39, 40 These results indicate that current guidelines for noninvasive diagnosis of HCC may have limited value for early HCC, and may lead to many false negative findings.41 Therefore, there is an obvious need for new imaging criteria in the diagnosis of early HCC, since liver biopsy recommended for all atypical nodules has many drawbacks, such as bleeding, infection, and inadequate sampling.42 In this regard recent studies have stressed the utility of ancillary features such as T2-weighted hyperintensity, increased fat content, hypointensity in hepatobiliary phase (HBP), and diffusion weighted imaging (DWI) hyperintensity for the detection of early HCCs.43-45 The presence of three or more positive findings among above mentioned ancillary MRI features in nodules with diameter of 1-2 cm without typical vascular profile, has shown to significantly improve sensitivity (77%) without reduction of specificity (95%).46
Liver Imaging Reporting and Data System (LI-RADS) was developed by American College of Radiology in order to standardize diagnosis and reporting of lesions and pseudolesions identified in patients who are at risk for hepatocellular carcinoma.47, 48 Moreover, imaging criteria for various benign and malignant hepatic tumors, including non-HCC malignancies like cholangiocarcinoma are discussed. LI-RADS categorizes hepatic lesions from LR-1 to LR-5 depending on their imaging features, reflecting probability of being HCC. Categories LR-1 and LR-2 include definitely (LR-1) or probably benign lesions (LR-2). LR-3 are lesions with intermediate risk of being HCC, LR-4 include observations that are probably HCC, while LR-5 are considered definitely HCC.49 LI-RADS algorithm can be applied to both CT and MRI examinations in patients with cirrhosis, chronic hepatitis B infection, and in patients with prior HCC.49, 50 The categorization of the lesions using LI-RADS is based on major imaging criteria with arterial phase hyperenhancement and washout appearance, being the most important.47-50 However, there are a few others major features which favor the diagnosis of HCC. In this regard, enhancing capsule has a strong predictive value for HCC. Histologically, it correlates to either a true capsule or pseudocapsule.51 It is seen as peripheral rim of smooth hyper-enhancement on portal-venous, delayed or transitional phase. In addition, threshold growth defined as increase of ≥50% in diameter over ≤6 months, or ≥100% of diameter increase over >6 months, with minimal increase of at least 5 mm, is a strong indicator of malignancy.52 Moreover, the use of ancillary features to further define final category is highly recommended.48
The current European Association for the study of the Liver favours the use of Barcelona-Clinic Liver Cancer (BCLC) staging system for clinical classification of HCC.53, 54 In this system prognosis prediction is defined by variables related to tumor status, liver function and health status.54, 55 The role of imaging in this classification system is to accurately assess the number of tumor nodules, their size, the presence of portal vein invasion and extra-hepatic spread of disease. In cases of single HCC nodules less than 2 cm, or 2-3 HCC nodules up to 3 cm, the radical treatment such as resection, ablation and transplantation are possible in cases of preserved liver function.56 In contrast, for advanced cases chemoembolization or systemic therapy are methods of choice.56
One of the preconditions associated with a higher rate of complications in patients with cirrhosis and HCC is sarcopenia, defined as the loss of skeletal muscle mass, quality and function.57 In this regard, many studies have been published trying to assess the real clinical impact of sarcopenia on the outcome of HCC patients undergoing treatment.58, 59 However, to date there is no standardization of methodology for sarcopenia evaluation. There are many different CT approaches for assessment of sarcopenia such as measurement of total bilateral psoas muscle area at the middle of the third lumbar vertebra, or measurement of psoas mass thickness at the level of umbilicus, and many others.60, 61 The lack of standardization and unified cut-off values indicate the need of further studies to clarify the impact of sarcopenia on therapeutic outcome in cirrhotic patients with HCC.
Ancillary MRI features for the diagnosis of HCC
Hepatocarcinogenesis is a complex process that includes not only changes in vascularity, but also changes in architecture, cellular density, hepatocyte function, and Kupffer cell number or function.62 Therefore, development of hepatoselective contrast agents, such as gadoxetic acid, or gadobenate-dimeglumine, and introduction of DWI into abdominal MRI protocols, allowed evaluation not only of neovascularization, but also of other processes occurring during hepatocarcinogenesis.45, 63,64
The hepatocyte-specific contrast agent gadolinium-ethoxybenzyl-diethylenetriamine pentaacetic acid (Gd-EOB-DTPA) is a dual contrast agent, which combines the properties of conventional extracellular contrast agents with hepatobiliary phase.65 It is transported into hepatocytes using organic anion-transporting polypeptide OATP1B1 (synonymous with OATP8) and OATP1B3 receptors.66 Multiple resistance-associated Protein 2 (MRP2) located in the canalicular membrane of hepatocytes or tumour cells is responsible for excretion of hepatobiliary agents into bile ducts.65 OATP transporters are typically inhibited, while MRP2 are overexpressed in malignant liver lesions such as HCC, which therefore show hypointensity on hepatobiliary phase.67 The importance of OATP receptors not only for detection of HCC, but also for prediction of recurrence rate and overall prognosis has been recently shown.66 In this context, it was demonstrated that progressive loss in OATP immunoreactivity correlates well with the gain of biliary phenotype by neoplastic hepatocytes, which indicates high risk for faster recurrence and overall worse prognosis in patients with HCC.66, 68 The importance of assessment of correlation between MRI features of HCC on hepatobiliary phase and different morphovascular patterns of HCC defined on histology was also outlined in the recent study by Vasuri et al.69 The results of this study and similar future studies could allow more accurate preoperative sub classification of HCC in order to discriminate patients with good and poor prognostic outcome.
Many previous studies have shown that reduction of OATP1B/B3 expression occurs early in the course of hepatocarcinogenesis, even before development of neovascularization.63, 70 On the other hand, regenerative nodules, or low grade dysplastic nodules retain normal expression of uptake OATP1B/B3 transporter and excretory transporter MRP2.67 Therefore, the first sign of malignancy in cirrhotic nodules could be hypointensity in HBP, which is later followed by development of arterial hypervascularity. The utility of Gd-EOB-DTPA in the detection and characterization of atypically enhancing HCCs has been demonstrated in many recent reports.45, 46,71, 72, 73, 74 In this regard, Golfieri et al. tested 111 atypical cirrhotic nodules and shown that HBP hypointensity was the strongest marker of malignancy with 88% of sensitivity, 91% negative predictive value and 93% diagnostic accuracy.75 The same group of authors have shown that after addition of HBP phase in MRI protocol, sensitivity and specificity for the detection of small HCCs significantly increased, from 88.4% up to 99.4%, and from 88% to 95%, respectively.73 The high incidence of atypical nodules particularly among small lesions, and their frequent malignancy indicate the need to incorporate Gd-EOB-DTPA in standard MRI protocols for evaluation of cirrhotic liver.74 Nevertheless, it should be kept in mind that hepatic dysfunction or hyperbilirubinemia can result in diminished uptake of hepatospecific contrast agent, leading to reduced conspicuity of HCC lesions on HBP.76
The value of DWI in the characterization of cirrhotic nodules could be explained by progressive cellular changes occurring during hepatocarcinogenesis.77 It is well known that DWI signal intensity is influenced by cellular density, architectural changes, as well as vascular changes during malignant transformation of cirrhotic nodules. As one of the major differences between dysplastic nodules and early HCCs is the degree of cellular density, DWI might provide a good insight into histological changes of hepatocellular nodules irrespective of vascularity.78 Notably, since RN and low grade DN are usually histologically identical to the surrounding hepatic tissue, they are isointense on DWI.79, 80 On the other hand, HCC and high grade DN, show a progressive increase in cellular density, thickening of cellular plates, leading to progressive restriction of water mobility, which results in increased signal intensity on DWI.80 Since at an earlier stage, the degree of neovascularization may be insufficient for depiction on contrast-enhanced images, small lesions could sometimes be detected only on DWI.81 Opposite to the signal intensity on DWI, the calculation of apparent diffusion coefficient (ADC) values was not shown to be usefull for differentiation of benign from malignant cirrhotic nodules.44, 82 The subtle cellular changes, and variable presence of fat, necrosis, and vascular changes result in strong overlap of ADC values between malignant and benign nodules. In addition, DWI hyperintensity could be also found in high grade DN, and even in a few low grade DN.83 These results could be explained by heterogeneity of cirrhotic liver which also shows diffusion restriction, thus making it difficult to identify hepatocellular nodules with increased signal intensity on DWI.84 In addition, HCCs are less cellular than metastases, and sometimes difficult to detect on DWI.64 Furthermore, DWI also has other limitations, including limited spatial resolution, susceptibility to motion artifacts, especially for lesions located in the left lateral segment, and close to the diaphragm because of cardiac motion.77 Thus, in general DWI is not used alone in clinical scenarios, but only as a part of MRI protocol.85
The value of signal intensity on T2-weighted images in the identification of HCC lesions was stressed in many previous reports.41 Namely, T2-weighted hyperintensity is considered to be strong predictor of malignancy, and subsequent hypervascularization in hypovascular nodules.40, 43 Higher signal intensity on T2-weighted images could partly be explained by peliotic changes in the intratumoral sinusoids of HCC.86 In this regard, Channual et al. have shown that relative signal intensity on T2-weighted images is significantly different between low grade DN on one side, and high grade DN with HCC on the other side.87 Moreover, when T2-weighted hyperintensity was combined with arterial hypervascularity, differentiation could be possible with the sensitivity of 88.6%, and positive predictive value of 99.2%.87 The value of T2-weighted hyperintensity was also shown in the study by Hwang et al., who reported that this feature was present in 76% of hypovascular HCC, and in only 12.9% of dysplastic nodules.88 Although T2-weighted hyperintensity can also occur in dysplastic nodules, probably due to infarction, the signal intensity is usually lower than in HCCs.89
Besides above mentioned imaging characteristics, there are also other ancillary features which could help in characterization of the lesions in cirrhotic liver. One of them is corona enhancement which refers to an ill-defined perilesional enhancement in late arterial phase.48 It develops as a consequence of an early drainage of blood from a tumor into the surrounding hepatic sinusoids and portal venules.90 This occurs due to the obstruction of intranodular hepatic veins by neoplastic cells.90 While capsular appearance is obvious on portalvenous phase, corona enhancement is present in late arterial phase.91 If iron sparing solid mass is seen in the setting of cirrhotic liver with multiple siderotic nodules, this finding should indicate the presence of malignancy.48 It is well known that during hepatocarcinogenesis neoplastic cells loose their capability of iron accumulation.48 Non-enhancing capsule has recently been introduced as another ancillary feature that in particular favors HCC.48 It refers to uniformly thin, sharply demarcated, non-enhancing rim surrounding the lesion.48 Furthermore, mosaic architecture and “nodule-in-nodule” appearance are very well known ancillary features of HCC.30, 92 While mosaic architecture is usually seen in large lesions, nodule-in-nodule often represents development of early HCC in high grade dysplastic nodule. The presence of fat inside the cirrhotic nodule is also considered to be ancillary feature of HCC.93 Although the exact underlying mechanism of intralesional fat accumulation is not known, hypoxia which occurs during hepatocarcinogenesis is considered to be the most probable reason.93 Intralesional fat is usually seen in small HCCs (less than 1.5 cm) with decreasing frequency in larger lesions.48 Nevertheless, this finding should not be confused with fat accumulation seen in steatotic HCC which represents specific hystological variant of HCC.39 Some other features, such as subtreshold growth, fat sparing in solid mass, blood products in mass, and transitional phase hypointensity have also been included as ancillary features for HCC diagnosis in latest LI-RADS algorithm.48, 49
Since early HCC detection is crucial for appropriate clinical management of patients, the establishemnet of predictive markers for primary HCC occurance in the setting of compensated advanced chronic liver disease is in focus of many recent studies.94 Among different non-invasive tests for the prediction of primary HCC, Marasco et al. have found that the liver stiffness measurement is the most reliable, allowing evaluation of liver fibrosis degree, inflammation and portal hypertension.95 However further studies are needed to determine specific optimal cut-off values able to assess the risk for HCC development in different etiologies.
Atypically enhanced hepatocellular carcinoma
Iso- or hypovascular HCC
Iso- or hypovascular HCCs are defined as lesions without arterial phase hypervascularity. As the reduction of portal vascularization precedes development of new unpaired arteries, iso- or hypovascularity in arterial phase, with hypointensity in portal-venous phase could be the first sign of early HCC (Figure 1,2).27 The prevalence of hypovascular HCC varies among different studies, ranging from 14% in the study by Leoni et al. 96, to 19.5% by Choi et al.97 If this vascular pattern is identified at dynamic CT, further examination with MRI using hepatospecific contrast agents is necessary. Hypointensity on HBP in nodules hypovascular in arterial phase, indicates that loss of metabolic hepatocyte function occurs before development of neovascularization.65, 70 There are many recent studies which pointed out that hypointensity on HBP is one of the imaging findings with highest diagnostic accuracy for detection of early HCC.45, 46,71, 72, 73, 74 Accordingly, in the study by Sano et al.41 the sensitivity of HBP hypointensity for the detection of early HCC was 97%, while specificity reached 100%. Although several other imaging features, such as nodule-in-nodule appearance, washout in portal-venous phase, and fat content also had specificity of 100%, none of these findings had sufficient sensitivity for HCC detection. Similar results were published by Choi et al. who have shown that 96.6% of hypovascular HCCs were hypointense on HBP, indicating that HBP hypointensity must be considered as imaging biomarker of malignancy.97
Figure 1.

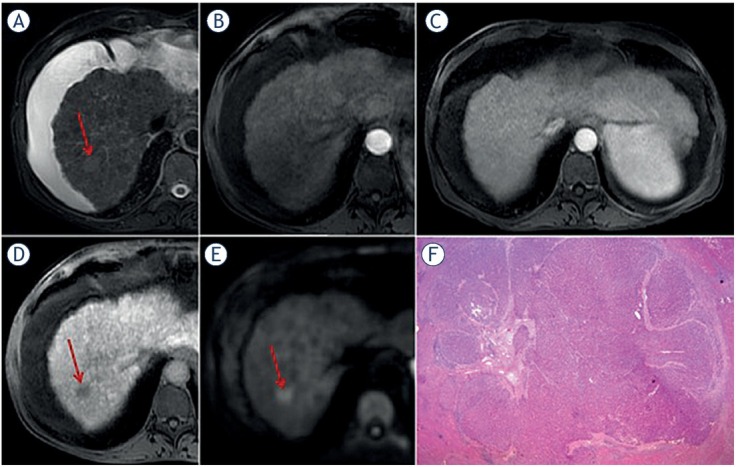
Hypovascular hepatocellular carcinoma (HCC) in 58-year old woman with cirrhosis. On axial T2-weighted image (A), diffusion-weighted image (B) and on in-phase image (C) tumor is isointense with surrounding liver parenchyma. On opposed-phase image there is a partial drop of signal intensity in the lesion (arrow) corresponding to the fatty component (D). The lesion (arrow) is slightly hypointense on arterial phase (E), while it is clearly hypovascular on portal-venous phase (F). On hepatobiliary phase after administration of gadoxetic acid the lesion (arrow) is hypointense (G). Hematoxylin and eosin (H&E) staining showed well-differentiated HCC with fat deposition; original magnification x 200 (H).
Figure 2.
Isovascular hepatocellular carcinoma (HCC) in 55-year old woman with cirrhosis. On T2-weighted image slightly hyperintense nodule (arrow) is seen in liver segment VII (A). No lesion is seen on arterial (B) and portal venous phase (C). On hepatobiliary phase after administration of gadoxetic acid the lesion (arrow) is hypointense (D). Diffusion-weighted image shows diffusion restriction of the lesion (arrow) (E). Hematoxylin and eosin (H&E) staining showed well-differentiated HCC; original magnification x 200 (F).
On the basis of these results, it could be concluded that double hypointensity, including hypointensity in the portal-venous phase, and hypointensity in hepatobiliary phase is highly suggestive of hypovascular HCC.72 On the other hand, Bartolozzi et al. reported that 70% of high grades DNs were also hypointense on HBP, indicating that using only this sign, precise distinction among high grade DN and HCC is not possible.63 However, differentiation among high grade DNs and early HCC is not crucial from clinical point of view. Namely, in many institutions high grade DN are considered to be early HCCs.72 Taking into account that high grade DN are premalignant lesions, it is questionable whether exact radiological distinction among these two pathological entities is indeed necessary. If not treated immediately, HBP hypointense nodules should be rigorously monitored as was stressed by many previous studies.98-101 The cumulative risk of hypervascularization in these lesions varies from 31-35% in the study by Kim et al.98, and Hyodo et al.99, up to 77% in the study by Kumada et al.100. Similar results were also reported in other studies.98, 99, 100, 101, 102 Considering that a significant percent of non-hypervascular HBP hypointense cirrhotic nodules are already HCCs, or will develop typical radiological features of HCC in follow-up, they must be characterized as high risk nodules, and if possible should be subject to liver biopsy. However, care should be taken when interpreting HBP phase imaging findings in cirrhotic liver. Namely, in patients with worse Child Pugh class, the uptake of Gd-EOB-DTPA can be very reduced and delayed, affecting relative signal intensity of HCCs.65 In this regard, the diagnosis of HCC with atypical enhancement pattern may be very challenging in cirrhotic liver, indicating the importance of multiparametric assessment.
Besides hepatospecific contrast agents, further characterization of iso-, or hypovascular nodules could be done with DWI. In this context, Hwang et al. reported high diagnostic accuracy of DWI in differentiation between hypovascular HCC and dysplastic nodules, as hyperintensity on DWI was observed in 92% of HCC, in contrast to 16.1% of dysplastic nodules.88 In the study by Kim et al. DWI restriction was present in 56% of 139 hypovascular, HBP hypointense nodules which subsequently progressed to hypervascular HCC, indicating that DWI hyperintensity is a strong predictor of development of hypervascularity.98 Moreover, on the basis of these results, it could be concluded that iso-or hypovascular nodules, which show hypointenyity on HBP and high signal intensity on DWI, could already be considered as early HCC. Additionally, according to some authors hypovascular nodules, hypointense in the HBP, not hyperintense on DWI, should be further investigated by contrast enhanced ultrasound (CEUS), as this method allows depiction of early arterial phase enhancement, which could be missed on dynamic CT and MRI.74
Hypervascular HCC without washout in portal-venous phase
Many small HCCs are depicted only during arterial phase imaging as hypervascular lesions, lacking washout on portal-venous and delayed phase (Figure 3).103 Actually, in HCCs ≤ 1 cm, arterial enhancement is the most frequent MRI finding (79%) in comparison to other features, such as wash-out in the portal-venous or delayed phase (50%).104 This can raise a diagnostic dilemma, as it is often difficult to differentiate these lesions from non-neoplastic hypervascular pseudolesions, such as small arterioportal shunts, or atypical cirrhosis related nodules.105, 106 Moreover, the majority of these small hypervascular nodules detected in cirrhotic liver are benign lesions.105, 106 Differential diagnosis is usually made using T2-weighted images, DWI, and signal intensity on HBP. Concerning the value of T2-weighted signal intensity there are discrepant results in the previous literature.87, 88,107 Thus, Hussain et al. concluded that T2-weighted hyperintesity has no additional value in the identification of small HCC, due to very heterogeneous signal intensity of surrounding liver parenchyma.107 In contrast, many other investigators reported that addition of T2-weighted images to dynamic contrast enhanced images significantly improves detection of HCC.87, 88 In this regard, HCCs are seen as slightly hyperintense lesions, while arterioportal shunts are isointense with surrounding liver tissue.43 Additionally, the majority of these atypical HCCs are hypointense on HBP phase indicating the lack of functional hepatocytes. Very rarely this atypical vascular profile can occur in large HCCs (Figure 4). In such cases hypointensity on HBP is the most useful sequence for distinction from other hypervascular benign lesions, such as focal nodular hyperplasia. Since arterial enhancement and HBP hypointensity are two strongest markers of malignancy in cirrhotic patients, a nodule with arterial hypervascularity, even without wash-out in portal-venous or delayed phase, but hypointense in the HBP, should be highly suspicious of HCC. Another diagnostic problem could be the distinction between these atypically enhancing HCCs, and small hemangiomas in liver cirrhosis.108 Namely, in cirrhotic parenchyma small hemangiomas can shrink, and become fibrotic and hyalinized, which influences their signal intensity on T2-weighted images. Moreover, similar to HCCs, hemangiomas are hypointense in HBP. In this context Semelka et al. reported that accurate differential diagnosis among small HCCs and hepatic hemangioma less than 15 mm can not be made on the basis of imaging criteria.109
Figure 3.
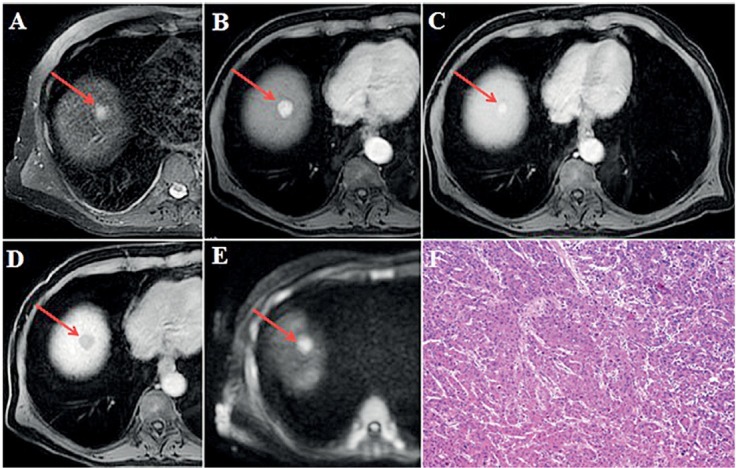
Hypervascular hepatocellular carcinoma (HCC) without washout in 64-year old man with cirrhosis. Axial T2-weighted fat-suppressed image shows hyperintense nodule (arrow) in liver segment VIII (A). On arterial phase the nodule (arrow) is hypervascular (B) without washout on portal-venous phase (C). On hepatobiliary phase the nodule (arrow) is hypointense (D) and on diffusion-weighted image it is hyperintense (E). Hematoxylin and eosin (H&E) staining showed moderately-differentiated HCC; original magnification x 200 (F).
Figure 4.

Hypervascular hepatocellular carcinoma (HCC) without washout in 44-year old man with non alcoholic fatty liver disease. Axial T2-weighted fat-suppressed image shows moderately hyperintense lesion (arrow) in segment VI (A). Dual-echo images show that tumor (arrows) is isointense on in-phase image (B) without signal drop on opposed-phase image, while background liver parenchyma shows diffuse signal drop as a consequence of fatty liver disease (C). The lesion (arrows) is hyperintense on diffusion-weighted image (D), hypevascular on arterial phase (E) without washout on portalvenous phase (F). On hepatobiliary phase the tumor (arrow) is hypointense (G). Hematoxylin and eosin (H&E) staining showed moderately-differentiated HCC with very dilatated sinusoidal network; original magnification x 200 (H).
HBP hyperintense hepatocellular carcinoma
According to molecular changes during hepatocarcinogenesis, HCCs should typically show hypointensity on HBP. The signal intensity of HCC on HBP is strongly correlated to the expression of uptake transporter OATP8.110 It is well known that during hepatocarcinogenesis the progressive decrease in OATP8 expression occurs, thus influencing the enhancement ratio of cirrhotic nodules in the HBP.70, 111 Nevertheless, in 10% of HCCs paradoxical uptake of hepatospecific contrast agent may occur.70 This can partly be explained by residual functional hepatocytes expressing OATP8 receptors in well-differentiated lesions.70 However, in the study by Asayama et al. Gd-EOB-DTPA uptake did not correlate with tumor differentiation.112 In addition, these authors have shown that uptake of Gd-EOB-DTPA was significantly correlated with the maintenance of bile production. Similar results were published by Choi et al. who have shown that among 28 tumors showing iso- or hyperintensity on HBP, only 10 were well-differentiated HCCs (35.7%), while 16 were moderately (57.1%), and two were poorly differentiated lesions (7.1%).97 A few recent studies have shown that gadoxetic acid uptake in HCCs can be the result of genetic mutations and reversion to their original hepatocyte nature during neoplastic transformation.113, 114 Namely, in some moderately or even poorly differentiated lesions OATP8 receptor expression can increase due to genetic alterations, followed by decrease in MRP expression.115, 116, 117 In contrast to normal hepatocytes where excretion of gadoxetic acid occurs via MRP2 transporters localized on canalicular side, in hepatobiliary phase iso- orhyperintense HCCs the main pathway of excretion is through MRP3 on sinusoidal side.116 Therefore, HBP iso- or hyperintensity in HCCs does not indicate well-differentiated lesion, but rather suggest different genetic subtype of HCC.66, 69 Although differentiation of the tumor cannot be predicted by signal intensity on hepatobiliary phase, Choi et al. have demonstrated that HBP hyperintense HCCs showed significantly higher differentiation grades, less frequent portal vein invasion, and lower recurrence rate.97 Moreover, patients with hyperintense HCCs showed longer survival than those with hypointense HCCs.97 All these findings suggest that HBP hyperintense HCCs are probably a particular form of HCC with biologically less aggressive features in comparison to HBP hypointense HCCs.118, 119 Interestingly, the AFP levels were shown to be significantly higher in hypointense HCCs than in hyperintense HCCs.110, 116
However, there are no data in the previous literature about behaviour of HBP hyperintense HCCs in portal venous phase, whether they demonstrate washout or not. Although most reported cases show typical vascular profile, rarely HCCs hyperintense in HBP lack portal-venous or delayed phase washout (Figure 5).74 The incidence of such nodules is very low, less than 3%.74 In such cases differential diagnosis towards benign lesions, such as large regenerative nodules (LRNs), and focal nodular hyperplasia is very challenging.120 LRNs are hyperplastic lesions, 5 mm to 5 cm in diameter, associated with cirrhosis, Budd–Chiari syndrome, certain forms of congenital heart disease, and other conditions.121, 122 LRNs are typically hypervascular in arterial phase, without washout in portalvenous or delayed phase, iso- or hyperintense in HBP.121 The distinction between LRNs and atypically enhancing HCCs showing hyperintensity on HBP, requires detailed analysis of other MRI features, such as T2-weighted, T1-weighted, and DWI signal intensity.122 While HCCs are usually slightly hyperintense on T2-weighted images, hypointense on T1-weighted images with restricted diffusion, LRN and FNH are isointense on both T2- and T1-weighted images, without DWI hyperintensity.120, 121 If there is any doubt, rigorous follow-up is required, and if nodule grows a biopsy is recommended.
Figure 5.
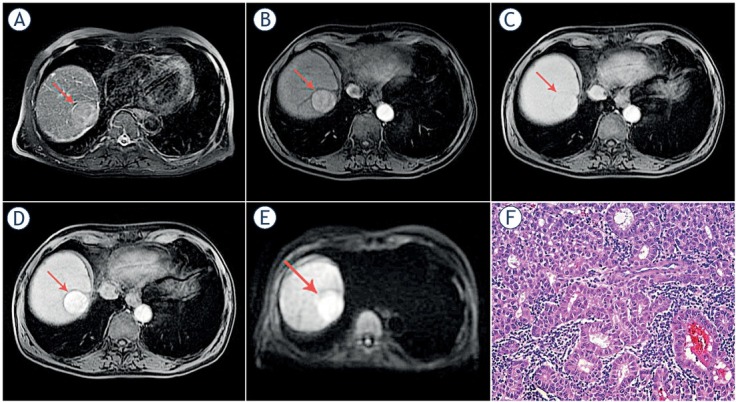
Hepatocellular carcinoma (HCC) in 73-year old man with alcoholic cirrhosis. Axial T2-weighted fat-suppressed image shows slightly hyperintense well-defined nodular lesion (arrow) in segment VII (A). The lesion (arrows) is hypervascular on arterial phase (B) without washout on portal-venous phase (C). On hepatobiliary phase the tumor (arrow) is strongly hyperintense (D) with hyperintensity on diffusion-weighted image (E). Hematoxylin and eosin (H&E) staining showed well-differentiated HCC; original magnification x 200 (F).
Conclusions
The diagnosis of HCC is straightforward when typical imaging features are present. Nonetheless, due to complexity of hepatocarcinogenesis, HCC can present with atypical vascular profile, especially in small lesions, including iso- or hypovascular nodules without arterial hypervascularity, and hypervascular lesions without washout in portalvenous phase. Additionally, there are HCCs with high signal intensity in HBP. In order to correctly characterize these lesions ancillary features such as T2-weighted hyperintensity, diffusion restriction, hepatobiliary phase hypointensity together with other MRI characteristics should be carefully examined. Even though these atypical presentations are rare, it is important to recognize them in order to provide the patients optimal and timely treatment.
Disclosure
No potential conflicts of interest were disclosed.
References
- 1.Mittal S, El-Serag HB. Epidemiology of hepatocellular carcinoma: consider the population. J Clin Gastroenterol. 2013;47:S2–6. doi: 10.1097/MCG.0b013e3182872f29. [DOI] [PMC free article] [PubMed] [Google Scholar]
- 2.Yang JD, Hainaut P, Gores GJ, Amadou A, Plymoth A, Roberts LR. A global view of hepatocellular carcinoma: trends, risk, prevention and management. Nat Rev Gastroenterol Hepatol. 2019;16:589–604. doi: 10.1038/s41575-019-0186-y. [DOI] [PMC free article] [PubMed] [Google Scholar]
- 3.Degos F, Christidis C, Ganne-Carrie N, Farmachidi JP, Degott C, Guettier C. Hepatitis C virus related cirrhosis: time to occurrence of hepatocellular carcinoma and death. Gut. 2000;47:131–6. doi: 10.1136/gut.47.1.131. et al. [DOI] [PMC free article] [PubMed] [Google Scholar]
- 4.Tang A, Hallouch O, Chernyak V, Kamaya A, Sirlin CB. Epidemiology of hepatocellular carcinoma: Target population for surveillance and diagnosis. Abdom Radiol. 2018;43:13–25. doi: 10.1007/s00261-017-1209-1. [DOI] [PubMed] [Google Scholar]
- 5.Marrero JA, Kulik LM, Sirlin CB, Zhu AX, Finn RS, Abecassis MM. Diagnosis, staging, and management of hepatocellular carcinoma: 2018 practice guidance by the American Association for the Study of Liver Diseases. Hepatology. 2018;68:723–50. doi: 10.1002/hep.29913. et al. [DOI] [PubMed] [Google Scholar]
- 6.Hartke J, Johnson M, Ghabril M. The diagnosis and treatment of hepato-cellular carcinoma. Semin Diagn Pathol. 2017;34:153–9. doi: 10.1053/j.semdp.2016.12.011. [DOI] [PubMed] [Google Scholar]
- 7.Furlan A, Marin D, Cabassa P, Taibbi A, Brunelli E, Agnello F. Enhancement pattern of small hepatocellular carcinoma (HCC) at contrast-enhanced US (CEUS), MDCT, and MRI: intermodality agreement and comparison of diagnostic sensitivity between 2005 and 2010 American Association for the Study of Liver Diseases (AASLD) guidelines. Eur J Radiol. 2012;81:2099–105. doi: 10.1016/j.ejrad.2011.07.010. et al. [DOI] [PubMed] [Google Scholar]
- 8.Harris PS, Hansen RM, Gray ME, Massoud OI, McGuire BM, Shoreibah MG. Hepatocellular carcinoma surveillance: an evidence-based approach. World J Gastroenterol. 2019;25:1550–9. doi: 10.3748/wjg.v25.i13.1550. [DOI] [PMC free article] [PubMed] [Google Scholar]
- 9.Anis M, Irshad A. Imaging of hepatocellular carcinoma: practical guide to differential diagnosis. Clin Liver Dis. 2011;15:335–52. doi: 10.1016/j.cld.2011.03.014. [DOI] [PubMed] [Google Scholar]
- 10.Claudon M, Dietrich CF, Choi BI, Cosgrove DO, Kudo M, Nolsøe CP. Guidelines and good clinical practice recommendations for Contrast Enhanced Ultrasound (CEUS) in the liver - update 2012: A WFUMB-EFSUMB initiative in cooperation with representatives of AFSUMB, AIUM, ASUM, FLAUS and ICUS. Ultrasound Med Biol. 2013;39:187–210. doi: 10.1016/j.ultrasmedbio.2012.09.002. [DOI] [PubMed] [Google Scholar]
- 11.Wilson SR, Lyshchik A, Piscaglia F, Cosgrove D, Jang HJ, Sirlin C. CEUS LI-RADS: algorithm, implementation, and key differences from CT/MRI. Abdom Radiol. 2018;43:127–42. doi: 10.1007/s00261-017-1250-0. et al. [DOI] [PubMed] [Google Scholar]
- 12.Jo PC, Jang H, Burns PN, Burak KW, Kim TK, Wilson SR. Integration of contrast-enhanced US into a multimodality approach to imaging of nodules in a cirrhotic liver: how I do It. Radiology. 2017;282:317–31. doi: 10.1148/radiol.2016151732. [DOI] [PubMed] [Google Scholar]
- 13.Bruix J, Reig M, Rimola J, Forner A, Burrel M, Vilana R. Clinical decision making and research in hepatocellular carcinoma: pivotal role of imaging techniques. Hepatology. 2011;54:2238–44. doi: 10.1002/hep.24670. et al. [DOI] [PubMed] [Google Scholar]
- 14.Forner A, Vilana R, Ayuso C, Bianchi L, Solé M, Ayuso JR. Diffusion-weighted imaging of surgically resected hepatocellular carcinoma: imaging characteristics and relationship among signal intensity, apparent diffusion coefficient, and histopathologic grade. Hepatology. 2008;47:97–104. doi: 10.1002/hep.21966. et al. [DOI] [PubMed] [Google Scholar]
- 15.European Association for the Study of the Liver. EASL Clinical Practice Guidelines: Management of hepatocellular carcinoma. J Hepatol. 2018;69:182–236. doi: 10.1016/j.jhep.2018.03.019. [DOI] [PubMed] [Google Scholar]
- 16.Lok AS, Seeff LB, Morgan TR, di Bisceglie AM, Sterling RK, Curto TM. Incidence of hepatocellular carcinoma and associated risk factors. Gastroenterology. 2009;136:138–48. doi: 10.10153/j.gastro.2008.09.014. et al. [DOI] [PMC free article] [PubMed] [Google Scholar]
- 17.van der Meer AJ, Veldt BJ, Feld JJ, Wedemeyer H, Dufour J-F, Lammert F. Association between sustained virological response and all-cause mortality among patients with chronic hepatitis C and advanced hepatic fibrosis. JAMA. 2012;308:2584–93. doi: 10.1001/jama.2012.144878. et al. [DOI] [PubMed] [Google Scholar]
- 18.Guarino M, Sessa A, Cossiga V, Morando F, Caporaso N, Morisco F. Direct-acting antivirals and hepatocellular carcinoma in chronic hepatitis C: A few lights and many shadows. World J Gastroenterol. 2018;24:2582–95. doi: 10.3478/wjg.v24.i24.2582. [DOI] [PMC free article] [PubMed] [Google Scholar]
- 19.Reig M, Marino Z, Perello C, Inarrairaegui M, Ribeiro A, Lens S. Unexpected high rate of early tumor recurrence in patients with HCVrelated HCC undergoing interferon-free therapy. J Hepatol. 2016;65:719–26. doi: 10.1016/j.jhep.2016.04.008. et al. [DOI] [PubMed] [Google Scholar]
- 20.Conti F, Buonfiglioli F, Scuteri A, Crespi C, Bolondi L, Caraceni P. Early occurrence and recurrence of hepatocellular carcinoma in HCVrelated cirrhosis treated with direct-acting antivirals. J Hepatol. 2016;65:727–33. doi: 10.1016/j.jhep.2016.06.015. et al. [DOI] [PubMed] [Google Scholar]
- 21.Kudo M. Multistep human hepatocarcinogenesis: correlation of imaging with pathology. J Gastroenterol. 2009;44:112–8. doi: 10.1007/s00535-008-2274-6. [DOI] [PubMed] [Google Scholar]
- 22.Matsui O, Kobayashi S, Sanada J, Kouda W, Ryu Y, Kozaka K. Hepatocelluar nodules in liver cirrhosis: hemodynamic evaluation (angiography-assisted CT) with special reference to multi-step hepatocarcinogenesis. Abdom Imaging. 2011;36:264–72. doi: 10.1007/s00261-011-9685-1. et al. [DOI] [PMC free article] [PubMed] [Google Scholar]
- 23.The International Consensus Group for Hepatocellular Neoplasia. Pathologic diagnosis of early hepatocellular carcinoma: a report of the International Consensus Group for Hepatocellular Neoplasia. Hepatology. 2009;49:658–64. doi: 10.1002/hep.22709. [DOI] [PubMed] [Google Scholar]
- 24.Hytiroglou P, Park YN, Krinsky G, Theise ND. Hepatic precancerous lesions and small hepatocellular carcinoma. Gastroenterol Clin North Am. 2007;36:867–87. doi: 10.1016/j.gtc.2007.08.010. [DOI] [PubMed] [Google Scholar]
- 25.Sakamoto M, Hirohashi S, Shimosato Y. Early stages of multistep hepatocarcinogenesis: adenomatous hyperplasia and early hepatocellular carcinoma. Hum Pathol. 1991;22:172–8. doi: 10.1016/0046-8177(91)90039-r. [DOI] [PubMed] [Google Scholar]
- 26.Gupta M, Gabriel H, Miller FH. Role of imaging in surveillance and diagnosis of hepatocellular carcinoma. Gastroenterol Clin North Am. 2018;47:585602. doi: 10.1016/j.gtc.2018.04.013. [DOI] [PubMed] [Google Scholar]
- 27.Kudo M. Imaging blood flow characteristics of hepatocellular carcinoma. Oncology. 2002;62:48–56. doi: 10.1159/000048276. [DOI] [PubMed] [Google Scholar]
- 28.Takayasu K, Muramatsu Y, Mizuguchi Y, Moriyama N, Ojima H. Imaging of early hepatocellular carcinoma and adenomatous hyperplasia (dysplastic nodules) with dynamic ct and a combination of CT and angiography: experience with resected liver specimens. Intervirology. 2004;47:199–208. doi: 10.1159/000078473. [DOI] [PubMed] [Google Scholar]
- 29.Tajima T, Honda H, Taguchi K, Asayama Y, Kuroiwa T, Yoshimitsu K. Sequential hemodynamic change in hepatocellular carcinoma and dysplastic nodules: CT angiography and pathologic correlation. AJR Am J Roentgenol. 2002;178:885–97. doi: 10.2214/ajr.178.4.1780885. et al. [DOI] [PubMed] [Google Scholar]
- 30.Kojiro M.. ‘Nodule-in-nodule’ appearance in hepatocellular carcinoma: its significance as a morphologic marker of dedifferentiation. Intervirology. 2004;47:179–83. doi: 10.1159/000078470. [DOI] [PubMed] [Google Scholar]
- 31.Nakashima Y, Nakashima O, Hsia CC, Kojiro M, Tabor E. Vascularization of small hepatocellular carcinomas: correlation with differentiation. Liver. 1999;19:12–8. doi: 10.1111/j.1478-3231.1999.tb00003.x. [DOI] [PubMed] [Google Scholar]
- 32.Kojiro M. Pathological diagnosis at early stage: reaching international consensus. Oncology. 2010;78:31–5. doi: 10.1159/000315227. doi: org/10.1159/000315227. [DOI] [PubMed] [Google Scholar]
- 33.Inoue K, Takayama T, Higaki T, Watanabe Y, Makuuchi M. Clinical significance of early hepatocellular carcinoma. Liver Transpl. 2004;10:S16–9. doi: 10.1002/lt.20049. [DOI] [PubMed] [Google Scholar]
- 34.Takayama T, Makuuchi M, Kojiro M, Lauwers GY, Adams RB, Wilson SR. Early hepatocellular carcinoma: pathology, imaging, and therapy. Ann Surg Oncol. 2008;15:972–8. doi: 10.1245/s10434-007-9685-0. et al. [DOI] [PubMed] [Google Scholar]
- 35.Yamamoto M, Takasaki K, Otsubo T, Katsuragawa H, Katagiri S, Yoshitoshi K. Favorable surgical outcomes in patients with early hepatocellular carcinoma. Ann Surg. 2004;239:395–9. doi: 10.1097/01.sla.0000114215.03112.e0. et al. [DOI] [PMC free article] [PubMed] [Google Scholar]
- 36.Kim TH, Kim SY, Tang A, Lee JM. Comparison of international guidelines for noninvasive diagnosis of hepatocellular carcinoma: 2018 update. Clin Mol Hepatol. 2019;25:245–63. doi: 10.3350/cmh.2018.0090. [DOI] [PMC free article] [PubMed] [Google Scholar]
- 37.Choi JW, Lee JM, Kim SJ, Yoon JH, Baek JH, Han JK. Hepatocellular carcinoma: imaging patterns on gadoxetic acid-enhanced MR Images and their value as an imaging biomarker. Radiology. 2013;267:776–86. doi: 10.1148/radiol.13120775. et al. [DOI] [PubMed] [Google Scholar]
- 38.Bartolozzi C, Battaglia V, Bargellini I, Bozzi E, Campani D, Pollina LE. Contrast-enhanced magnetic resonance imaging of 102 nodules in cirrhosis: correlation with histological findings on explanted livers. Abdom Imaging. 2013;38:290–6. doi: 10.1007/s00261-012-9952-9. et al. [DOI] [PubMed] [Google Scholar]
- 39.Kim JH, Joo I, Lee JM. Atypical appearance of hepatocellular carcinoma and its mimickers: How to solve challenging cases using gadoxetic acid-enhanced liver magnetic resonance imaging. Korean J Radiol. 2019;20:1019–41. doi: 10.3348/kjr.2018.0636. [DOI] [PMC free article] [PubMed] [Google Scholar]
- 40.Willatt JM, Hussain HK, Adusumilli S, Marrero JA. MR Imaging of hepatocellular carcinoma in the cirrhotic liver: challenges and controversies. Radiology. 2008;247:311–30. doi: 10.1148/radiol.2472061331. [DOI] [PubMed] [Google Scholar]
- 41.Sano K, Ichikawa T, Motosugi U, Sou H, Muhi AM, Matsuda M. Imaging study of early hepatocellular carcinoma: usefulness of gadoxetic acid-enhanced MR imaging. Radiology. 2011;261:834–44. doi: 10.1148/radiol.11101840. et al. [DOI] [PubMed] [Google Scholar]
- 42.Robert M. A comparison of hepatopathologists’ and community pathologists’ review of liver biopsy specimens from patients with hepatitis C. Clin Gastroenterol Hepatol. 2009;7:335–8. doi: 10.1016/j.cgh.2008.11.029. [DOI] [PMC free article] [PubMed] [Google Scholar]
- 43.Kim YK, Lee YH, Kim CS, Han YM. Added diagnostic value of T2-weighted MR imaging to gadolinium-enhanced three-dimensional dynamic MR imaging for the detection of small hepatocellular carcinomas. Eur J Radiol. 2008;67:304–10. doi: 10.1016/j.ejrad.2007.07.001. [DOI] [PubMed] [Google Scholar]
- 44.Piana G, Trinquart L, Meskine N, Barrau V, Beers BV, Vilgrain V. New MR imaging criteria with a diffusion-weighted sequence for the diagnosis of hepatocellular carcinoma in chronic liver diseases. J Hepatol. 2011;55:126–32. doi: 10.1016/j.jhep.2010.10.023. [DOI] [PubMed] [Google Scholar]
- 45.Ahn SS, Kim MJ, Lim JS, Hong HS, Chung YE, Choi JY. Added value of gadoxetic acid-enhanced hepatobiliary phase MR imaging in the diagnosis of hepatocellular carcinoma. Radiology. 2010;255:459–66. doi: 10.1148/radiol.10091388. [DOI] [PubMed] [Google Scholar]
- 46.Kim TK, Lee KH, Jang HJ, Haider MA, Jacks LM, Menezes RJ. Analysis of gadobenate dimeglumine-enhanced MR findings for characterizing small (1-2-cm) hepatic nodules in patients at high risk for hepatocellular carcinoma. Radiology. 2011;259:730–8. doi: 10.1148/radiol.11101549. et al. [DOI] [PubMed] [Google Scholar]
- 47.Kierans AS, Makkar J, Guniganti P, Kierans AS, Makkar J, Guniganti P. Validation of Liver Imaging Reporting and Data System 2017 (LI-RADS) criteria for imaging diagnosis of hepatocellular carcinoma. J Magn Reson Imaging. 2019;49:e205–e15. doi: 10.1002/jmri.26329. et al. [DOI] [PubMed] [Google Scholar]
- 48.Chernyak V, Fowler KJ, Kamaya A, Chernyak V, Fowler KJ, Kamaya A. Liver Imaging Reporting and Data System (LI-RADS) Version 2018: Imaging of hepatocellular carcinoma in at-risk patients. Radiology. 2018;289:81630. doi: 10.1148/radiol.2018181494. et al. [DOI] [PMC free article] [PubMed] [Google Scholar]
- 49.Kamath A, Roudenko A, Hecht E, Sirlin C, Chernyak V, Fowler K. CT/MR LI-RADS 2018: Clinical implications and management recommendations. Abdom Radiol. 2019;44:1306–22. doi: 10.1007/s00261-018-1868-6. et al. [DOI] [PubMed] [Google Scholar]
- 50.Cannella R, Fowler KJ, Borhani AA, Minervini MI, Heller M, Furlan A. Common pitfalls when using the Liver Imaging Reporting and Data System (LI-RADS): lessons learned from a multi-year experience. Abdom Radiol. 2019;44:43–53. doi: 10.1007/s00261-018-1720-z. [DOI] [PubMed] [Google Scholar]
- 51.Ishigami K, Yoshimitsu K, Nishihara Y, Irie H, Asayama Y, Tajima T. Hepatocellular carcinoma with a pseudocapsule on gadolinium-enhanced MR images: correlation with histopathologic findings. Radiology. 2009;250:435–43. doi: 10.1148/radiol.2501071702. et al. [DOI] [PubMed] [Google Scholar]
- 52.Narsinh KH, Cui J, Papadatos D, Sirlin CB, Santillan CS. Hepatocarcinogenesis and LI-RADS. Abdom Radiol. 2018;43:158–68. doi: 10.1007/s00261-017-1409-8. [DOI] [PubMed] [Google Scholar]
- 53.Cabibbo G, Enea M, Attanasio M, Bruix J, Craxi A, Camma C. A metaanalysis of survival rates of untreated patients in randomized clinical trials of hepatocellular carcinoma. Hepatology. 2010;51:1274–83. doi: 10.1002/hep.23485. [DOI] [PubMed] [Google Scholar]
- 54.Marrero JA, Fontana RJ, Barrat A, Askari F, Conjeevaram HS, Su GL. Prognosis of hepatocellular carcinoma: comparison of 7 staging systems in an American cohort. Hepatology. 2005;41:707–16. doi: 10.1002/hep.20636. et al. [DOI] [PubMed] [Google Scholar]
- 55.Cillo U, Bassanello M, Vitale A, Grigoletto FA, Burra P, Fagiuoli S. The critical issue of hepatocellular carcinoma prognostic classification: which is the best tool available? J Hepatol. 2004;40:124–31. doi: 10.1016/j.jhep.2003.09.027. et al. [DOI] [PubMed] [Google Scholar]
- 56.Forner A, Reig M, Bruix J. Hepatocellular carcinoma. Lancet. 2018;391:1301–14. doi: 10.1016/S0140-6736(18)30010-2. [DOI] [PubMed] [Google Scholar]
- 57.Marasco G, Serenari M, Renzulli M, Alemanni LV, Rossini B, Pettinari I. Clinical impact of sarcopenia assessment in patients with hepatocellular carcinoma undergoing treatments. J Gastroenterol. 2020;55:927–943. doi: 10.1007/s00535-020-01711-w. et al. [DOI] [PMC free article] [PubMed] [Google Scholar]
- 58.Harimoto N, Yoshizumi T, Shimokawa M, Sakata K, Kimura K, Itoh S. Sarcopenia is a poor prognostic factor following hepatic resection in patients aged 70 years and older with hepatocellular carcinoma. Hepatol Res. 2016;46:1247–55. doi: 10.1111/hepr.12674. et al. [DOI] [PubMed] [Google Scholar]
- 59.Loosen SH, Schulze-Hagen M, Bruners P, Tacke F, Trautwein C, Kuhl C. Sarcopenia is a negative prognostic factor in patients undergoing transarterial chemoembolization (TACE) for hepatic malignancies. Cancers. 2019;11:1503. doi: 10.3390/cancers11101503. et al. [DOI] [PMC free article] [PubMed] [Google Scholar]
- 60.Harimoto N, Shirabe K, Yamashita Y-I, Ikegami T, Yoshizumi T, Soejima Y. Sarcopenia as a predictor of prognosis in patients following hepatectomy for hepatocellular carcinoma. Br J Surg. 2013;100:1523–30. doi: 10.1002/bjs.9258. et al. [DOI] [PubMed] [Google Scholar]
- 61.Voron T, Tselikas L, Pietrasz D, Pigneur F, Laurent A, Compagnon P. Sarcopenia impacts on short- and long-term results of hepatectomy for hepatocellular carcinoma. Ann Surg. 2015;261:1173–83. doi: 10.1097/SLA.0000000000000743. et al. [DOI] [PubMed] [Google Scholar]
- 62.Kojiro M. Pathological evolution of early hepatocellular carcinoma. Oncology. 2002;62:43–7. doi: 10.1159/000048275. [DOI] [PubMed] [Google Scholar]
- 63.Bartolozzi C, Crocetti L, Lencioni R, Cioni D, Della Pina C, Campani D. Biliary and reticuloendothelial impairment in hepatocarcinogenesis: the diagnostic role of tissue-specific MR contrast media. Eur Radiol. 2007;17:2519–30. doi: 10.1007/s00330-007-0602-5. [DOI] [PubMed] [Google Scholar]
- 64.Nasu K, Kuroki Y, Tsukamoto T, Nakajima H, Mori K, Minami M. Diffusion-weighted imaging of surgically resected hepatocellular carcinoma: imaging characteristics and relationship among signal intensity, apparent diffusion coefficient, and histopathologic grade. AJR Am J Roentgenol. 2009;193:438–44. doi: 10.2214/AJR.08.1424. [DOI] [PubMed] [Google Scholar]
- 65.Cruite I, Schroeder M, Merkle EM, Sirlin CB. Gadoxetate disodium-enhanced MRI of the liver: part 2, protocol optimization and lesion appearance in the cirrhotic liver. AJR Am J Roentgenol. 2010;195:29–41. doi: 10.2214/AJR.10.4538. [DOI] [PubMed] [Google Scholar]
- 66.Vasuri F, Golfieri R, Fiorentino M, Capizzi E, Renzulli M, Pinna AD. OATP 1B1/1B3 expression in hepatocellular carcinomas treated with orthotopic liver transplantation. Virchows Arch. 2011;459:141–6. doi: 10.1007/s00428-011-1099-5. et al. [DOI] [PubMed] [Google Scholar]
- 67.Golfieri R, Garzillo G, Ascanio S, Renzulli M. Focal lesions in the cirrhotic liver: their pivotal role in gadoxetic acid-enhanced MRI and recognition by the Western guidelines. Dig Dis. 2014;32:696–704. doi: 10.1159/000368002. [DOI] [PubMed] [Google Scholar]
- 68.Durnez A, Verslype C, Nevens F, Fevery J, Aerts R, Pirenne J. The clinicopathological and prognostic relevance of cytokeratin 7 and 19 expression in hepatocellular carcinoma. A possible progenitor cell origin. Histopathology. 2006;49:138–51. doi: 10.1111/j.1365-2559.2006.02468.x. et al. [DOI] [PubMed] [Google Scholar]
- 69.Vasuri F, Renzulli M, Fittipaldi S, Brocchi S, Clemente A, Cappabianca S. Pathobiological and radiological approach for hepatocellular carcinoma subclassification. Sci Rep. 2019;9:14749. doi: 10.1038/s41598-019-51303-9. et al. [DOI] [PMC free article] [PubMed] [Google Scholar]
- 70.Narita M, Hatano E, Arizono S, Miyagawa-Hayashino A, Isoda H, Kitamura K. Expression of OATP1B3 determines uptake of Gd-EOB-DTPA in hepatocellular carcinoma. J Gastroenterol. 2009;44:793–8. doi: 10.1007/s00535-009-0056-4. et al. [DOI] [PubMed] [Google Scholar]
- 71.Granito A, Galassi M, Piscaglia F, Romanini L, Lucidi V, Renzulli M. Impact of gadoxetic acid (Gd-EOB-DTPA)-enhanced magnetic resonance on the non-invasivediagnosis of small hepatocellular carcinoma: a prospective study. Aliment Pharmacol Ther. 2013;37:355–63. doi: 10.1111/apt.12166. et al. [DOI] [PubMed] [Google Scholar]
- 72.Ichikawa T, Sano K, Morisaka H. Diagnosis of pathologically early HCC with EOB-MRI: experiences and current consensus. Liver Cancer. 2014;3:97107. doi: 10.1159/000343865. [DOI] [PMC free article] [PubMed] [Google Scholar]
- 73.Golfieri R, Renzulli M, Lucidi V, Corcioni B, Trevisani F, Bolondi L. Contribution of the hepatobiliary phase of Gd-EOB-DTPA-enhanced MRI to Dynamic MRI in the detection of hypovascular small (≤ 2 cm) HCC in cirrhosis. Eur Radiol. 2011;21:1233–42. doi: 10.1007/s00330-010-2030-1. [DOI] [PubMed] [Google Scholar]
- 74.Renzulli M, Golfieri R. Bologna Liver Oncology Group (BLOG). Proposal of a new diagnostic algorithm for hepatocellular carcinoma based on the Japanese guidelines but adapted to the Western world for patients under surveillance for chronic liver disease. J Gastroenterol Hepatol. 2016;31:69–80. doi: 10.1111/jgh.13150. [DOI] [PubMed] [Google Scholar]
- 75.Golfieri R, Grazioli L, Orlando E, Dormi A, Lucidi L, Corcioni B. Which is the best MRI marker of malignancy for atypical cirrhotic nodules: hypointensity in hepatobiliary phase alone or combined with other features? Classification after Gd-EOB-DTPA administration. J Magn Reson Imaging. 2012;36:648–57. doi: 10.1002/jmri.23685. et al. [DOI] [PubMed] [Google Scholar]
- 76.Kim T, Murakami T, Hasuike Y, Gotoh M, Kato N, Takahashi M. Experimental hepatic dysfunction: evaluation by MRI with Gd-EOB-DTPA. J Magn Reson Imaging. 1997;7:683–8. doi: 10.1002/jmri.1880070413. et al. [DOI] [PubMed] [Google Scholar]
- 77.Taouli B. Diffusion-weighted MR imaging for liver lesion characterization: a critical look. Radiology. 2012;262:378–80. doi: 10.1148/radiol.11112417. [DOI] [PubMed] [Google Scholar]
- 78.Takayama T, Makuuchi M, Hirohashi S, Sakamoto M, Okazaki N, Takayasu K. Malignant transformation of adenomatous hyperplasia to hepatocellular carcinoma. Lancet. 1990;336:1150–3. doi: 10.1016/0140-6736(90)92768-d. et al. [DOI] [PubMed] [Google Scholar]
- 79.Roncalli M, Roz E, Coggi G, Di Rocco MG, Bossi P, Minola E. The vascular profile of regenerative and dysplastic nodules of the cirrhotic liver: implications for diagnosis and classification. Hepatology. 1999;30:1174–8. doi: 10.1002/hep.510300507. et al. [DOI] [PubMed] [Google Scholar]
- 80.Koh DM, Collins DJ. Diffusion-weighted MRI in the body: applications and challenges in oncology. AJR Am J Roentgenol. 2007;188:1622–35. doi: 10.2214/AJR.06.1403. [DOI] [PubMed] [Google Scholar]
- 81.van den Bos IC, Hussain SM, Dwarkasing RS, Hop WCJ, Zondervan PE, de Man RA. MR imaging of hepatocellular carcinoma: relationship between lesion size and imaging findings, including signal intensity and dynamic enhancement patterns. J Magn Reson Imaging. 2007;26:1548–55. doi: 10.1002/jmri.21046. et al. [DOI] [PubMed] [Google Scholar]
- 82.Bruegel M, Holzapfel K, Gaa J, Bruegel M, Holzapfel K, Gaa J. Characterization of focal liver lesions by ADC measurements using a respiratory triggered diffusion-weighted single-shot echo-planar MR imaging technique. Eur Radiol. 2008;18:477–85. doi: 10.1007/s00330-007-0785-9. et al. [DOI] [PubMed] [Google Scholar]
- 83.Lee MH, Kim SH, Park MJ, Park CK, Rhim H. Gadoxetic acid-enhanced hepatobiliary phase MRI and high-b-value diffusion-weighted imaging to distinguish well-differentiated hepatocellular carcinomas from benign nodules in patients with chronic liver disease. AJR Am J Roentgenol. 2011;197:W868–75. doi: 10.2214/AJR.10.6237. [DOI] [PubMed] [Google Scholar]
- 84.Sandrasegaran K, Akisik FM, Lin C, Tahir B, Rajan J, Saxena R. Value of diffusion-weighted MRI for assessing liver fibrosis and cirrhosis. AJR Am J Roentgenol. 2009;193:1556–60. doi: 10.2214/AJR.09.2436. et al. [DOI] [PubMed] [Google Scholar]
- 85.Park MJ, Kim YK, Lee MW, Lee WJ, Kim YS, Kim SH. Small hepatocellular carcinomas: improved sensitivity by combining gadoxetic acid-enhanced and diffusion-weighted MR imaging patterns. Radiology. 2012;264:761–70. doi: 10.1148/radiol.12112517. et al. [DOI] [PubMed] [Google Scholar]
- 86.Kadoya M, Matsui O, Takashima T, Nonomura A. Hepatocellular carcinoma: correlation of MR imaging and histopathologic findings. Radiology. 1992;183:819–25. doi: 10.1148/radiology.183.3.1316622. [DOI] [PubMed] [Google Scholar]
- 87.Channual S, Tan N, Siripongsakun S, Lassman C, Lu DS, Raman SS. Gadoxetate disodium-enhanced MRI to differentiate dysplastic nodules and grade of hepatocellular carcinoma: Correlation with histopathology. AJR Am J Roentgenol. 2015;205:546–53. doi: 10.2214/AJR.14.12716. [DOI] [PubMed] [Google Scholar]
- 88.Hwang J, Kim YK, Jeong WK, Choi D, Rhim H, Lee WJ. Nonhypervascular hypointense nodules at gadoxetic acid-enhanced MR imaging in chronic liver disease: Diffusion-weighted imaging for characterization. Radiology. 2015;276:137–46. doi: 10.1148/radiol.15141350. [DOI] [PubMed] [Google Scholar]
- 89.Kim T, Baron RL, Nalesnik MA. Infarcted regenerative nodules in cirrhosis: CT and MR imaging findings with pathologic correlation. AJR Am J Roentgenol. 2000;175:1121–5. doi: 10.2214/ajr.175.4.1751121. [DOI] [PubMed] [Google Scholar]
- 90.Miyayama S, Yamashiro M, Okuda M, Yoshie Y, Nakashima Y, Ikeno H. Detection of corona enhancement of hypervascular hepatocellular carcinoma by C-arm dual-phase cone-beam CT during hepatic arteriography. Cardiovasc Intervent Radiol. 2011;34:81–6. doi: 10.1007/s00270-010-9835-9. et al. [DOI] [PubMed] [Google Scholar]
- 91.Santillan C, Fowler K, Kono Y, Chernyak V. LI-RADS major features: CT, MRI with extracellular agents, and MRI with hepatobiliary agents. Abdom Radiol. 2018;43:75–81. doi: 10.1007/s00261-017-1291-4. [DOI] [PubMed] [Google Scholar]
- 92.Stevens WR, Gulino SP, Batts KP, Stephens DH, Johnson CD. Mosaic pattern of hepatocellular carcinoma: Histologic basis for a characteristic CT appearance. J Comput Assist Tomogr. 1996;20:337–42. doi: 10.1097/00004728-199605000-00001. [DOI] [PubMed] [Google Scholar]
- 93.Park HJ, Jang KM, Kang TW, Song KD, Kim SH, Kim YK. Identification of imaging predictors discriminating different primary liver tumours in patients with chronic liver disease on gadoxetic acid-enhanced MRI: a classification tree analysis. Eur Radiol. 2016;26:3102–11. doi: 10.1007/s00330-015-4136-y. et al. [DOI] [PubMed] [Google Scholar]
- 94.Paik N, Sinn DH, Lee JH, Oh IS, Kim JH, Kang W. Non-invasive tests for liver disease severity and the hepatocellular carcinoma risk in chronic hepatitis B patients with low-level viremia. Liver Int. 2018;38:68–75. doi: 10.1111/liv.13489. et al. [DOI] [PubMed] [Google Scholar]
- 95.Marasco G, Colecchia A, Silva G, Rossini B, Eusebi LH, Ravaioli F. Non-invasive tests for the prediction of primary hepatocellular carcinoma. World J Gastroenterol. 2020;26:3326–43. doi: 10.3748/wjg.v26.i24.3326. et al. [DOI] [PMC free article] [PubMed] [Google Scholar]
- 96.Leoni S, Piscaglia F, Golfieri R, Camaggi V, Vidili G, Pini P. The impact of vascular and nonvascular findings on the noninvasive diagnosis of small hepatocellular carcinoma based on the EASL and AASLD criteria. Am J Gastroenterol. 2010;105:599–609. doi: 10.1038/ajg.2009.654. et al. [DOI] [PubMed] [Google Scholar]
- 97.Choi JW, Lee JM, Kim SJ, Yoon JH, Baek JH, Han JK. Hepatocellular carcinoma: imaging patterns on gadoxetic acid-enhanced MR Images and their value as an imaging biomarker. Radiology. 2013;267:776–86. doi: 10.1148/radiol.13120775. et al. [DOI] [PubMed] [Google Scholar]
- 98.Kim YK, Lee WJ, Park MJ, Kim SH, Rhim H, Choi D. Hypovascular hypointense nodules on hepatobiliary phase gadoxetic acid-enhanced MR images in patients with cirrhosis: potential of DW imaging in predicting progression to hypervascular HCC. Radiology. 2012;265:104–14. doi: 10.1148/radiol.12112649. [DOI] [PubMed] [Google Scholar]
- 99.Hyodo T, Murakami T, Imai Y, Okada M, Hori M, Kagawa Y. Hypovascular nodules in patients with chronic liver disease: risk factors for development of hypervascular hepatocellular carcinoma. Radiology. 2013;266:480–90. doi: 10.1148/radiol.12112677. et al. [DOI] [PubMed] [Google Scholar]
- 100.Kumada T, Toyoda H, Tada T, Sone Y, Fujimori M, Ogawa S. Evolution of hypointense hepatocellular nodules observed only in the hepatobiliary phase of gadoxetate disodium-enhanced MRI. AJR Am J Roentgenol. 2011;197:58–63. doi: 10.2214/AJR.10.5390. et al. [DOI] [PubMed] [Google Scholar]
- 101.Yoon JH, Lee JM, Yang HK, Lee KB, Jang JJ, Han JK. Non-hypervascular hypointense nodules ≥1 cm on the hepatobiliary phase of gadoxetic acid-enhanced magnetic resonance imaging in cirrhotic livers. Dig Dis. 2014;32:678–89. doi: 10.1159/000368000. et al. [DOI] [PubMed] [Google Scholar]
- 102.Motosugi U, Ichikawa T, Sano K, Motosugi U, Ichikawa T, Sano K. Outcome of hypovascular hepatic nodules revealing no gadoxetic acid uptake in patients with chronic liver disease. J Magn Reson Imaging. 2011;34:88–94. doi: 10.1002/jmri.22630. et al. [DOI] [PubMed] [Google Scholar]
- 103.Efremidis SC, Hytiroglou P, Matsui O. Enhancement patterns and signal-intensity characteristics of small hepatocellular carcinoma in cirrhosis: pathologic basis and diagnostic challenges. Eur Radiol. 2007;17:2969–82. doi: 10.1007/s00330-007-0705-z. [DOI] [PubMed] [Google Scholar]
- 104.Yu MH, Kim JH, Yoon JH, Kim HC, Chung JW, Han JK. Small (≤1-cm) hepatocellular carcinoma: diagnostic performance and imaging features at gadoxetic acid-enhanced MR imaging. Radiology. 2014;271:748–60. doi: 10.1148/radiol.14131996. et al. [DOI] [PubMed] [Google Scholar]
- 105.Jeong YY, Mitchell DG, Kamishima T. Small (<20 mm) enhancing hepatic nodules seen on arterial phase MR imaging of the cirrhotic liver: clinical implications. AJR Am J Roentgenol. 2002;178:1327–34. doi: 10.2214/ajr.178.6.1781327. [DOI] [PubMed] [Google Scholar]
- 106.Holland AE, Hecht EM, Hahn WY, Holland AE, Hecht EM, Hahn WY. Importance of small (< or = 20-mm) enhancing lesions seen only during the hepatic arterial phase at MR imaging of the cirrhotic liver: evaluation and comparison with whole explanted liver. Radiology. 2005;237:938–44. doi: 10.1148/radiol.2373041364. et al. [DOI] [PubMed] [Google Scholar]
- 107.Hussain HK, Syed I, Nghiem HV, Johnson TD, Carlos RC, Weadock WJ. T2-weighted MR imaging in the assessment of cirrhotic liver. Radiology. 2004;230:637–44. doi: 10.1148/radiol.2303020921. et al. [DOI] [PubMed] [Google Scholar]
- 108.Kim JE, Kim SH, Lee SJ, Rhim H. Hypervascular hepatocellular carcinoma 1 cm or smaller in patients with chronic liver disease: characterization with gadoxetic acid-enhanced MRI that includes diffusion-weighted imaging. AJR Am J Roentgenol. 2011;196:W758–65. doi: 10.2214/AJR.10.4394. [DOI] [PubMed] [Google Scholar]
- 109.Semelka RC, Brown ED, Ascher SM, Patt RH, Bagley AS, Li W. Hepatic hemangiomas: a multi-institutional study of appearance on T2-weighted and serial gadolinium-enhanced gradient-echo MR images. Radiology. 1994;192:401–6. doi: 10.1148/radiology.192.2.8029404. et al. [DOI] [PubMed] [Google Scholar]
- 110.Kitao A, Zen Y, Matsui O, Kitao A, Zen Y, Matsui O. Hepatocellular carcinoma: signal intensity at gadoxetic acid-enhanced MR Imaging--correlation with molecular transporters and histopathologic features. Radiology. 2010;256:817–26. doi: 10.1148/radiol.10092214. et al. [DOI] [PubMed] [Google Scholar]
- 111.Leonhardt M, Keiser M, Oswald S, Kühn J, Jia J, Grube M. Hepatic uptake of the magnetic resonance imaging contrast agent Gd-EOB-DTPA: role of human organic anion transporters. Drug Metab Dispos. 2010;38:1024–8. doi: 10.1124/dmd.110.032862. et al. [DOI] [PubMed] [Google Scholar]
- 112.Asayama Y, Tajima T, Nishie A, Ishigami K, Kakihara D, Nakayama T. Uptake of Gd-EOB-DTPA by hepatocellular carcinoma: radiologic-pathologic correlation with special reference to bile production. Eur J Radiol. 2011;80:e243–8. doi: 10.1016/j.ejrad.2010.10.032. et al. [DOI] [PubMed] [Google Scholar]
- 113.Grazioli L, Morana G, Caudana R, Benetti A, Portolani N, Talamini G. Hepatocellular carcinoma: correlation between gadobenate dimeglumine-enhanced MRI and pathologic findings. Invest Radiol. 2000;35:25–34. doi: 10.1097/00004424-200001000-00003]. et al. [DOI] [PubMed] [Google Scholar]
- 114.Tsuda N, Kato N, Murayama C, Narazaki M, Yokawa T. Potential for differential diagnosis with gadolinium-ethoxybenzyl-diethylenetriamine pentaacetic acid-enhanced magnetic resonance imaging in experimental hepatic tumors. Invest Radiol. 2004;39:80–8. doi: 10.1097/01.rli.0000105331.11373.c0. [DOI] [PubMed] [Google Scholar]
- 115.Vavricka SR, Jung D, Fried M, Grützner U, Meier PJ, Kullak-Ublick GA. The human organic anion transporting polypeptide 8 (SLCO1B3) gene is transcriptionally repressed by hepatocyte nuclear factor 3 beta in hepatocellular carcinoma. J Hepatol. 2004;40:212–8. doi: 10.1016/j.jhep.2003.10.008. [DOI] [PubMed] [Google Scholar]
- 116.Tsuboyama T, Onishi H, Kim T, Akita H, Hori M, Tatsumi M. Hepatocellular carcinoma: hepatocyte-selective enhancement at gadoxetic acid-enhanced MR imaging-correlation with expression of sinusoidal and canalicular transporters and bile accumulation. Radiology. 2010;255:82433. doi: 10.1148/radiol.10091557. et al. [DOI] [PubMed] [Google Scholar]
- 117.Kondo Y, Nakajima T. Pseudoglandular hepatocellular carcinoma. 10.1002/1097-0142(19870901)60:5<1032::aid-cncr2820600518>3.0.co;2-k. A morphogenetic study. Cancer. 1987;60:1032–7. doi: 10.1002/1097-0142(19870901)60:5<1032::aid-cncr2820600518>3.0.co;2-k. [DOI] [PubMed] [Google Scholar]
- 118.Kim JY, Kim MJ, Kim KA, Jeong HT, Park YN. Hyperintense HCC on hepatobiliary phase images of gadoxetic acid-enhanced MRI: correlation with clinical and pathological features. Eur J Radiol. 2012;81:3877–82. doi: 10.1016/j.ejrad.2012.07.021. [DOI] [PubMed] [Google Scholar]
- 119.Yoneda N, Matsui O, Kitao A, Kita R, Kozaka K, Koda W. Hypervascular hepatocellular carcinomas showing hyperintensity on hepatobiliary phase of gadoxetic acid-enhanced magnetic resonance imaging: a possible subtype with mature hepatocyte nature. Jpn J Radiol. 2013;31:480–90. doi: 10.1007/s11604-013-0224-6. et al. [DOI] [PubMed] [Google Scholar]
- 120.Kitao A, Matsui O, Yoneda N, Kita R, Kozaka K, Kobayashi S. Differentiation between hepatocellular carcinoma showing hyperintensity on the hepatobiliary phase of gadoxetic acid-enhanced MRI and focal nodular hyperplasia by CT and MRI. AJR Am J Roentgenol. 2018;211:347–57. doi: 10.2214/AJR.17.19341. et al. [DOI] [PubMed] [Google Scholar]
- 121.Vilgrain V, Lewin M, Vons C, Denys A, Valla D, Flejou JF. Hepatic nodules in Budd–Chiari syndrome: imaging features. Radiology. 1999;210:443–50. doi: 10.1148/radiology.210.2.r99fe13443. et al. [DOI] [PubMed] [Google Scholar]
- 122.Renzulli M, Lucidi V, Mosconi C, Quarneti C, Giampalma E, Golfieri R. Large regenerative nodules in a patient with Budd–Chiari syndrome after TIPS positioning while on the liver transplantation list diagnosed by Gd-EOB-DTPA MRI. Hepatobiliary Pancreat Dis Int. 2011;10:439–42. doi: 10.1016/s1499-3872(11)60075-1. [DOI] [PubMed] [Google Scholar]