

Abstract
Purpose
To determine how to optimize the delivery of machine learning techniques in a clinical setting to detect intracranial hemorrhage (ICH) on non–contrast-enhanced CT images to radiologists to improve workflow.
Materials and Methods
In this study, a commercially available machine learning algorithm that flags abnormal noncontrast CT examinations for ICH was implemented in a busy academic neuroradiology practice between September 2017 and March 2019. The algorithm was introduced in three phases: (a) as a “pop-up” widget on ancillary monitors, (b) as a marked examination in reading worklists, and (c) as a marked examination for reprioritization based on the presence of the flag. A statistical approach, which was based on a queuing theory, was implemented to assess the impact of each intervention on queue-adjusted wait and turnaround time compared with historical controls.
Results
Notification with a widget or flagging the examination had no effect on queue-adjusted image wait (P > .99) or turnaround time (P = .6). However, a reduction in queue-adjusted wait time was observed between negative (15.45 minutes; 95% CI: 15.07, 15.38) and positive (12.02 minutes; 95% CI: 11.06, 12.97; P < .0001) artificial intelligence–detected ICH examinations with reprioritization. Reduced wait time was present for all order classes but was greatest for examinations ordered as routine for both inpatients and outpatients because of their low priority.
Conclusion
The approach used to present flags from artificial intelligence and machine learning algorithms to the radiologist can reduce image wait time and turnaround times.
© RSNA, 2021
See also the commentary by O’Connor and Bhalla in this issue.
Summary
Implementation of an algorithm for the detection of intracranial hemorrhage on non–contrast-enhanced head CT studies into the clinical workflow reduced wait time, and thus overall turnaround time, when specifically used to prioritize examinations.
Key Points
■ Active reprioritization of the worklist significantly reduced the wait time for examinations with artificial intelligence (AI)–identified presence of intracranial hemorrhage (ICH) compared with those without AI (12.01 minutes per study during phase 3 vs 15.75 minutes per study during baseline, P < .0001).
■ An ancillary widget and worklist flag indicating ICH, as indicated by an acute AI detection tool and integrated into the radiologist workflow, had no significant impact on examination wait time (16.09 minutes per study during phase 1, 14.88 minutes per study during phase 2, 15.76 minutes per study at baseline).
■ Queuing models provide a framework for the analysis of the impact of AI tools and other tools on diagnostic radiologist workflow.
Introduction
Acute intracranial hemorrhage (ICH) occurs in various compartments within the cranial vault as a result of traumatic and nontraumatic causes. Non–contrast-enhanced CT has high sensitivity for the detection of ICH and remains the most commonly used initial test for most brain imaging (1), largely because of its rapid acquisition and general broad availability. Although the etiology, distribution, and associated secondary effects of ICH vary widely, rapid and accurate detection of ICH is critical to directing appropriate management or triaging of patients suspected of having ICH. Because of the algorithmic nature of acute care, the rapid classification of patients as positive or negative for ICH often determines an early decision point in their treatment, for example, the use of thrombolytic therapy in ischemic infarcts. Clinically valuable binary classification of patients using a sensitive imaging test lends itself well to machine learning algorithms, which is likely why these algorithms are among the first clinically applicable and commercially available devices to come to fruition in clinical application of machine learning in medical imaging.
Algorithms for the detection of ICH on non–contrast-enhanced CT images have recently reported very high accuracy on validation datasets, with areas under the receiver operating characteristic curve reaching as high as 0.99 with 98% sensitivity and 99% specificity (2–6) and with a reduction in median time to diagnosis (2). However, the outputs of these algorithms require application of common sense, contextual awareness, and judgment in their interpretation to be applied safely and effectively for patient care. Additionally, the generalizability of these models to broader populations is unknown, and the best practices for integration of these algorithms into real-time workflows remain undefined. Because report turnaround time is an important component of the imaging-to-treatment time, efficiencies introduced to expedite the interpretation of non–contrast-enhanced CT have the potential to improve patient outcomes (7).
With an ever-increasing volume of cross-sectional imaging and increasing clinical workload for radiologists (8), machine learning implementations have the potential to improve radiologist productivity and accuracy. The adoption of artificial intelligence (AI) and machine learning algorithms is dependent on the demonstration of a tangible effect on patient care and an improvement in radiologist workflow. Thus, in this study, we aimed to assess whether (a) the introduction of an algorithm for the detection of ICH at noncontrast CT would affect turnaround times and (b) if the impact on turnaround time was dependent on the manner in which information was presented in the radiologist workflow.
Materials and Methods
Experimental Design
This study of the impact of an AI tool on radiologist reading workflow was approved by the institutional review board at the authors’ institution. A high-level process diagram illustrating the existing radiologist reading workflow is shown in Figure 1, A. As each imaging examination is marked completed by the technologist, it is placed on the radiologist’s worklist or queue with the most recently completed examination placed at the bottom of the list. Examinations with higher priority (typically based on the imaging order priority as defined by the referring physician) are placed higher in the list regardless of the time of insertion. The existing workflow included the following worklist prioritization levels (high to low): (i) stroke protocol, (ii) emergency department, (iii) inpatient highest order priority as selected by the ordering provider (STAT), (iv) inpatient urgent, (v) inpatient routine, (vi) outpatient STAT, (vii) outpatient urgent, and (viii) outpatient routine.
Figure 1:
![A, High-level process diagram illustrates the radiologist reading workflow. As each imaging examination was completed, it was placed on the radiologist’s worklist or queue, with the most recent examination placed at the bottom of the list. Examinations with higher priority (typically based on the order priority: STAT [highest order priority as selected by the ordering provider], urgent order priority, routine order priority) are placed higher in the list regardless of the time of insertion. B, Overview of data collection phases. Data were collected during a control interval (phase 0) and with the three approaches as described in the methods.](https://www.ncbi.nlm.nih.gov/core/lw/2.0/html/tileshop_pmc/tileshop_pmc_inline.html?title=Click%20on%20image%20to%20zoom&p=PMC3&id=8043365_ryai.2020200024.fig1.jpg)
A, High-level process diagram illustrates the radiologist reading workflow. As each imaging examination was completed, it was placed on the radiologist’s worklist or queue, with the most recent examination placed at the bottom of the list. Examinations with higher priority (typically based on the order priority: STAT [highest order priority as selected by the ordering provider], urgent order priority, routine order priority) are placed higher in the list regardless of the time of insertion. B, Overview of data collection phases. Data were collected during a control interval (phase 0) and with the three approaches as described in the methods.
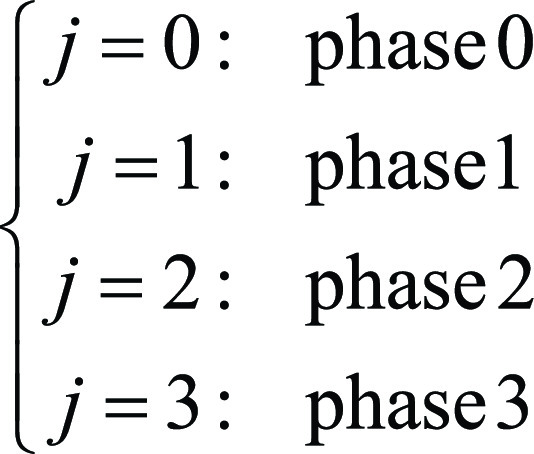
To examine the effect of the manner of presentation of the finding to the radiologist, we presented positive findings from the AI tool in three ways. In phase 1, a notification widget on the radiologists’ ancillary monitor with a list of detected examinations from the prior 24 hours that the tool flagged as positive for ICH as well as key images uploaded into the picture archiving and communication system (PACS). In phase 2, a yellow flag labeled “AI” was added to the worklist to notify the radiologist of a finding in addition to a notification by the widget. In phase 3, positive examinations detected by the tool were reprioritized to the top of the worklist, categorized as “Acute AI,” and moved just under examinations with stroke protocol, in addition to being marked with the “AI” flag as in phase 2 and a notification generated by the widget (Fig 1, B). Visual examples of the appearance of the screens in phases 1, 2, and 3 are shown in Figure 2. The AI tool generated results in near real time after the examination arrived in the PACS. The processing time of the AI tool did not affect report turnaround time during any phase because the processing occurred prior to the examination being marked as ended and populating the reading worklist. No other substantial changes were made that could affect report turnaround time during the study period, including hardware, software, PACS, reading rooms, and staffing personnel. We then analyzed the effect of the AI tool for each phase on both the wait time and reprioritization during all three phases as well as its effect on reading time.
Figure 2:

Screenshots show the visual display of an artificial intelligence finding in a production reading environment. Left panel: phase 1 with widget only. Center panel: phase 2 with yellow flag in a worklist. Right panel: phase 3 with yellow flag and reprioritization in a worklist.
Patient Data Collection
All non–contrast-enhanced CT examinations performed between September 20, 2017, and March 31, 2019, and their corresponding reports were available for analysis. Phase 0 data from September 20, 2017, to March 31, 2018, were used as control data for comparison with data obtained in each subsequent phase following integration of this AI tool into the neuroradiology workflow for the detection of ICH at non–contrast-enhanced CT (AIDoc, New York, NY). Data were matched for each phase with the corresponding quarter, 1 year prior to implementation of this new tool to address potential seasonal variation. For each process step, time stamps were extracted from the electronic medical record (Epic Radiant, Verona, Wis) and the dictation system (Nuance Powerscribe, Burlington, Mass). End-of-examination time was defined as the time stamp corresponding with the technologist marking the examination ended in the electronic medical record. The primary study end point was the wait time, which was defined as the interval between end-of-examination time stamp and initial report creation time stamp. The secondary end point was the reading time, which was defined as the time between the first report creation and first report submission. Using these time stamps, we examined the relationship between the AI tool and the time a study spent in the worklist or wait time. Examinations performed outside of normal working hours were excluded to reduce confounding variables that could not be controlled for in the analysis, such as, for example, different faculty and trainee coverage models after hours and on weekends or variability in outpatients being scanned on some weekend days. Additionally, examinations identified as outliers because of technical factors or additional reconstructions were excluded if a time stamp error resulted in an erroneous reading time or waiting time of less than 0 or greater than 6 hours. Also, studies without an assigned order priority were excluded as they could not be appropriately assigned to an analysis group.
Statistical Analysis
By directly observing the wait time and queue size of a study, we sought to minimize those confounding effects that could affect the report turnaround time, such as reading room congestion. We propose a linear model to investigate the association between the number of examinations in the queue and the wait time. The first proposed model is as follows:
 |
where yi is the wait time for examination i; Qi is the queue size, as the number of equal or higher priority examinations already in the queue according to existing prioritization rules when examination i arrives plus any additional higher priority examinations arriving during examination i’s wait time; and εi summarizes all unexplained variability by the model. j and k are indicators of the AIDoc implementation phase and AI ICH prediction for examination i, such that
 |
and
 |
Because the AI tool was not implemented during phase 0, a00 = a01. The validity of these models was assessed by scatterplot and r2, where r2 was interpreted as a percentage variability explained by the model.
Of note in the proposed model, there is no intercept term. This is intentional in the case that, if there are no examinations in the queue and no examination was being read, the wait time of an incoming examination would be zero. Second, the examination priority (STAT, urgent inpatient, urgent outpatient, etc) is not directly considered. The effect of the priority is conveyed through the calculation of Qi and Qijk as they only count examinations with higher priority.
The proposed model also indicates that the effect of the AI tool interacts with the queue size. This was done because AI ICH prediction is essentially an additional triage algorithm that increases the priority of the AI ICH–positive examination. Thus, AI ICH–positive examinations would be marked and moved up in the queue; therefore, the wait time would be reduced for these specific examinations. On the other hand, if there are no examinations in the queue, there should be no difference in wait time regardless of the AI ICH result. We used analysis of covariance to test the difference among ajk (comparing slopes).
To compare reading times, a log-linear model was used to test the effect of AI ICH during each implementation phase after adjusting for priority, trainee or faculty, and implementation phase. A stepwise selection algorithm was used to select from all main and two-way interaction terms.
All analyses were performed in SAS 9.4 (SAS Institute, Cary, NC). Bonferroni adjustment was used for multiple comparison when appropriate. A P value of less than .05 was considered to represent statistical significance.
Results
Cohort Priority and Phase Characteristics
Table 1 shows the characteristics of the groups for each phase of the study. In the case of multiple examinations with different linked procedures (eg, CT brain and cervical spine) performed in the same patient and read concurrently, we grouped them into one study and assigned the highest priority within those examinations. We then excluded examinations in which at least one examination linked with the study was performed after hours or on a weekend. A total of 6.73% (483 of 7179) of examinations were excluded for technical factors, which resulted in a total of 6696 examinations used in the subsequent analyses. As shown in Table 1, prevalence of AI ICH prediction and order priorities were comparable among the different cohorts. Median wait time and reading time for each order priority at baseline are shown in Figure 3, which indicates that the major bottleneck in report turnaround time was the wait time in examinations with lower-order priorities.
Table 1:
Characteristics of the Cohorts in Each Phase

Figure 3:

Median wait time and reading time prior to interventions. ER = emergency room, IP = inpatient, OP = outpatient, R = routine, STAT = highest order priority as selected by the ordering provider, UR = urgent order priority.
Effect on Wait Time for Each Phase
A linear relationship between queue size and wait time was observed for all priorities (Fig 4) with r2 of 0.67. No difference in queue size adjusted wait time (Table 2, Fig 5) was found between AI ICH–positive and AI ICH–negative examinations during phase 1 and 2 (Bonferroni adjusted P > .99 and .99) or between AI ICH–positive examinations during phase 1 and 2 and examinations during baseline (adjusted P > .99 and P = .6). However, a reduction in wait time between AI ICH–positive (12.01 minutes; 95% CI: 11.06, 12.97) and negative (15.45 minutes; 95% CI: 15.07, 15.83; P < .0001) examinations, as well as baseline (15.75 minutes; 95% CI: 15.39, 16.11; P < .0001), was observed in phase 3.
Figure 4:

Scatterplot of wait time versus queue size for all phases of the study. A linear relationship between queue size and wait time was observed. A regression line indicating the wait time as a function of queue size has been added. Neither the widget (phase 1) nor the flagging (phase 2) had an effect compared with the control. Flagging with reprioritization (phase 3) demonstrated a greater reduction in wait time as queue size increased. AI = artificial intelligence, ICH = intracranial hemorrhage.
Table 2:
Effect of Phase on Queue-adjusted Wait Time
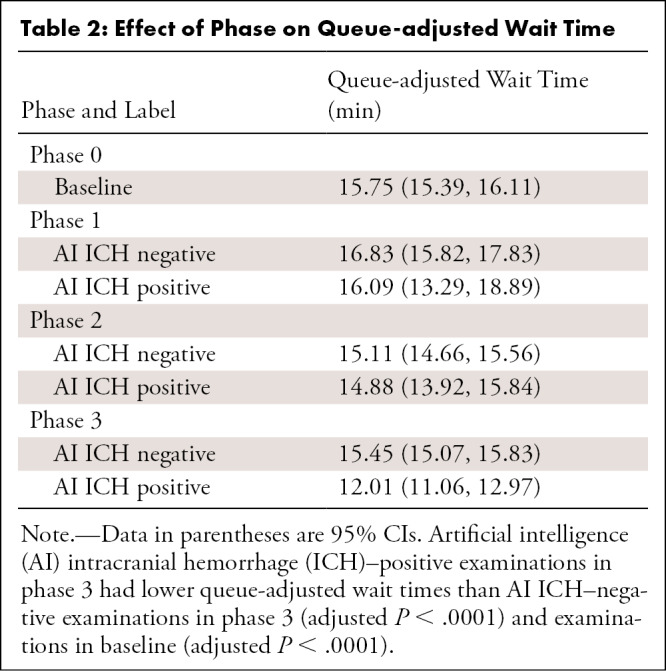
Figure 5:

Impact of interventions on queue-adjusted wait time. Mean line-adjusted wait time is shown for all examinations during each phase regardless of initial priority. Note that delivery of the AI information in phases 1 and 2 did not change mean line-adjusted wait time, whereas reprioritization in phase 3 significantly reduced wait time. AI = artificial intelligence, ICH = intracranial hemorrhage.
Effect on Read Time for Each Phase
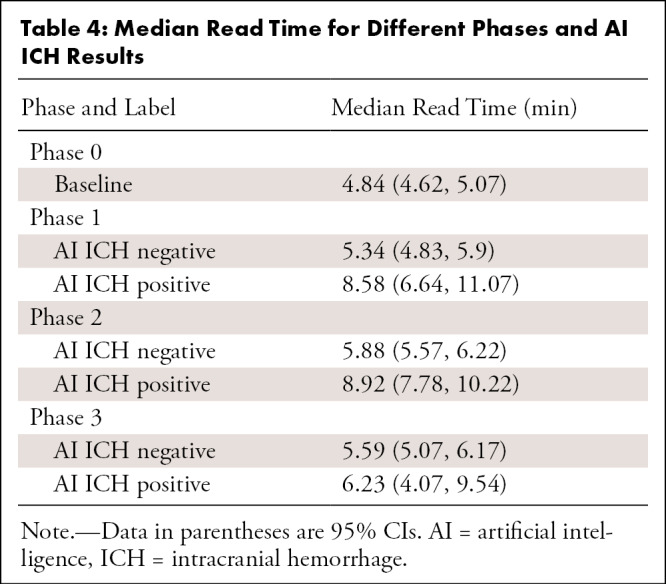
After adjustment, median read time when AI ICH was positive was 8.48 minutes (95% CI: 7.59, 9.48) and 6.98 minutes (95% CI: 6.48, 7.51) when AI ICH was negative (Table 3, Fig 6). However, different phases during the AI implementation period (phases 1, 2, and 3) were not significantly different and thus were not included during the stepwise procedure. Other factors that independently affected reading time included order priority and whether the reader was a trainee or faculty (Table 3). Reading times for emergency department examinations were shorter than those of inpatient STAT (adjusted P < .0001), inpatient urgent (adjusted P = .004), inpatient routine (adjusted P < .0001), and outpatient routine (adjusted P < .0001). Reading times of examinations first reported by trainees were 68% longer than reading times by faculty (P < .0001). However, this effect would depend on the specific workflow used in the training environment. Table 4 shows the estimated median read time for each phase and AI ICH status.
Table 3:
Estimated Median Read Time
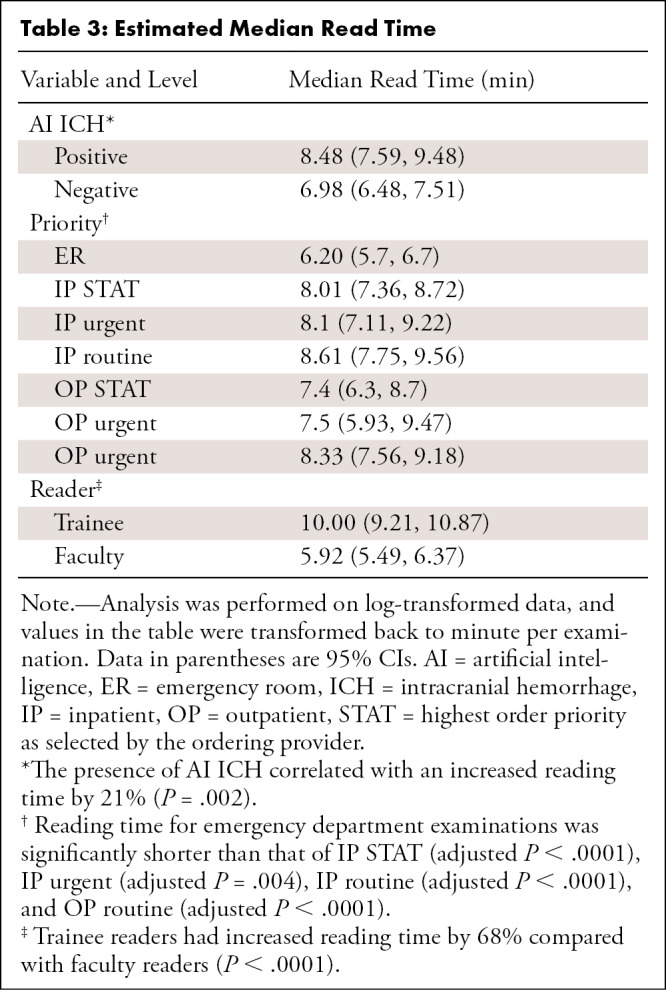
Figure 6:

Independent variables that affect reading time. Mean reading time is shown for each combination of, A, examination priority and patient location, B, presence or absence of artificial intelligence intracranial hemorrhage flag, and, C, faculty or trainee primary reader. AI = artificial intelligence, ICH = intracranial hemorrhage, IP = inpatient, OP = outpatient, R = routine, STAT = highest order priority as selected by the ordering provider, UR = urgent order priority.
Table 4:
Median Read Time for Different Phases and AI ICH Results
Discussion
Our study shows that the presence of a pop-up widget or flagged examinations in the reading worklist had no measurable impact on the wait time and that active reprioritization of the worklist significantly reduced the wait time for examinations with AI-identified presence of ICH, particularly when those examinations were not STAT or urgent priority. We have shown that the major bottleneck for report turnaround time is the amount of time an examination waits in the worklist, and in this study, we consider queue size for each incoming examination in a reading room workflow. We observed that more than 90% of the report turnaround time can be contributed to wait time for examinations with the lowest priority (routine) and more than 60% for STAT examinations (highest priority) on average. AI-based automatic prioritization appears to have significant potential to reduce report turnaround time in targeted populations because of its effect on wait time.
Triaging incoming patients has previously been based on the assessment of the ordering provider’s pretest probability or patient location. A variety of worklist prioritization approaches have been discussed in the literature, including manual prioritization of shortest tasks, grouping similar tasks (9), expanding prioritization to a nine-point scale assigned by technologists (10), automatically sorting and distributing examinations according to a patient’s medical acuity and other factors (11), and automatically prioritizing acute stroke protocol head CT examinations (12). However, new technologies such as AI may allow the radiologist to dynamically modify workflows to improve patient care based on a posttest prediction algorithm (13).
An important consideration to rapidly assess the impact of AI and other tools in improving workflow is the development of models that can reflect the multiple factors that influence outcome measures such as wait time and report turnaround time. Many factors substantially confound the measurement of these times, including the number of examinations with the same priority already in the worklist, the number of radiologists reading examinations, and case difficulty. This wide variety of factors leads to a large amount of unexplained variability and the distribution of report turnaround time reflecting a mixture of multiple distributions. Additionally, when the disease prevalence is low, even nonparametric tests, such as the Mann-Whitney U test, are likely not testing the difference in median (due to the equal variance and/or spread assumption not being satisfied). Researchers often rely on large sample sizes and hope the group means will approximate a normal distribution by the central limit theorem. For example, all previously mentioned studies either relied on a case-control design (2) or large datasets with 10 000 to well over 1 000 000 examinations (10–12,14).
Diagnostic performance of the same algorithm used in our study has been independently assessed by Ojeda et al (15) with 7112 noncontrast head CT studies from two institutions. A sensitivity of 95% and specificity of 99% was reported. Assuming similar performance of the algorithm in our study, and with 11% observed AI ICH–positive examinations, the positive predictive value can be estimated as 92%, and the negative predictive value can be estimated at 99% (thus 8% [34 of 423] of the AI ICH–positive examinations were incorrectly prioritized, whereas 1% [39 of 3917] of AI ICH–negative examinations were incorrectly unprioritized). Thus, on average, fewer than one examination was misclassified either way per day. The impact of a false-positive result deprioritizing other examinations is small, if not negligible, and would appear to the reading radiologist as an algorithm erring on the side of caution. An overly sensitive algorithm with poorer performance may substantially impact a radiologist’s workflow, though this effect was not observed during our implementation of this algorithm. False-negatives occur very infrequently, follow existing prioritization rules within the worklist, and thus have a negligible impact.
Our study had several limitations. First, examinations other than non–contrast-enhanced CT scans were read by the radiologists from other worklists, which were not included in this dataset. This resulted in underestimation of the queue size and overestimation of the queue-adjusted wait time. Second, commercial AI software is in rapid evolution, and the AI tool was not locally retained. Third, outlier, after hours, and weekend examinations were excluded from this analysis; thus, the impact of AI on outliers should be analyzed separately, as it was not included in this study. Last, we did not have a concurrent control group. However, we did examine the adjusted wait times for ICH-negative examinations (for all postimplementation phases) and baseline examinations (phase 0), which were all very similar.
In conclusion, our analysis demonstrated that the introduction of an algorithm for the detection of ICH at non–contrast-enhanced CT, when specifically used to prioritize examinations, reduced wait time and thus overall turnaround time.
Acknowledgments
Acknowledgments
We would like to acknowledge the University of Texas (UT) Southwestern Division of Neuroradiology and its faculty, fellows, and residents who participated in this research on workflow. We would also like to acknowledge the UT Southwestern PACS administrators and other IT professionals who assisted in the implementation and integration of the software used in this study.
Disclosures of Conflicts of Interest: T.J.O. disclosed no relevant relationships. Y.X. disclosed no relevant relationships. E.S. disclosed no relevant relationships. T.B. Activities related to the present article: disclosed no relevant relationships. Activities not related to the present article: consultant to Change Healthcare. Other relationships: disclosed no relevant relationships. Y.N. disclosed no relevant relationships. C.B. disclosed no relevant relationships. R.P. disclosed no relevant relationships.
Abbreviations:
- AI
- artificial intelligence
- ICH
- intracranial hemorrhage
- PACS
- picture archiving and communication system
- STAT
- highest order priority as selected by the ordering provider
References
- 1.Panagos PD, Jauch EC, Broderick JP. Intracerebral hemorrhage. Emerg Med Clin North Am 2002;20(3):631–655. [DOI] [PubMed] [Google Scholar]
- 2.Arbabshirani MR, Fornwalt BK, Mongelluzzo GJ, et al. Advanced machine learning in action: identification of intracranial hemorrhage on computed tomography scans of the head with clinical workflow integration. NPJ Digit Med 2018;1(1):9. [DOI] [PMC free article] [PubMed] [Google Scholar]
- 3.Majumdar A, Brattain L, Telfer B, Farris C, Scalera J. Detecting intracranial hemorrhage with deep learning. Annu Int Conf IEEE Eng Med Biol Soc 2018;2018:583–587. [DOI] [PubMed] [Google Scholar]
- 4.Cho J, Park KS, Karki M, et al. Improving sensitivity on identification and delineation of intracranial hemorrhage lesion using cascaded deep learning models. J Digit Imaging 2019;32(3):450–461. [DOI] [PMC free article] [PubMed] [Google Scholar]
- 5.Kuo W, Hāne C, Mukherjee P, Malik J, Yuh EL. Expert-level detection of acute intracranial hemorrhage on head computed tomography using deep learning. Proc Natl Acad Sci U S A 2019;116(45):22737–22745. [DOI] [PMC free article] [PubMed] [Google Scholar]
- 6.Remedios SW, Roy S, Bermudez C, et al. Distributed deep learning across multisite datasets for generalized CT hemorrhage segmentation. Med Phys 2020;47(1):89–98. [DOI] [PMC free article] [PubMed] [Google Scholar]
- 7.Sauser K, Levine DA, Nickles AV, Reeves MJ. Hospital variation in thrombolysis times among patients with acute ischemic stroke: the contributions of door-to-imaging time and imaging-to-needle time. JAMA Neurol 2014;71(9):1155–1161. [DOI] [PubMed] [Google Scholar]
- 8.McDonald RJ, Schwartz KM, Eckel LJ, et al. The effects of changes in utilization and technological advancements of cross-sectional imaging on radiologist workload. Acad Radiol 2015;22(9):1191–1198. [DOI] [PubMed] [Google Scholar]
- 9.Ibanez M, Clark JR, Huckman RS, Staats BR. Discretionary task ordering: queue management in radiological services. Harvard Business School Technology & Operations Mgt. Unit Working Paper No. 16-051. SSRN [preprint] http://www.ssrn.com/abstract=2677200. Posted October 23, 2015. Revised April 12, 2017. Accessed January 29, 2020. [Google Scholar]
- 10.Gaskin CM, Patrie JT, Hanshew MD, Boatman DM, McWey RP. Impact of a reading priority scoring system on the prioritization of examination interpretations. AJR Am J Roentgenol 2016;206(5):1031–1039. [DOI] [PubMed] [Google Scholar]
- 11.Halsted MJ, Froehle CM. Design, implementation, and assessment of a radiology workflow management system. AJR Am J Roentgenol 2008;191(2):321–327. [DOI] [PubMed] [Google Scholar]
- 12.Osborne TF, Grabiel AJ, Clark RH. The benefit of a triage system to expedite acute stroke head computed tomography interpretations. J Stroke Cerebrovasc Dis 2018;27(5):1190–1193. [DOI] [PubMed] [Google Scholar]
- 13.Ranschaert ER. The impact of information technology on radiology services: an overview: article based on PhD dissertation to obtain the degree of doctor in medical sciences, defended at the University of Antwerp on July 14, 2016. J Belg Soc Radiol 2016;100(1):93. [DOI] [PMC free article] [PubMed] [Google Scholar]
- 14.Morgan MB, Branstetter BF 4th, Lionetti DM, Richardson JS, Chang PJ. The radiology digital dashboard: effects on report turnaround time. J Digit Imaging 2008;21(1):50–58. [DOI] [PMC free article] [PubMed] [Google Scholar]
- 15.Ojeda P, Zawaideh M, Mossa-Basha M, Haynor D. The utility of deep learning: evaluation of a convolutional neural network for detection of intracranial bleeds on non-contrast head computed tomography studies. In: Angelini ED, Landman BA, eds. Proceedings of SPIE: medical imaging 2019—image processing. Vol 10949. Bellingham, Wash: International Society for Optics and Photonics, 2019; 109493J [Google Scholar]