Watch a video presentation of this article
Abbreviations
- ARFI
acoustic radiation forces impulse
- CAP
controlled attenuation parameter
- MRI
magnetic resonance imaging
- NAFLD
nonalcoholic fatty liver disease
- NASH
nonalcoholic steatohepatitis
- PDFF
proton density fat fraction
- SWE
shear wave elastography
- TE
transient elastography
Pediatric nonalcoholic fatty liver disease (NAFLD) comprises a spectrum of disease that can be simplified into two categories: (1) isolated/simple steatosis, 70% to 75% of cases, defined by excess liver fat without inflammation or cellular injury; and (2) nonalcoholic steatohepatitis (NASH), 25% to 30% of cases. 1 Unlike isolated steatosis, NASH reflects reactive inflammation and liver damage associated with steatosis and can ultimately progress to hepatic fibrosis and cirrhosis, eventually developing into end‐stage liver disease and its related complications, including hepatocellular carcinoma. 2
As of 2012, the European Society for Pediatric Gastroenterology Hepatology and Nutrition (ESPGHN) and as of 2016, the North American Society of Pediatric Gastroenterology, Hepatology and Nutrition (NASPGHAN) recommends the use of liver function tests as a part of the initial screening of NAFLD in high‐risk (obese and diabetic) pediatric patients. 3 , 4 Unfortunately, these techniques have been shown to have low sensitivity and specificity. 3 Therefore, there is a significant role of newer quantitative imaging technologies that can be used in the screening and effective stratification of pediatric NAFLD.
Role of Imaging in Children With NAFLD
Historically, the diagnosis, stratification, and management of chronic liver disease, including NAFLD, has relied heavily on liver biopsy, despite its limitations of being costly, subjective, and prone to sampling error. 5 , 6 The shortcomings of biopsy have meant that imaging studies are often used as surrogates for histology. These noninvasive, non‐ionizing quantitative imaging methods are reliable, safe, and clinically available with high repeatability and reproducibility. The aim of this article is to review the current status, diagnostic accuracy, limitations, and practical clinical use of ultrasound‐ and magnetic resonance imaging (MRI)‐based quantitative imaging methods to diagnose, stratify, and monitor NAFLD in the pediatric population.
Ultrasound‐Based Quantitative Imaging for Fat and Fibrosis
Liver Steatosis
Ultrasound‐based controlled attenuation parameters (CAPs) have been around for a few years for the quantification of liver steatosis and are now well tested. A drawback of CAP is that it is a point‐of‐care tool and limits simultaneous liver imaging. However, innovations in CAP technology may surmount this limitation, and some studies have shown a good correlation with MRI‐proton density fat fraction (MRI‐PDFF) in the pediatric population. 7 Recently, several manufacturers have developed software for quantifying the attenuation of the ultrasound beam using a combination of speed of sound estimation, backscatter coefficient, attenuation coefficient, and shear wave dispersion. 8 Early results using attenuation imaging (ATI; Canon Medical Systems, Tochigi, Japan) show promising results and better area under the receiver operating characteristic curve for diagnosing >5% steatosis than CAP (0.91 versus 0.85) against MRI‐PDFF as the gold standard. 9 , 10 Figure 1 demonstrates normal B‐mode imaging, hepatorenal index (a semiquantitative measure) comparing liver/kidney parenchyma echogenicity as a ratio, and quantitative attenuation measure in a normal pediatric patient and one with hepatic steatosis.
FIG 1.
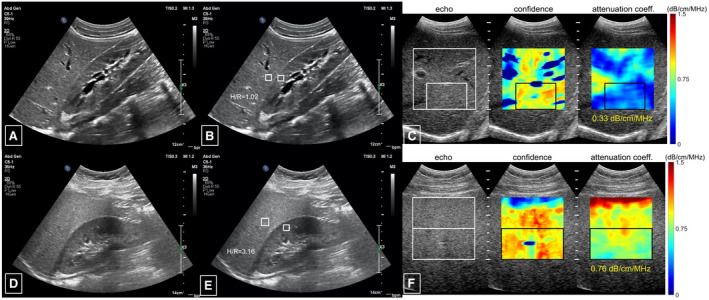
Ultrasound images in a healthy child that demonstrate (A) B‐mode images showing normal liver parenchyma, (B) a normal hepatorenal echogenic index, (C) a quantitative measure of attenuation in an area of liver parenchyma without blood vessels of 0.33 dB/cm/MHz, as compared with ultrasound images in a pediatric patient with (D) echogenic liver parenchyma on B‐mode images, (E) elevated hepatorenal index of 3.16, and (F) increased attenuation measuring 0.76 dB/cm/MHz. Courtesy Philips Ultrasound and Stanford Lucile Packard Children’s Hospital.
Liver Fibrosis
Similar to CAP, transient elastography (TE) by Echosens (Paris, France) is a point‐of‐care technology that has been extensively studied to stage liver fibrosis. TE has shown excellent diagnostic performance in children. 11 Ultrasound imaging‐based technologies, such as acoustic radiation forces impulse (ARFI) and shear wave imaging, have shown superior results compared with TE. 12 In addition, ultrasound‐based imaging techniques allow for comprehensive grayscale and color Doppler assessment of the liver parenchyma as compared with isolated quantitative measures that are typically the product of TE (Fig. 2). TE is also limited and not very successful in the presence of obesity and ascites. 13
FIG 2.
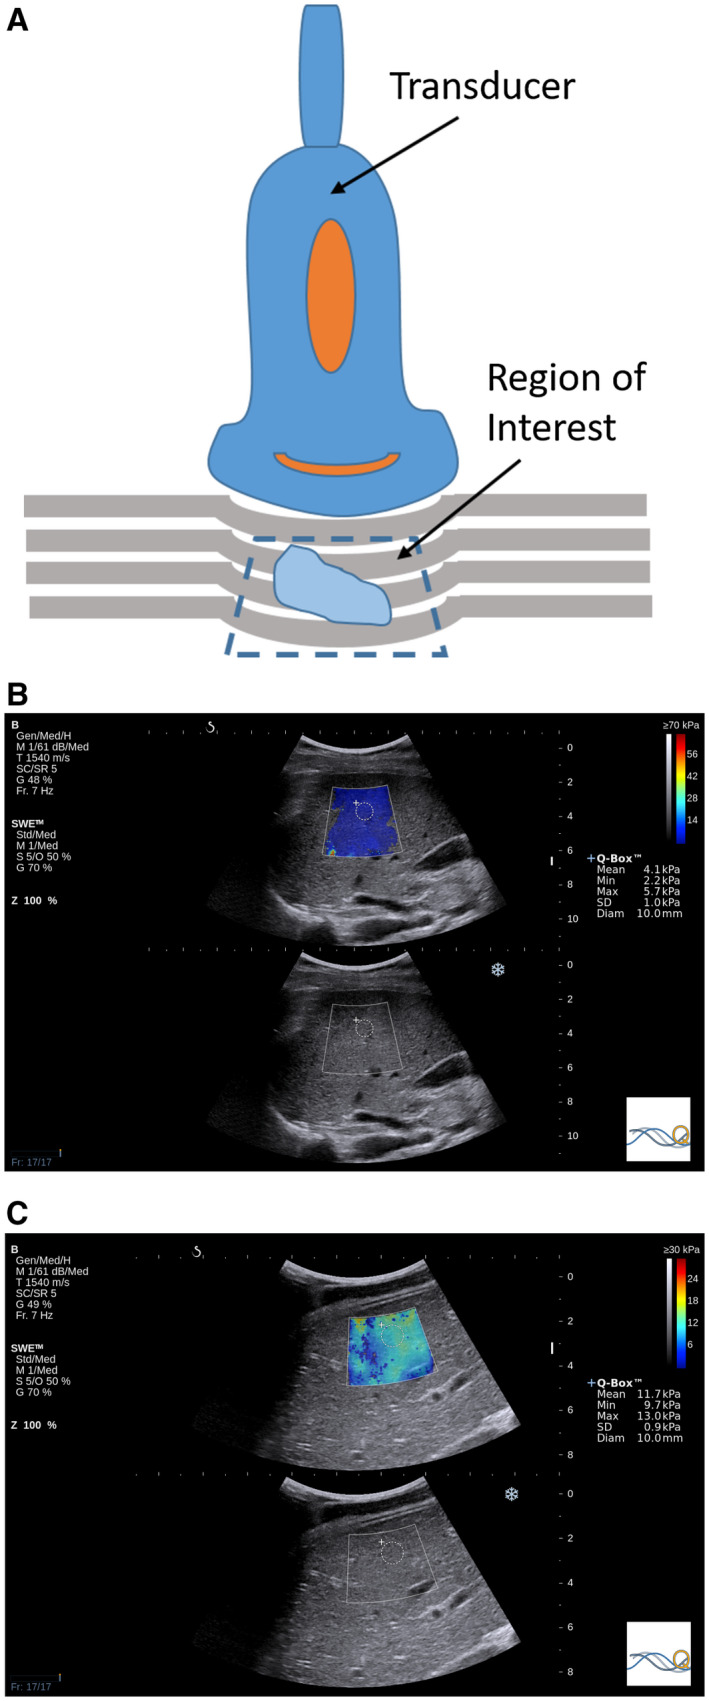
(A) Illustration of quantitative ultrasound ARFI using compression: a vertical load is applied with the transducer to induce tissue displacement, which is captured by multiple B‐mode ultrasound images, providing a qualitative assessment of relative tissue stiffness. TE and pulsed SWE have a fixed sampling area size, although pulsed SWE allows the depth and location to be chosen. Two‐dimensional SWE has the ability of pulsed SWE sampling area placement with the additional ability to change the size. Two‐dimensional SWE ultrasound elastography values in (B) a 16‐year‐old girl with no fibrosis (mean stiffness, 4.1 kPa) and (C) an 18‐year‐old boy with F4 fibrosis, as confirmed by biopsy (mean stiffness, 11.7 kPa).
MRI‐Based Quantitative Imaging for Fat and Fibrosis
MRI provides a comprehensive morphological and functional evaluation of the abdomen in a single noninvasive, radiation‐free examination with excellent spatial, soft tissue contrast and temporal resolution. 14 , 15 For these reasons, MRI is now starting to become a preferred imaging modality for evaluating pediatric patients with NAFLD.
Liver Fat
MRI‐based PDFF can accurately detect and quantify hepatic steatosis independent of age, sex, and body mass index. 16 PDFF entails a rapid (single breath hold, ~12–15 seconds) scan and does not require intravenous contrast material. 16 , 17 PDFF pulse sequences can cover large portions of the liver and are carefully crafted to enable quantification of hepatic steatosis by separating water and fat signals (Fig. 3). PDFF‐based estimated liver fat fraction has shown a high diagnostic accuracy compared with histological grade among pediatric patients with NAFLD 18 and is emerging as the noninvasive method of choice to estimate, on a continuous scale, hepatic PDFF.
FIG 3.
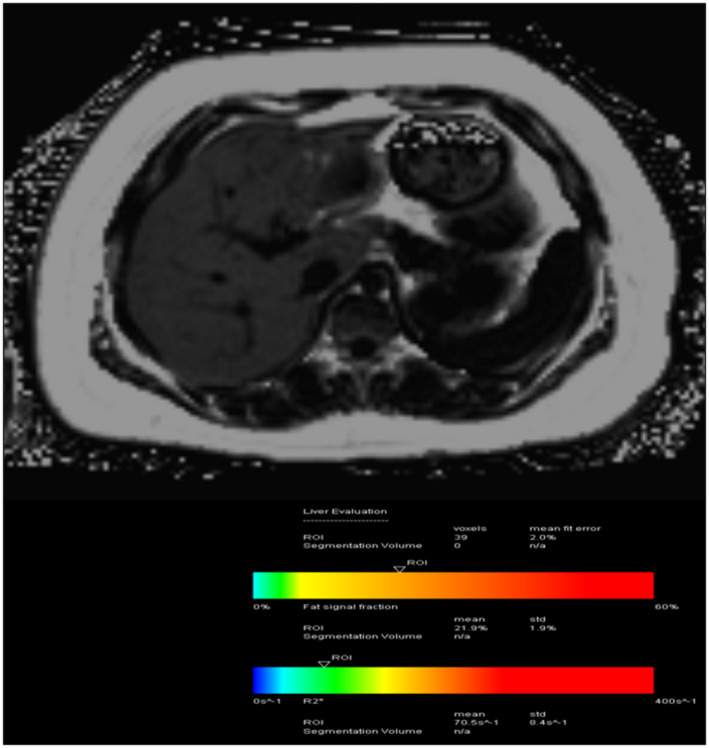
A 15‐year‐old boy with a history of NAFLD with elevated liver function tests and obesity demonstrates a fat fraction of 21.9%. Using PDFF, we have the potential to get (near) full organ coverage with an acquisition time of one breath hold (~15 seconds).
Liver Fibrosis
Magnetic resonance elastography (MRE), which can be performed during the same examination session as MRI‐PDFF, allows the noninvasive measurement of liver stiffness, which reflects liver fibrosis (Figs. 4 and 5). MRE has recently been found to be accurate in identifying advanced fibrosis in children with NAFLD. 19 , 20 Considering that hepatic fibrosis is the strongest predictor of long‐term patient outcomes and that noninvasive serum biomarkers of fibrosis in pediatric NAFLD are largely inaccurate, MRE is currently the most reliable, clinically available, noninvasive approach to assess fibrosis progression, particularly in obese patients.
FIG 4.
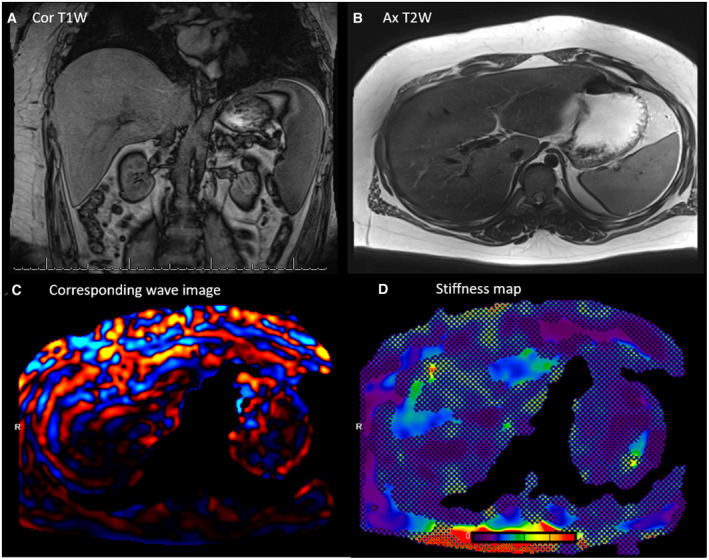
A 15‐year‐old boy with hepatosplenomegaly: (A) coronal T1W, (B) axial T2W, (C) corresponding wave image, and (D) stiffness map. Liver stiffness was measured to be 2.5 kPa using MRE, corresponding to low‐grade fibrosis. MRE offers (near) full organ coverage, hence minimizing sampling errors.
FIG 5.
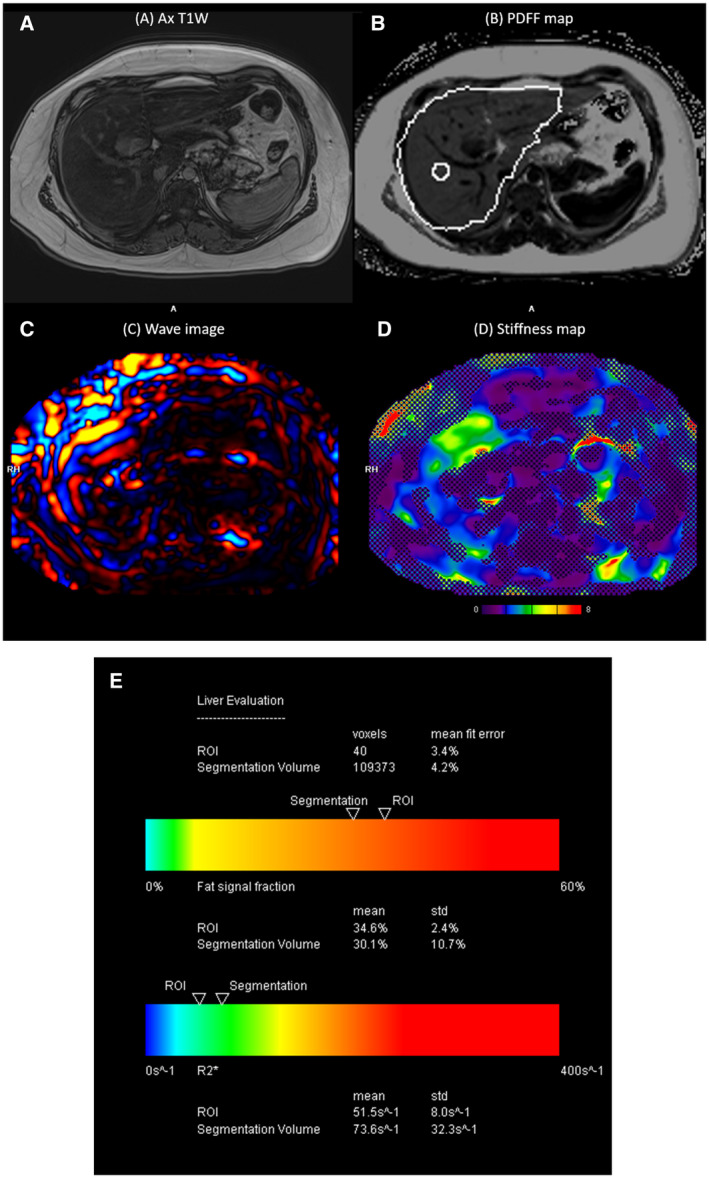
A 16‐year‐old boy with elevated liver enzymes and history of NASH. (A) Axial T1W, (B) PDFF map, (C) corresponding wave image, (D) stiffness map, and (E) automatic segmentation report chart of the entire liver showing % fat and R2* values. MRE shows elevated liver stiffness (3.8 kPa), and PDFF shows high liver fat fraction of 34.6%. Both MRE and PDFF were obtained in the same MRI scan session with one breath hold each (scan time of ~12–15 seconds for each acquisition).
MRE uses low‐frequency (60‐Hz) sound waves to induce shear waves in the liver, visualizes the shear waves by tracking tissue displacement using a modified phase‐contrast sequence, and measures the speed of the propagating wave with specialized software. The sound waves are generated by a subwoofer (“active driver”) outside the scan room and are transmitted to a plastic disk (“passive driver”) secured by an elastic band over the right lower anterior chest wall. 21 Unlike ultrasound, uniformly similar MRE hardware and software are now clinically available on scanners manufactured by the major magnetic resonance vendors, such as Siemens, GE, and Philips. 22 Consequently, liver stiffness reports using MRE can be used across different imaging centers and hospitals. MRE can be achieved in between one and four relatively small breath holds depending on the acquisition method used. 23 MRE examinations can be performed on children awake and as young as 4 months of age, but sedation may be required for children who are claustrophobic or developmentally delayed. 24 Studies have shown that MRE can discriminate patients with moderate and severe fibrosis from those with mild fibrosis with a sensitivity of 86% and specificity of 85%. 20 In a study of 35 children with mixed chronic liver disease, Xanthakos et al. 19 observed that a cutoff stiffness value of 2.7 kPa provided 88% sensitivity and 85% specificity for detecting moderate liver fibrosis. In 468 studies performed in 372 patients, Joshi et al. 25 report MRE to have a high rate of technical success in pediatric and young adult patients. These results suggest a more widespread deployment of MRE as a means of accurately assessing liver fibrosis in children.
Advantages and Limitations: Ultrasound Versus MRI
Although both ultrasound and MRI can be used to measure hepatic stiffness in children, each modality has relative advantages and limitations (Table 1) with their respective specificity and sensitivity (Table 2). Ultrasound‐based elastography and fat measurement methods are readily available, portable, and relatively inexpensive. This method has an obvious benefit in applications to infants and young children to avoid any use of sedation/anesthesia for the purposes of diagnosis. The volume of tissue interrogated, however, is small, and ultrasound‐based techniques may not perform as well in the setting of severe obesity or ascites that often accompanies fatty liver disease. 26
TABLE 1.
Advantages and Limitations of Ultrasound and MRI for NAFLD
| Modality | Advantages | Limitations |
|---|---|---|
| Ultrasound (ARFI [m/second] and CAP [fat %]) |
|
|
| MRI (MRE [kPa] and PDFF [fat %]) |
|
|
TABLE 2.
Sensitivity and Specificity of Quantitative Ultrasound and MRI for Stiffness and % Fat for Steatosis
| Modality | Ultrasound* | MRI | ||
|---|---|---|---|---|
| Sensitivity | Specificity | Sensitivity | Specificity | |
| Stiffness | 0.95 11 | 0.90 11 | 0.92 32 | 0.93 32 |
| Steatosis | 0.85 33 | 0.74 33 | 0.83 34 | 0.98 34 |
For stiffness, sensitivity and specificity values shown are for detecting significant fibrosis (≥F2).
Ultrasound stiffness sensitivity and specificity values shown are for two‐dimensional SWE (measured in m/second). The sensitivity and specificity values are lower for TE and pulsed SWE in comparison with two‐dimensional SWE.
MRI‐based quantitative measurements have the ability to accurately and noninvasively detect and quantify hepatic stiffness and steatosis independent of age, sex, and body mass index. The measurements can be achieved with a short scan and do not require intravenous contrast material. MRI provides reproducible results, is not as limited in obesity, and hence has proved to be a stronger choice than ultrasound for imaging in this context. MRE and PDFF sample a much larger area of the liver, thereby providing a more global assessment of liver stiffness and minimizing sampling error. A distinct advantage is that PDFF‐based measurements acquire R2* information (for corrections) in no additional scan time, and this can be used to rule out iron overload. 27 MRI‐based measurements have been demonstrated to have high repeatability and reproducibility among scanners, field strengths, and vendor platforms. 17 , 22 , 28 , 29 The disadvantages of MRI in general, however, are that overall it is relatively more expensive and less readily available as compared with ultrasound.
Assessment of Cost of Imaging Examinations
A pragmatic consideration of imaging modality will, of course, include a cost assessment. Distinct Current Procedural Terminology codes were established in 2019 for both MRE (76391) and ultrasound elastography for organ assessment (76981). In the United States, reimbursement for MRE is approximately $235 compared with $110 based on the Medicare physician fee schedule (calendar year 2020), 30 although individual payer coverage decisions and reimbursement rates vary widely for these newer procedures. Both of these imaging‐based elastographic methods are significantly more expensive than TE without imaging (91200), such as FibroScan, which is estimated to be around $40 per study. 30 Decisions regarding appropriate modality selection may depend on local carrier policies and out‐of‐pocket expenses balanced against the additional benefits of imaging‐based elastographic methods in assessing anatomy and screening for lesions. The cost of these noninvasive methods is substantially less compared with percutaneous liver biopsy, which has estimated direct costs of $1500 to $3000. 31 Further research into the cost‐effectiveness of specific elastography‐based techniques in the diagnosis of NAFLD and related conditions is needed to better inform clinical decision making and guide health policy.
Given the high accuracy of imaging methods in the detection and measurement of hepatic fibrosis and steatosis for patients with NAFLD, there is a potential that these methods may ultimately replace more invasive procedures for the diagnosis and long‐term monitoring of patients with steatosis and may be used to monitor response to treatment.
Conclusions
To summarize, the ease of availability of ultrasound is promising in evaluating steatosis and fibrosis in patients with NAFLD; MRI has advantages over ultrasound and provides comprehensive functional information with improved anatomical information. Newly developed adaptations of ultrasound and magnetic resonance quantitative imaging are becoming more widely available, precipitating a clinical shift in the diagnosis and management of pediatric NALFD. Now, it is possible to measure fat, iron, and fibrosis to enable accurate diagnosis of NAFLD in a low‐cost, noninvasive manner; alleviating the need for invasive liver biopsies. These modalities allow for detailed screening and appropriate management of a disease process that is widely prevalent, has severe long‐term complications, and is otherwise difficult to detect clinically.
Potential conflict of interest: Nothing to report.
References
- 1. McPherson S, Hardy T, Henderson E, et al. Evidence of NAFLD progression from steatosis to fibrosing‐steatohepatitis using paired biopsies: implications for prognosis and clinical management. J Hepatol 2015;62:1148‐1155. [DOI] [PubMed] [Google Scholar]
- 2. Piscaglia F, Svegliati‐Baroni G, Barchetti A, et al. Clinical patterns of hepatocellular carcinoma in nonalcoholic fatty liver disease: a multicenter prospective study. Hepatology 2016;63:827‐838. [DOI] [PubMed] [Google Scholar]
- 3. Hannah WN Jr, Harrison SA. Nonalcoholic fatty liver disease and elastography: incremental advances but work still to be done. Hepatology 2016;63:1762‐1764. [DOI] [PubMed] [Google Scholar]
- 4. Vos MB, Abrams SH, Barlow SE, et al. NASPGHAN clinical practice guideline for the diagnosis and treatment of nonalcoholic fatty liver disease in children: recommendations from the expert committee on NAFLD (ECON) and the North American Society of Pediatric Gastroenterology, Hepatology and Nutrition (NASPGHAN). J Pediatr Gastroenterol Nutr 2017;64:319‐334. [DOI] [PMC free article] [PubMed] [Google Scholar]
- 5. Nalbantoglu IL, Brunt EM. Role of liver biopsy in nonalcoholic fatty liver disease. World J Gastroenterol 2014;20:9026‐9037. [DOI] [PMC free article] [PubMed] [Google Scholar]
- 6. Vuppalanchi R, Unalp A, Van Natta ML, et al. Effects of liver biopsy sample length and number of readings on sampling variability in nonalcoholic fatty liver disease. Clin Gastroenterol Hepatol 2009;7:481‐486. [DOI] [PMC free article] [PubMed] [Google Scholar]
- 7. Shin J, Kim MJ, Shin HJ, et al. Quick assessment with controlled attenuation parameter for hepatic steatosis in children based on MRI‐PDFF as the gold standard. BMC Pediatr 2019;19:112. [DOI] [PMC free article] [PubMed] [Google Scholar]
- 8. Ozturk A, Grajo JR, Gee MS, et al. Quantitative hepatic fat quantification in non‐alcoholic fatty liver disease using ultrasound‐based techniques: a review of literature and their diagnostic performance. Ultrasound Med Biol 2018;44:2461‐2475. [DOI] [PMC free article] [PubMed] [Google Scholar]
- 9. Ferraioli G, Maiocchi L, Raciti MV, et al. Detection of liver steatosis with a novel ultrasound‐based technique: a pilot study using MRI‐derived proton density fat fraction as the gold standard. Clin Transl Gastroenterol 2019;10:e00081. [DOI] [PMC free article] [PubMed] [Google Scholar]
- 10. Yoo J, Lee JM, Joo I, et al. Reproducibility of ultrasound attenuation imaging for the noninvasive evaluation of hepatic steatosis. Ultrasonography 2020;39:121‐129. [DOI] [PMC free article] [PubMed] [Google Scholar]
- 11. Hwang JY, Yoon HM, Kim JR, et al. Diagnostic performance of transient elastography for liver fibrosis in children: a systematic review and meta‐analysis. AJR Am J Roentgenol 2018;211:W257‐W266. [DOI] [PubMed] [Google Scholar]
- 12. Belei O, Sporea I, Gradinaru‐Tascau O, et al. Comparison of three ultrasound based elastographic techniques in children and adolescents with chronic diffuse liver diseases. Med Ultrason 2016;18:145‐150. [DOI] [PubMed] [Google Scholar]
- 13. Osman AM, El Shimy A, Abd El Aziz MM. 2D shear wave elastography (SWE) performance versus vibration‐controlled transient elastography (VCTE/fibroscan) in the assessment of liver stiffness in chronic hepatitis. Insights Imaging 2020;11:38. [DOI] [PMC free article] [PubMed] [Google Scholar]
- 14. Towbin AJ, Serai SD, Podberesky DJ. Magnetic resonance imaging of the pediatric liver: imaging of steatosis, iron deposition, and fibrosis. Magn Reson Imaging Clin N Am 2013;21:669‐680. [DOI] [PubMed] [Google Scholar]
- 15. Serai SD, Hu HH, Ahmad R, et al. Newly developed methods for reducing motion artifacts in pediatric abdominal MRI: tips and pearls. AJR Am J Roentgenol 2020;214:1042‐1053. [DOI] [PubMed] [Google Scholar]
- 16. Yokoo T, Serai SD, Pirasteh A, et al. Linearity, bias, and precision of hepatic proton density fat fraction measurements by using MR imaging: a meta‐analysis. Radiology 2018;286:486‐498. [DOI] [PMC free article] [PubMed] [Google Scholar]
- 17. Serai SD, Dillman JR, Trout AT. Proton density fat fraction measurements at 1.5‐ and 3‐T hepatic mr imaging: same‐day agreement among readers and across two imager manufacturers. Radiology 2017;284:244‐254. [DOI] [PubMed] [Google Scholar]
- 18. Middleton MS, Van Natta ML, Heba ER, et al. Diagnostic accuracy of magnetic resonance imaging hepatic proton density fat fraction in pediatric nonalcoholic fatty liver disease. Hepatology 2018;67:858‐872. [DOI] [PMC free article] [PubMed] [Google Scholar]
- 19. Xanthakos SA, Podberesky DJ, Serai SD, et al. Use of magnetic resonance elastography to assess hepatic fibrosis in children with chronic liver disease. J Pediatr 2014;164:186‐188. [DOI] [PMC free article] [PubMed] [Google Scholar]
- 20. Yin M, Glaser KJ, Talwalkar JA, et al. Hepatic MR elastography: clinical performance in a series of 1377 consecutive examinations. Radiology 2016;278:114‐124. [DOI] [PMC free article] [PubMed] [Google Scholar]
- 21. Serai SD, Towbin AJ, Podberesky DJ. Pediatric liver MR elastography. Dig Dis Sci 2012;57:2713‐2719. [DOI] [PubMed] [Google Scholar]
- 22. Trout AT, Serai S, Mahley AD, et al. Liver stiffness measurements with MR elastography: agreement and repeatability across imaging systems, field strengths, and pulse sequences. Radiology 2016;281:793‐804. [DOI] [PubMed] [Google Scholar]
- 23. Calle‐Toro JS, Serai SD, Hartung EA, et al. Magnetic resonance elastography SE‐EPI vs GRE sequences at 3T in a pediatric population with liver disease. Abdom Radiol (NY) 2019;44:894‐902. [DOI] [PMC free article] [PubMed] [Google Scholar]
- 24. Serai SD, Trout AT, Sirlin CB. Elastography to assess the stage of liver fibrosis in children: concepts, opportunities, and challenges. Clin Liver Dis 2017;9:5‐10. [DOI] [PMC free article] [PubMed] [Google Scholar]
- 25. Joshi M, Dillman JR, Towbin AJ, et al. MR elastography: high rate of technical success in pediatric and young adult patients. Pediatr Radiol 2017;47:838‐843. [DOI] [PubMed] [Google Scholar]
- 26. Trout AT, Dillman JR, Xanthakos S, et al. Prospective assessment of correlation between US acoustic radiation force impulse and MR elastography in a pediatric population: dispersion of US shear‐wave speed measurement matters. Radiology 2016;281:544‐552. [DOI] [PMC free article] [PubMed] [Google Scholar]
- 27. Serai SD, Smith EA, Trout AT, et al. Agreement between manual relaxometry and semi‐automated scanner‐based multi‐echo Dixon technique for measuring liver T2* in a pediatric and young adult population. Pediatr Radiol 2018;48:94‐100. [DOI] [PubMed] [Google Scholar]
- 28. Serai SD, Obuchowski NA, Venkatesh SK, et al. Repeatability of MR elastography of liver: a meta‐analysis. Radiology 2017;285:92‐100. [DOI] [PMC free article] [PubMed] [Google Scholar]
- 29. Serai SD, Yin M, Wang H, et al. Cross‐vendor validation of liver magnetic resonance elastography. Abdom Imaging 2015;40:789‐794. [DOI] [PMC free article] [PubMed] [Google Scholar]
- 30. Centers for Medicare & Medicaid Services . Physician Fee Schedule Overview. Available at: https://www.cms.gov/apps/physician-fee-schedule/overview.aspx. Published 2020.
- 31. Allen AM, Van Houten HK, Sangaralingham LR, et al. Healthcare cost and utilization in nonalcoholic fatty liver disease: real‐world data from a large U.S. claims database. Hepatology 2018;68:2230‐2238. [DOI] [PMC free article] [PubMed] [Google Scholar]
- 32. Xiao H, Shi M, Xie Y, et al. Comparison of diagnostic accuracy of magnetic resonance elastography and Fibroscan for detecting liver fibrosis in chronic hepatitis B patients: a systematic review and meta‐analysis. PLoS One 2017;12:e0186660. [DOI] [PMC free article] [PubMed] [Google Scholar]
- 33. Pu K, Wang Y, Bai S, et al. Diagnostic accuracy of controlled attenuation parameter (CAP) as a non‐invasive test for steatosis in suspected non‐alcoholic fatty liver disease: a systematic review and meta‐analysis. BMC Gastroenterol 2019;19:51. [DOI] [PMC free article] [PubMed] [Google Scholar]
- 34. Qu Y, Li M, Hamilton G, et al. Diagnostic accuracy of hepatic proton density fat fraction measured by magnetic resonance imaging for the evaluation of liver steatosis with histology as reference standard: a meta‐analysis. Eur Radiol 2019;29:5180‐5189. [DOI] [PubMed] [Google Scholar]


