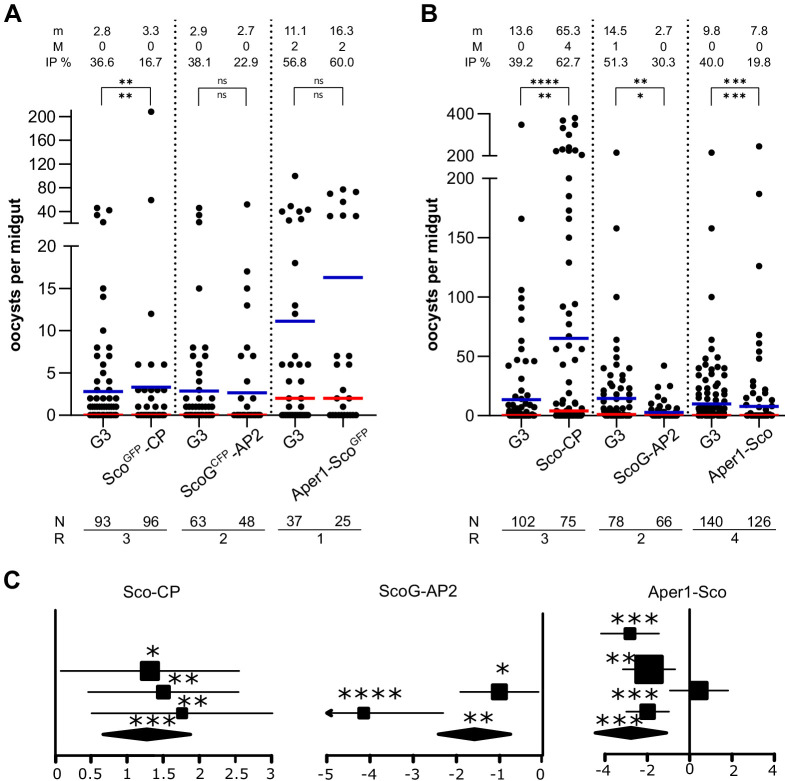
Figure 5. Transmission blocking assay.
Standard membrane feeding assay with P. falciparum using the homozygous transgenic strains with the marker-module (A) and the corresponding markerless strains (B). Infection intensity is measured by the number of oocysts in each gut and the mean (m, blue bar) and median (M, red bar) are shown on top, as well as the infection prevalence (IP). The statistical significance of the infection intensity (stars above the bar) and IP (below) were calculated with the Mann–Whitney test and the chi-squared test, respectively. N is the number of mosquitoes analysed and R is the number of replicates performed. (C) Analyses of data plotted in (B) via a generalized linear mixed model (GLMM). The variation in the fixed effect estimates for each replicate (squares) and all replicates (diamonds) are shown as forest plots (95% confidence interval, glmmADMB). The square size is proportional to the sum of midguts analysed in each replicate. *p≤0.05, **p≤0.01, ***p≤0.001, ****p≤0.0001, and ns: not significant.

