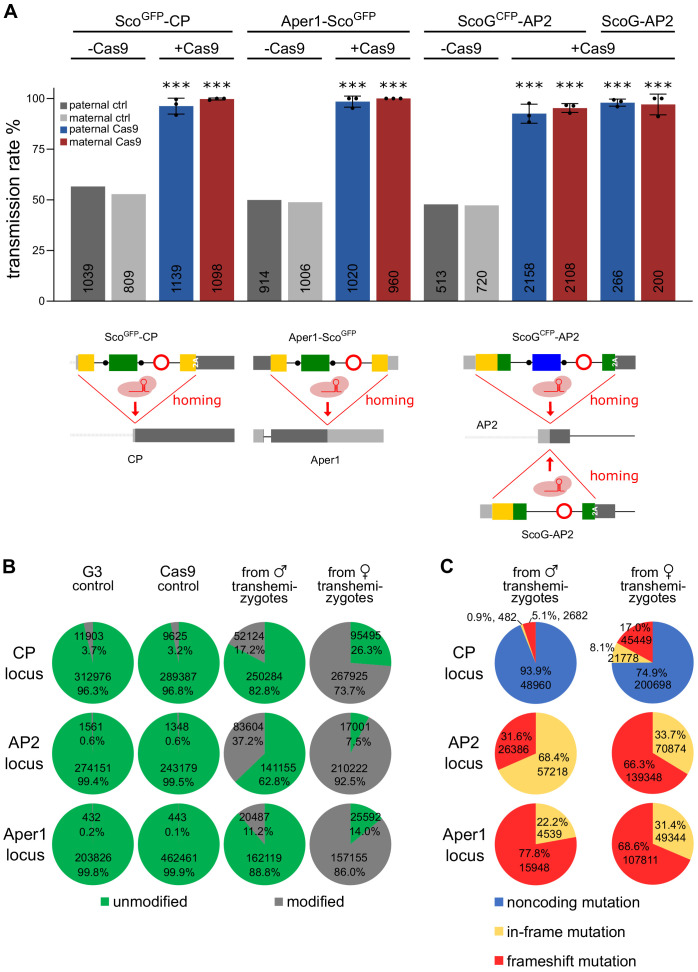
Figure 6. Assessment of non-autonomous gene drive of the modified host genes.
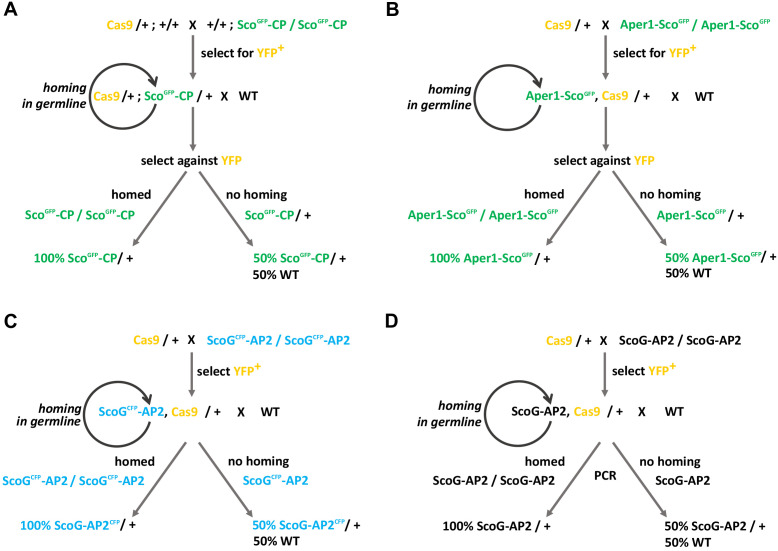
(A) Homozygous individuals of strains ScoGFP-CP, ScoGCFP-AP2, and Aper1-ScoGFP or the markerless strain ScoG-AP2 were crossed to the vasa-Cas9 strain to assess the homing potential induced by the intronic guide RNAs. As a control, hemizygous individuals lacking Cas9 were crossed to WT. In each case homing was measured by the rate of fluorescent larvae recorded in the progeny with the exception of the markerless strain ScoG-AP2 where it was assessed via PCR genotyping of the progeny. Mean and standard deviation from three biological replicates are plotted and the number n is indicated at the base of the column. All comparisons to the control crosses were significant (p<0.0001, chi-squared test). The data is found in Supplementary file 1 - Supplementary Tables 4 and 5. (B) Amplicons from PCRs over the predicted cut site within the three loci performed on pooled progeny from transhemizygotes were subjected to next generation sequencing. G3 and Cas9 served as controls. Overall number of reads and the percentage of reads with modifications in the quantification window are shown. (C) Predicted classes of modifications represented within the set of modified alleles for each locus.


