

SUMMARY
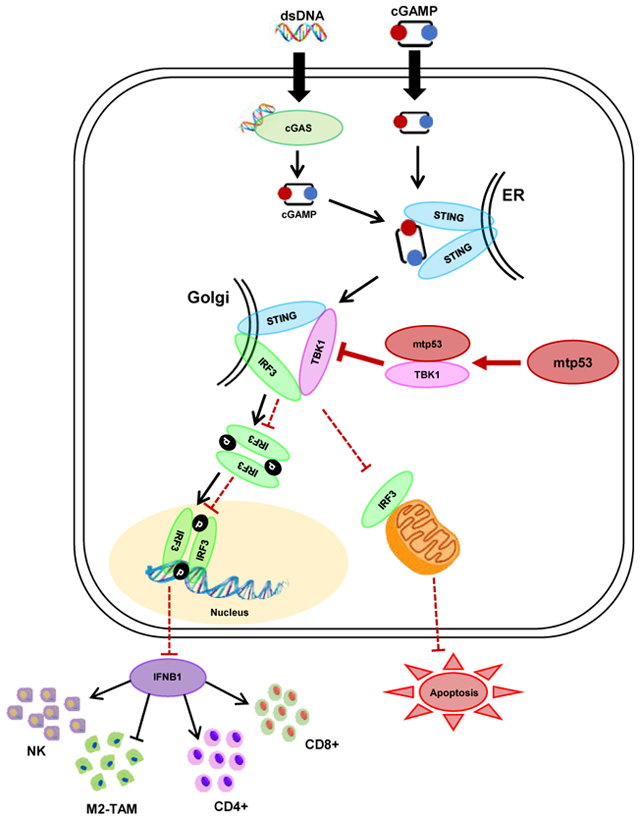
Mutant p53 (mtp53) proteins can exert cancer-promoting gain-of-function activities. We report a mechanism by which mtp53 suppresses both cell-autonomous and non-cell autonomous signaling to promote cancer cell survival and evasion of tumor immune surveillance. Mtp53 interferes with the function of the cytoplasmic DNA sensing machinery, cGAS-STING-TBK1-IRF3, that activates the innate immune response. Mtp53, but not wildtype p53, binds to TANK binding protein kinase 1 (TBK1) and prevents the formation of a trimeric complex between TBK1-STING-IRF3, which is required for activation, nuclear translocation and transcriptional activity of IRF3. Inactivation of innate immune signaling by mtp53 alters cytokine production resulting in immune evasion. Restoring TBK1 signaling is sufficient to bypass mtp53 and lead to restored immune cell function and cancer cell eradication. This work is of translational interest since therapeutic approaches that restore TBK1 function could potentially reactivate immune-surveillance and eliminate mtp53 tumors.
Keywords: Mutant p53, Innate immune signaling, TBK1, IRF3, STING, Immune evasion
Graphical Abstract
In Brief
Ghosh et al. show that mutant p53 suppresses downstream signaling from the cGAS/STING cytosolic DNA sensing pathway by interacting with TANK binding protein kinase 1 (TBK1), resulting in the attenuation of type I interferon response and the promotion of tumor growth through immune evasion.
Introduction:
TP53 is a critical tumor suppressor gene that is often inactivated through missense mutations in the DNA binding domain.(Eischen, 2016; Freed-Pastor and Prives, 2012; Fukasawa et al., 1997) These missense mutations typically inactivate p53’s tumor suppressor activity while simultaneously generating an oncogenic mtp53 protein that exhibits gain-of-function activities.(Kim and Lozano, 2018) Furthermore, the presence of mtp53 correlates with increased chromosomal instability leading to loss of tumor suppressor genes and amplification of oncogenes.(Donehower et al., 2019; Hingorani et al., 2005)
Aneuploidy is considered one of the hallmarks of cancer and is thought to play an important role in driving tumor cell evolution.(Santaguida and Amon, 2015) However, chromosomal instability can give rise to micronuclei, which are prone to rupturing and releasing DNA into the cytoplasm.(Hatch et al., 2013) DNA leaked into the cytoplasm is recognized by the DNA binding protein, cyclic GMP-AMP synthase (cGAS), which in turn triggers innate immune signaling and production of type I interferons.(Sun et al., 2013) Mechanistically, DNA promotes cGAS homodimerization and synthesis of the second messenger cyclic-GMP-AMP (cGAMP).(Ishikawa et al., 2009; Sun et al., 2013) This cGAMP molecule is then recognized by the endoplasmic resident, Stimulator of Interferon Genes (STING), which then translocates to the ER-Golgi intermediate compartment (ERGIC) to recruit TANK-binding kinase 1 (TBK1) and interferon regulatory factor 3 (IRF3). IRF3 forms a trimeric complex with STING and TBK1 and is then phosphorylated by TBK1 allowing it to homodimerize and translocate to the nucleus to regulate gene expression.(Ishikawa et al., 2009) IRF3 can also translocate to the mitochondria and induce apoptosis by interacting with Bax to promote pore formation.(Chattopadhyay et al., 2010) Thus, the formation of the trimeric STING/TBK1/IRF3 complex is a prerequisite for TBK1 activation and downstream signaling by IRF3. This innate immune signaling pathway plays a key role in the suppression of tumor development through both cell autonomous and non-cell autonomous signaling resulting in immune cell-mediated tumor suppression.(Dou et al., 2017; Gulen et al., 2017; Sun et al., 2013; Woo et al., 2014) Cancer cells are known to have high levels of cytoplasmic DNA, which results in the constitutive (although still inducible) “basal” activation of the cGAS/STING pathway.(Bakhoum and Cantley, 2018; Kwon and Bakhoum, 2020; Vanpouille-Box et al., 2018) In contrast, the cGAS/STING pathway was shown to promote metastasis in genetically unstable cells, however, in this setting IRF3 was not activated.(Bakhoum and Cantley, 2018; Bakhoum et al., 2018). It remains unknown how signaling to IRF3 from cGAS/STING is disengaged despite the presence of cytoplasmic DNA in tumor cells.(Bakhoum and Cantley, 2018)
It has previously been reported that there is a correlation between mtp53 and absence/reduced presence of immune cells in head and neck, and gastric cancers.(Jiang et al., 2018; Lyu et al., 2019; Siemers et al., 2017) Since mtp53 is associated with genomic instability, we speculated that it may alter signaling through the cGAS/STING/TBK1/IRF3 pathway to permit the accumulation of cytoplasmic DNA without triggering IRF3 activation. We find that mtp53 binds to TBK1 and disrupts downstream signaling from cGAS/STING to TBK1, thereby preventing phosphorylation of its substrates. We demonstrate that in cells lacking p53, cytoplasmic DNA triggers IRF3 transcriptional activity and apoptosis. In contrast, mtp53 blunts the TBK1-dependent activation of IRF3 thereby promoting a tolerance for cytoplasmic DNA. Importantly, mtp53 promotes immune evasion by suppressing IRF3 activation in vivo. Thus, our work defines a gain-of-function activity of mtp53 by which it blocks both cell autonomous and non-cell autonomous surveillance mechanisms thereby promoting cancer growth.
Results:
Mutant p53 suppresses innate immune signaling
To determine whether mtp53 regulates the innate immune signaling pathway, we initially performed shRNA knockdown of mtp53 in the human breast cancer cell lines, BT549 (p53R249S) and MDA-MB-231 (p53R280K), and pancreatic cell lines, MIA PaCa-2 (p53R248W) (human) and KPC (p53R172H) (mouse). In all 4 cell lines, we observed that mtp53 knockdown resulted in phosphorylation of TBK1 and its substrates, IRF3 and STING (Figure 1A, 1B and Figure S1A). Of note, the p53 targeting sequences are different for the mouse and human p53 and they both yielded a similar response. Two different p53 shRNAs also induced TBK1 substrate phosphorylation in MDA-MB-231 cells, thus ruling out shRNA off-target effects (Figure S1B). Furthermore, comparison of mouse embryonic fibroblasts (MEFs) derived from either p53−/− or mtp53 (p53R172H/R172H) genetically engineered mouse model (GEMMs) revealed that mtp53 correlated with decreased phosphorylation of TBK1, IRF3 and STING (Figure 1C). We also engineered the 4T1 mouse breast cancer cell line (p53 null) to express the R249S mtp53 and found that these cells had reduced TBK1 substrate phosphorylation (Figure 1D). Overexpression of mtp53 (R280K) in two different, normal human fibroblast cells, IMR-90 and human foreskin fibroblasts (HFF), decreased phosphorylation of TBK1 and its substrates IRF3 and STING (Figure S1C). These data suggest that mtp53 blocks the activity of the innate immune signaling pathway.
Figure 1: Mutant p53 suppresses innate immune signaling.
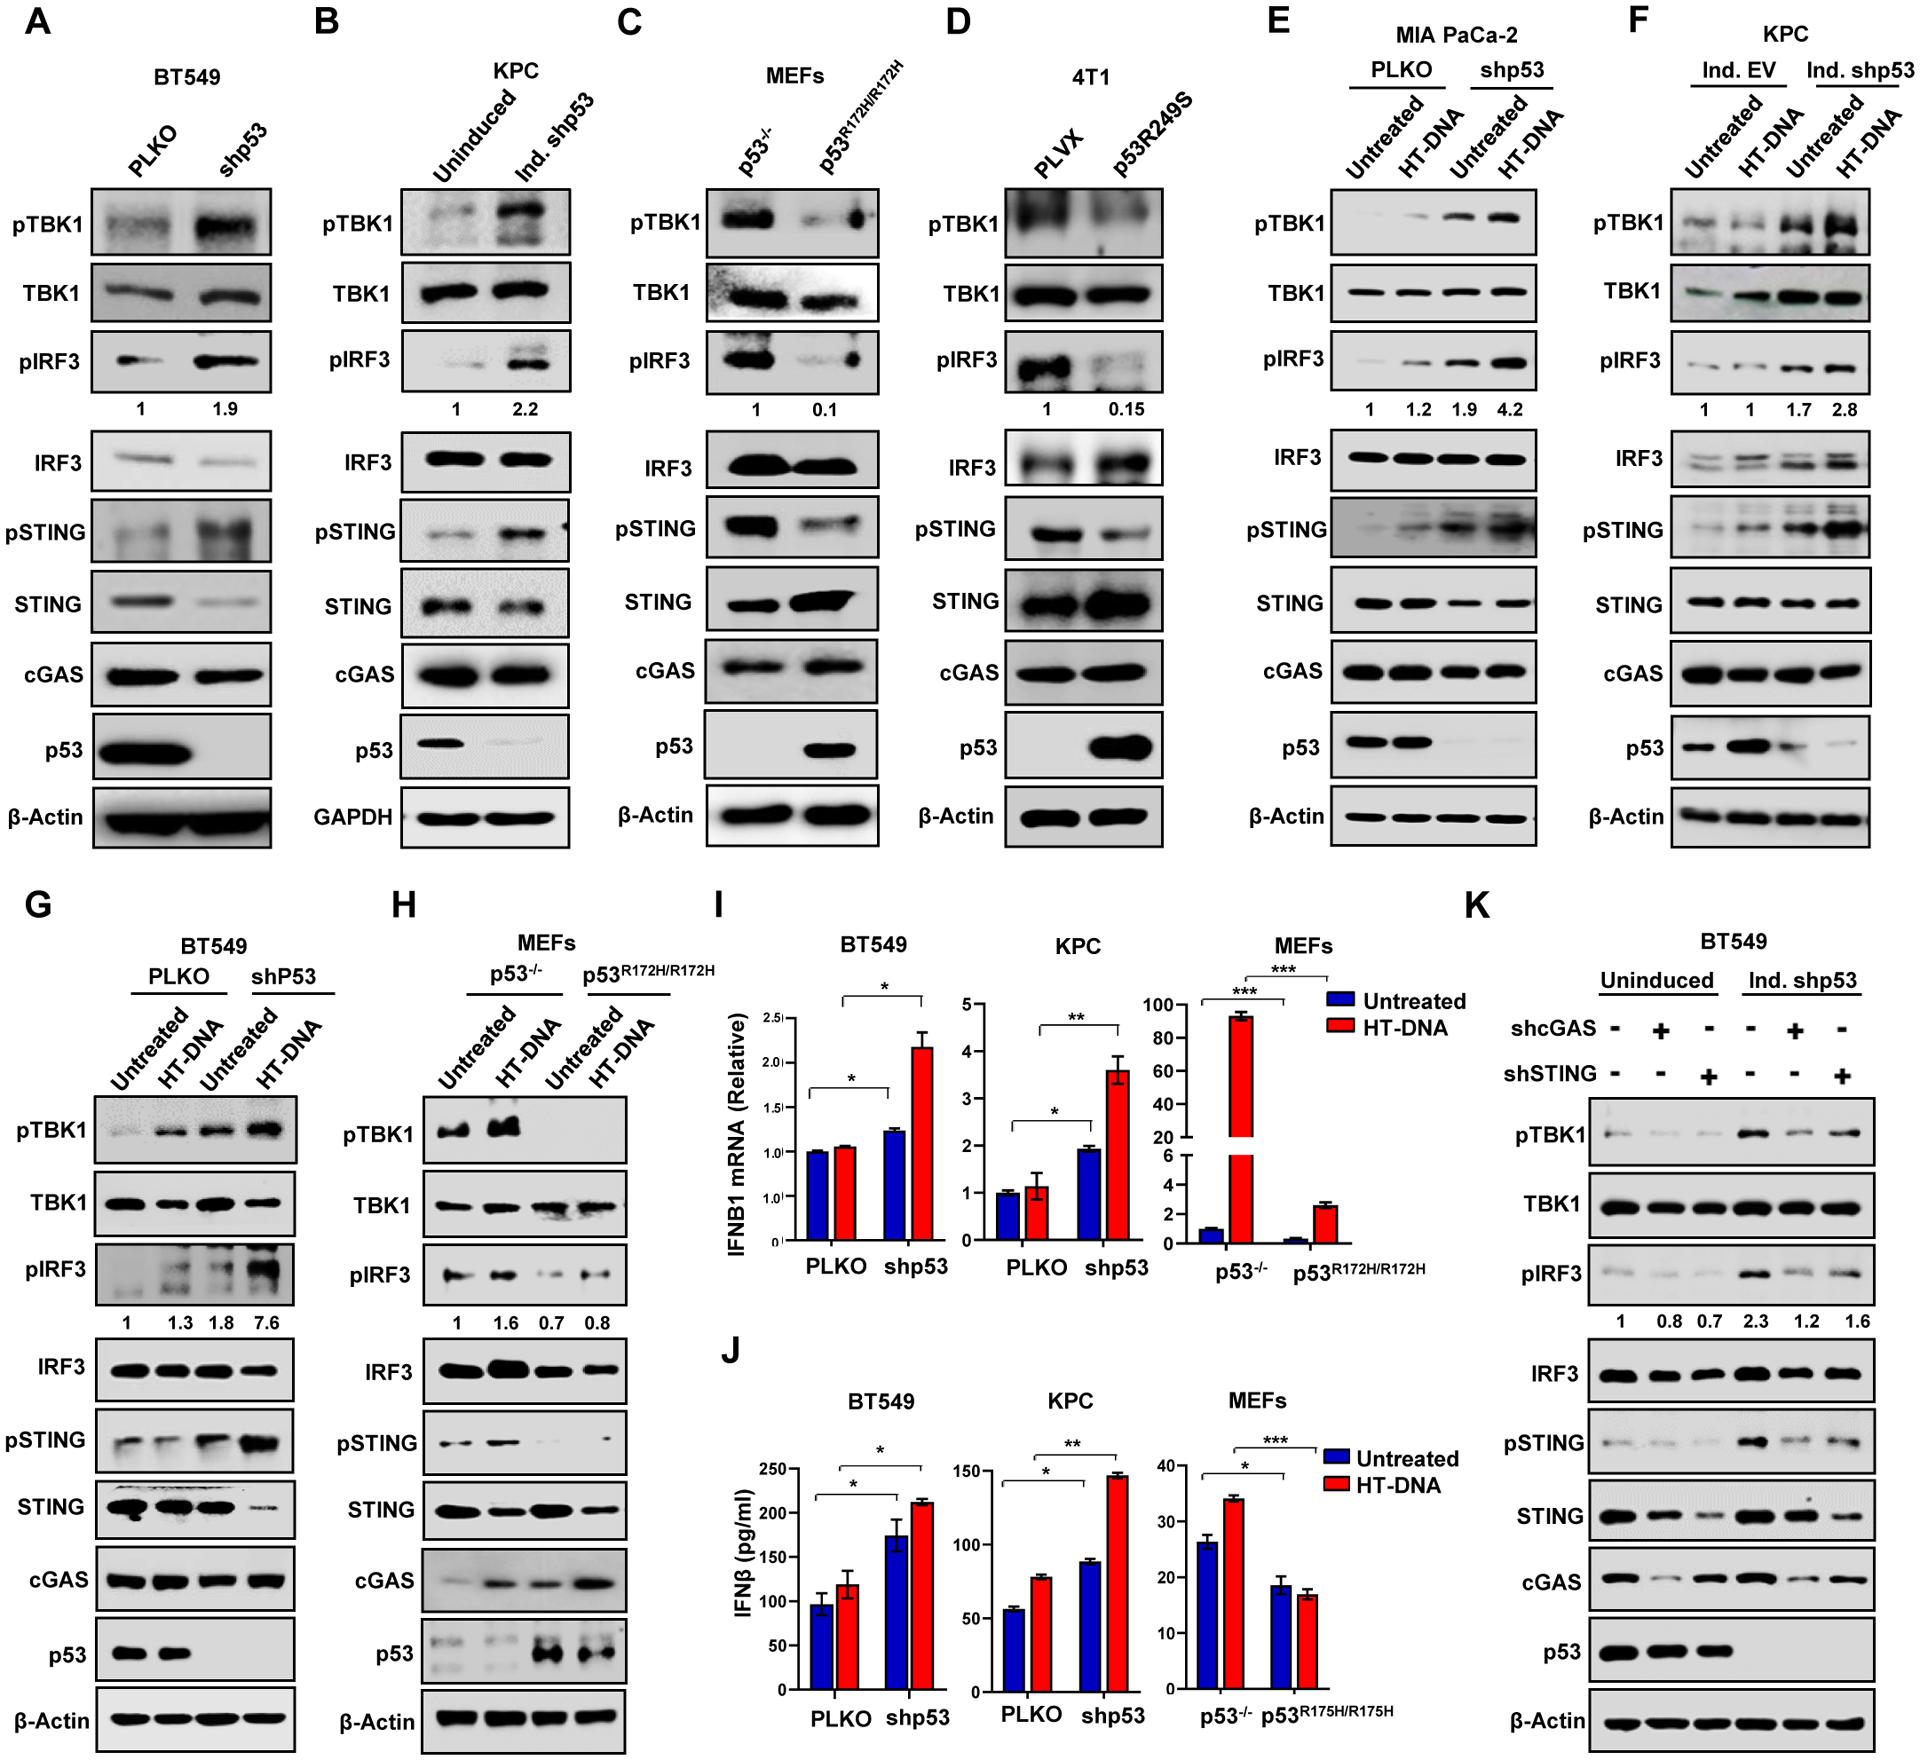
(A-B) Western blot analysis of shRNA knockdown of mutant p53 in BT549 (A) and KPC cells (B). (C) Western blot analysis of p53−/− and p53R172H/R172H MEFs. (D) p53 null 4T1 cells engineered to express p53R249S were subjected to western blotting. (E, F and G) MIA PaCa-2 (E), KPC (F), and BT549 (G) cells with constitutive PLKO/shp53 exprssion or induced (ind.) empty vector (EV)/shp53 were treated with 2 μg/ml of HT-DNA for 3 h and harvested for western blot analysis. (H) p53−/− or p53R172H/R172H MEFs were treated with 2 μg/ml of HT-DNA for 3 h and harvested for western blot analysis. (I and J) p53 knockdown BT549 or KPC cells and mutant p53 expressing MEFs were treated with 2 μg/ml HT-DNA for 18 h, and harvested for either RT-PCR analysis of IFNB1mRNA (I) or ELISA detection of secreted IFNB1 in conditioned medium (J). (K) Western blot analysis of shRNA targeting cGAS and STING in presence and absence of mutant p53 in BT549 cells.
(I, J) Data shown as mean +/− SD, p values are based on Student’s t test. ***p < 0.001, **p < 0.01, *p < 0.05. See also Figure S1 and Table S1.
In contrast to mtp53, shRNA knockdown of wildtype p53 in human lung cancer A549 cells resulted in reduced phosphorylation of STING, TBK1, IRF3 (Figure S1D). Moreover, in human lung cancer H1299 (p53 null) cells engineered to inducibly express wildtype p53, we observed increased TBK1, STING and IRF3 phosphorylation in response to p53 expression (Figure S1E). The phosphorylation of these proteins likely reflects the p53 dependent induction of IFI16, which cooperates with cGAS to activate TBK1/STING/IRF3 (Figure S1E).(Almine et al., 2017; Jonsson et al., 2017; Song et al., 2008) In contrast, IFI16 levels were not affected by mtp53 knockdown or overexpression in different cell lines (Figure S1F and S1G). Thus, wildtype and mutant p53 function in an opposite manner in the control of the innate immune signaling pathway.
cGAS/STING activation induces expression of the type I interferon, IFNB1, through IRF3.(Ablasser and Chen, 2019; Barber, 2015) Therefore, we tested whether mtp53 affected IFNB1 expression. Mtp53 knockdown in BT549 and KPC induced IFNB1 mRNA, and conversely ectopic mtp53 expression in 4T1 cells suppressed it (Figure S1H). Furthermore, this phenotype was corroborated in p53−/− MEFs which expressed higher levels of IFNB1 mRNA than their mtp53 (p53R172H/R172H) counterparts (Figure S1H).
We analyzed human triple negative breast cancer data from TCGA and found that IFNB1 mRNA was more correlated (Pearson correlation) with wild type p53 than mtp53 (Figure S1I and Table S1). We also tested several other chemokines and cytokines including CXCL10, IFIT1 and IFNG and found they mostly correlated towards wildtype p53.
To assess if mtp53 also interferes with ligand-mediated activation of the STING-TBK1-IRF3 pathway, we transfected herring testis DNA (HT-DNA) in cells infected with control (PLKO) or p53 shRNA. HT-DNA transfection in PLKO infected BT549, MDA-MB-231, MIA PaCa-2, and KPC modestly activated the pathway. In contrast, mutant p53 knockdown increased the basal phosphorylation levels of these proteins and they were further increased by HT-DNA treatment (Figure 1E–1G and Figure S1J). In p53−/− MEFs, we observed elevated levels of TBK1 substrate phosphorylation which could be moderately induced by HT-DNA. In contrast, phosphorylation of these substrates was barely detectable in the mtp53 MEFs and not induced by HT-DNA (Figure 1H). Analysis of IFNB1 expression in response to HT-DNA revealed that BT549 and KPC cells failed to induce IFNB1 mRNA, whereas mtp53 knockdown resulted in robust induction in response to HT-DNA treatment (Figure 1I). Consistent with the failure of mtp53 expressing MEFs to activate the pathway, these MEFs weakly induced IFNB1 expression in response to ligand, whereas the p53 null MEFs exhibited a strong induction (Fig. 1I). We also checked expression of various IRF3 controlled inflammatory cytokines in mtp53-knockdown MDA-MB-231 and BT549 cells treated with HT-DNA. Our results show that mtp53 knockdown augmented the induction of these cytokines in response to HT-DNA (Fig. S1K and S1L). All these cytokines are IRF3-target genes as IRF3 knockout in BT549 and MDA-MB-231 cells showed reduced mRNA of IFNB1 (not expressed in MDA-MB-231), IFIT1, CXCL10, CCL5 and ISG15 (Figure S1M and S1N). As anticipated, the reduced IFNB1 mRNA correlated with reduced IFNB1 protein secretion in the cultured medium as detected by ELISA. In BT549 and KPC cells, mtp53 knockdown resulted in increased IFNB1 secretion, whereas mtp53 expressing MEFs had reduced IFNB1 secretion (Figure 1J).
Knockdown of cGAS or STING largely diminished the phosphorylation of TBK1, STING and IRF3 that occurred upon mtp53 knockdown in both MDA-MB-231 and BT549 cells (Figure 1K and Figure S1O). As an orthogonal approach, we tested whether treatment with the STING agonist cGAMP could activate the pathway. Treatment of control vector infected MDA-MB-231 cells with cGAMP modestly induced phosphorylation of the TBK1 substrates. However, the response to agonist treatment was more pronounced in p53 knockdown cells (Figure S1P). These data support the notion that mtp53 disengages signaling downstream from cGAS/STING.
Since cGAMP poorly activated TBK1 in mtp53 expressing cells, we speculated that mtp53 impedes TBK1 function. TBK1 is activated downstream of several pattern recognition receptor (PRR)-adaptor proteins that respond to double stranded RNA (RIG-I), cytosolic DNA (cGAS) and the bacterial cell wall component, lipopolysaccharide (LPS) (TLR4).(Liu et al., 2015) Thus, we reasoned that if mtp53 negatively regulates TBK1 activity, it should block TBK1 activation through these different pathways. To directly test this, we treated cells with dsDNA, cGAMP, Poly (I:C) and LPS and assessed IRF3 phosphorylation. These ligands induced IRF3 phosphorylation in cells not expressing mtp53, however, mtp53 induction suppressed this response (Figure S1Q and S1R). Taken together, our data indicates that mtp53 blocks basal and PRR-induced TBK1 activation.
Mutant p53 blocks IRF3 nuclear translocation and inhibits IRF3-induced apoptosis
Upon activation of the innate immune pathway, STING and IRF3 relocate to different intracellular compartments and thus we investigated if mtp53 altered their subcellular localization. Staining for STING and ERGIC (ER-Golgi intermediate compartments) revealed that STING was localized in the Golgi apparatus even in the absence of treatment. The localization of STING in the Golgi apparatus is consistent with the previously reported observation that it is active in cancer cells and our data showing that cGAS and STING knockdown reduces TBK1 and IRF3 phosphorylation (Figure 1K and S1O).(Bakhoum et al., 2018) Importantly, treatment with cGAMP in BT549 and MDA-MB-231 cells further increased STING and ERGIC co-localization (Figure S2A and S2B). Next, we examined if mtp53 controls IRF3 translocation. IRF3 is cytoplasmic in unstimulated cells, but upon activation of the STING-TBK1-IRF3 pathway, it translocates to the nucleus. To assess if mtp53 regulates IRF3’s subcellular localization, we stably expressed GFP-IRF3 in H1299 cells that have a doxycycline inducible mtp53R248W. In uninduced cells, GFP-IRF3 was present in the cytoplasm and translocated to the nucleus after HT-DNA treatment in approximately 90% of the cells. In contrast, mtp53 expression blunted the response to HT-DNA treatment, resulting in less than 20% of the cells containing nuclear GFP-IRF3 (Figure 2A and S2C). Consistently, we found that whereas GFP-IRF3 remained mostly cytoplasmic in MDA-MB-231 cells infected with an empty vector (PLKO), shRNA knockdown of mtp53 resulted in a modest accumulation of GFP-IRF3 in the nucleus, and this was further increased by HT-DNA treatment (Figure S2D). We also used subcellular fractionation to examine endogenous IRF3’s localization. Inducible knockdown of mtp53 in BT549 and KPC cells resulted in an increased phospho-IRF3 localization in the nucleus (Figure 2B). Taken together our data indicates that mtp53 impedes IRF3’s nuclear translocation.
Figure 2: Mutant p53 blocks IRF3 nuclear translocation and IRF3-induced apoptosis.
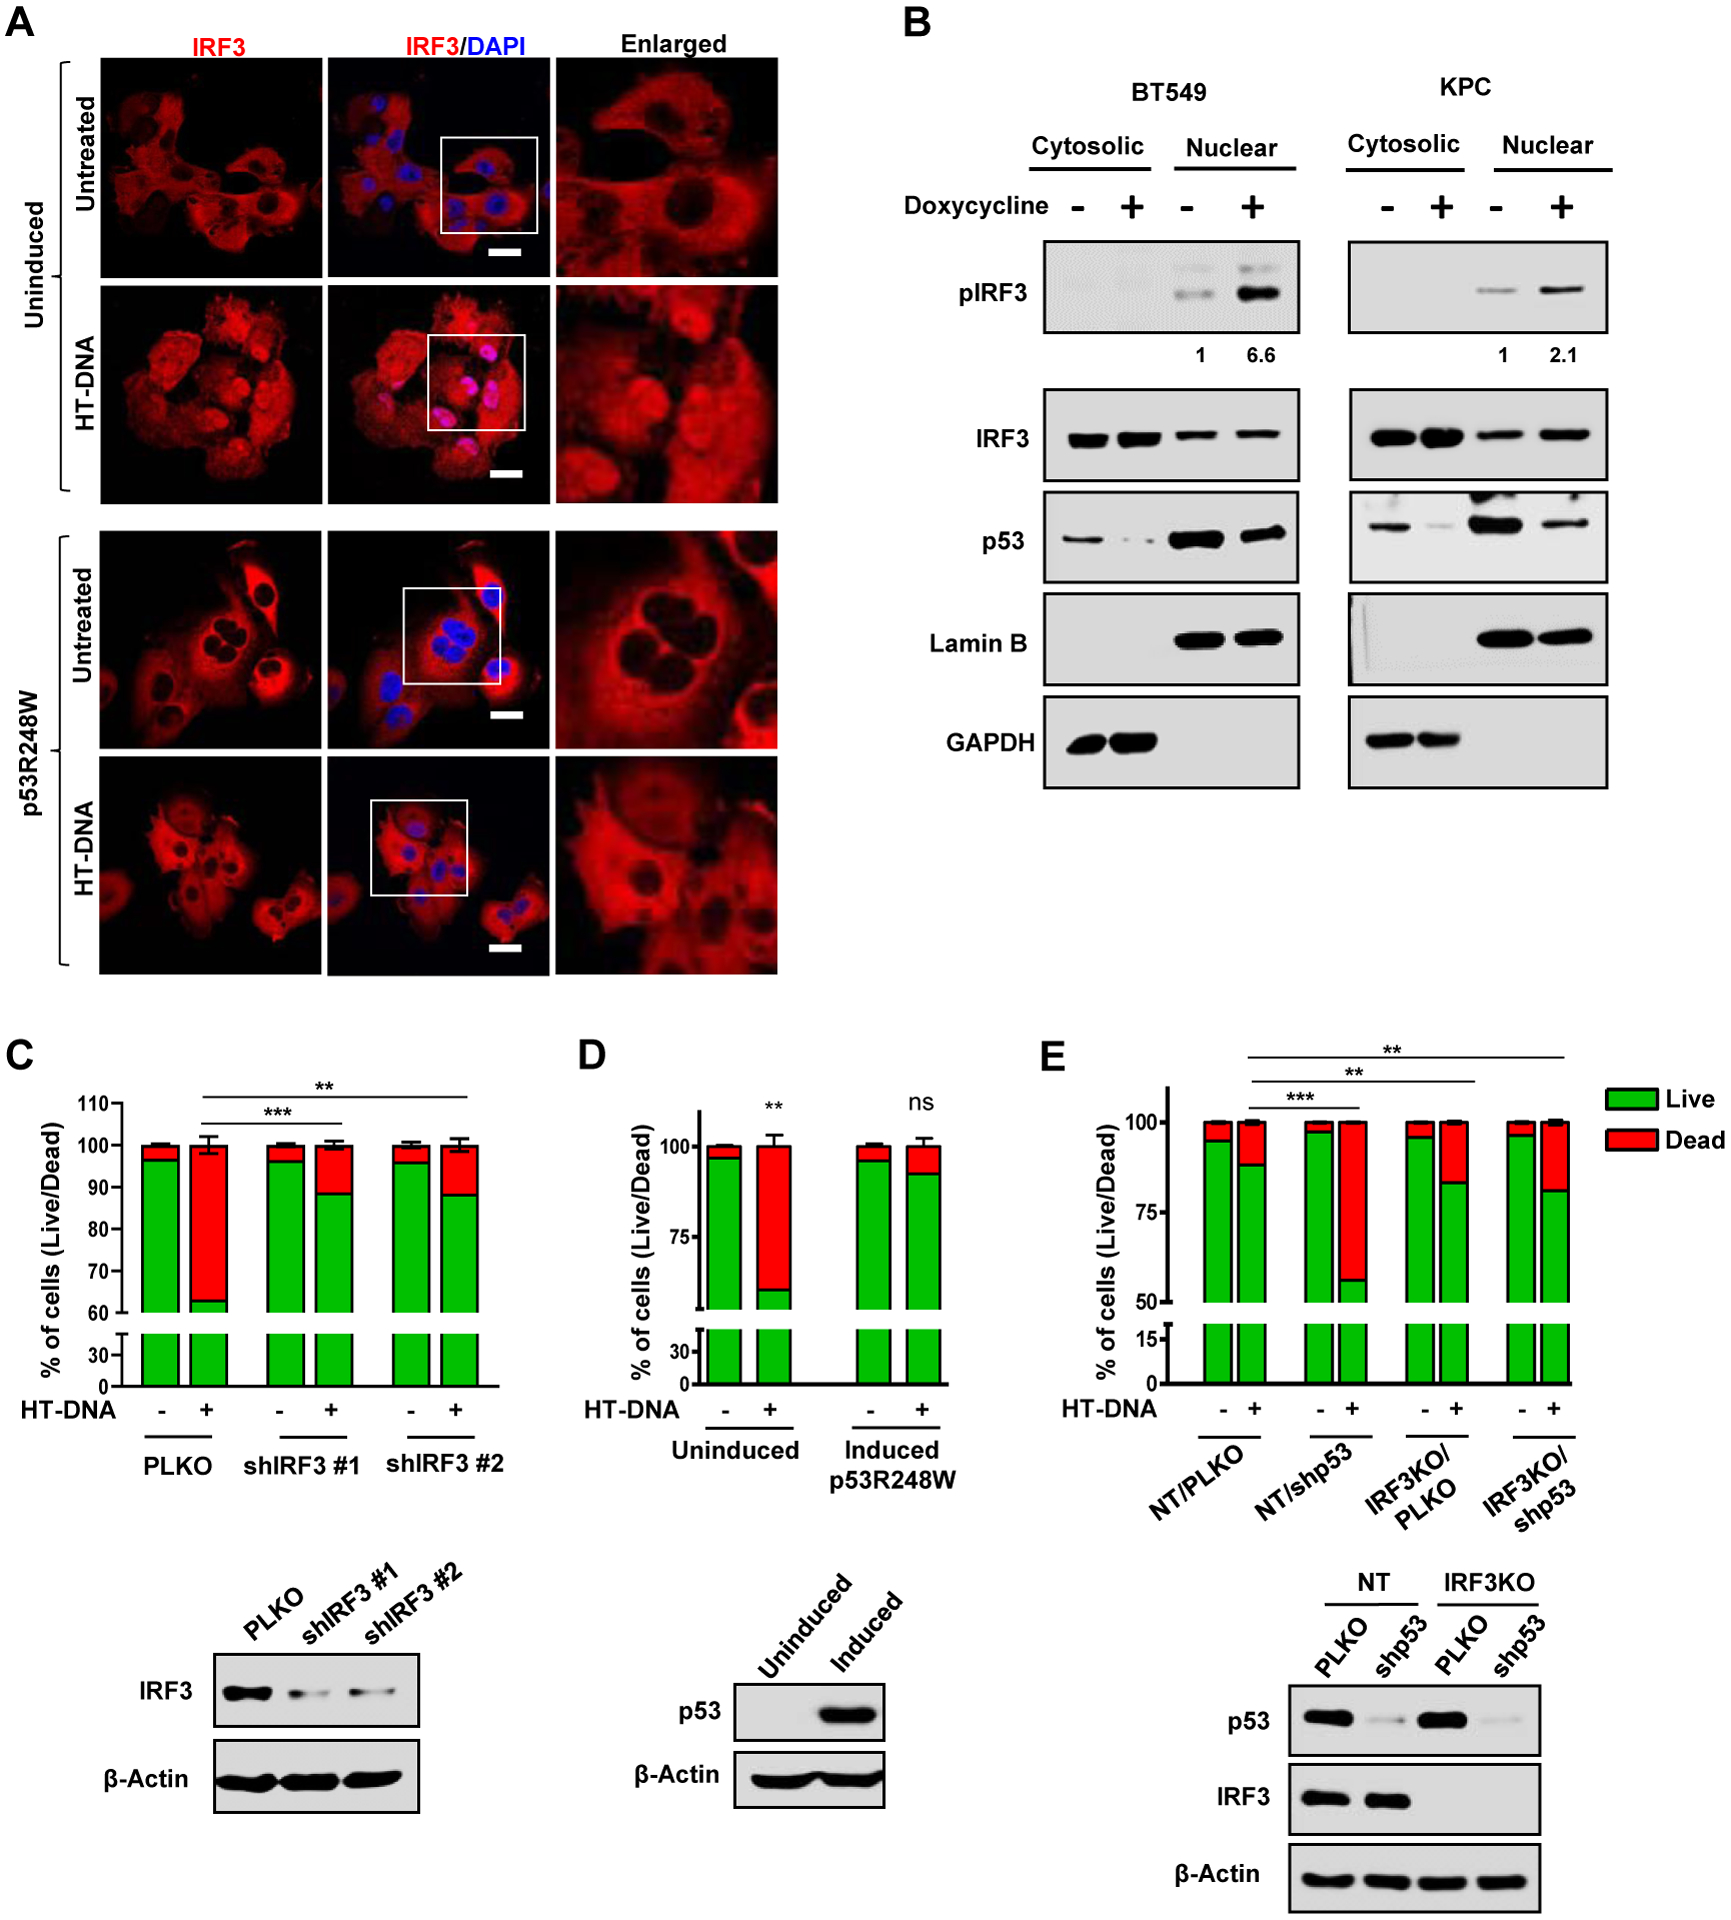
(A) Representative confocal images of H1299 cells stably expressing GFP-IRF3 that were either left uninduced or induced with doxycycline for 24 h to express p53R248W. Cells were treated with 2 μg/ml of HT-DNA for 3 h and stained for IRF3. Nuclei were stained with DAPI. Scale Bar 10 μm (B) Representative immunoblots of fractionated lysates of Doxycycline inducible p53 shRNA in BT549 and KPC cells. GAPDH and lamin B1 were used as loading controls for the cytoplasmic and nuclear fractions, respectively. (C) Quantification analysis of apoptotic death analyzed by flow cytometry of PLKO and shIRF3 H1299 cells treated with 2 μg/ml of HT-DNA for 24 h. Immunoblots (bottom) showing IRF3 knockdown efficiency. (D) H1299 cells with inducible p53R248W were left uninduced or induced with doxycycline and then treated with 2 μg/ml of HT-DNA for 24 h. Cells were harvested, stained with Annexin V-FITC and PI and subjected to flow cytometry analysis. Immunoblots (bottom) showing p53R248W induction efficiency. (E) Quantitation of apoptosis in non-target (NT) and IRF3KO BT549 cells with either PLKO or shp53, treated with 2 μg/ml HT-DNA for 24 h and analyzed for apoptosis using flow cytometry. Immunoblots (bottom) showing p53 KD efficiency in NT and IRF3KO set.
(C-E) Data shown as mean +/− SD, p values are based on Student’s t test. ***p < 0.001, **p < 0.01, ns=non-significant. See also Figure S2
Cytosolic DNA activates IRF3-dependent transcription, but it also induces IRF3-dependent cell death.(Chattopadhyay et al., 2010; Gulen et al., 2017) Specifically, IRF3 interacts with BAX and promotes mitochondria pore formation and apoptosis.(Chattopadhyay et al., 2010) In agreement, we observed that approximately 40% of H1299 cells treated with HT-DNA for 24 hours underwent apoptosis as determined by FACS analysis (Figure 2C). This apoptotic response to HT-DNA was IRF3-dependent since it was abrogated by IRF3 knockdown with two different shRNAs (Figure 2C). To address if mtp53 antagonized this apoptotic response, we knocked it down in MDA-MB-231 cells and treated them with HT-DNA. FACS results showed that HT-DNA treatment induced apoptosis in about 30% of empty vector infected cells, while the apoptotic response was more pronounced (approximately 70%) in mtp53 knockdown cells (Figure S2E). Similarly, in uninduced H1299 cells, HT-DNA treatment induced apoptosis in approximately 40% of the cells, and this was almost completely blocked by mtp53 expression (Figure 2D). To provide further evidence that mtp53 could suppress HT-DNA induced IRF3-dependent apoptosis, we tested the response to HT-DNA of BT549 cells knocked down for mtp53 alone or in combination with IRF3 CRISPR knockout. Mtp53 knockdown increased the apoptotic response to HT-DNA from 10% to 60%. However, combining mtp53 knockdown and IRF3 knockout reduced the apoptotic response to ~20%, indicating that the loss of mtp53 sensitizes to HT-DNA in an IRF3-dependent manner (Figure 2E). Collectively, these data indicate that mtp53-expressing cells fail to mount the cell intrinsic response to activation of the cGAS-STING-TBK1-IRF3 pathway.
Mutant p53 prevents formation of the trimeric TBK1/STING/IRF3 complex
IRF3 phosphorylation in response to cytoplasmic DNA requires formation of a STING/TBK1/IRF3 trimeric complex. To test if mtp53 blocks TBK1 phosphorylation of its substrates, we transfected all three (TBK1/STING/IRF3) with or without mtp53 and then analyzed their phosphorylation state. Transfection of TBK1 with STING and IRF3 in H1299 cells resulted in the phosphorylation of all three proteins, but this was reduced by mtp53 (Figure S3A). Thus far, our data suggested that mtp53 interferes with TBK1 thereby disrupting signaling to IRF3. We speculated that mtp53 might interact with one or more of these proteins, and disrupt formation of the complex required for IRF3 activation. Therefore, we tested the interaction of TBK1 with mutant and wildtype p53 in the H1299 inducible cells. Mtp53 interacted with TBK1, but wildtype p53 did not, despite its expression at equivalent levels (Figure 3A and Figure S3B). We did not observe an interaction between mtp53 and IRF3 or STING (negative data not shown). We also found that TBK1 interacted with endogenous mtp53 but not wildtype p53 (Figure 3B and Figure S3C). Furthermore, co-staining of MIA PaCa-2 and MDA-MB-231 cells with TBK1 and p53 revealed that they co-localize in the cytoplasm (Figure 3C). To determine how the mtp53/TBK1 interaction impacts formation of the trimeric complex, we co-transfected TBK1, STING and IRF3 in H1299 cells that were not induced or induced for mtp53 and analyzed by immunoprecipitation/western blot the proteins that interacted with TBK1. Transfection of TBK1, STING and IRF3 in un-induced cells resulted in the co-immunoprecipitation of both STING and IRF3 with TBK1. Mtp53 expression disrupted this interaction as indicated by their reduced co-immunoprecipitation with TBK1 (Figure 3D). To determine if mtp53 also impacted IRF3 homodimerization, we transfected GFP-IRF3 into the mtp53 inducible H1299 cells, immunoprecipitated with an anti-GFP antibody and did western blot with an anti-IRF3 antibody to detect both transfected and endogenous IRF3. In uninduced cells treated with HT-DNA, we detected the co-immunoprecipitation of endogenous IRF3 with GFP-IRF3, indicating their dimerization. Induction of mtp53 disrupted the IRF3 homodimer complex as indicated by the lack of co-immunoprecipitation of GFP-IRF3 with endogenous IRF3 (Figure 3E). Of note, since we did not detect an interaction between IRF3 and mtp53 this suggests that the IRF3 dimer is not directly disrupted by mtp53. Collectively, this indicates that the interaction of mtp53 with TBK1 prevents the formation of the trimeric TBK1/STING/IRF3 complex and thus precludes TBK1 and IRF3 activation.
Figure 3: Mutant p53 prevents formation of the trimeric TBK1/STING/IRF3 complex.
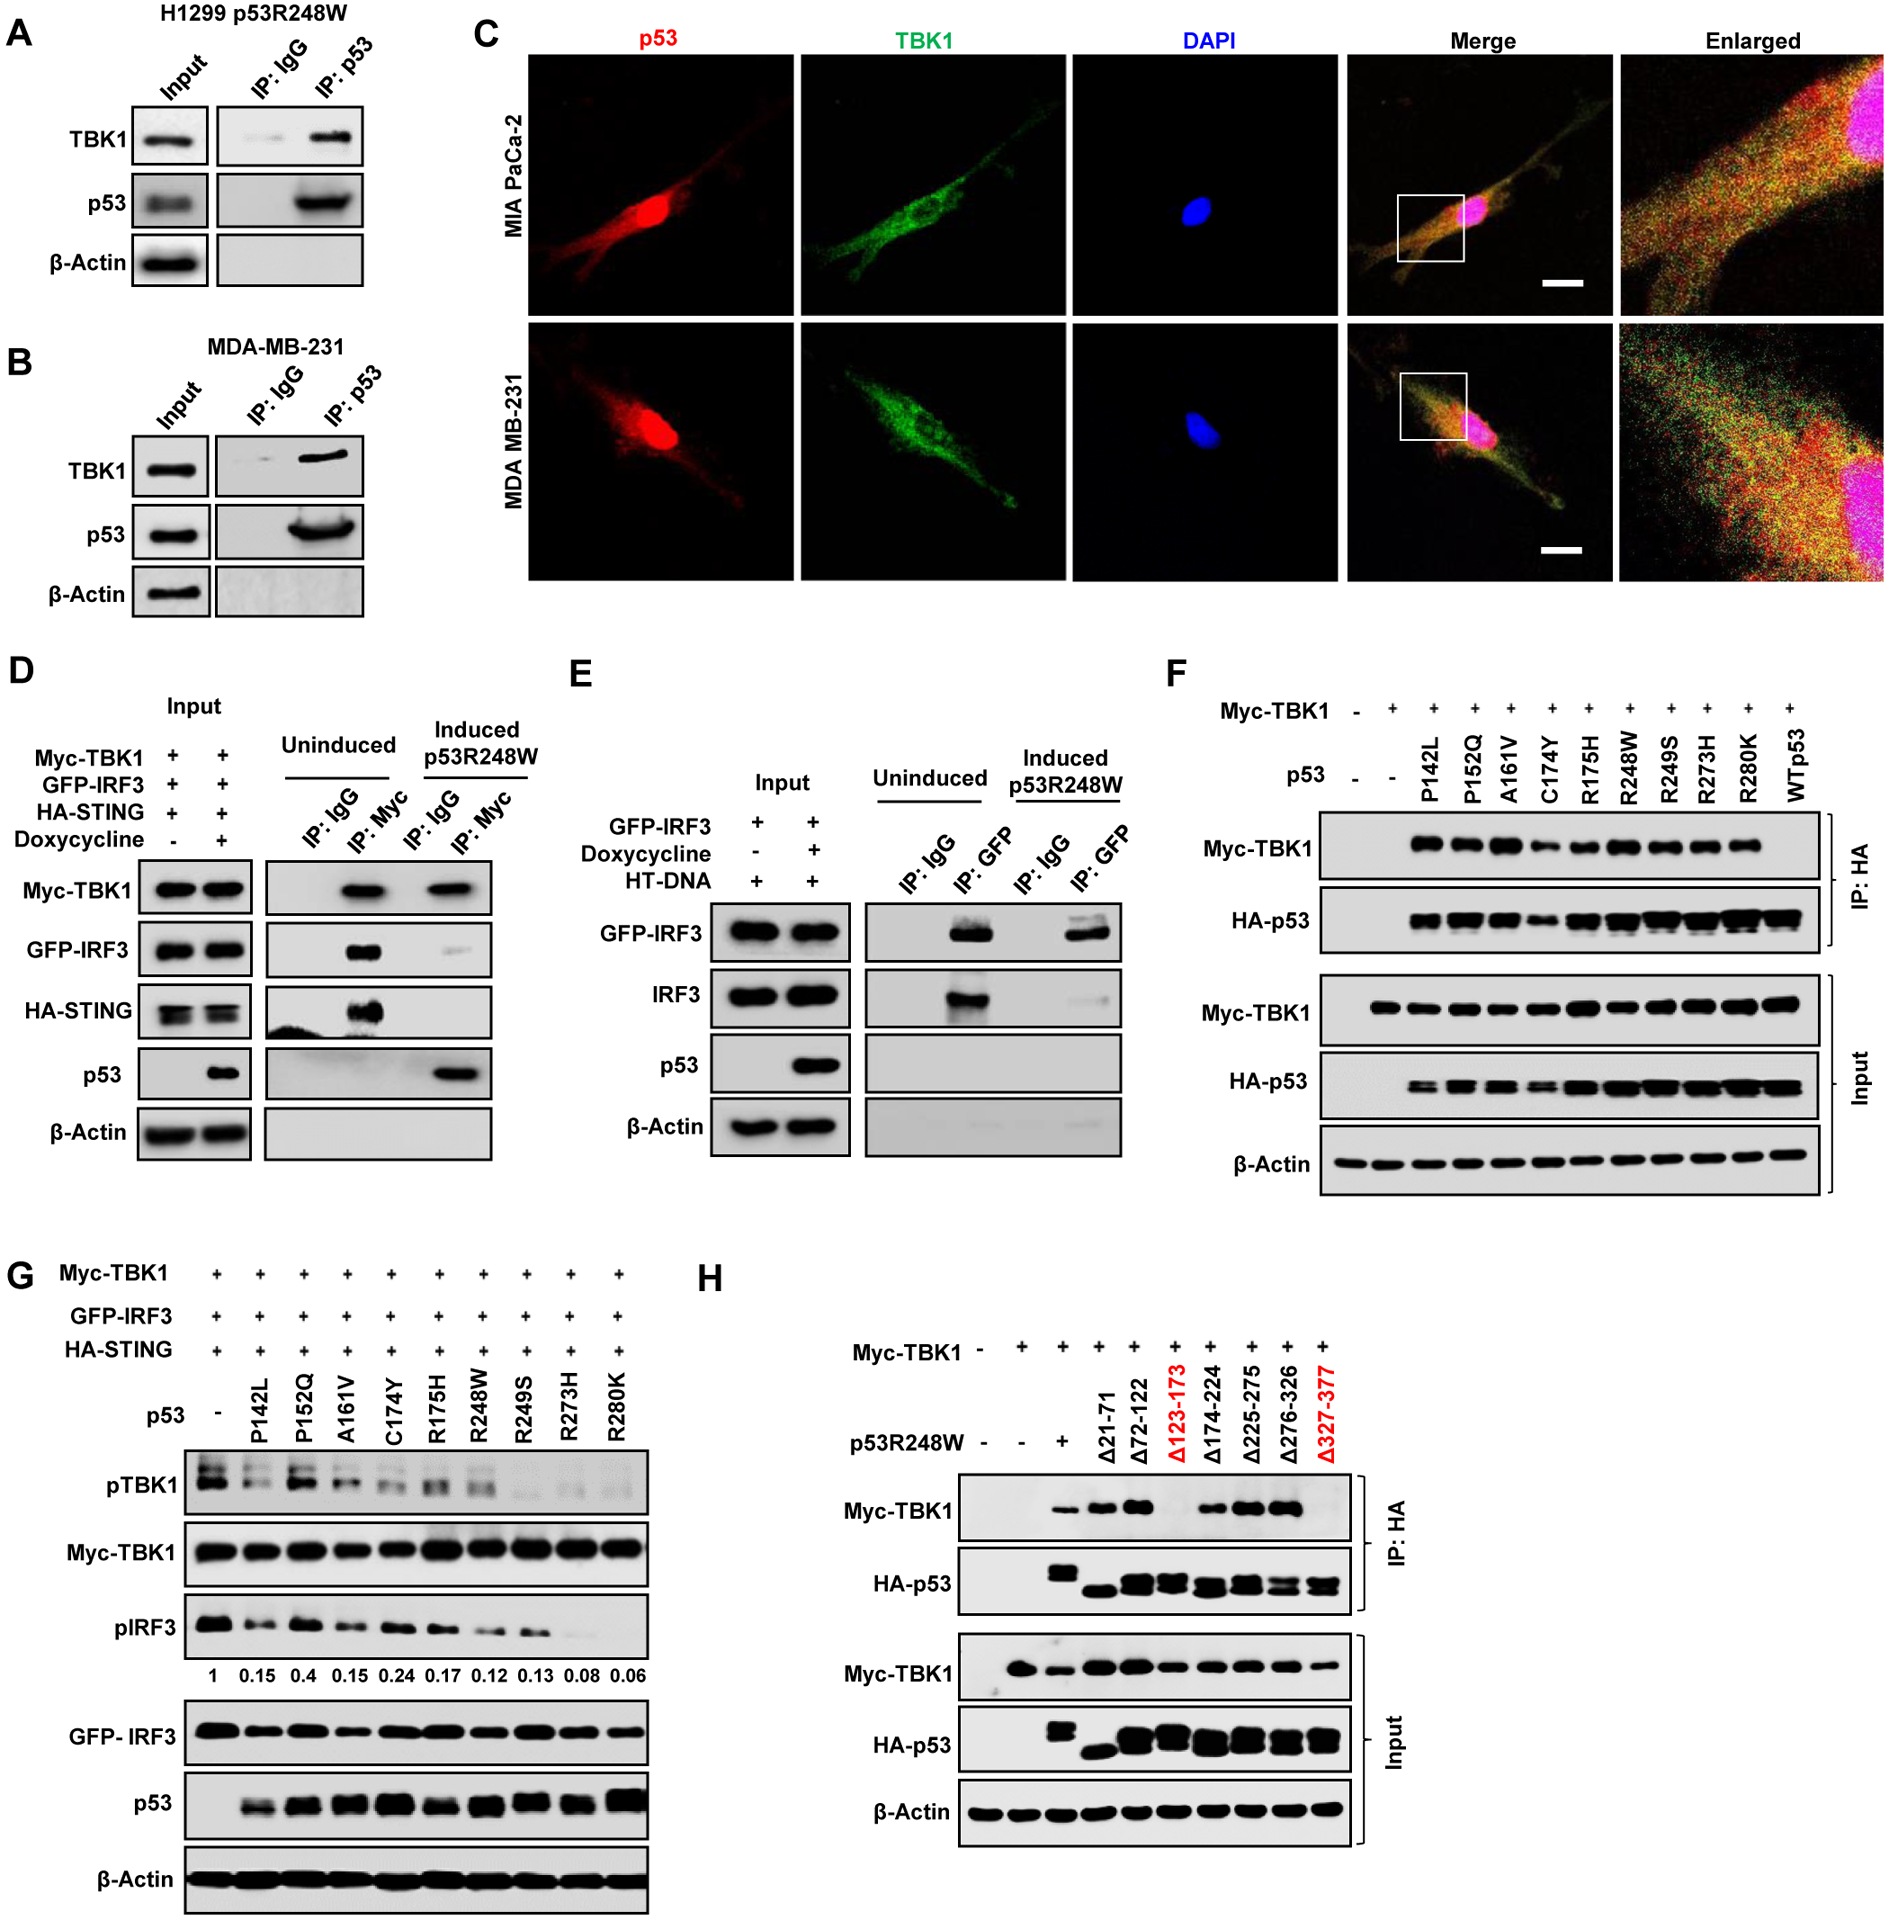
(A) H1299 cells expressing inducible mutant p53R248W were induced with doxycycline 24 h and mutant p53 was immunoprecipitated from the whole cell lysate. Lysates and immunoprecipitates (IP) were analyzed by western blotting. B) Endogenous mutant p53 in MDA-MB-231 was immunoprecipitated with p53 antibody. Cell lysates and IP were analyzed by western blot. (C) Representative confocal microscopy images of TBK1 and p53 in MIA PaCa-2 and MDA MB-231 cell. Scale bar represents 10 μm. (D) H1299 cells were left uninduced or induced with Doxycycline for 24 h to express p53R248W and cotransfected with Myc-TBK1, GFP-IRF3 and HA-STING. Cells were lysed and Myc-TBK1 was immunoprecipitated with Myc antibody. Cell Lysates and IP were analyzed by western blot. (E) H1299 cells were induced to express p53R248W, transfected with GFP-IRF3 and treated with HT-DNA for 3 h. Cells were lysed and GFP-IRF3 was immunoprecipitated with GFP antibody. Whole cell lysate and IP were analyzed by western blot. (F) Myc-TBK1 was co-transfected with nine different mutant p53 and WT p53 in H1299 cells. Cells were lysed and p53 was immunoprecipitated. (G) H1299 cells were co-transfected with different mutant p53s and Myc-TBK1, GFP-IRF3, HA-STING and analyzed by western blot. (H) H1299 cells were transfected with Myc-TBK1 and seven different deletion mutants of HA-p53R248W. Cells were lysed and mutant p53 was immunoprecipitated using HA antibody. See also Figure S3
Our data with different cell lines carrying distinct p53 mutations suggested that both structural and DNA contact mtp53s disable TBK1 (Figure 1). To compare different p53 mutants in an isogenic cellular context, we co-transfected TBK1 with different p53 mutants (P142L, P152Q, A161V, C174Y, R175H, R248W, R249S, R273H, R280K and WTp53) into H1299 cells. We observed that the different mutants interacted with TBK1, whereas WTp53 did not (Figure 3F). Furthermore, the different mtp53 proteins also reduced TBK1 and IRF3 phosphorylation, albeit to varying degrees. In general, all the mutants reduced TBK1 substrate phosphorylation; notably, R249S, R273H and R280K almost completely suppressed TBK1 phosphorylation while R273H and R280K were the most potent suppressors of IRF3 phosphorylation (Figure 3G and Figure S3D). RT-PCR analysis of IFNB1 induction in cells co-transfected with TBK1/STING/IRF3 and the different mutants revealed that all the p53 mutants inhibited its induction by at least half (Figure S3E). To map the sites of interaction between mtp53 and TBK1, we generated p53 deletion mutants based on the DNA contact mutant, p53 R248W, or the structural mutant, p53R249S, and tested their interaction with TBK1.(Bullock et al., 2000; Freed-Pastor and Prives, 2012) Deletion of amino acids 123–173 (DNA binding domain) and 327–377 (tetramerization domain) largely reduced the interaction between mtp53 and TBK1 (Figure 3H and Figure S3F). Taken together, our observations suggest that different p53 mutants bind and prevent TBK1 from activating IRF3.
Mtp53 tumors exhibit accelerated growth in hosts with an intact immune system
In the tumor microenvironment, the TBK1-STING-IRF3 pathway signals to immune cells about the presence of tumor cells and thus functions in a non-cell autonomous manner.(Ablasser and Chen, 2019; Bakhoum and Cantley, 2018) We therefore investigated whether mtp53 modulates immune cell infiltration and impacts tumor growth. Towards this end, we engineered 4T1 cells to express either PLVX or PLVX-p53R249S (referred as p53R249S hereafter) and used a syngeneic BALB/c mouse tumor model to assess tumor growth. Analysis of in vitro growth rates showed no difference between the PLVX and p53R249S cells (Figure S4A). We injected 4T1 PLVX or p53R249S cells (5×10⁴) in the mammary fat pad of BALB/c mice. By 14 days post-inoculation, the p53R249S tumors grew much faster than the PLVX ones and by the end of the experiment, p53R249S tumors were approximately twice as large as their PLVX counterparts (Figure 4A–4C). There was no significant difference in immunohistochemical (IHC) detection of the proliferation marker, Ki67, between PLVX and p53R249S tumors (Figure S4B). These data indicated that the increased growth advantage of the p53R249S tumors was not due to an intrinsic proliferative advantage and suggested that cell-extrinsic signaling underlies these differences. To directly assess if the immune system played a role in the different tumor growth rates, we inoculated the same 4T1 PLVX and p53R249S cells into NOD/SCID mice and monitored tumor growth. We did not observe differences in the tumor growth rates in these immunocompromised mice (Figure 4D, 4E and Figure S4C). We also assessed tumor vascularization by IHC detection of the endothelial marker, CD31. Surprisingly, in tumors grown in the immunocompetent BALB/c mouse model, we found higher levels of CD31 positive cells in the p53R249S tumors than the PLVX ones. In contrast, tumors grown in NOD/SCID mice did not have any apparent difference in CD31 staining (Figure 4F, and 4G). Thus, p53R249S exhibits gain-of-function activities of increased tumor growth and neoangiogenesis in vivo only in hosts with an intact immune system.
Figure 4: Mutant p53 tumors exhibit accelerated tumor growth in hosts with intact immune system.
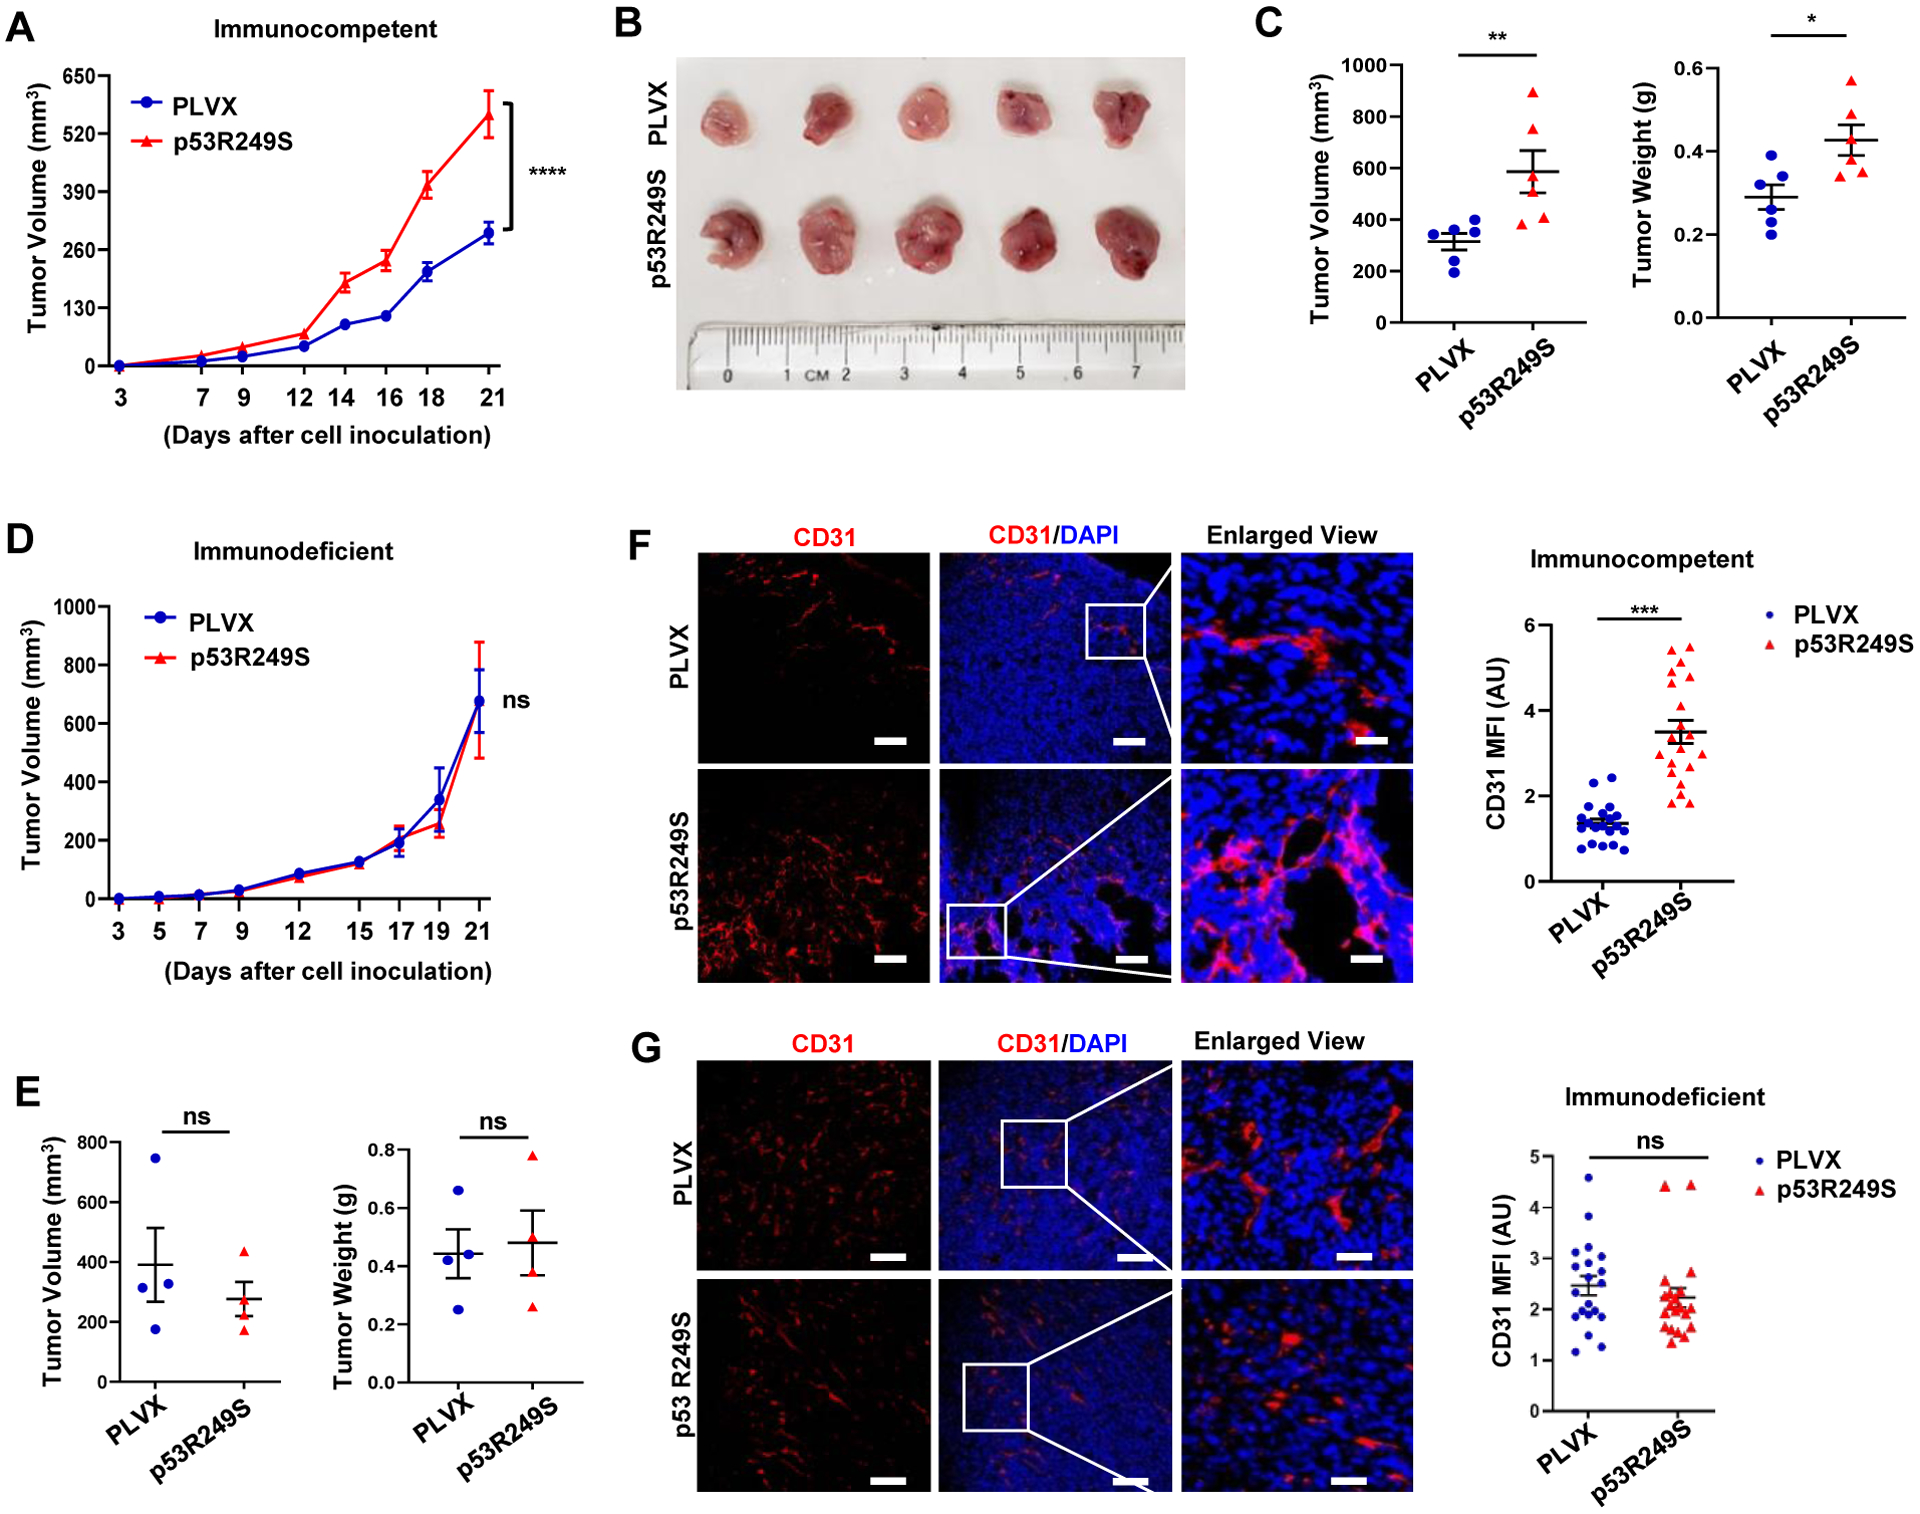
(A) 5 × 10⁴ 4T1 cells expressing PLVX or p53R249S were injected into the mammary gland of immunocompetent female BALB/c mice (n=10). All mice were sacrificed on day 21 and graphical quantification represents the tumor growth rate in mice. (B) Representative image showing tumor volume difference in BALB/c mice. (C) Graphical quantification of difference in tumor volume and weight on day 21 in PLVX and p53R249S cohorts (n= 6). (D) 5 × 10⁴ 4T1 cells expressing PLVX or p53R249S were injected into the mammary gland of immunodeficient NOD/SCID mice (n=4). All mice were sacrificed on day 21 and graphical quantification represents the tumor growth rate in NOD/SCID mice. (E) Graphical quantification of difference in tumor volume and weight in PLVX and p53R249S cohorts in NOD/SCID mice (n=4). (F-G) Representative confocal micrographs of 4T1 tumor sections from immunocompetent (BALB/c) (F) and immunodeficient (NOD/SCID) (G) mice stained with the angiogenesis marker CD31, and representative quantification of the mean fluorescence intensity (MFI) of endothelial marker CD31 intensity (n=20 FoV).
Scale bars=25 μm except in enlarged panel which is 100 μm. Data are shown as mean +/− SE. In scatter dot plots, each dot represent one mouse, p values are based on Student’s t test. ***p < 0.001, **p < 0.01, *p < 0.05, ns=non-significant. See also Figure S4
Mutant p53 suppresses immune surveillance to support tumor growth in vivo
To gain mechanistic insight into the phenotypic differences between these tumors, we did western blot analysis of 4T1 PLVX or p53R249S tumor lysates to detect IRF3 phosphorylation and RT-PCR analysis to assess IFNB1 mRNA levels. We observed reduced phosphorylation of IRF3 and STING in the p53R249S tumors (Figure 5A and 5B). Importantly, comparison of IFNB1 mRNA levels demonstrated that p53R249S tumors had reduced production of this cytokine (Figure 5C). Taken together, our results suggest that mtp53 suppressed IRF3 activation and IFNB1 production in vivo.
Figure 5: Mutant p53 suppresses immune surveillance to support tumor growth in vivo.
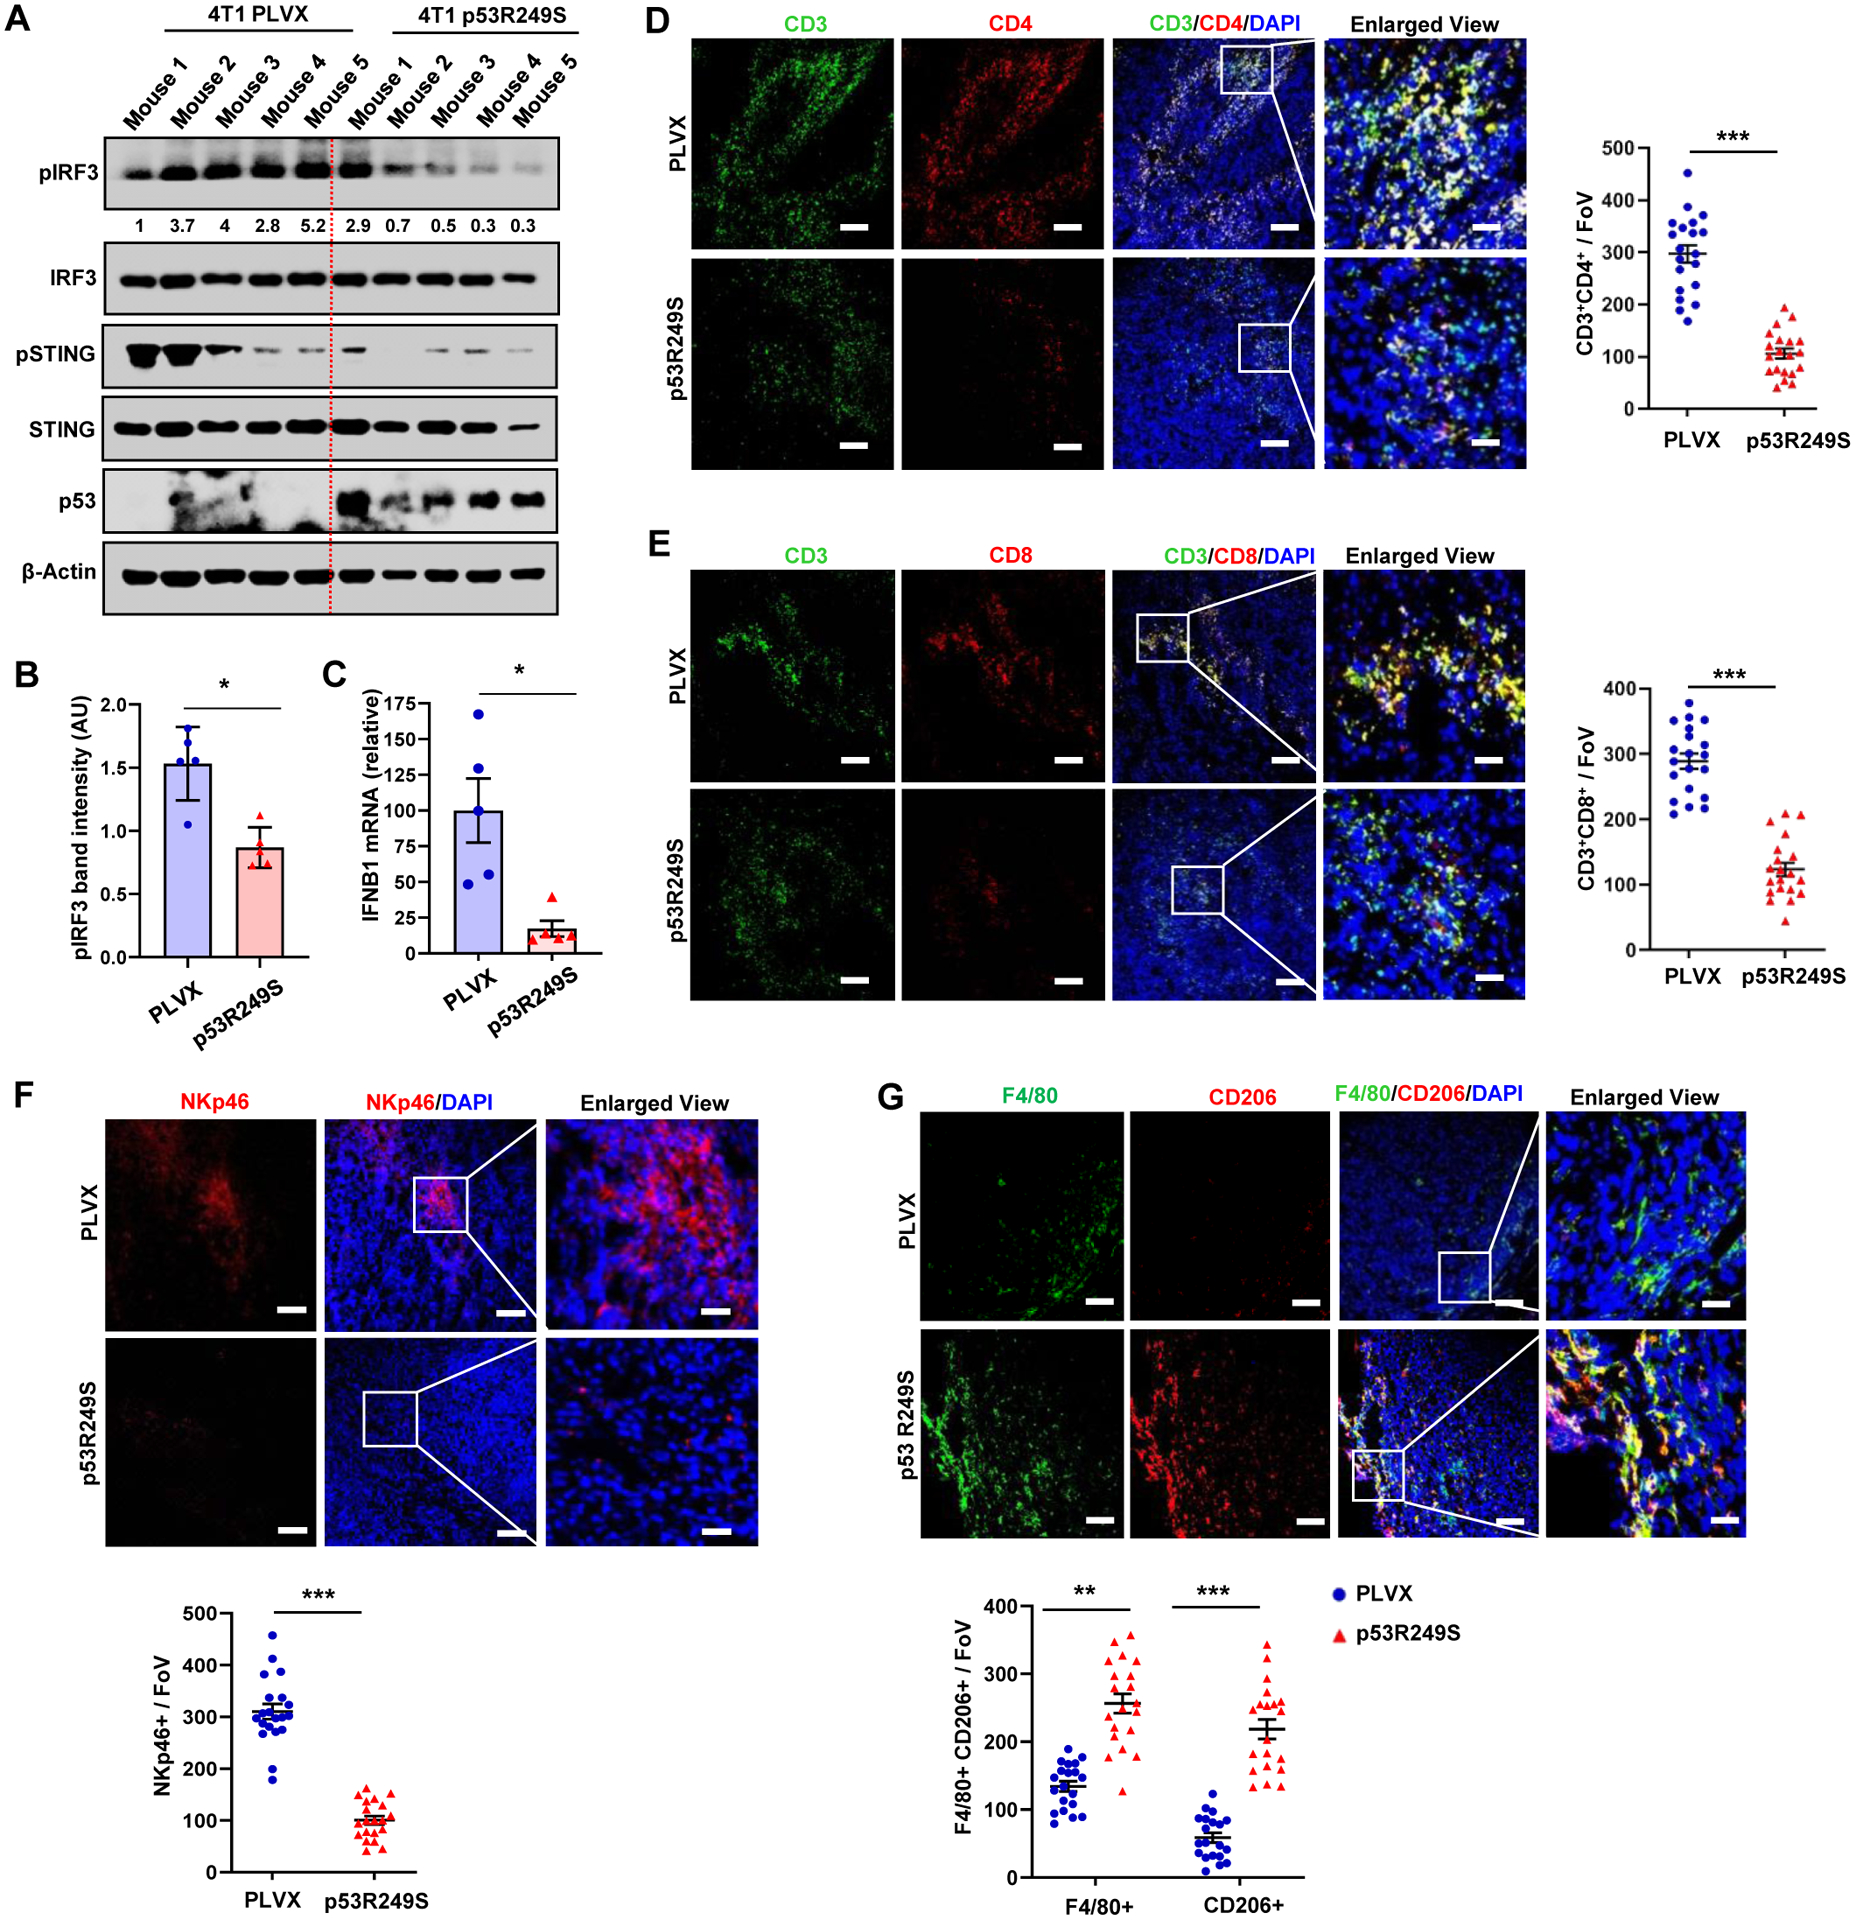
4T1 tumors in BALB/c mice were resected on day 21, cut into pieces for western, RT-PCR and IHC analysis. (A) Tumor tissue was subjected to western blot analysis. (B) Representative graph indicates pIRF3 band intensity in 4T1 PLVX and p53R249S tumors. (C) RNA was isolated from tumors and subjected to RT-PCR for IFNB1. (D-E) Representative confocal micrographs of CD3+CD4+ T-helper (D) and CD3+CD8+ T-cytotoxic lymphocytes (E) infiltration. Graphs showed quantification of CD3+CD4+ T-helper and CD3+CD8+ T-cytotoxic lymphocytes (n=20 FoV)) (F) Representative confocal micrographs of expression of the NK cell marker, NKp46, in 4T1 PLVX and p53R249S tumor sections and quantification of NK cell recruitment (n=20 FoV). (G) Representative confocal images depicting the F4/80+CD206+ M2 type of TAMs in PLVX and p53R249S expressing tumors isolated from BALB/c mice on day 21 and quantitation of F4/80+/CD206+ TAMs (n=20 FoV).
Scale bars=25 μm except in enlarged panel which is 100 μm. Data are shown as means +/− SE, p values are based on Student’s t test. ***p < 0.001, *p < 0.05. See also Figure S5
The innate immune STING-TBK1-IRF3 pathway plays an important role in anti-cancer immunity in vivo via activation of the type I interferon (IFN) response. (Ablasser and Chen, 2019; Bakhoum and Cantley, 2018; Talens and Van Vugt, 2019) Functionally, cancer cell production of type I IFN enhances recruitment of natural killer (NK) cells, T lymphocytes, and macrophages.(Ablasser and Chen, 2019; Bakhoum and Cantley, 2018; Talens and Van Vugt, 2019) Cytotoxic T lymphocytes, NK cells and macrophages play major roles in controlling tumor growth and thus we decided to assess if mtp53 modulated immune infiltration within the tumor microenvironment. Whereas PLVX tumors had an abundance of both CD4+ and CD8+ T-lymphocytes, the p53R249S tumors showed significantly less infiltration by these cells (Figure 5D and 5E). Furthermore, we observed a robust reduction of NK cell infiltration in the tumors expressing p53R249S compared to its PLVX counterpart (Figure 5F). Consistent with the reduced cytotoxic T-lymphocytes and NK cells infiltration in p53R249S tumors, we detected reduced apoptotic cells in these tumors relative to its PLVX counterparts (Figure S5A). Conversely, macrophages detected by F4/80+ staining were more abundant in the p53R249S tumors. Since TAM polarization to the M2 state has a pro-tumorigenic role by promoting neoangiogenesis, we assessed the F4/80+ macrophages for expression of CD206, a widely used marker for the macrophage M2 polarized state. This analysis indicated a stark difference between the PLVX and p53R249S tumors. Whereas most of the TAMs in PLVX tumors were negative for CD206 staining, the majority of them were in the M2 polarized state (F4/80+CD206+ dual positive) in the p53R249S tumors (Figure 5G). Given the lack of enhanced growth of the p53R249S tumors relative to the PLVX ones in the NOD/SCID mice, we performed IHC to assess the degree of macrophage infiltration and polarization (Figure S5B). Consistent with the known defective function of macrophages in NOD/SCID mice, we observed a 10-fold decrease in macrophage infiltration in both PLVX and p53R249S tumors, as well as a virtually complete absence of CD206 positive M2 cells.(Serreze et al., 1993a; Serreze et al., 1993b) Our results reveal that mtp53 promotes a pro-tumor microenvironment by reducing tumor infiltration of critical mediators of the anti-tumor response (CD8+ and NK cells) and promoting the phenotypic alteration of immune cells (M2 macrophages) to provide support for tumor growth.
We were intrigued to find such a striking difference in the presence M2 polarized macrophages between the tumors. Since the STING/TBK1/IRF3 pathway is critical for IFNB1 expression, we considered the possibility that reduced IFNB1 production in p53R249S tumors resulted in increased macrophage polarization to the M2 state. The latter is consistent with previously reported function of IFNB1, which is to maintain cells in the M1 phenotype.(Kakizaki et al., 2015; Vidyarthi et al., 2018) Therefore, to test if differences in cytokine production between the PLVX and p53R249S cells impacted macrophage polarization, we cultured RAW264.7 macrophage cells with the 4T1 PLVX or p53R249S conditioned medium. Macrophages cultured for 24 hours with PLVX conditioned medium expressed more mRNA of the M1 macrophage markers, TNFα and CD86, than did macrophages cultured in p53R249S conditioned medium. In contrast, macrophages exposed to the p53R249S conditioned medium exhibited higher expression of the M2 marker mRNA, IL-10 (Figure S5C). To determine if IFNB1 was reinforcing the M1 phenotype in the macrophages, we repeated the experiment with PLVX conditioned medium alone or the same medium in which we had added IFNB1 neutralizing antibody. Incubation of the macrophages with medium containing the IFNB1 neutralizing antibody no longer retained the M1 phenotype as determined by their reduced expression of the M1 marker, TNFα (Figure S5D). This observation reinforced the notion that IFNB1 plays a critical role in the maintenance of the M1 phenotype. Next we considered that supplementing the p53R249S conditioned medium with IFNB1 protein might prevent M2 macrophage polarization. We had previously determined that the PLVX cells secreted approximately 15 pg/ml of IFNB1, and thus we supplemented the p53R249S medium with additional IFNB1 to achieve this concentration. Addition of IFNB1 to the p53R249S conditioned medium resulted in reduced expression of the M2 marker, IL-10 (Figure S5E). Collectively our data indicate that by blocking type I interferon (IFNB1) production, mtp53 supports tumor growth by modulating immune cell recruitment and macrophage polarization.
Loss of mutant p53 triggers immune surveillance in a TBK1-dependent manner
To substantiate our assertion that mtp53 altered the tumor microenvironment to promote favorable conditions for tumor growth, we used KPC cells with inducible control vector or p53 shRNA to generate tumors in a syngeneic tumor host. KPC cells were treated in vitro with doxycycline for 2 days, and then 1×10⁵ cells were injected into the dorsal lateral side of C57BL/6 mice. All the mice were given doxycycline (20 mg/kg) by oral gavage. Strikingly, mtp53 knockdown strongly reduced the tumor growth rate (Figure 6A–6C). Western blot analysis of the tumors showed that mtp53 was efficiently knocked down and RT-PCR analysis revealed that this correlated with higher IFNB1 mRNA in shp53 tumors (Figure S6A and S6B). KPC tumors expressing mtp53 (EV) were more angiogenic than the shp53 set as assessed by IHC staining for CD31 (Figure 6D and Figure S6C), suggesting that mtp53 loss compromised their angiogenic potential. Previously it was reported that mtp53 knockdown in KPC cells had no effect on primary tumor growth in immune-deficient mice, which led us to hypothesize that the reduced tumor growth in the immune-proficient syngeneic host was due to altered immune cell recruitment.(Weissmueller et al., 2014) Analysis of T-lymphocytes in the tumors revealed that mtp53 knockdown resulted in robust infiltration of CD3+, CD4+, CD8+ cells and NK cells (Figure 6E–6G and S6D–S6F). Remarkably, mtp53 knockdown also resulted in an overall decrease in macrophage infiltration, as well as a reduction of M2-polarized macrophages (Figure 6H and S6G). Consistent with the increased cytotoxic T-lymphocyte and NK cell infiltration in shp53 tumors, more TUNEL positive cells were detected in these tumors relative to its EV counterpart (Figure S6H). Taken together, our data support the notion that mtp53 promotes tumorigenesis by evading immune surveillance.
Figure 6: Loss of mutant p53 triggers immune surveillance in a TBK1-dependent manner.
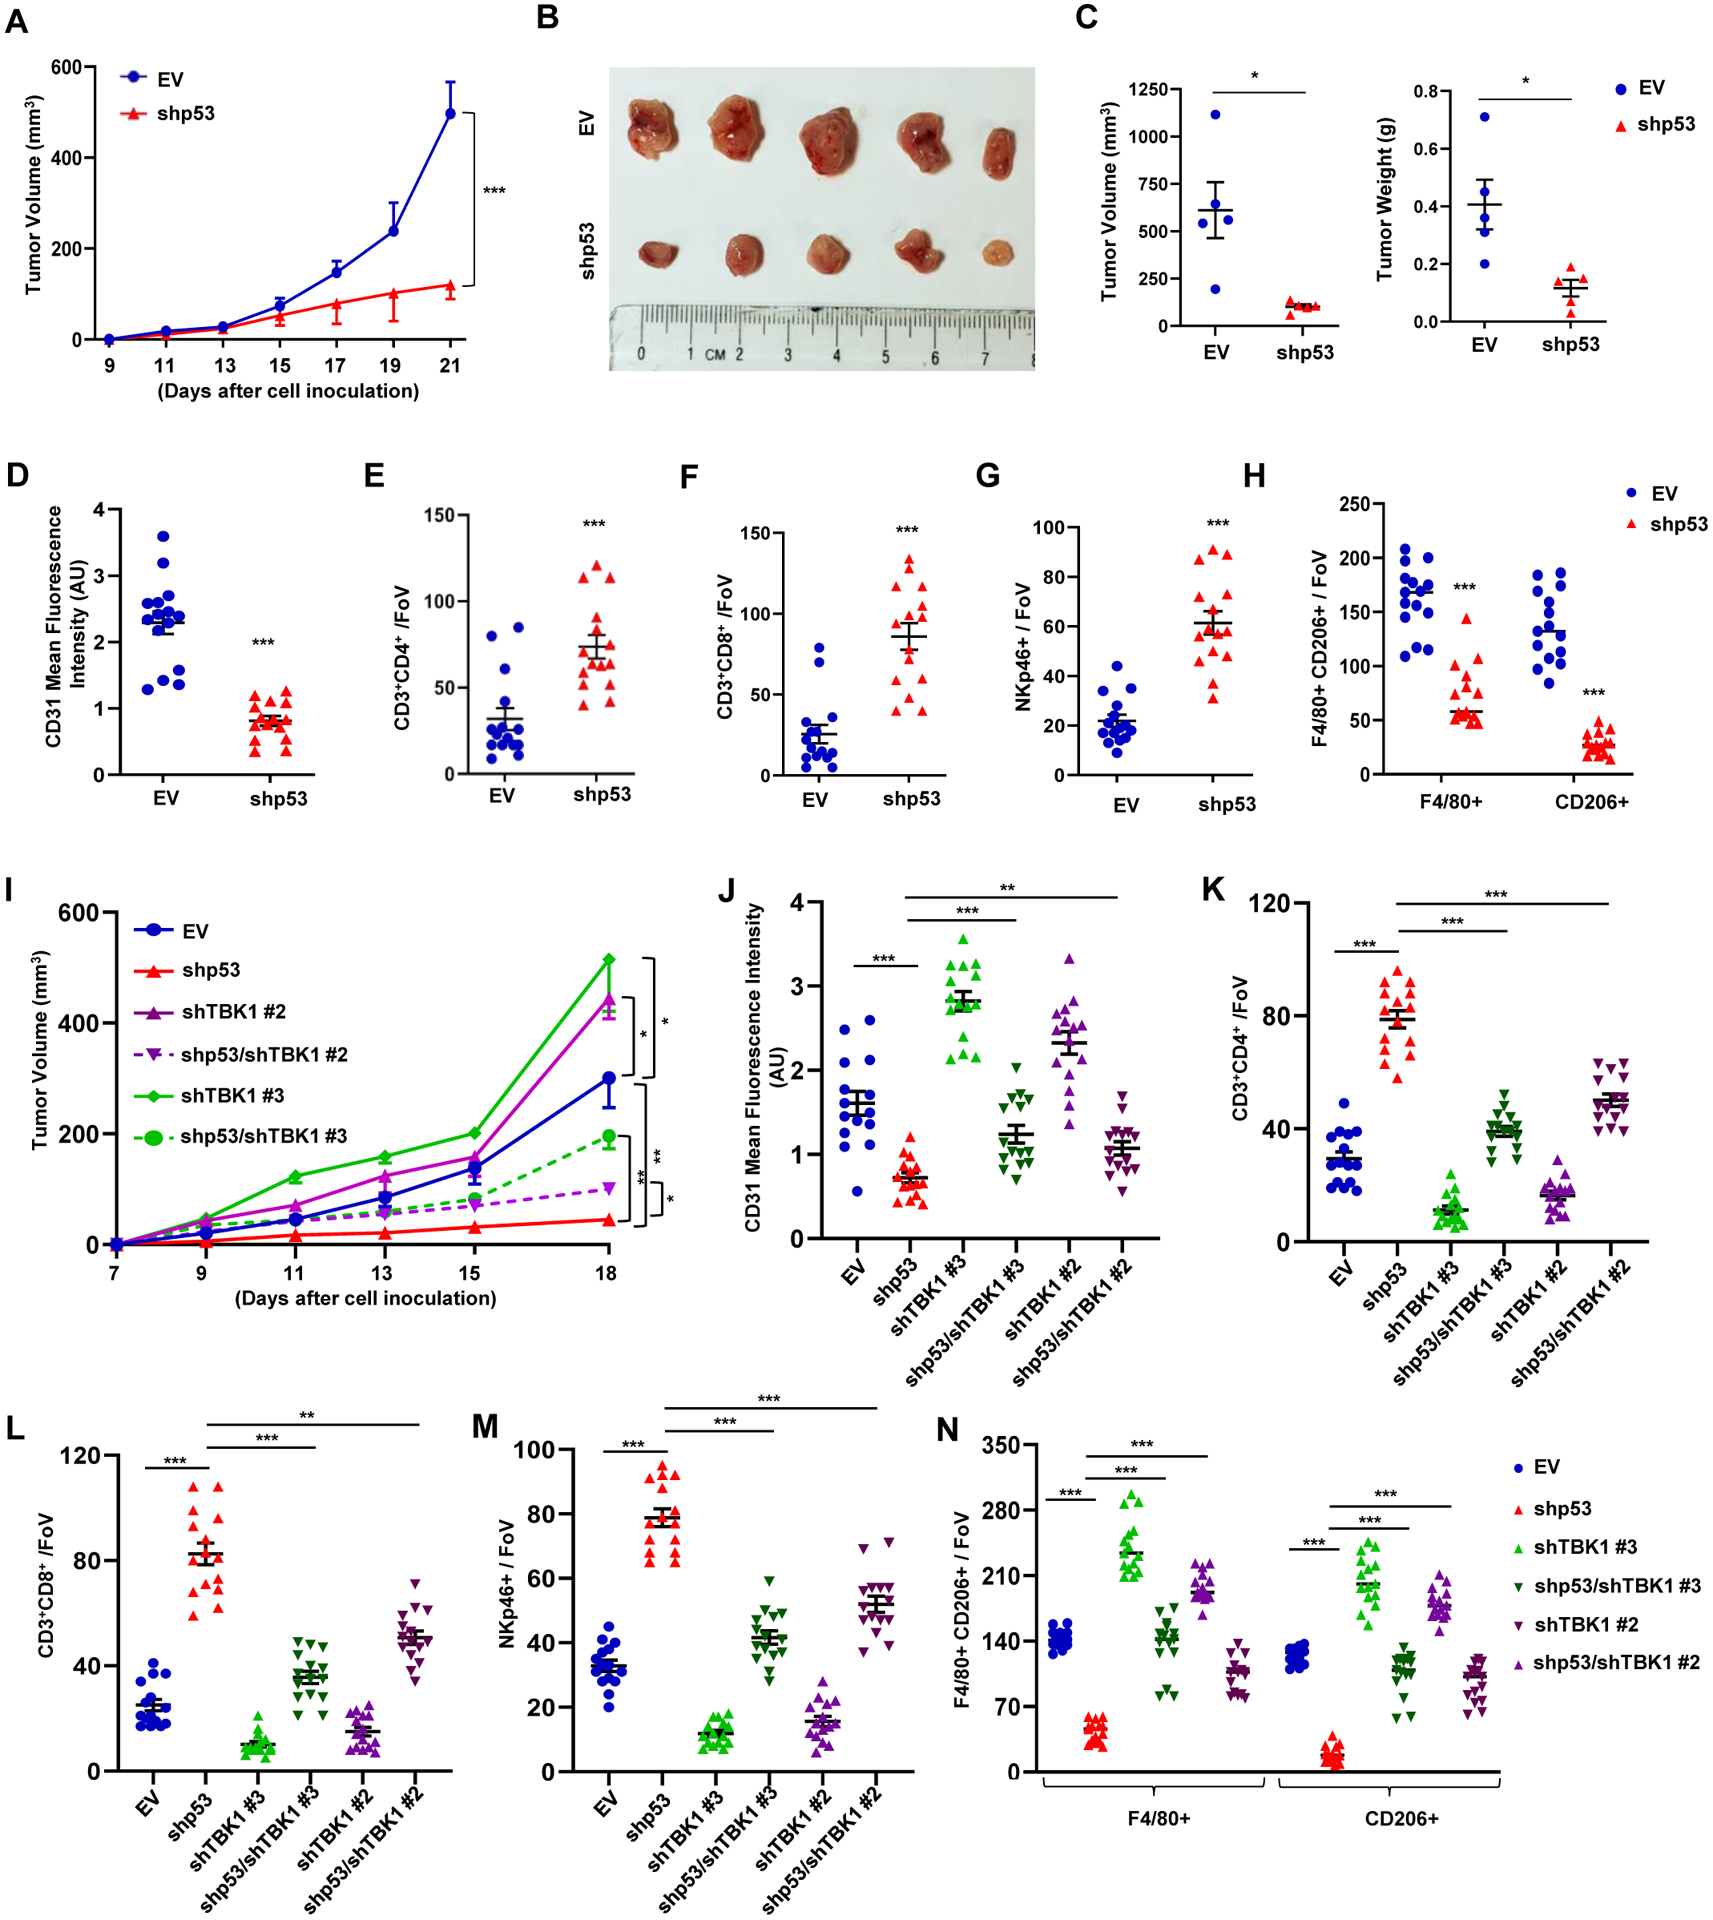
(A) KPC inducible EV or shp53 (1×10⁵) cells were injected subcutaneously in male C57BL/6 mice. Doxycycline (20 mg/kg) was given orally every other day to all the mice to induce either EV or shp53 starting from day 4. Tumor volume was monitored and measured manually using slide calipers (n=5). (B) KPC tumor harboring mice were sacrificed on day 21 and representative images show tumor volume difference between EV and shp53. (C) Representative graphical quantification of difference in tumor volume and weight on day 21 in EV and shp53 KPC tumor cohorts. (D) Representative graph indicates quantitation of mean fluorescence intensity of CD31 in EV and shp53 tumors (n=15 FoV). (E-F) Representative graphs showed quantification of CD3+CD4+ T-helper (E) and CD3+CD8+ cytotoxic T-lymphocytes (F) (n=15 FoV). (G-H) NKp46+ NK cells (G) and F4/80+/CD206+ TAMs (H) in EV and shp53 tumor sections (n=15 FoV). (I) Inducible EV or shp53 (1×10⁵) KPC cells infected with a control or TBK1 shRNA were injected subcutaneously in C57BL/6 mice. Doxycycline (20 mg/kg) was given orally every other day to all the mice to induce either EV or shp53 starting from day 4. Tumor volume was monitored and measured manually using slide calipers (n=5). (J) Representative graph indicates quantitation of mean fluorescence intensity of CD31 in indicated tumors (n=15 FoV). (K-L) Representative graphs showed quantification of CD3+CD4+ T-helper (K) and CD3+CD8+ cytotoxic T-lymphocytes (L). (M-N) NK cells (M) and F4/80+/CD206+ TAMs (N) in indicated tumor sections (n=15).
Data are shown as mean +/− SE, p values are based on Student’s t test. ***p < 0.001, *p < 0.05. See also Figure S6
To solidify our hypothesis that the reduced tumor growth in shp53 KPC tumors is due to TBK1 activation, we knocked down TBK1 in combination with shp53. Our in vitro data showed that mtp53 knockdown induced IRF3 phosphorylation, which was completely prevented by the simultaneous knockdown of TBK1 with three different shRNAs (Figure S6I). RT-PCR data showed that all three TBK1 shRNAs reduced IFNB1 mRNA alone. The combination of TBK1 and p53 knockdown, resulted in IFNB1 mRNA levels that were equivalent to control cells (Figure S6J). Analysis of in vitro cellular proliferation rates showed no difference between the EV, shp53, shTBK1 or shp53 with shTBK1 knockdown cells (Figure S6K). Next we used two different shTBK1 clones (shTBK1#2 and shTBK1#3) alone or in combination with shp53 to determine their impact on tumor growth in vivo. We injected 1×10⁵ cells into the dorsal lateral side of C57BL/6 mice and monitored tumor growth. Mtp53 knockdown alone reduced tumor size whereas shTBK1 promoted KPC tumor growth. Mtp53 knockdown in combination with shTBK1 substantially rescued the reduced tumor growth observed upon mtp53 knockdown (Figure 6I and Figure S6L–S6O). These data suggested that TBK1 reactivation limited tumor growth in mtp53 knockdown cells. To gain more insight into how TBK1 impacted tumor growth, we examined the tumors for angiogenesis and immune cell infiltration. Staining for CD31 indicated that the decreased angiogenesis that occurred in mtp53 knockdown tumors was rescued by concomitant TBK1 knockdown (Figure 6J and Figure S6P). Moreover, IHC analysis of immune cell infiltration in the tumors showed that the increased CD3+, CD4+, CD8+ cells and NK cells in shp53 knockdown tumors was due to TBK1 since TBK1 knockdown in combination with p53 reduced their presence (Figure 6K–6M and Figure S6Q–S6S). Strikingly, mtp53 knockdown reduced M2-polarized macrophages in the tumors which was rescued in dual p53/TBK1 knockdown (Figure 6N and Figure S6T.). Collectively our data indicate that mtp53 suppresses cell non-autonomous innate immune signaling by inhibiting TBK1.
Ectopic TBK1 expression overrides mutant p53’s effect
Our overall findings indicated that mtp53 suppressed TBK1 function and thereby prevented downstream signaling to IRF3, resulting in deficient paracrine signaling to immune cells. Therefore, we speculated that ectopic TBK1 expression might restore signaling to IRF3. To ascertain if TBK1 inhibition by mtp53 was dependent on their relative amounts, we performed co-transfection experiments in which we titrated one against a constant amount of the other. Transfection of increasing amounts of mtp53 reduced TBK1 phosphorylation, and conversely, transfection of increasing amounts of TBK1 overcame mtp53’s inhibitory effect (Figure S7A and S7B). These data suggested that mtp53’s inhibition of TBK1 could be titrated. To further test this possibility, we infected BT549 and MDA-MB-231 cells with an empty or TBK1 expressing vector. TBK1 overexpression was sufficient to restore IRF3 (and STING) phosphorylation and induced the expression of multiple IRF3 target genes in both cell lines (Figure S7C and S7D). Next, to test the consequence of restoring IRF3 activation on tumor growth, we engineered the 4T1-PLVX and 4T1-p53R249S cells to express a doxycycline inducible TBK1 and characterized these cells in vitro (Figure S7E). TBK1 induction resulted in an approximately 2-fold increase in TBK1 protein levels, which did not affect cell growth as assayed by MTT analysis (Figure S7F). TBK1 induction correlated with a 4-fold increase in IFNB1 mRNA in PLVX cells and a 2-fold increase in p53R249S cells (Figure S7G). Importantly, ELISA-based measurement of secreted IFNB1 showed that TBK1 induction in the p53R249S cells restored IFNB1 to approximately equivalent levels to those detected in the PLVX cells (Figure S7H). Next, we determined if TBK1 induction would alter the conditioned medium of p53R249S resulting in reduced RAW264.7 macrophage polarization in vitro. Exposure of the RAW264.7 cells to the conditioned medium from the PLVX cells with TBK1 induction further reinforced the M1 phenotype as indicated by increased expression of M1 markers by the macrophages. The conditioned medium from the p53R249S cells with induced TBK1 had a moderately diminished capacity to promote the M2 phenotype in the macrophages since their TNFα and IL-10 mRNA expression was reduced (Figure S7I).
We tested whether TBK1 induction would be sufficient to impact tumor growth in the BALB/c syngeneic mouse model. Female BALB/c mice were injected with 4T1 PLVX or p53R249S (5×10⁴) doxycycline inducible TBK1 cells. Mice were given doxycycline orally according to the schedule and tumor size was monitored (Figure 7A). Indeed, TBK1 induction strongly reduced the growth rate of the p53R249S tumors to the extent that at the end of the experiment these tumors were smaller than the PLVX tumors. We also observed that TBK1 expression in PLVX tumors modestly affected tumor growth (Figure 7B and Figure S7J). TBK1 expression in p53R249S tumors induced a 4-fold higher IFNB1 expression (Figure 7C). Strikingly, TBK1 induction in the p53R249S tumors reduced CD31 IHC staining, indicating that neovascularization was blocked (Figure 7D and Figure S7K). Furthermore, assessment of lymphocyte infiltration in response to TBK1 overexpression in p53R249S tumors revealed a robust recruitment of CD4+ T-helper and CD8+ T-cytotoxic lymphocytes as well as an increase in NK cell infiltration of these tumors (Figure 7E–7G, and Figure S7L–S7N). Moreover, TBK1 overexpression in p53R249S tumors resulted in a reduction in M2 polarized macrophages (Figure 7H and 7I and Figure S7O). Over all, our data indicates that mtp53 disables TBK1 resulting in attenuation of the type I interferon response and perturbation of anti-tumor immune cell infiltration (Figure 7J). Taken together, our data suggests that the ability of mtp53 to foster a pro-tumorigenic microenvironment can be reversed by restoring TBK1 signaling.
Figure 7: Ectopic TBK1 expression overrides mutant p53’s effect.
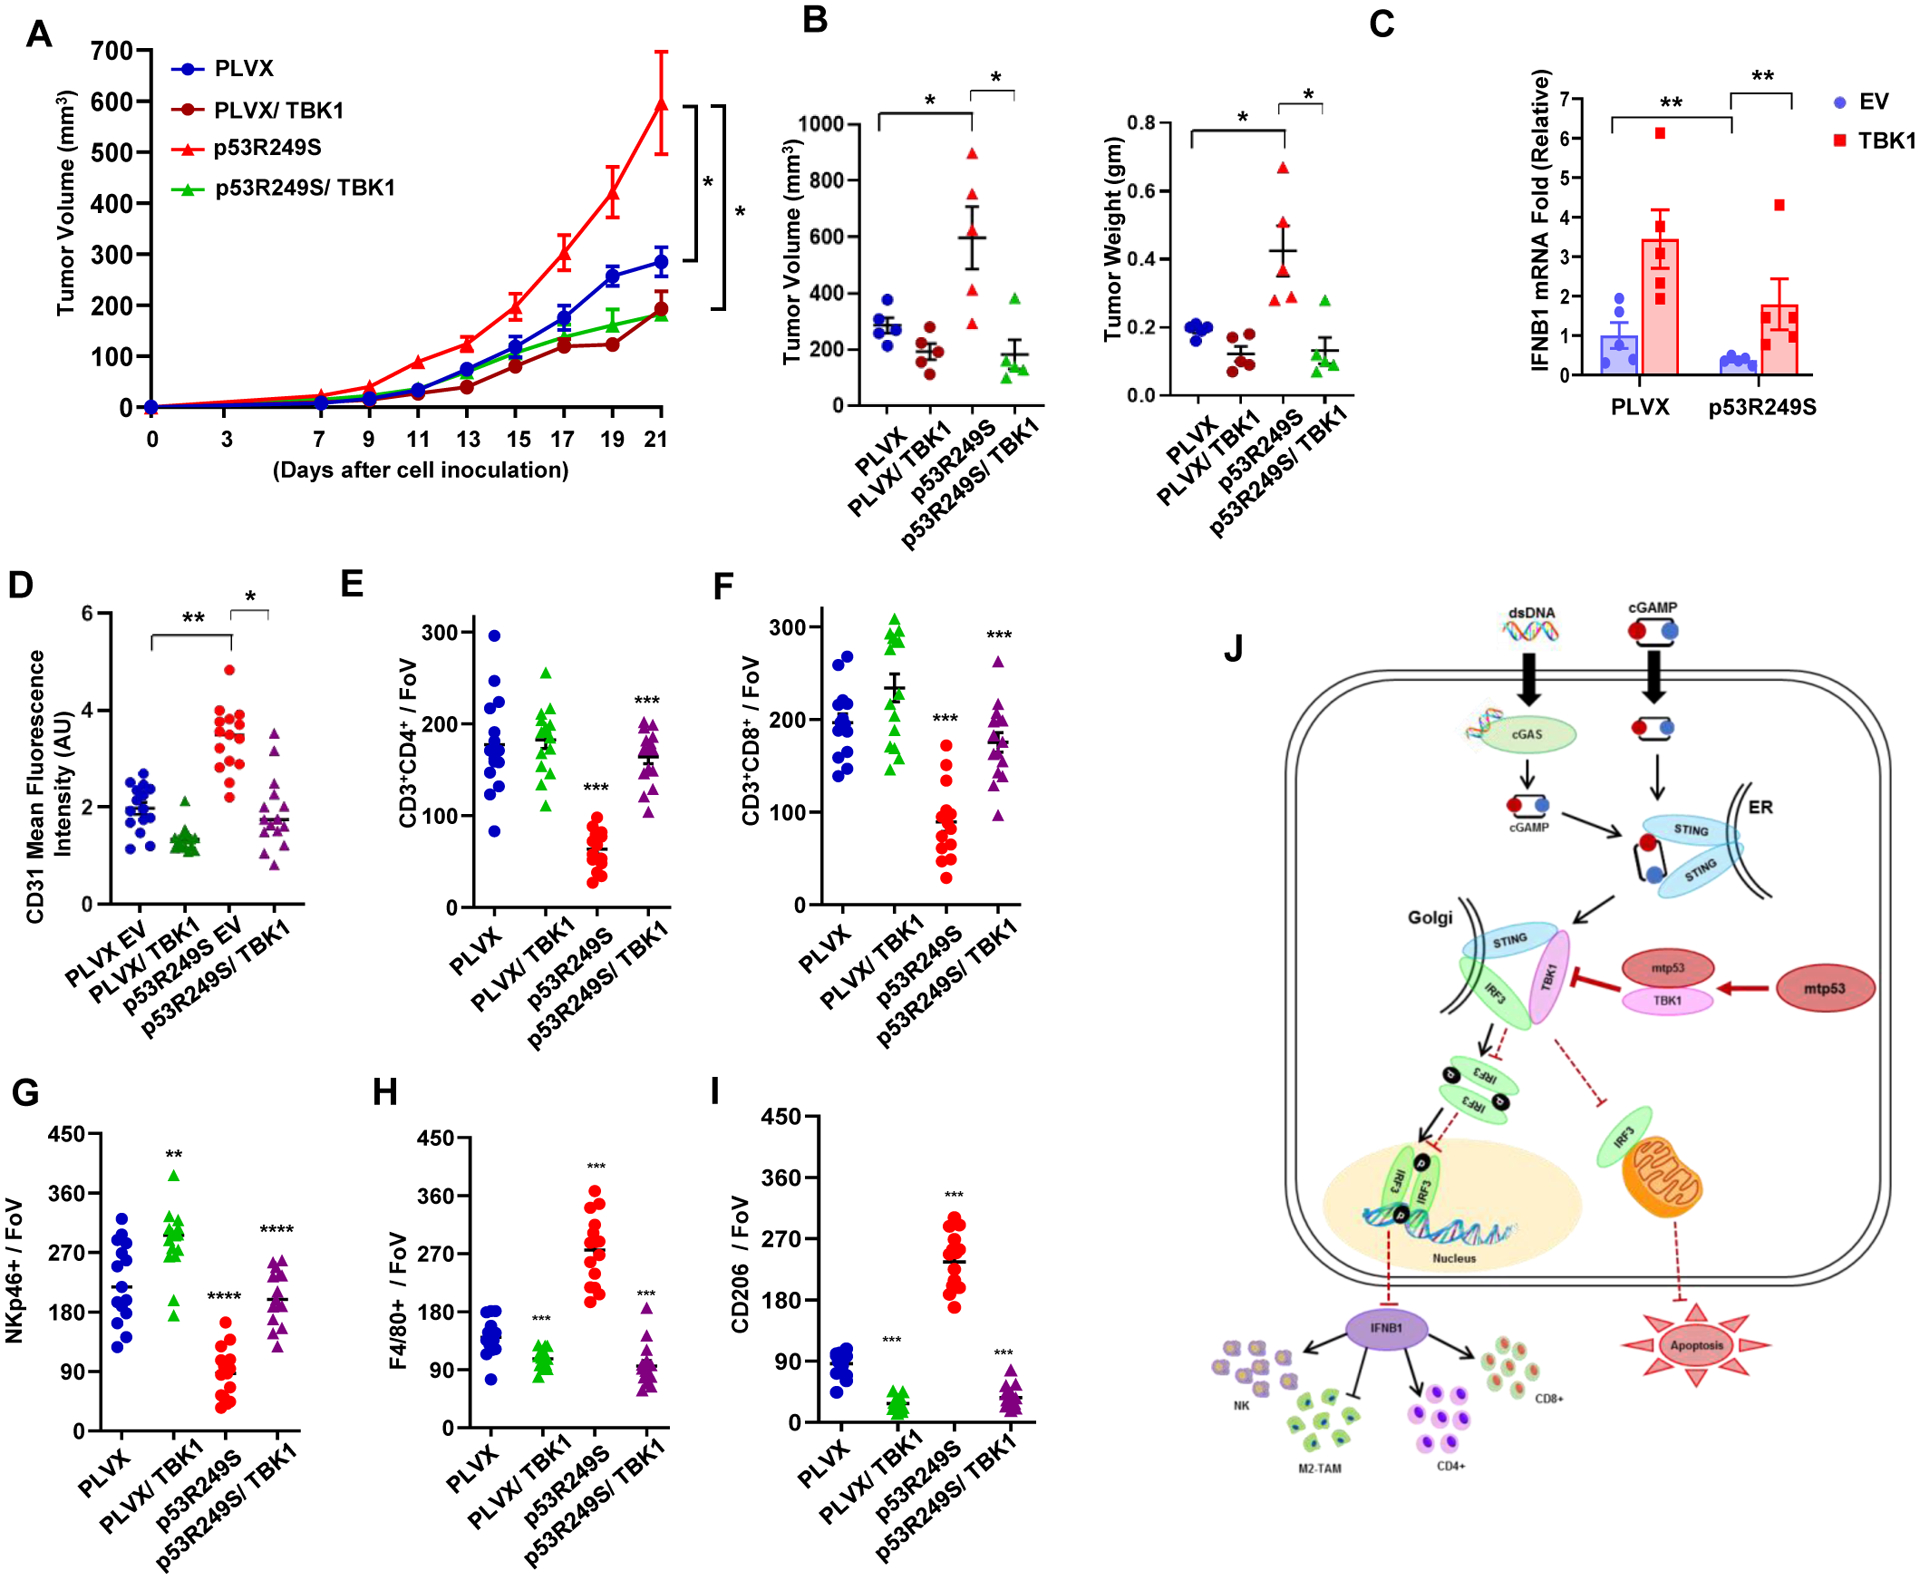
(A) 5 × 10⁴ PLVX or p53R249S inducible EV or TBK1 4T1 cells were injected in the mammary fat pad of female BALB/c mice. Doxycycline was administered from day 5 and tumor volume was measured (n=5). (B) Graphical quantification showing the tumor volumes and weight differences of different cohorts. (C) Mice were sacrificed on day 21; tumors were excised, and RNA was isolated. Representative graph indicate quantitative mRNA expression of IFNB1. (D) Graphical quantification depicting quantification of CD31 intensity in the indicated cohort (n=15). (E-I) Representative quantitation from the cryo-section of different tumor cohorts of CD3+CD4+ T-helper cells (E), CD3+CD8+ T-cytotoxic subsets (F), NKp46+ NK cells (G), and F4/80+ (H) and CD206+ (I) M2-like macrophage subsets (n=15). (J) Schematic representation of mutant p53 disabling the innate immune response signaling pathway. Mutant p53 expressing cells fail to activate the type I interferon response and alter immune surveillance (non-cell autonomous) and also suppress mitochondria mediated apoptosis (cell autonomous).
Data shown as means +/− SE, p values are based on Student’s t test. ***p < 0.001, **p < 0.01, *p < 0.05. See also Figure S7
Discussion:
Mutation of TP53 is one of the most frequent genetic lesions in human cancers. Mutant p53 exhibits various gain-of-function (GOF) activities that contribute to tumor development and progression. In our study, we utilized multiple cell lines and approaches to corroborate that a GOF activity of mtp53 is to antagonize the innate immune pathway. Therefore, our data provide a mechanism by which mtp53 compromises cell intrinsic (apoptosis) and extrinsic (immunomodulatory) anti-tumor activities of the STING-TBK1-IRF3 pathway. Moreover, we observed that different p53 mutants suppress this pathway. This raises the possibility that p53 mutants that potently interfere with the pathway will be selected for and overrepresented in cancer. Thus, suppression of the innate immune pathway may be a selective mechanism that drives the occurrence of hotspot p53 mutations.
In direct contrast to mtp53, our data suggest that wildtype p53 contributes to the activation of the cGAS/STING pathway. Our analysis of human triple negative breast cancer data from TCGA found several cGAS/STING regulated chemokines and cytokines including IFNB1 to be more positively correlated with wildtype p53 than mtp53. The precise mechanism underlying this remains to be determined, but it is potentially mediated by the wildtype p53 transcriptional target, IFI16. (Almine et al., 2017; Jonsson et al., 2017; Munoz-Fontela et al., 2008; Song et al., 2008; Takaoka et al., 2003). Loss of wildtype p53 combined with an ATR inhibitor and DNA damage has been shown to induce a STAT1-dependent inflammatory response that does not require cGAS.(Chen et al., 2020) Thus, wildtype and mutant p53 function in opposing manners to control innate immune signaling.
Intriguingly, mtp53 proteins are tumor specific neo-antigens that are immunogenic and predicted to render cancer cells susceptible to immune editing. (Lo et al., 2019; Lu and Robbins, 2016; Malekzadeh et al., 2019; Sahin and Tureci, 2018) However, despite eliciting immunogenic responses in tumor infiltrating lymphocytes, mtp53 expressing cells persist. We observed that mtp53 altered immune cell infiltration/phenotypes, and this could be reversed by reactivating IRF3 through TBK1 overexpression. We speculate that suppression of the STING-TBK1-IRF3 pathway by mtp53 renders tumors immunologically “cold”, thereby permitting cancer cells that express this neo-antigen to evade immune detection. Importantly, disruption of the mtp53/TBK1 complex switches the tumor microenvironment from cold to hot and permits the immune system to limit tumor growth. However, it is possible that other (TBK1-independent) mutant p53 activities also contribute to the modulation of the tumor microenvironment. (Cooks et al., 2018; Kim and Lozano, 2018) In addition, further work is required to determine if the negative regulation of the innate immune response by mtp53 primarily impacts cancer cell-intrinsic or extrinsic mechanisms, or both to promote tumor growth.(Kitajima et al., 2019; Marcus et al., 2018; Schadt et al., 2019)
Active STING signaling produces type I IFN, and type I IFN is critical for the initiation of anticancer immune responses. Our study is of interest as STING agonist alone or in combination with a range of chemotherapeutic and immunotherapeutic agents are in clinical trials, and thus the p53 status could guide treatment options. Therapeutic approaches aimed at activating TBK1 function could restore tumor suppressing immune-surveillance and eliminate mutant p53 expressing tumors.
STAR★Method
RESOURCE AVAILABILITY
Lead Contact
Further information and requests for resources and reagents should be directed to and will be fulfilled by the Lead Contact, Dr. Luis A. Martinez (Luis.Martinez@StonyBrookMedicine.edu).
Materials Availability
All requests for resources and reagents should be directed to and will be fulfilled by the Lead Contact. This includes plasmids and proteins. All reagents will be made available on request after completion of a Material Transfer Agreement.
Data and Code Availability
All data supporting the findings of this study are available within the paper and are available from the corresponding author upon request. All the original data for western blots is available at Mendeley (http://dx.doi.org/10.17632/w4rxzck3kw.1)
Experimental Model and Subject Details
Mice
4–6 weeks old female BALB/c, NOD/SCID mice were purchased from Envigo. 4–6 weeks old male c57BL/6 mice were purchased from Jackson Laboratory. All the experiments with mice were conducted in Stony Brook University animal care facility and in accordance with the Institutional Animal Care and Use Committee.
Cell Lines
All the cell lines were purchased from ATCC and cultured according to the manufacturer’s instructions. MDA-MB-231, BT549, H1299, MiaPaCa2, A549 cells (Human) were cultured in complete Roswell Park Memorial Institute (RPMI) medium supplemented with 10% Fetal Bovine Serum (FBS). KPC (kind gift from Dr. Richard Lin, Stony Brook University), HEK293T, 4T1, RAW264.7 cells (Mouse) were cultured in complete Dulbecco’s Modified Eagle Medium (DMEM) medium. MEFs (p53−/−, p53R172H/R172H) were isolated in Dr. Iwakuma’s Lab, University of Kansas Medical Center, and have been previously described and were cultured in complete DMEM medicum (Parrales et al., 2016). IMR-90 and HFF (kind gift from Jeffrey Stith and Dr. Lina Obeid’s lab, Stony Brook University) cells (Human) were cultured in DMEM with 15% FBS supplemented with non-essential amino acids.
Method Details
Cloning and Plasmids
PLKO and PLKO-shp53 were a kind gift from Robert Weinberg (Addgene #8453 and #19119). Non-targeting control and mouse p53 shRNA were cloned into EZ-Tet-pLKO-Puro (addgene:85966). IRF3 knockout BT-549 and MD-MB231 cells lines were prepared using CRISPR/Cas9 technique. Guide RNA was cloned in lentiCRISPRv2-puro (addgene: 98290) as previously described (Shalem et al., 2014). The viral particle was generated and infected to the target cells as described above and selected for 10 days. pCMV-Myc-TBK1 was generated by PCR amplification of TBK1 from pWZL Neo Myr Flag TBK1 (Addgene #20648, gift from Jean Zhao) and cloning in frame with the MYC tag in PCMV-MYC (Clontech). pCMV-HA-STING was generated by PCR amplification of STING from IMR90 lung fibroblast cDNA and cloning into pCMV-HA (Clontech). pcDNA3-GFP-IRF3 was a kind gift from Nancy Reich (Stony Brook University). TBK1 was amplified from pCMV-MYC-TBK1 to clone into PLVX-puro (Clontech). The p53R249S cDNA was cloned into the lentivirus vector PLVX-puro (or hygro). p53 point mutants: Different p53 point mutants (HAp53P142L, HAp53P152Q, HAp53A161V, HAp53C174Y, HAp53R175H, HAp53R248W, HAp53R249S, HAp53R273H, HAp53R280K) were generated using site directed mutagenesis (NEB) of pCMV-HA-wildtype p53. A series of deletion mutants were prepared based on p53R248W and p53R249S, Δ21–71, Δ72–122, Δ123–173, Δ174–224, Δ225–275, Δ276–326, Δ327–377 and cloned onto pCMV vector. All the constructs used in the study were confirmed by DNA sequencing. The sequences for sgRNAs, shRNAs and primers for PCR mutagenesis used in this study are listed in Supplementary Table S2.
Lentiviral particles production in 293FT cells.
For shRNA knockdown lentiviral particle was generated by transfecting 293T cells with 1.5 μg of ps-Pax2 (addgene), 0.5 μg of pCMV-VSV-G (addgene) and 2 μg of plasmid of interested genes using Lipofectamine 2000. Viral supernatant was collected post 48 hrs and 72 hrs of transfection. Target cells were infected with the viral particle using polybrene (5 μg/mL). Post 48 hrs after infection media was changed and selected with puromycin or hygromycin for 3 days.
Generation of IRF3 knock out cells using CRISPR-Cas9
To generate lentiviruses for transduction, HEK293T cells were transfected with plasmid(s) encoding IRF3 sgRNAs and packaging vectors (VSVG and psPAX2) using a standard Lipofectamine 2000 transfection method. Lentiviruses encoding Cas9 were generated using the same technique. Culture supernatants were collected at 48 and 72 h post-transfection and used for infection of BT549 and MDA-MB-231 cells with polybrene (5 μg/ml). Cells were selected with puromycin (1 μg/ml) 48 h post infection for 10 days.
TCGA gene correlation study.
Triple negative breast cancer TCGA (The Cancer Genome Atlas) cancer data was downloaded from cBioPortal for Cancer Genomics (www.cbioportal.org). Among the datasets, RNA-Seq, aggregated mutation, and sample clinical information were used in our study. For TCGA breast cancer, triple-negative breast cancer annotation were downloaded from Table S2, (Chiu et al., 2018). First, we made subgroups of breast cancer data by solely including triple-negative breast cancer. Next we further classified to TP53 wild type subgroups and TP53 missense mutation subgroups for all datasets, and calculated Pearson correlation coefficients between all other genes and TP53 expressions, based on RNA-Seq data. Then, we took interferon genes only and plot the coefficients by scatter plots, as TP53 missense mutation subgroup vs. wild type subgroup.
Cell proliferation assay.
4T1 PLVX or p53R249S cells (3,000) and 4T1 PLVX or p53R249S induced TBK1 cells or KPC EV, shp53 shTBK1 and shp53/shTBK1 cells were seeded on a 96-well plate and cell proliferation was detected for next five days. Viable cells were measured by CellTiter-Blue® Cell Viability Assay kit (Promega) according to the manufacturer protocol. Briefly, 20ul of cell titre blue reagent was directly added to the culture medium and incubated at 370C for 4 h and plates were shaken for 10 sec and the fluorescence reading were obtained by reading the plate at 570/590 nm by Molecular Device Spectra Max M5 instrument.
Real-time quantitative PCR (qRT-PCR).
Total RNA from cells/tissues were collected in RLT buffer and was isolated using the Qiagen mini RNA isolation kit. RNA quantity and quality were confirmed with a NanoDrop ND-1000 spectrophotometer, cDNA was synthesized using 500ng of total RNA using oligo (dT) primers and Reverse Transcriptase (Quanta). Real-time qRT-PCR was performed in Bio-Rad CFX96 Touch real-time PCR detection system using Universal SYBr Green Supermix (Bio-Rad). Gene-specific primers sequences listed in Supplementary Table S2.
IFN Beta measurement by ELISA.
p53KD BT549, KPC and p53−/−, p53R172H/ R172H MEFs and p53R248W overexpressing H1299 and p53R249S expressing 4T1 cells (106) were seeded on a 60 mm dish and after 24 hrs cells stimulated by HT-DNA (4 μg) for another 18 hrs and collected supernatants were analyzed using VeriKine Human IFN Beta or mouse IFN Beta ELISA Kit. Quantification of IFNB1 concentration was performed in triplicates according to the manufacturer protocol and the reading was taken at 450 nm by Molecular Device Spectra Max M5 instrument and calculated using an IFNB1 standard curve.
Immunofluorescence.
GFP-IRF3 positive MDA-MB-231 cells were grown onto 1% gelatin pre-coated glass coverslips and after all the treatment cells were washed twice with DPBS and counter stained with Hoechst 33342 and mounted with the ProLong Gold Antifade Reagent. Images were captured with a Nikon Ti epifluorescence microscope and processed using Nikon AR software. GFP-IRF3 positive H1299 or MDA-MB-231 inducible shp53 cells were grown onto glass cover slides and after all the treatment cells were washed twice with DPBS and fixed with 4% paraformaldehyde for 15 mins at room temperature. Cells were then permeabilize with 0.1% triton X-100 and block in 2% BSA for 45 mins. Cells were then incubated with corresponding primary antibodies overnight at 40C. Cells were washed twice and incubated with secondary antibody for 2 hrs at room temperature. Secondary antibody washed counterstained by DAPI and mount on slides with Fluoromount G.
Flow cytometry.
P53KD, IRF3KO or Double KD BT549 cells and p53R248W overexpressing H1299 cells were transfected with HT-DNA for 24hrs and induced apoptosis was determined using flow cytometric analysis. Cells were washed with PBS, resuspended in 100 μl of binding buffer and further incubated with Annexin-V FITC and PI for 15 min in dark at room temperature. Prior to flow cytometric analysis, 400 μl of binding buffer was added and immediately subjected for the FACS analysis for the number of apoptotic cells. Data was generated using BD FACS Calibure and analyzed using BD FACS DIVA 6.2 software.
Immunoblotting and Immunoprecipitation.
To prepare cell lysates for western blotting, the cells were lysed on the dish using RIPA (0.5% SDS, 0.1% Sodium Deoxycholate, 0.5% NP40, 1 mM EDTA, in PBS pH 7.4 and filter-sterilize) buffer supplemented with protease and phosphatase inhibitors, scraped and placed into microcentrifuge tubes, sonicated and centrifuged at 13,000g for 10 mins at 4 °C to remove insoluble material. Protein concentration was determined using the Micro BCA Protein Assay kit (Pearce) and equal amounts of protein were resolved on 8 or 10% Bis-Tris polyacrylamide gels, transferred to a PVDF membrane blocked with 5% milk and incubated with primary antibody over night at 40C. For co-immunoprecipitation of proteins, cells were washed with PBS, harvested and lysed in immunoprecipitation buffer (50 mM Tris-HCl pH 8.0, 150 mM NaCl, 0.05 mM EDTA, 1% NP40 and 10% glycerol). Lysate was clarified by centrifugation at 20,000g (4°C) for 20 min, pre-cleared with protein-G agarose (KPL) for 2 h at 4 °C and then immunoprecipitated overnight with the corresponding antibodies. For cell fractionation assay, mutant p53 knockdown KPC and BT549 cells were lysed, cytosolic and nuclear fractions were extracted using NE-PER™ Nuclear and Cytoplasmic Extraction kit according to the manufacturers protocol.
Macrophage polarization Assay.
RAW 264.7 mouse macrophages were seeded in a 6-well plate (105) after 24 hrs cultured medium was replaced with 4T1 PLVX or p53R249S conditioned medium containing either control antibody/αIFNB1 antibody or IFNB1 protein for another 24 hrs. After all the incubation cells were harvested, RNA was isolated and further processed for RT-PCR analysis.
In vivo animal experiments.
Mice were anesthetized using Isoflurane and 4T1 PLVX or p53R249S cells (50,000) in 0.1 ml PBS were injected in the mammary gland after anaesthetizing the mice. Mice were monitored and tumor volume was measured manually using slide calipers every other day till day 21 when all the mice were sacked.
KPC inducible EV or shp53 cells were trypsinized washed twice with PBS and 1×10⁵ cells in PBS were injected subcutaneously at the back after anaesthetizing the mice. All the mice were given doxycycline (20 mg/kg) orally every other day starting from day 4 to induced either EV or shp53. Tumors were monitored and volume was measured manually using slide calipers till day 21 when all the mice were sacked and the tumors were processed for further experiment.
KPC inducible EV (shcontrol or shTBK1) or shp53 (shcontrol or shTBK1) cells were trypsinized washed twice with PBS and 1×10⁵ cells in PBS were injected subcutaneously at the back after anaesthetizing the mice. All the mice were given doxycycline (20 mg/kg) orally every other day starting from day 4 and tumors were monitored and volume was measured manually using slide calipers till day 18 when all the mice were sacked and the tumors were processed for further experiment.
4T1 PLVX (Inducible EV or TBK1) and p53R249S (Inducible EV or TBK1) cells were trypsinized, washed twice with PBS and 50,000 cells in PBS were injected in the mammary gland after anaesthetizing the mice. Mice were monitored and were given orally 20 mg/kg Doxycycline every other day to induce either EV or TBK1. Tumor volume were measured manually using slide calipers till day 21 when all the mice were sacked and the tumors were resected and further processed.
Immunohistochemistry.
For the immunohistochemistry assays, the tumors were resected and fixed in 4% paraformaldehyde for overnight, dehydrated with a gradient sucrose solution of 15% and then 30% at room temperature (RT). Then tumor tissues were embedded in optimal cutting temperature compound (OCT) and immediately frozen at −80°C until further use. Tumor blocks were cryo-sectioned at a thickness of 10 μm using Leica Cryostat (Leica CM1900). Tumor sections were washed thrice with PBS to wash residual OCT compound, permeablized with 0.1% Triton X-100, blocked in 1% BSA in PBS for 45 mins at RT and incubated with the primary antibodies against: anti-Ki67, anti-CD3, anti-CD4, anti-CD8, anti-F4/80, anti-CD206, anti-NKp46 and anti-CD31 over night at 4°C. After the primary incubation sections were washed and incubated with Alexa flour 555 or Cy5-labelled secondary antibodies for one hour at room temperature, tumor sections were washed three times and counter stained with DAPI and mount with Fluoromount G. Immunohistochemical images of Ki67 were captured in Nikon Ti microscope and immunofluorescence images were captured using Leica TCS SPF5 II confocal microscope at 20X magnification and analyzed using ImageJ software.
TUNEL Staining.
TUNEL analysis was performed in 4T1 PLVX and p53R249S tumor sections and KPC EV or shp53 tumor sections using the Apoptag Fluorescein In Situ Apoptosis Detection Kit according to manufacturer’s instructions. Briefly, tissue cryo-sections were washed in DPBS thrice to remove residual OCT medium, sections were then covered with equilibration buffer for a minimum of 1 min. Then the sections were incubation at 37°C for 1 hr with TdT enzyme (30% enzyme and 70% reaction buffer), followed by 10 mins incubation at room temperature in stop/wash buffer. Sections were then incubated in fluorescein anti-digoxigenin conjugated secondary antibody, washed, counter stained with DAPI and mounted.
Statistical analysis.
All the experiments were repeated at least three times unless otherwise mentioned in the figure legends. The statistical differences in all assays including Fold difference in mRNA, cell proliferation and growth, flow cytometry and tumor growth between different samples and/or treatments were analyzed by two-tailed Student’s t-tests using Microsoft Excel 2007 and all the graphs were made on GraphPad Prism 8 (GraphPad Software) and presented as Mean +/− SD or Mean ±SE. Statistical significance was set at P < 0.05, unless otherwise stated in the text. All experiments were carried out with at least three biological replicates otherwise mentioned in the figure legend. The numbers of animals used are described in the corresponding figure legends.
Supplementary Material
Table S1: TCGA data related to STAR Methods.
KEY RESOURCES TABLE
| REAGENT or RESOURCE | SOURCE | IDENTIFIER |
|---|---|---|
| Antibodies | ||
| STING (D2P2F) | Cell Signaling | Cat# 13647, RRID:AB_2732796 |
| TBK1 / NAK | Cell Signaling | Cat# 3504, RRID:AB_2255663 |
| IRF3 | Cell Signaling | Cat# 4302, RRID:AB_1904036 |
| Phospho-STING (Ser366) | Cell Signaling | Cat# 19781, RRID:AB_2737062 |
| Phospho-TBK1/NAK (Ser172) (D52C2) | Cell Signaling | Cat# 5483, RRID:AB_10693472 |
| Phospho-IRF-3 (Ser396) (D6O1M) | Cell Signaling | Cat# 29047, RRID:AB_2773013 |
| TP53 | Santa Cruz Biotechnology | Cat# sc-126, RRID:AB_628082 |
| p53 (FL-393) | Santa Cruz Biotechnology | Cat# sc-6243, RRID:AB_653753 |
| GAPDH | GeneTex | Cat# GTX100118, RRID:AB_1080976 |
| Anti-beta-Actin-Peroxidase antibody | Sigma-Aldrich | Cat# A3854, RRID:AB_262011 |
| c-Myc | Santa Cruz Biotechnology | Cat# sc-40, RRID:AB_627268 |
| HA-probe (F-7) | Santa Cruz Biotechnology | Cat# sc-7392, RRID:AB_627809 |
| GFP (B-2) | Santa Cruz Biotechnology | Cat# sc-9996, RRID:AB_627695 |
| Ki67 | Abcam | Cat# ab15580, RRID:AB_443209 |
| APC anti-mouse CD335 (NKp46) | BioLegend | Cat# 137607, RRID:AB_10612749 |
| Alexa Fluor® 488 anti-mouse F4/80 | BioLegend | Cat# 123119, RRID:AB_893491 |
| CD3e | Thermo Fisher Scientific | Cat# MA5-17658, RRID:AB_2539048 |
| CD4 Monoclonal Antibody (RM4-5) | Thermo Fisher Scientific | Cat# 14-0042-82, RRID:Ab_467067 |
| CD8a Monoclonal Antibody (53-6.7) | Thermo Fisher Scientific | Cat# 14-0081-82, RRID:Ab_467087 |
| Mouse MMR/CD206 | R and D Systems | Cat# AF2535, RRID:AB_2063012 |
| Anti-CD31 | BD Biosciences | Cat# 557355, RRID:AB 396660 |
| Donkey anti-Goat IgG (H+L) Secondary Antibody, Alexa Fluor 555 | Thermo Fisher Scientific | Cat# A-21432, RRID:AB_2535853 |
| Goat anti-Rat IgG H&L (Cy5 ®) | Abcam | Cat# ab6565, RRID:AB_955063 |
| Anti-Lamine B1 | Abcam | Cat# ab16048, RRID:AB_443298 |
| TMEM173/STING | Proteintech | Cat# 19851-1-AP, RRID:AB_10665370 |
| ERGIC-53 (C-6) | Santa Cruz Biotechnology | Cat# sc-365158, RRID:AB 10709004 |
| Anti-NAK/TBK1 | Abcam | Cat# ab40676, RRID:AB_776632 |
| IFI-16 (1G7) | Santa Cruz Biotechnology | Cat# sc-8023, RRID:AB_627775 |
| Chemicals, Peptides, and Recombinant Proteins | ||
| Lipofectamine 2000 | Invitrogen | Cat# 2082816 |
| 2′3′-cGAMP | Invivo Gen | Cat# tlrl-nacga23-02 |
| dsDNA | Invivo Gen | Cat# tlrl-ecdna |
| Poly(I:C) | Invivo Gen | Cat# tlrl-pic |
| HT-DNA | Sigma-Aldrich | Cat# D6898 |
| Doxycycline hyclate | Sigma-Aldrich | Cat# D9891 |
| LPS | Enzo | Cat# ALX-581-200-L001 |
| Hoechst 33342 | ThermoFisher Scientific | Cat# H3570 |
| DAPI | ThermoFisher Scientific | Cat# 62248 |
| FITC Annexin V/PI | BioLegend | Cat# 640914 |
| Doxycycline hydrochloride | Fisher Scientific | Cat# BP2653-5 |
| Halt™ Protease Inhibitor Cocktail | ThermoFisher Scientific | Cat# 78429 |
| Fluoromount G | SuthernBiotech | Cat# 0100-01 |
| ProLong™ Gold Antifade | ThermoFisher Scientific | Cat# P10144 |
| BSA | GoldBiotechnology | Cat# A-420 |
| Critical Commercial Assays | ||
| BCA Protein Assay Kit | Pierce | Cat# 23235 |
| Mouse IFN Beta ELISA Kit | pbl | Cat# 42400-1 |
| Human IFN Beta ELISA Kit | pbl | Cat# 41410-1 |
| SsoAdvanced Universal SYBR® Green | Bio-Rad | Cat #1725274 |
| QIAprep spin Miniprep Kit | Qiagen | Cat# 27106 |
| Reasy Mini Kit | Qiagen | Cat# 74104 |
| CellTiter-Blue® Cell Viability Assay | Promega | Cat# G8081 |
| Clarity Max Western ECL Substrate | Bio-Rad | Cat# 1705061 |
| ApopTag® Fluorescein In Situ Apoptosis Detection Kit | Sigma Millipore | Cat# S7110 |
| NE-PER™ Nuclear and Cytoplasmic Extraction Reagents | ThermoFisher Scientific | Cat# 78835 |
| Experimental Models: Cell Lines | ||
| BT549 | ATCC | N/A |
| MDA-MB-231 | ATCC | N/A |
| MIA PaCa-2 | ATCC | N/A |
| 4T1 | ATCC | N/A |
| IMR-90 | Coriell Institute | N/A |
| HFF | Coriell Institute | N/A |
| A549 | ATCC | N/A |
| H1299 | ATCC | N/A |
| Experimental Models: Organisms/Strains | ||
| BALB/c | Envigo | cat # 4702F |
| C57/BL6 | Jackson Laboratory | cat # 000664 |
| NOD/SCID | Envigo | cat # 1700M |
| Oligonucleotides | ||
| See Table S2 | ||
| Software and Algorithms | ||
| GraphPad Prism 8.0 | GraphPad Software, Inc. | https://graphpad.com/scientific-software/prism/ |
| Excel 2016 | Microsoft | https://www.office.com/ |
| ImageJ 1.52a | Wayne Rasband, NIH | https://imagej.net/ |
| BD FACS DIVA 6.2 | BD Biosciences | https://www.bdbiosciences.com/en-us/instruments/research-instruments/research-cell-sorters/facsaria-iii |
| NIS-elements AR 5.02.01 | Nikon | https://www.microscope.healthcare.nikon.com/ |
| Leica TCS SP8 X confocal | Leica | https://www.leica-microsystems.com |
HIGHLIGHTS.
Mutant p53 suppresses innate immune signaling and promotes immune evasion.
Mutant p53 interacts with TBK1 to prevent STING-IRF3-TBK1 trimeric complex formation.
Mutant p53 promotes tumor progression via cell-autonomous and non-autonomous signaling.
Acknowledgements
This work was supported by NCI CA166974-01A1, the NY State Empire Investment Program, the Stony Brook Renaissance School of Medicine and Cancer Center, the TRO Carol M. Baldwin Award, the Stony Brook Cancer Center Bahl IDEA Award and the Lynn November Pilot Funds for Therapeutic Development in Aggressive Breast Cancer from the Stony Brook Cancer Center. We thank Dr. Richard Lin (Stony Brook University, NY, USA) for sharing KPC cells and Dr. Nancy C. Reich (Stony Brook University, NY, USA) for providing us with the pcDNA3GFP-IRF3 clone. We would like to acknowledge the technical support provided by the Research Flow cytometry core facility, Department of Pathology, Stony Brook Renaissance School of Medicine.
Footnotes
Publisher's Disclaimer: This is a PDF file of an unedited manuscript that has been accepted for publication. As a service to our customers we are providing this early version of the manuscript. The manuscript will undergo copyediting, typesetting, and review of the resulting proof before it is published in its final form. Please note that during the production process errors may be discovered which could affect the content, and all legal disclaimers that apply to the journal pertain.
Declaration of Interests: The authors declare no competing interests.
References
- Ablasser A, and Chen ZJ (2019). cGAS in action: Expanding roles in immunity and inflammation. Science 363. [DOI] [PubMed] [Google Scholar]
- Almine JF, O’Hare CA, Dunphy G, Haga IR, Naik RJ, Atrih A, Connolly DJ, Taylor J, Kelsall IR, Bowie AG, et al. (2017). IFI16 and cGAS cooperate in the activation of STING during DNA sensing in human keratinocytes. Nat Commun 8, 14392. [DOI] [PMC free article] [PubMed] [Google Scholar]
- Bakhoum SF, and Cantley LC (2018). The Multifaceted Role of Chromosomal Instability in Cancer and Its Microenvironment. Cell 174, 1347–1360. [DOI] [PMC free article] [PubMed] [Google Scholar]
- Bakhoum SF, Ngo B, Laughney AM, Cavallo JA, Murphy CJ, Ly P, Shah P, Sriram RK, Watkins TBK, Taunk NK, et al. (2018). Chromosomal instability drives metastasis through a cytosolic DNA response. Nature 553, 467–472. [DOI] [PMC free article] [PubMed] [Google Scholar]
- Barber GN (2015). STING: infection, inflammation and cancer. Nat Rev Immunol 15, 760–770. [DOI] [PMC free article] [PubMed] [Google Scholar]
- Bullock AN, Henckel J, and Fersht AR (2000). Quantitative analysis of residual folding and DNA binding in mutant p53 core domain: definition of mutant states for rescue in cancer therapy. Oncogene 19, 1245–1256. [DOI] [PubMed] [Google Scholar]
- Chattopadhyay S, Marques JT, Yamashita M, Peters KL, Smith K, Desai A, Williams BR, and Sen GC (2010). Viral apoptosis is induced by IRF-3-mediated activation of Bax. EMBO J 29, 1762–1773. [DOI] [PMC free article] [PubMed] [Google Scholar]
- Chen J, Harding SM, Natesan R, Tian L, Benci JL, Li W, Minn AJ, Asangani IA, and Greenberg RA (2020). Cell Cycle Checkpoints Cooperate to Suppress DNA- and RNA-Associated Molecular Pattern Recognition and Anti-Tumor Immune Responses. Cell Rep 32, 108080. [DOI] [PMC free article] [PubMed] [Google Scholar]
- Chiu AM, Mitra M, Boymoushakian L, and Coller HA (2018). Integrative analysis of the inter-tumoral heterogeneity of triple-negative breast cancer. Sci Rep 8, 11807. [DOI] [PMC free article] [PubMed] [Google Scholar]
- Cooks T, Pateras IS, Jenkins LM, Patel KM, Robles AI, Morris J, Forshew T, Appella E, Gorgoulis VG, and Harris CC (2018). Mutant p53 cancers reprogram macrophages to tumor supporting macrophages via exosomal miR-1246. Nat Commun 9, 771. [DOI] [PMC free article] [PubMed] [Google Scholar]
- Donehower LA, Soussi T, Korkut A, Liu Y, Schultz A, Cardenas M, Li X, Babur O, Hsu TK, Lichtarge O, et al. (2019). Integrated Analysis of TP53 Gene and Pathway Alterations in The Cancer Genome Atlas. Cell Rep 28, 1370–1384 e1375. [DOI] [PMC free article] [PubMed] [Google Scholar]
- Dou Z, Ghosh K, Vizioli MG, Zhu J, Sen P, Wangensteen KJ, Simithy J, Lan Y, Lin Y, Zhou Z, et al. (2017). Cytoplasmic chromatin triggers inflammation in senescence and cancer. Nature 550, 402–406. [DOI] [PMC free article] [PubMed] [Google Scholar]
- Eischen CM (2016). Genome Stability Requires p53. Cold Spring Harb Perspect Med 6. [DOI] [PMC free article] [PubMed] [Google Scholar]
- Freed-Pastor WA, and Prives C (2012). Mutant p53: one name, many proteins. Genes Dev 26, 1268–1286. [DOI] [PMC free article] [PubMed] [Google Scholar]
- Fukasawa K, Wiener F, Vande Woude GF, and Mai S (1997). Genomic instability and apoptosis are frequent in p53 deficient young mice. Oncogene 15, 1295–1302. [DOI] [PubMed] [Google Scholar]
- Gulen MF, Koch U, Haag SM, Schuler F, Apetoh L, Villunger A, Radtke F, and Ablasser A (2017). Signalling strength determines proapoptotic functions of STING. Nat Commun 8, 427. [DOI] [PMC free article] [PubMed] [Google Scholar]
- Hatch EM, Fischer AH, Deerinck TJ, and Hetzer MW (2013). Catastrophic nuclear envelope collapse in cancer cell micronuclei. Cell 154, 47–60. [DOI] [PMC free article] [PubMed] [Google Scholar]
- Hingorani SR, Wang L, Multani AS, Combs C, Deramaudt TB, Hruban RH, Rustgi AK, Chang S, and Tuveson DA (2005). Trp53R172H and KrasG12D cooperate to promote chromosomal instability and widely metastatic pancreatic ductal adenocarcinoma in mice. Cancer Cell 7, 469–483. [DOI] [PubMed] [Google Scholar]
- Ishikawa H, Ma Z, and Barber GN (2009). STING regulates intracellular DNA-mediated, type I interferon-dependent innate immunity. Nature 461, 788–792. [DOI] [PMC free article] [PubMed] [Google Scholar]
- Jiang Z, Liu Z, Li M, Chen C, and Wang X (2018). Immunogenomics Analysis Reveals that TP53 Mutations Inhibit Tumor Immunity in Gastric Cancer. Transl Oncol 11, 1171–1187. [DOI] [PMC free article] [PubMed] [Google Scholar]
- Jonsson KL, Laustsen A, Krapp C, Skipper KA, Thavachelvam K, Hotter D, Egedal JH, Kjolby M, Mohammadi P, Prabakaran T, et al. (2017). IFI16 is required for DNA sensing in human macrophages by promoting production and function of cGAMP. Nat Commun 8, 14391. [DOI] [PMC free article] [PubMed] [Google Scholar]
- Kakizaki A, Fujimura T, Furudate S, Kambayashi Y, Yamauchi T, Yagita H, and Aiba S (2015). Immunomodulatory effect of peritumorally administered interferon-beta on melanoma through tumor-associated macrophages. Oncoimmunology 4, e1047584. [DOI] [PMC free article] [PubMed] [Google Scholar]
- Kim MP, and Lozano G (2018). Mutant p53 partners in crime. Cell Death Differ 25, 161–168. [DOI] [PMC free article] [PubMed] [Google Scholar]
- Kitajima S, Ivanova E, Guo S, Yoshida R, Campisi M, Sundararaman SK, Tange S, Mitsuishi Y, Thai TC, Masuda S, et al. (2019). Suppression of STING Associated with LKB1 Loss in KRAS-Driven Lung Cancer. Cancer Discov 9, 34–45. [DOI] [PMC free article] [PubMed] [Google Scholar]
- Kwon J, and Bakhoum SF (2020). The Cytosolic DNA-Sensing cGAS-STING Pathway in Cancer. Cancer Discov 10, 26–39. [DOI] [PMC free article] [PubMed] [Google Scholar]
- Liu S, Cai X, Wu J, Cong Q, Chen X, Li T, Du F, Ren J, Wu YT, Grishin NV, and Chen ZJ (2015). Phosphorylation of innate immune adaptor proteins MAVS, STING, and TRIF induces IRF3 activation. Science 347, aaa2630. [DOI] [PubMed] [Google Scholar]
- Lo W, Parkhurst M, Robbins PF, Tran E, Lu YC, Jia L, Gartner JJ, Pasetto A, Deniger D, Malekzadeh P, et al. (2019). Immunologic Recognition of a Shared p53 Mutated Neoantigen in a Patient with Metastatic Colorectal Cancer. Cancer Immunol Res 7, 534–543. [DOI] [PMC free article] [PubMed] [Google Scholar]
- Lu YC, and Robbins PF (2016). Cancer immunotherapy targeting neoantigens. Semin Immunol 28, 22–27. [DOI] [PMC free article] [PubMed] [Google Scholar]
- Lyu H, Li M, Jiang Z, Liu Z, and Wang X (2019). Correlate the TP53 Mutation and the HRAS Mutation with Immune Signatures in Head and Neck Squamous Cell Cancer. Comput Struct Biotechnol J 17, 1020–1030. [DOI] [PMC free article] [PubMed] [Google Scholar]
- Malekzadeh P, Pasetto A, Robbins PF, Parkhurst MR, Paria BC, Jia L, Gartner JJ, Hill V, Yu Z, Restifo NP, et al. (2019). Neoantigen screening identifies broad TP53 mutant immunogenicity in patients with epithelial cancers. J Clin Invest 129, 1109–1114. [DOI] [PMC free article] [PubMed] [Google Scholar]
- Marcus A, Mao AJ, Lensink-Vasan M, Wang L, Vance RE, and Raulet DH (2018). Tumor-Derived cGAMP Triggers a STING-Mediated Interferon Response in Non-tumor Cells to Activate the NK Cell Response. Immunity 49, 754–763 e754. [DOI] [PMC free article] [PubMed] [Google Scholar]
- Munoz-Fontela C, Macip S, Martinez-Sobrido L, Brown L, Ashour J, Garcia-Sastre A, Lee SW, and Aaronson SA (2008). Transcriptional role of p53 in interferon-mediated antiviral immunity. J Exp Med 205, 1929–1938. [DOI] [PMC free article] [PubMed] [Google Scholar]
- Parrales A, Ranjan A, Iyer SV, Padhye S, Weir SJ, Roy A, and Iwakuma T (2016). DNAJA1 controls the fate of misfolded mutant p53 through the mevalonate pathway. Nat Cell Biol 18, 1233–1243. [DOI] [PMC free article] [PubMed] [Google Scholar]
- Sahin U, and Tureci O (2018). Personalized vaccines for cancer immunotherapy. Science 359, 1355–1360. [DOI] [PubMed] [Google Scholar]
- Santaguida S, and Amon A (2015). Short- and long-term effects of chromosome mis-segregation and aneuploidy. Nat Rev Mol Cell Biol 16, 473–485. [DOI] [PubMed] [Google Scholar]
- Schadt L, Sparano C, Schweiger NA, Silina K, Cecconi V, Lucchiari G, Yagita H, Guggisberg E, Saba S, Nascakova Z, et al. (2019). Cancer-Cell-Intrinsic cGAS Expression Mediates Tumor Immunogenicity. Cell Rep 29, 1236–1248 e1237. [DOI] [PubMed] [Google Scholar]
- Serreze DV, Gaedeke JW, and Leiter EH (1993a). Hematopoietic stem-cell defects underlying abnormal macrophage development and maturation in NOD/Lt mice: defective regulation of cytokine receptors and protein kinase C. Proc Natl Acad Sci U S A 90, 9625–9629. [DOI] [PMC free article] [PubMed] [Google Scholar]
- Serreze DV, Gaskins HR, and Leiter EH (1993b). Defects in the differentiation and function of antigen presenting cells in NOD/Lt mice. J Immunol 150, 2534–2543. [PubMed] [Google Scholar]
- Shalem O, Sanjana NE, Hartenian E, Shi X, Scott DA, Mikkelson T, Heckl D, Ebert BL, Root DE, Doench JG, and Zhang F (2014). Genome-scale CRISPR-Cas9 knockout screening in human cells. Science 343, 84–87. [DOI] [PMC free article] [PubMed] [Google Scholar]
- Siemers NO, Holloway JL, Chang H, Chasalow SD, Ross-MacDonald PB, Voliva CF, and Szustakowski JD (2017). Genome-wide association analysis identifies genetic correlates of immune infiltrates in solid tumors. PLoS One 12, e0179726. [DOI] [PMC free article] [PubMed] [Google Scholar]
- Song LL, Alimirah F, Panchanathan R, Xin H, and Choubey D (2008). Expression of an IFN-inducible cellular senescence gene, IFI16, is up-regulated by p53. Mol Cancer Res 6, 1732–1741. [DOI] [PubMed] [Google Scholar]
- Sun L, Wu J, Du F, Chen X, and Chen ZJ (2013). Cyclic GMP-AMP synthase is a cytosolic DNA sensor that activates the type I interferon pathway. Science 339, 786–791. [DOI] [PMC free article] [PubMed] [Google Scholar]
- Takaoka A, Hayakawa S, Yanai H, Stoiber D, Negishi H, Kikuchi H, Sasaki S, Imai K, Shibue T, Honda K, and Taniguchi T (2003). Integration of interferon-alpha/beta signalling to p53 responses in tumour suppression and antiviral defence. Nature 424, 516–523. [DOI] [PubMed] [Google Scholar]
- Talens F, and Van Vugt M (2019). Inflammatory signaling in genomically instable cancers. Cell Cycle 18, 1830–1848. [DOI] [PMC free article] [PubMed] [Google Scholar]
- Vanpouille-Box C, Demaria S, Formenti SC, and Galluzzi L (2018). Cytosolic DNA Sensing in Organismal Tumor Control. Cancer Cell 34, 361–378. [DOI] [PubMed] [Google Scholar]
- Vidyarthi A, Khan N, Agnihotri T, Negi S, Das DK, Aqdas M, Chatterjee D, Colegio OR, Tewari MK, and Agrewala JN (2018). TLR-3 Stimulation Skews M2 Macrophages to M1 Through IFN-alphabeta Signaling and Restricts Tumor Progression. Front Immunol 9, 1650. [DOI] [PMC free article] [PubMed] [Google Scholar]
- Weissmueller S, Manchado E, Saborowski M, Morris J. P. t., Wagenblast E, Davis CA, Moon SH, Pfister NT, Tschaharganeh DF, Kitzing T, et al. (2014). Mutant p53 drives pancreatic cancer metastasis through cell-autonomous PDGF receptor beta signaling. Cell 157, 382–394. [DOI] [PMC free article] [PubMed] [Google Scholar]
- Woo SR, Fuertes MB, Corrales L, Spranger S, Furdyna MJ, Leung MY, Duggan R, Wang Y, Barber GN, Fitzgerald KA, et al. (2014). STING-dependent cytosolic DNA sensing mediates innate immune recognition of immunogenic tumors. Immunity 41, 830–842. [DOI] [PMC free article] [PubMed] [Google Scholar]
Associated Data
This section collects any data citations, data availability statements, or supplementary materials included in this article.
Supplementary Materials
Table S1: TCGA data related to STAR Methods.
Data Availability Statement
All data supporting the findings of this study are available within the paper and are available from the corresponding author upon request. All the original data for western blots is available at Mendeley (http://dx.doi.org/10.17632/w4rxzck3kw.1)