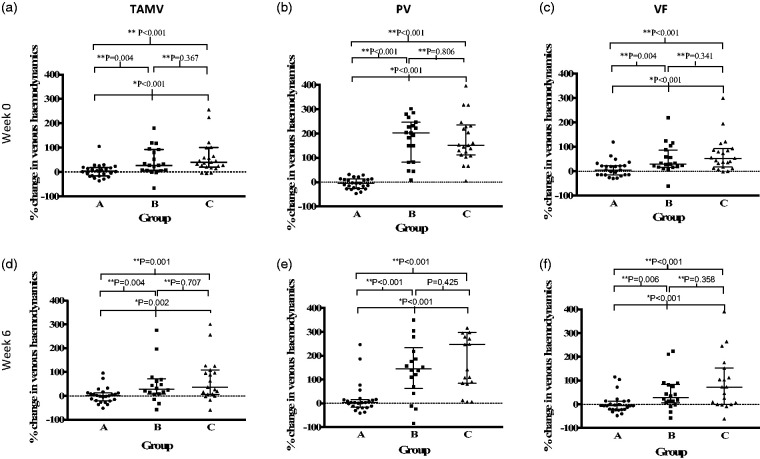
Figure 2.
Scatter plot demonstrating percentage change in time averaged mean velocity (TAMV), peak velocity (PV) and volume flow (VF) for each group at week 0 and 6. Error bars demonstrate interquartile range. Statistical test used: *Kruskal-Wallis test **Mann-Whitney test (statistical significance defined as P<0.05).

