Abstract
Optical photothermal infrared (O-PTIR) and Raman spectroscopy and imaging was used to explore the spatial distributions of molecular constituents of a laminate sample consisting of the bioplastics, polyhydroxyalkanoate (PHA) and polylactic acid (PLA), near the interfacial boundary. Highly spatially resolved simultaneous IR and Raman spectra were sequentially collected at 100 nm increments along a line traversing the interface. The set of spectra were subjected to 2D-COS analysis to extract the detailed nature of the spatial distribution of the laminate constituents. It was revealed that the laminate is not a simple binary system of two non-interacting polymers, but consists of different constituents with more complex spatial distributions. Some portion of PLA seems to penetrate into the PHA layer. The crystallinity of PHA near the interface is reduced compared to the rest of the PHA layer. The result suggests the existence of some partial molecular mixing even for these seemingly immiscible polymer pairs. The mixing probably occurs at the segmental level confined to only several hundred nanometers of space at the interface. Such partial mixing may explain the high compatibility between the two bioplastics.
Keywords: Optical photothermal infrared spectroscopy, O-PTIR, Raman, Spectral imaging, Bioplastics, Two-dimensional correlation spectroscopy, 2D-COS
1. Introduction
Plastics derived from petroleum are integral part of modern day life due to their amazing convenience, versatility, and the relatively inexpensive nature of the material. However, the increasing concern about the accumulation of plastic waste in the environment is also forcing society to explore an alternative form of materials to replace conventional plastics. Bioplastics, such as polylactic acid (PLA) [1] and polyhydroxyalkanoates (PHA) [2], are derived from natural resources like sugars and vegetable oils. As they are biodegradable under the right conditions, articles made with bioplastics, even if they accidently escape into the environment, may eventually go back to nature instead of lingering around for centuries in soil and waterways. While typical PLA and PHA are essentially immiscible at the molecular level, they form excellent composite materials due to their exceptional compatibility [3,4]. By combining hard and somewhat brittle PLA with more ductile and flexible PHA, one can create a number of useful materials with vastly different properties.
Optical Photothermal Infrared (O-PTIR) spectroscopy is an emerging technology, providing highly spatially resolved vibrational spectra on the order of several hundred nanometers, well below the diffraction limit of a conventional IR microscope [5,6]. In O-PTIR spectroscopy, an intense IR beam source, such as a quantum cascade laser (QCL), modulated at a high frequency is used to illuminate the sample. If the wavenumber of the IR beam matches with a molecular vibrational frequency in the sample, the light is absorbed and the energy is converted to heat. When the excited molecules return to their ground vibrational state, a temperature fluctuation occurs at the source modulation frequency. Such fluctuation, in turn, results in the modulated changes in volume (photoacoustic effect) and refractive index (photothermal effect). These fluctuations are probed using a highly focused visible laser beam with a spatial diffraction limit much smaller than that of the IR source. Furthermore, the probing laser will simultaneously generate a Raman scattering signal along with the O-PTIR signal from the same location, thus enabling the true co-registered IR absorption and Raman scattering measurements with submicron spatial resolution [7]. These Raman scattered photons are optically separated and sent to a dedicated Raman spectrometer.
O-PTIR as a new spectroscopy offers significant advantages over traditional FTIR microscopy, by overcoming many of its limitations. For example, O-PTIR can generate infrared data resolved to ~500 nm, well beyond the typical IR diffraction limited spatial resolution of traditional FTIR instruments at ~10–20 μm. Furthermore, and again unlike FTIR, the ultra-high spatial resolution O-PTIR measurement is wavelength independent, i.e., images collected at either the short or long wavelength end of the spectrum have the same submicron spatial resolution. Also of critical importance is the ability to generate high quality FTIR transmission-like spectra in easy to use reflection, non-contact (far-field) mode, thus eliminating the need for thin sectioning of the sample. Thus, reflection mode O-PTIR spectra are completely compatible with commercial FTIR database searching and are fully interpretable. Even if the sample has components that are fluo-rescing, which would overwhelm or saturate the Raman signal, the modulated collection nature of O-PTIR means it is completely unaffected by any fluorescence. When IR and Raman are combined as in this approach, full advantage can be taken of the well-known complementarity of these two techniques. Further still, one can consider this simultaneous IR + Raman approach as confirmatory–the IR data can confirm the Raman and vice-versa.
Because of the specificity of vibrational spectra to molecular structures, O-PTIR spectroscopic imaging is ideally suited for analyzing various composite materials consisting of multiple components which are spatially distributed in a complex manner among different domains separated by the interfacial boundaries. We used O-PTIR spectral imaging analysis to explore the interfacial region of a laminate film consisting of PLA and PHA layers to elucidate the origin of the high compatibility of this unique bioplastic pair.
To extract the detailed information hidden in the subtle features of spatially resolved spectra, we used two-dimensional correlation spectroscopy (2D-COS) for the data analysis [8]. In 2D-COS, systematic variations of spectral intensities induced by an external factor (in this case lateral separation) are distinguished using a form of cross correlation analysis. This versatile technique has been broadly used in a range of applications [9]. 2D-COS applied to hyperspectral image data is especially useful in determining the sequential order of spectral intensity changes reflecting the spatial distribution of individual constituents [10,11]. A series of spatially resolved vibrational spectra are sequentially obtained by sampling along the line traversing the interfacial boundary of the cross section of the laminate sample. Synchronous and asynchronous 2D correlation spectra constructed from the spatially resolved series of O-PTIR spectra are capable of revealing surprisingly rich information about the molecular distribution of bioplastics around the interfacial region.
2. Materials and method
2.1. PHA/PLA laminate
A commercial film of poly(lactic acid) (PLA) with 98% L-lactic units and 2% D-lactic units was obtained from NatureWorks (Minnetonka, MN). The PHA used was poly[(R)-3-hydroxybutyrate-co-(R)-3-hydroxyhexanoate] (PHBHx) with 6% 3-hydroxyhexanoate obtained from Danimer Scientific (Bainbridge, GA) in the form of an aqueous suspension. The nominal average molecular weights of Mw 748,000 and Mn 329,000 for PHA were estimated. The suspension was coated onto the PLA film and heated above the Tm of PHBHx (ca. 145 °C) to form a laminate sample. The laminate sample was then clamped with a vise and cut with a sharp razor blade to expose the cross section. O-PTIR and Raman hyperspectral data of the cross section was directly observed while held by the vise, scanning from the PHA side to PLA side at the spatial increment of 100 nm.
2.2. O-PTIR and Raman measurements
All O-PTIR and Raman spectra were collected using a mIRage™ Infrared and Raman (IR + Raman) instrument (Photothermal Spectroscopy Corp, Santa Barbara, CA). A pulsed tunable IR QCL source was focused (spot size ~ 20 μm) through a 40×, 0.78 NA Cassegrain reflective objective (8 mm working distance) onto the exposed cross section of the PLA/PHA laminate sample. The pulse width and repetition rate of the QCL were 300 ns and 126 kHz, respectively. A 532-nm cw probe laser was coaligned with the IR pump beam and focused through the same Cassegrain to its diffraction-limited spot size of ~500 nm. The modulated component of the reflected visible probe at the photodetector is directly proportional to the amount of monochromatic pulsed IR radiation actually absorbed by the same in the area probed. IR power was set to 9% and probe beam power was set to 5%. IR spectral range was 1895e800 cm–1 with a spectral resolution of ~4 cm–1 and a data point spacing of 2 cm-1. 20 scans were co-averaged for total measurement time of ~20 s. IR images were collected at 100 nm step size. Raman spectra were collected from 4000 to 200 cm–1 with 1 s integration and 20 scans co-averaged. A schematic description of the instrument used is shown in Fig. 1.
Fig. 1.
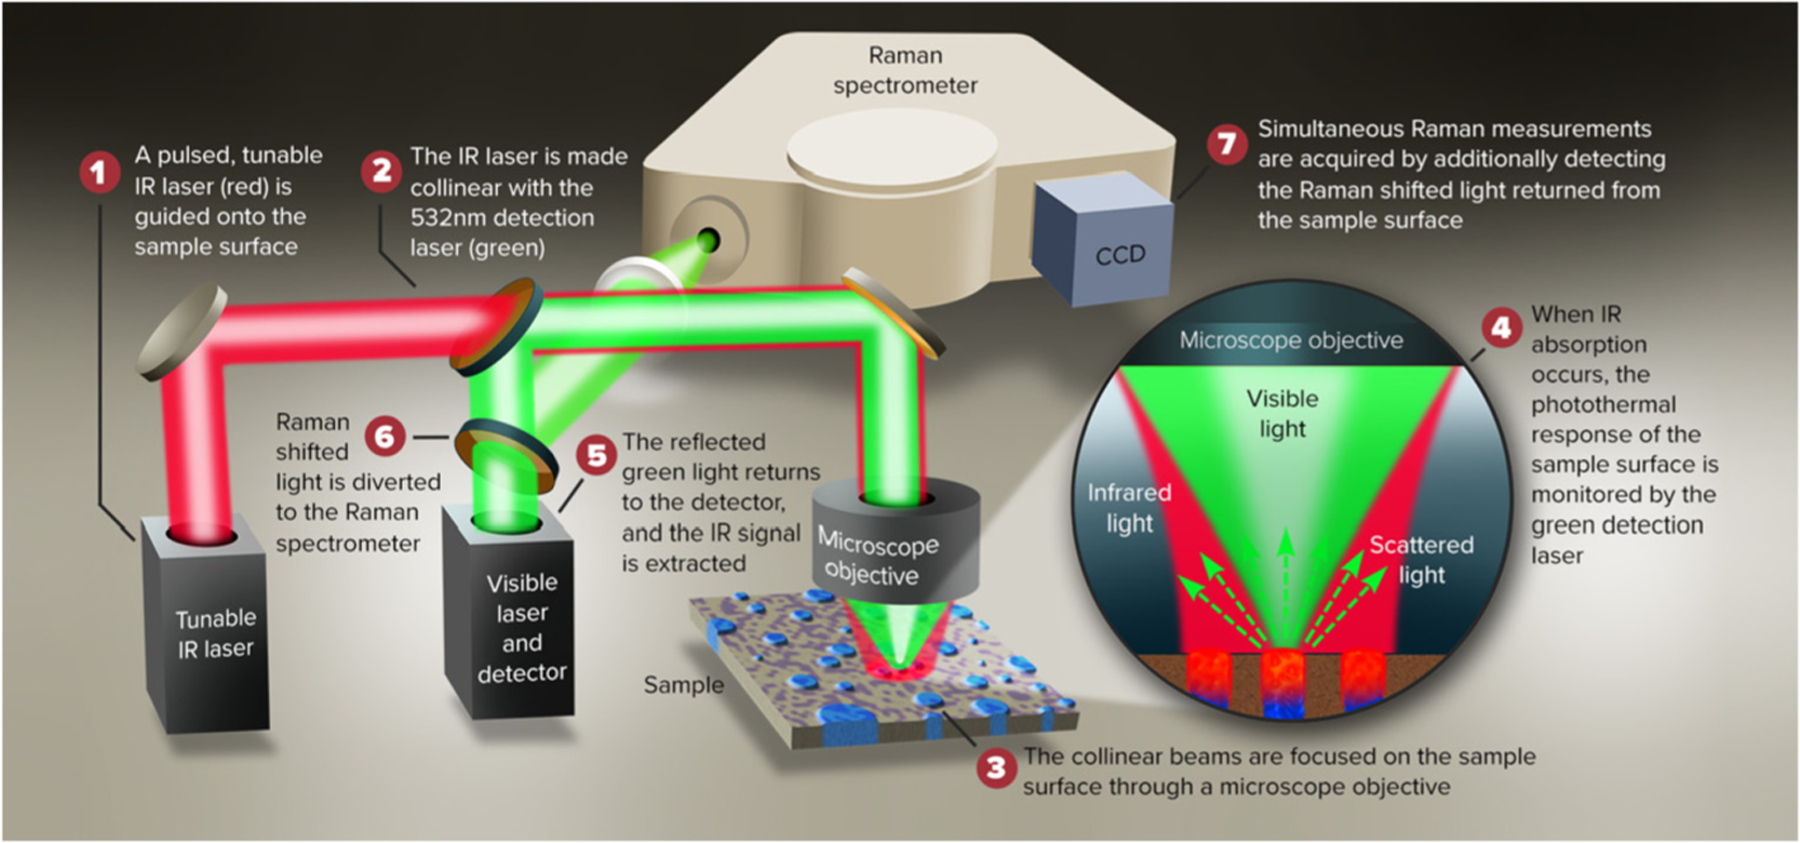
Schematic description of O-PTIR mIRage + R® instrument.
3. Results
3.1. Fixed wavenumber image
Fig. 2A shows the fixed wavenumber O-PTIR spectral image of the cross section of the PLA/PHA laminate sample. The region of the image highlighted in red corresponds to the strong IR absorption at 1725 cm–1 assignable primarily to the crystalline portion of PHA. The adjacent region in green is for the IR absorption at 1760 cm–1 which is the characteristic band of PLA. Each single-wavenumber image took ~2 min to collect. The image of the interface observed by O-PTIR probe looks relatively sharp with much reduced optical smear arising from the diffraction limit typically observed in ordinary IR microscopy. The region of the image highlighted as solid black corresponds to free space (air) above the metal vice holding the laminate sample as it protrudes above the vice.
Fig. 2.
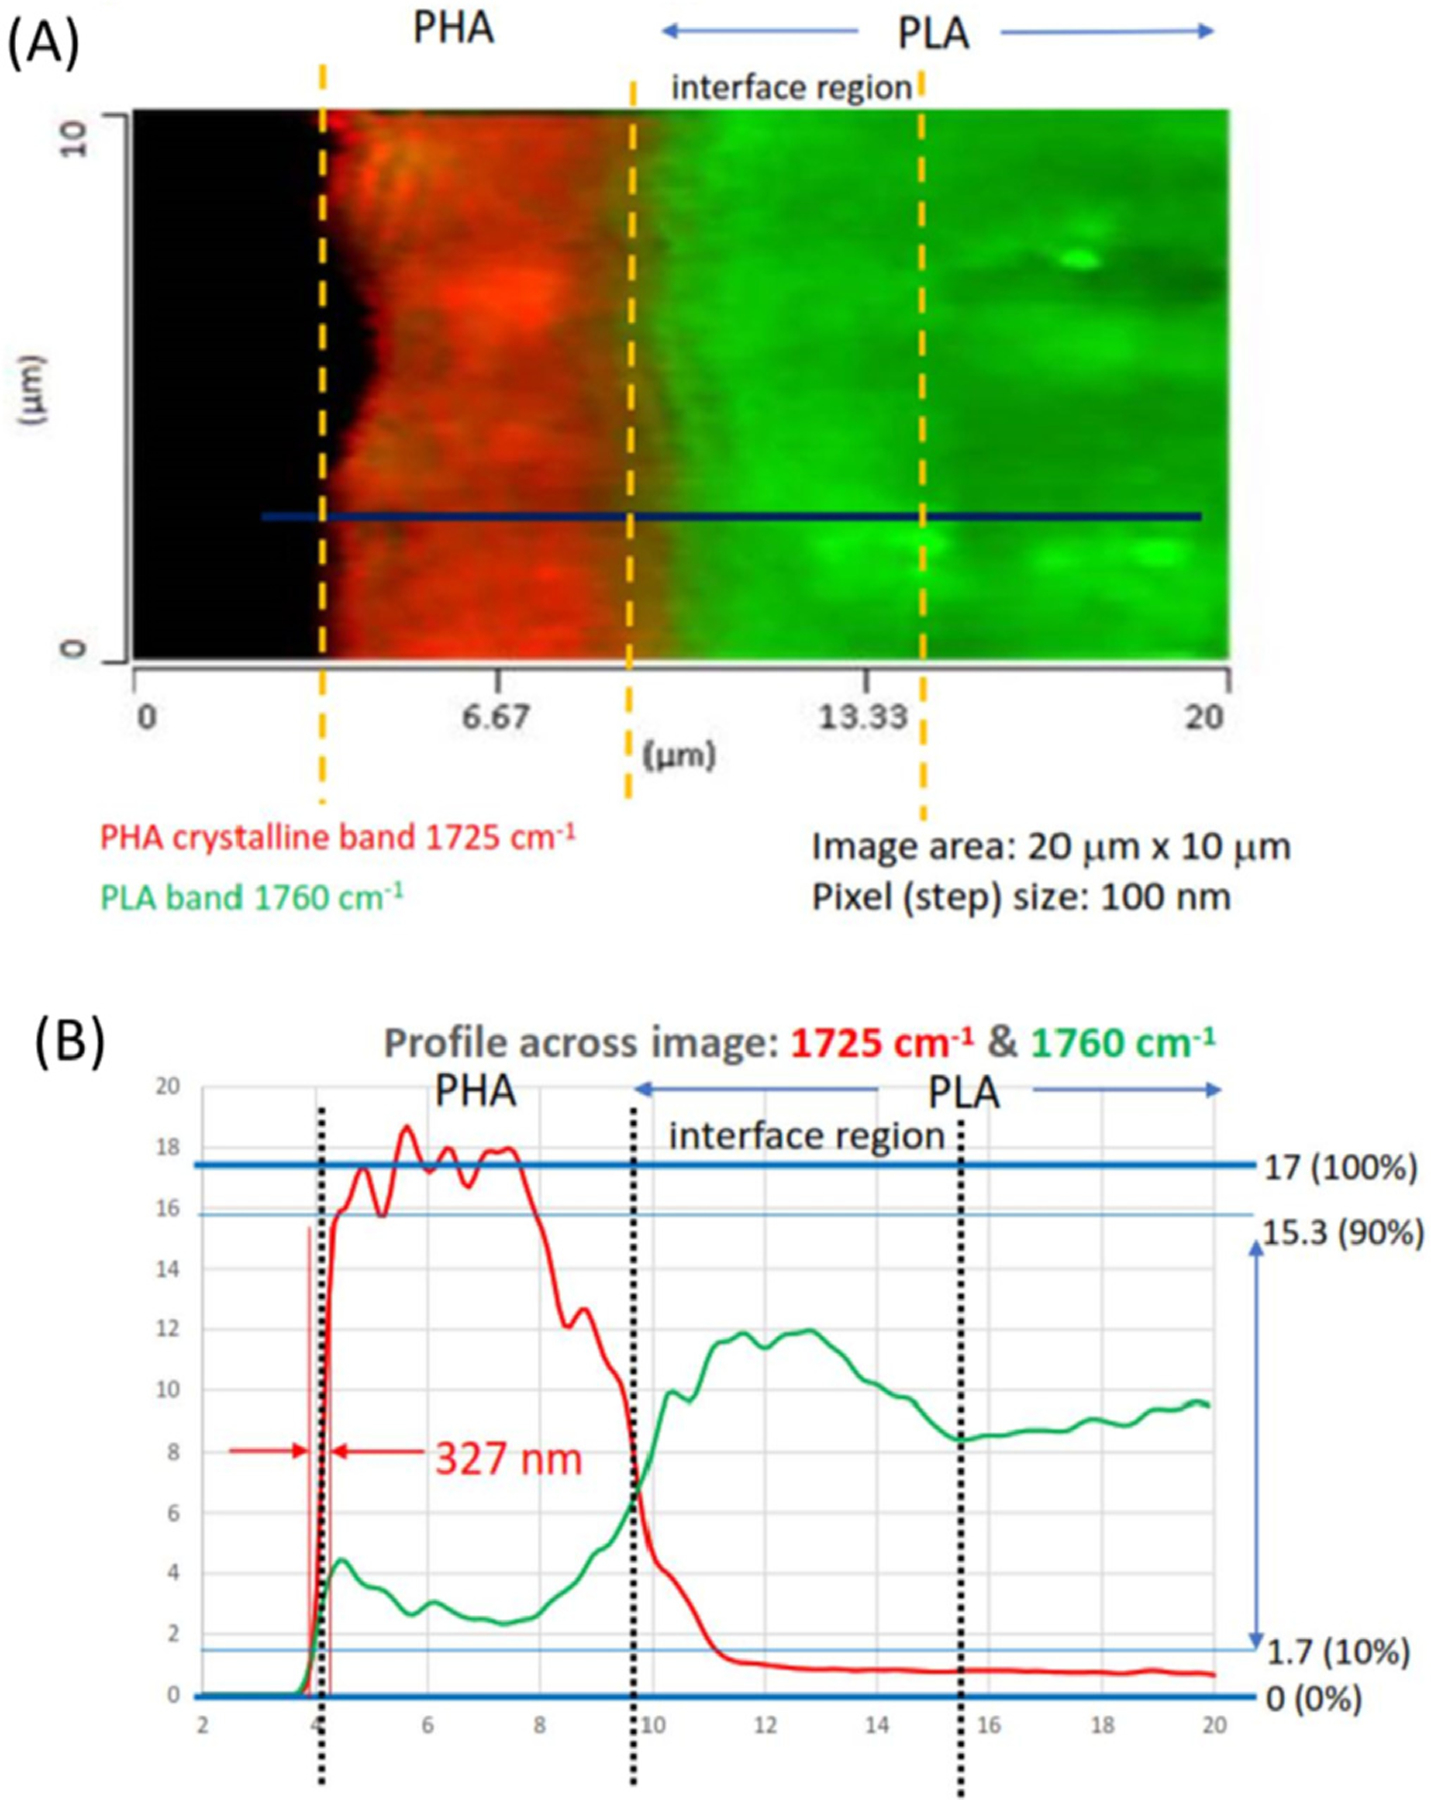
The fixed wavenumber image (A) and spectral intensity profiles (B) of the PHA/PLA laminate cross section represented by the O-PTIR carbonyl stretching bands at 1725 cm–1 for PHA and 1760 cm–1 for PLA.
Fig. 2B shows the corresponding spectral intensities of 1725 and 1760 cm–1 bands observed along the linear scanning line traversing the interface indicated by the blue line in Fig. 2A. The sharp drop of 1725 cm–1 signal within ~330 nm moving from air to PHA (left to right) provides a reasonable estimate of the spatial resolution of the measurement. Unlike the air/PHA interface, the intensity profiles of PHA and PLA at their interface vary more gradually, spanning many micrometers, indicating the possibility of some level of mixed molecular distributions. It should be emphasized that such gradual intensity changes observed here are real and not a reflection of the optical artifact (spatial smearing) arising from the diffraction limit of the measurement, as would be the case in a traditional FTIR microscope.
3.2. Submicron spectral linescan across the interface
The single frequency spectral image and intensity profiles discussed above provide a quick overview of the spatial distribution of the laminate components. The gradual changes in the spectral intensity profiles already suggest the possible existence of interfacial mixing between PHA and PLA. A much more detailed picture arises from the evolution pattern of individual IR spectra across the interface captured by the spatially resolved linescan spectral data. Fig. 3 shows a series of O-PTIR spectra collected along a straight line spanning a total distance of about 2 μm from the PHA to PLA domain through the interfacial boundary. Measurements were actually made every 100 nm, but only every other spectrum is shown for clarity.
Fig. 3.
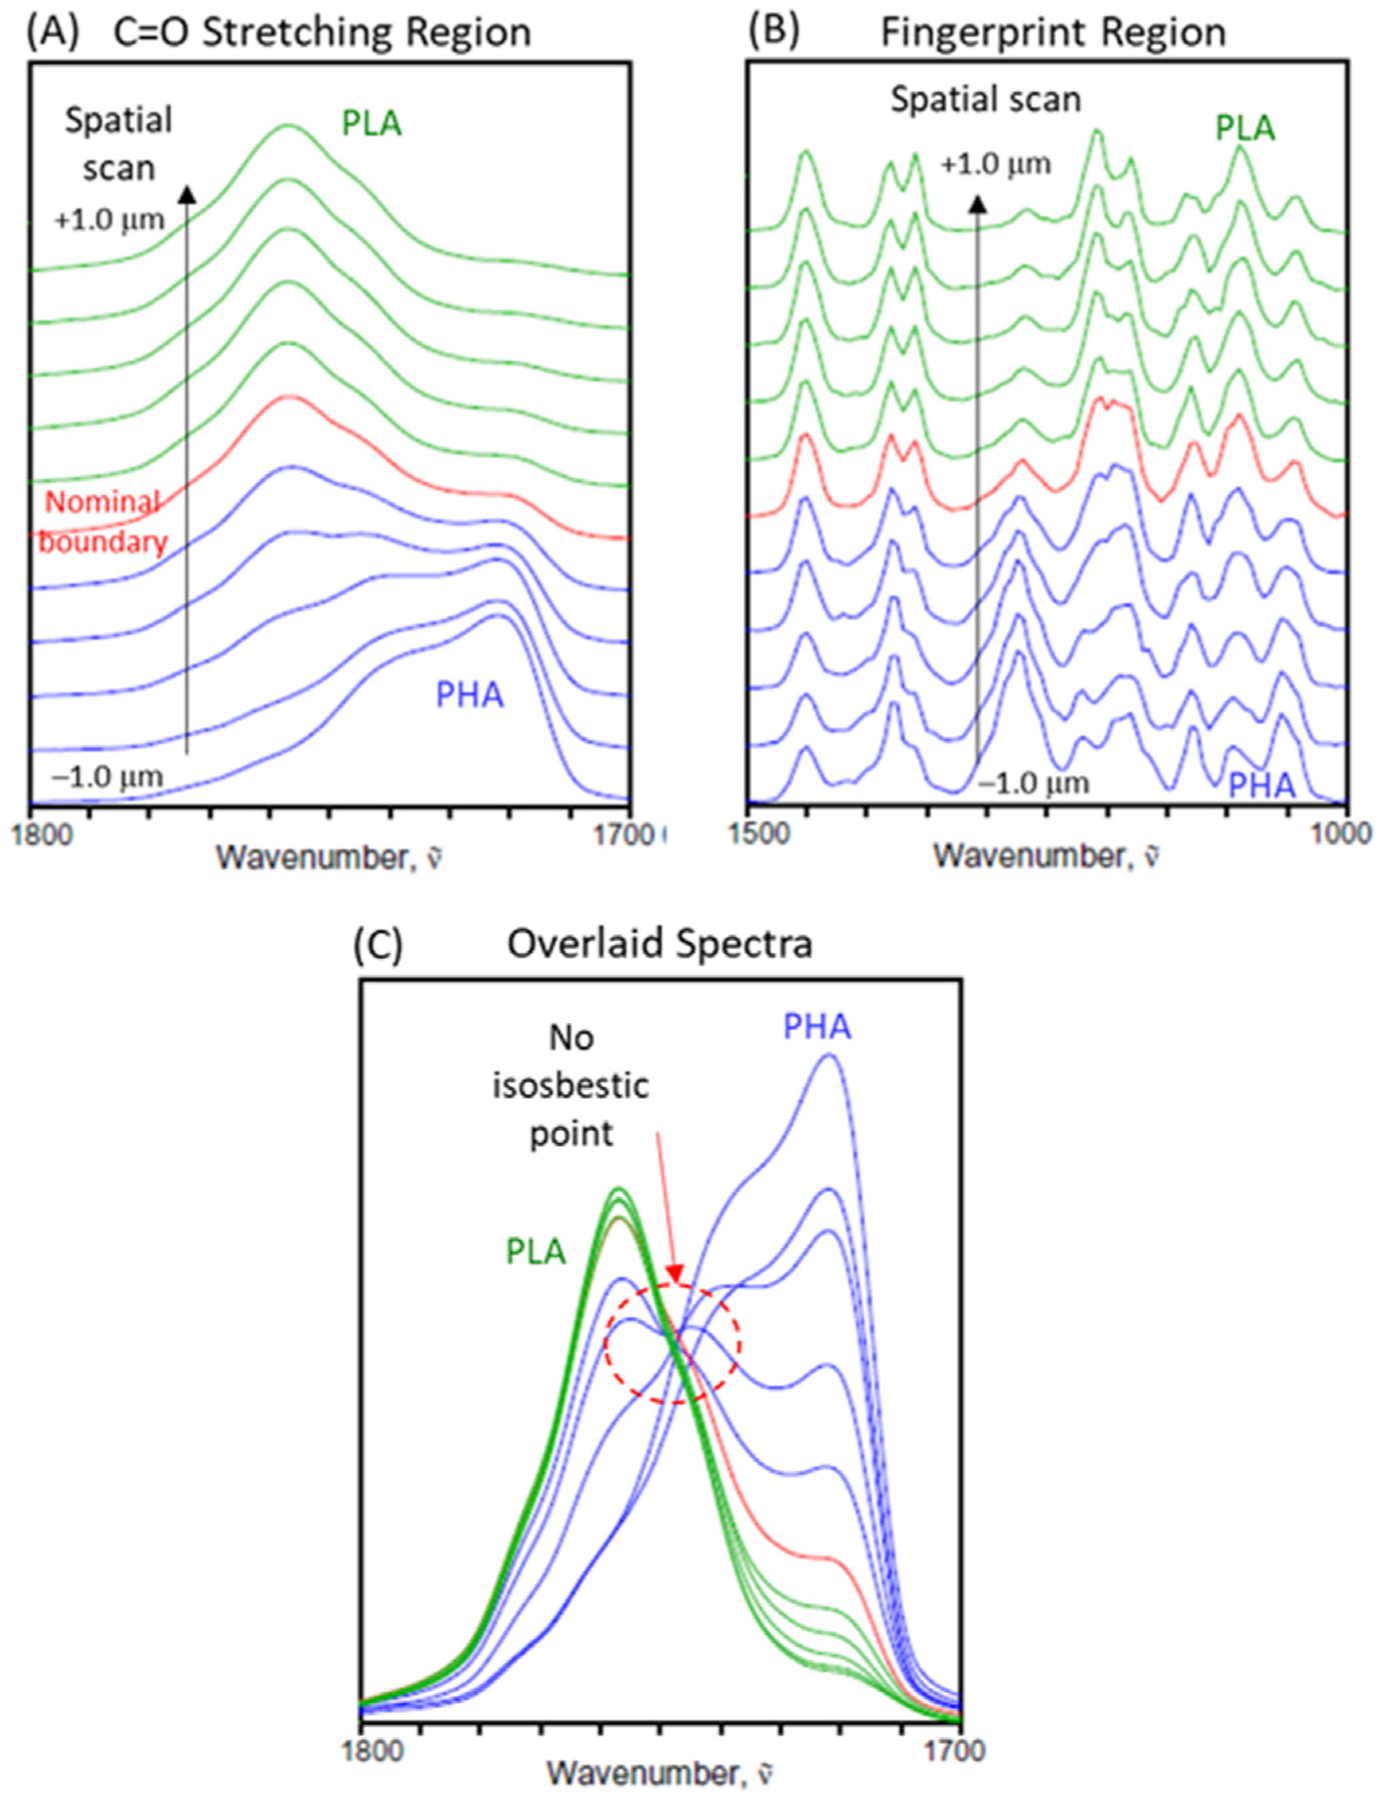
O-PTIR spectra of the laminate cross section collected every 200 nm around the PHA/PLA interface in the C=O stretching (A) and finger print region (B) regions, as well as the overlaid plot of spectra in the C=O stretching region (C).
Fig. 3A shows the carbonyl stretching region, where the difference between PLA and PHA is most clearly observed. The prominent feature for PLA appears as a strong peak around 1750e1760 cm–1. In contrast, PHA has more multifaceted features at a lower wavenumber region between 1710 and 1750 cm–1 suggesting the presence of several overlapped bands. Since the main feature of PHA around 1720 cm–1 is well separated from that of PLA, it is straightforward to differentiate PLA- and PHA-dominant regions using such carbonyl stretching bands, as already been demonstrated in Fig. 2. On the other hand, the fingerprint region (Fig. 3B), reflecting mostly the C–O–O and C–O–C vibrations of the chain backbone structures of aliphatic polyesters, has much more overlapped features, although individual peaks for PLA and PHA are still clearly discernible.
It is important to point out that spectral intensities in this laminate system definitely do not follow the expected pattern of a simple binary system. A system consisting of two totally immiscible or molecularly non-interacting components should change the relative compositions in unison. The overlaid spectra of the carbonyl stretching region (Fig. 3C) reveals the lack of isosbestic point, indicating the clear deviation from the behavior of an ideal binary system. The absence an isosbestic point reflects the complex compositional changes at this PHA/PLA interface involving the distributions of more than two distinct species. Such a conclusion could not have been reached by simply observing the fixed wavenumber image or limited number of intensity profiles, as in the previous analysis of Fig. 2. The full set of spatially resolved spectra captured in the linescan must be analyzed.
3.3. 2D-COS analysis in the carbonyl stretching region
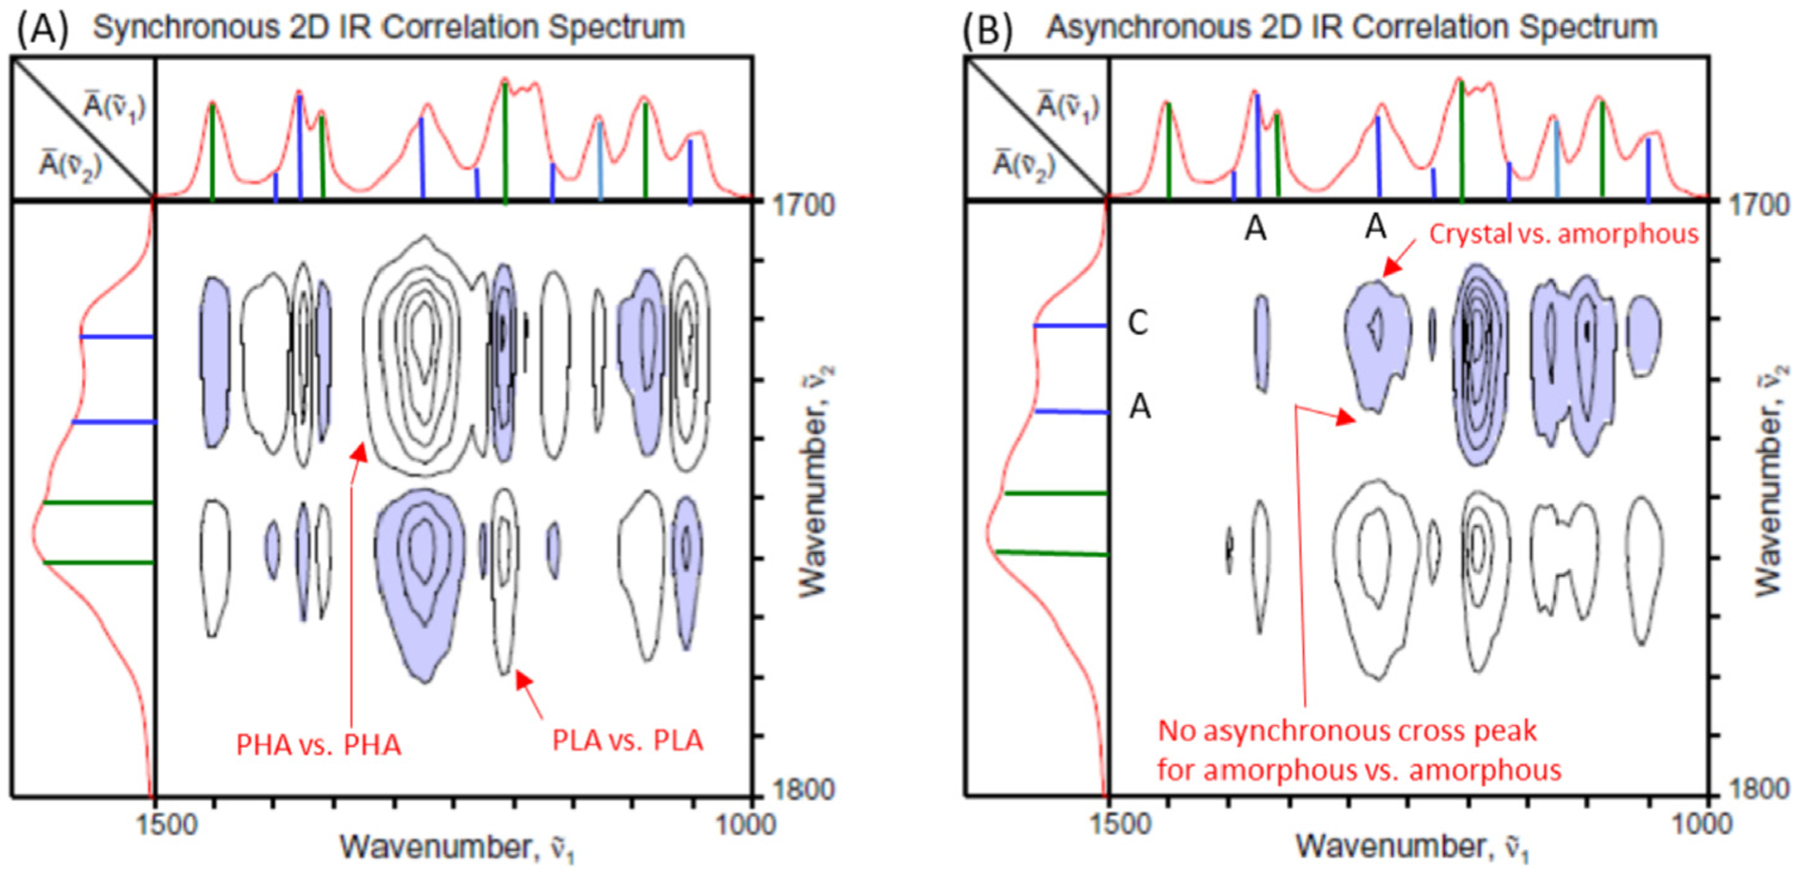
In order to obtain more detailed information on the spatial distribution patterns of the constituents of PHA/PLA laminate near the interface, two-dimensional correlation spectroscopy (2D-COS) analysis is applied. Fig. 4 shows the synchronous and asynchronous 2D correlation spectra in the carbonyl stretching region of the sample displayed in the contour map format. A series of 11 spatially resolved O-PTIR spectra systematically collected at 100-nm increments along the scanning line traversing the interface from the PHA layer to PLA layer (Fig. 3) were used with the position of the data collection as the perturbation variable. The average of the entire set of spectra was used as the reference spectrum and posted at the top and left side of the correlation spectra. Negative correlation cross peaks are indicated by shading.
Fig. 4.
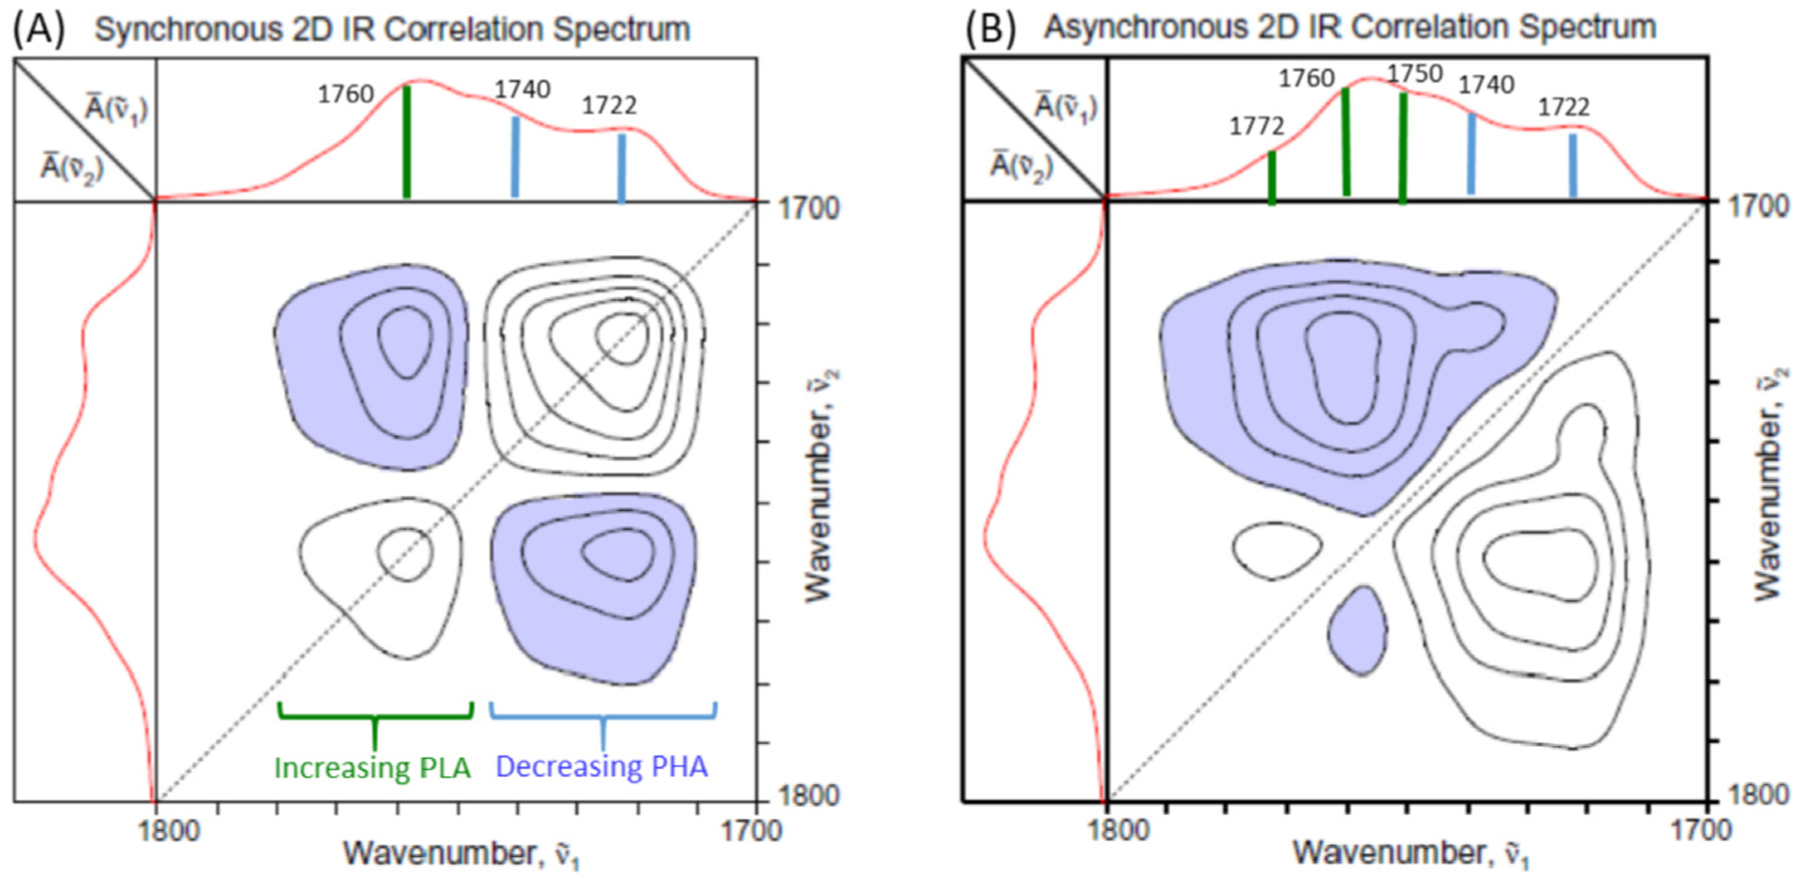
Synchronous (A) and asynchronous (B) 2D correlation spectra of PHA/PLA laminate obtained from the spatially resolved O-PTIR spectra collected along the line from the PHA to the PLA region.
The synchronous spectrum (Fig. 4A) shows the appearance of two distinct autopeaks located at the positions of the main diagonal line. Maximum positions of the autopeaks are found around 1760 and 1722 cm–1 with obvious additional shoulder features, e.g., 1740 cm–1. Negative cross peaks are observed between the two autopeaks, indicating the anti-correlation of the signals with one increasing while the other decreasing as the position of the O-PTIR spectral measurement is moved from the PHA to PLA side. This result obviously is consistent with the fact that the content of PHA is decreasing while PLA increasing across the interface boundary.
The asynchronous spectrum (Fig. 4B) reveals much more detailed and intriguing results. For an ideal binary system, the decrease in one component is always synchronously coupled with the increase in the other in a one-to-one manner, and there should be no asynchronous peak observed. This is not the case for the PHA/PLA laminate. The appearance of a number of asynchronous cross peaks in this spectral region of the laminate sample immediately indicates that there are multiple components within both the PHA and PLA regions. They are distributed differently along the spatial linescan of the interface, independently contributing to the observed overall spectra.
The negative cross peak located at (1740, 1722) and positive counterpart at (1722, 1740) clearly indicate that the intensities of the two IR bands associated with PHA are varying differently across the interface along the sampling line. The band at 1740 cm–1 is often assigned to the amorphous component of PHA, while that at 1722 cm–1 is due to the crystalline contribution [10]. Since the sign of the synchronous correlation intensity at the same coordinate is positive, we can deduce that decrease in the intensity of crystalline component occurs before that of amorphous component during the spatially resolved sampling scan [7]. In other words, we observe that the crystallinity of PHA decreases near the interface boundary compared to the bulk layer.
The most dominant asynchronous cross peaks are observed between the PLA band located at 1760 cm–1 and the amorphous and crystalline bands at 1740 and 1720 cm–1 of PHA. The signs of the synchronous and asynchronous peaks are the same, indicating that the increase in the intensity of the band at 1760 cm–1 is observed during the very early stage of sampling scan. This band is often associated with the amorphous component of PLA [11]. The early appearance of a portion of the PLA during the sampling across the interface suggests the penetration of some PLA component into the predominantly PHA layer. In other words, a certain extent of molecular mixing, probably confined to the segmental scale of several hundred nanometers only at the interface, may indeed exist for this seemingly immiscible pair of PHA and PLA. This possibility may be significant in explaining the unusually favorable blend compatibility of this pair of bioplastics.
There are also obvious distinct features within the asynchronous correlation intensities among PLA contributions. In the 2D-COS analysis applied to the isothermal crystallization of the melt of PLA made of pure L-form of lactide (PLLA), Zhang, et al. [12] reported the decrease in the intensity around 1760 cm–1 accompanied by the intensity increase at 1745, 1753, 1772, and 1780 cm–1 with the crystallization. Based on this report, we may assign the band features observed in our asynchronous spectrum around 1750 and 1772 cm–1 to be originating from the crystalline portion of PLA. However, the overlapping interference from the strong 1760 cm–1 band makes it difficult to clearly differentiate other bands.
3.4. Hetero-mode 2D correlation analysis
In contrast to the carbonyl stretching region, where the contributions of PHA and PLA to the IR spectra are well separated, the fingerprint region corresponding to the C–O–O and C–O–C vibrations of polyester backbone is more complex with interlaced and overlapped features. Hetero-mode 2D correlation analysis comparing the better separated carbonyl stretching region with the fingerprint region may be useful in shedding light on the analysis of such complex features. Fig. 5 shows the hetero-mode 2D correlation spectra of the laminate sample obtained by correlating the two separate regions of spatially resolved IR spectra (Fig. 3A and B). Once again, the spectral data are arranged in the order of spatial scanning from PHA layer to PLA layer across the interfacial boundary for the 2D-COS analysis.
Fig. 5.
Synchronous (A) and asynchronous (B) hetero-mode 2D correlation spectra between the carbonyl stretching and finger print regions of the PHA/PLA laminate.
The synchronous spectrum shown in Fig. 5A immediately demonstrates the utility of hetero-mode correlation analysis in this system. Positive synchronous cross peaks are observed for spectral features sharing the same origin, e.g., a pair of bands for PHA and PHA or for PLA and PLA. In contrast, bands from different origins result in the appearance of negative cross peaks. Knowing that the higher wavenumber bands of the carbonyl stretching region all belong to PLA and lower ones to PHA, one can readily classify seemingly convoluted and overlapped features in the fingerprint region of the laminate sample in a straightforward manner. For example, we can easily assign the bands at 1271 and 1380 cm–1 to be of PHA origin. Likewise, band at 1210 cm–1 positively correlated with the 1760 cm–1 band should be assignable to PLA.
The hetero-mode asynchronous correlation spectrum (Fig. 5B) provides even more detailed information about the specific nature of these bands. We detect asynchronicity between 1271 and 1722 cm–1 bands, both arising from the contributions of PHA according to the synchronous spectrum. As the 1722 cm–1 band is already assigned to the crystalline component, we can deduce that the prominent PHA band observed at 1271 cm–1 is unambiguously assignable to the amorphous component. The same procedure can be used for the band pair of 1722 and 1380 cm–1 to determine that the 1380 cm–1 band is also assignable to the amorphous component of PHA. Obviously, it is difficult to make such an assertion purely from the visual observation of the sets of 1D spectra shown in Fig. 3.
The sequential order analysis based on the cross peak signs applied to the hetero-mode spectra further confirms the intricate spatial distribution of the laminate constituents. We detect the penetration of amorphous PHA (1271 and 1740 cm–1) into the PLA layer, indicated by the appearance of band intensities during the very early stage of spatial scanning. The depreciation of the crystalline component of PHA (1722 cm–1) occurs prior to the disappearance of the amorphous PHA (1380, 1740, and 1721 cm–1) near the interfacial boundary, as the spatially resolved spectra are collected along the line from PHA layer toward PLA layer. The effect of interface creating spatial constraint on PHA chain, as well as the interference by the presence of penetrating PLA molecular segments, may be the cause of the reduction in the crystallinity near the boundary.
3.5. Hetero-spectral correlation
In addition to the hetero-mode correlation analysis described above, the exciting future potential of hetero-spectral correlation of spatially resolved vibrational spectra is briefly discussed. As indicated earlier, O-PTIR and Raman spectra can be simultaneously generated. Thus, we are able to obtain not only highly spatially resolved IR absorption spectra, but also fully co-registered Raman scattering spectra from the same position. The availability of both IR and Raman spectra obtained from the same sample provides an intriguing opportunity to carry out the IR-Raman hetero-spectral correlation analysis. The specificities of the two vibrational spectroscopic probes are not always identical, reflecting the difference in the selection rules and sensitivity. Thus, additional information not revealed from the IR results alone may become available.
Fig. 6 shows the hetero-spectral synchronous 2D correlation analysis of 11 simultaneously collected O-PTIR and Raman spectra collected along a line across the boundary between the PLA and PHA domains. These preliminary results shows the potential of this type of analysis to provide even more detailed molecular level insights into intermixing polymeric domains by taking advantage of the complementary vibrational spectroscopic information inherent to IR and Raman spectroscopy.
Fig. 6.
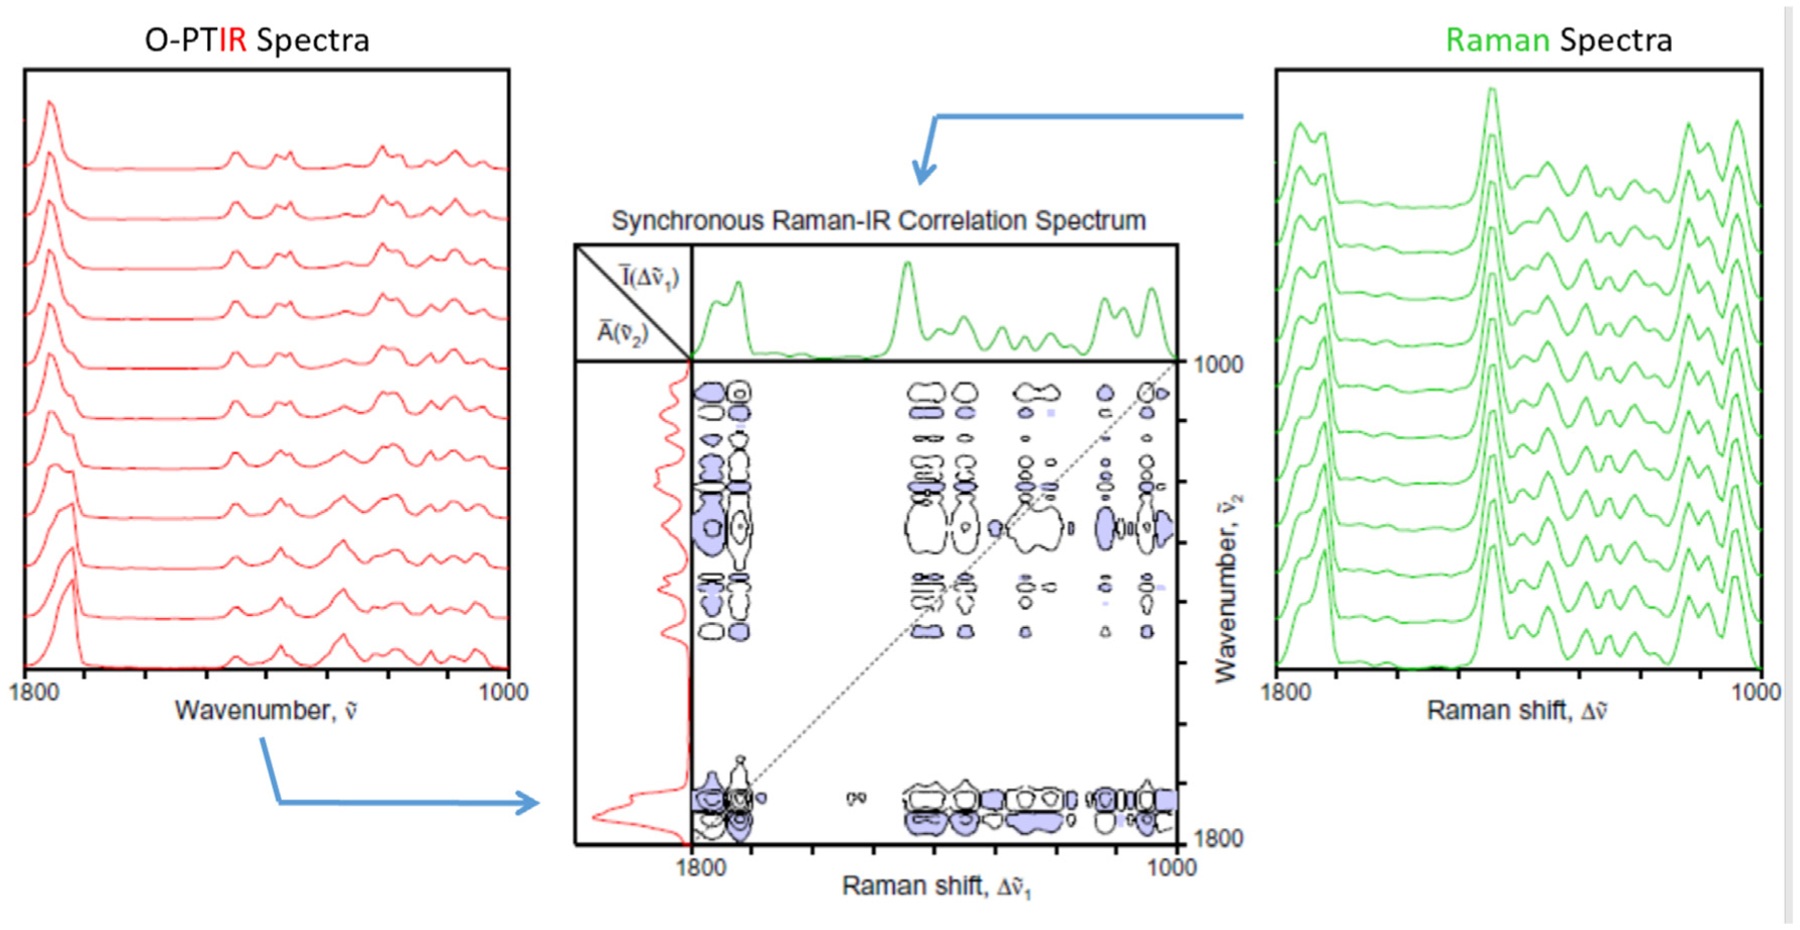
Synchronous hetero-spectral 2D correlation map (center) calculated using the simultaneously collected O-PTIR and Raman spectra (shown to the left and right, respectively) collected along a line across the boundary of the PHA/PLA laminate.
4. Conclusion
We used Optical Photothermal Infrared O-PTIR spectroscopy and imaging techniques to explore the spatial distributions of molecular constituents of a bioplastic laminate sample of PHA and PLA near the interfacial boundary. Highly spatially resolved IR absorption spectra were sequentially collected at submicron-level increments along a line traversing the interface. The set of spectra are then subjected to 2D-COS analysis to extract the detailed nature of the spatial distribution of the laminate constituents. It was revealed that the laminate is not a simple binary system of two non-interacting polymers, but consists of different constituents with more complex spatial distributions. Some portion of PLA seems to penetrate into the PHA layer. The crystallinity of PHA near the interface is reduced compared to the rest of the PHA layer. The results suggests the existence of some partial molecular mixing even for the seemingly immiscible polymer pairs. The mixing probably occurs at the segmental level confined to only several hundred nanometers of space at the interface. Such partial mixing may explain the high compatibility between the two bioplastics.
Footnotes
Declaration of competing interest
The authors declare that they have no known competing financial interests or personal relationships that could have appeared to influence the work reported in this paper.
References
- [1].Shetty SD, Shetty N, Investigation of mechanical properties and applications of polylactic acids—a review, Mater. Res. Express 6 (2019) 11200211–11200216. [Google Scholar]
- [2].Razza ZA, Abid S, Banat IM, Polyhydroxyalkanoates: characteristics, production, recent developments and applications, Int. Biodeterior. Biodegrad 126 (2018) 45–56. [Google Scholar]
- [3].Nofar M, Sacligil D, Carreau PJ, Kamal MR, Heuzey M-C, Poly(lactic acid) blends: processing, properties and applications, Int. J. Biol. Nacromol 125 (2019) 307–360. [DOI] [PubMed] [Google Scholar]
- [4].Zhao Q, Wang S, Kong M, Geng W, Li RKY, Song C, Kong D, Phase morphology, physical properties, and biodegradation behavior of novel PLA/PHBHHx blends, J. Biomed. Mater. Res. B Appl. Biomater 100B (2012) 23–31. [DOI] [PubMed] [Google Scholar]
- [5].Zhang D, Li C, Zhang C, Slipchenko MN, Eakins G, Cheng JX, Sci. Adv 2 (2016), e1600521. [DOI] [PMC free article] [PubMed] [Google Scholar]
- [6].Li C, Zhang D, Slipchenko MN, Cheng J-X, Anal. Chem 89 (2017) 4863–4867. [DOI] [PubMed] [Google Scholar]
- [7].Li X, Zhang D, Bai Y, Wang W, Liang J, Cheng JX, Anal. Chem 91 (2019) 10750–10756. [DOI] [PubMed] [Google Scholar]
- [8].Noda I, Ozaki Y, Two-Dimensional Correlation Spectroscopy. Applications in Vibrational and Optical Spectroscopy, John Wiley & Sons, Chichester, 2004. [Google Scholar]
- [9].Park Y, Jin S, Noda I, Jung Y, Recent progress in two-dimensional correlation spectroscopy (2D-COS), J. Mol. Struct 1168 (2018) 1–21. [Google Scholar]
- [10].Lasch P, Noda I, Two-dimensional correlation spectroscopy (2D-COS) for analysis of spatially resolved vibrational spectra, Appl. Spectrosc 74 (2019) 359–379. [DOI] [PubMed] [Google Scholar]
- [11].Marcott C, Lo M, Hu Q, Kjoller K, Boskey A, Noda I, Using 2D correlation analysis to enhance spectral information available from highly spatially resolved AFM-IR spectra, J. Mol. Struct 1069 (2014) 284–289. [DOI] [PMC free article] [PubMed] [Google Scholar]
- [12].Zhang J, Tsuji H, Noda I, Ozaki Y, Weak intermolecular interactions during the melt-crystallization of poly(L-lactide) investigated by two-dimensional infrared correlation spectroscopy, J. Phys. Chem. B 108 (2004) 11514–11520. [Google Scholar]


