

Abstract
Luteolin (5,7,3′,4′-tetrahydroxyflavone) belongs to the flavone subclass of flavonoids. Luteolin and its glycosides are present in many botanical families, including edible plants, fruits, and vegetables. While the beneficial properties of luteolin have been widely studied, fewer studies have investigated its toxicity. In the present study, using human lymphoblastoid TK6 cells and our newly developed TK6-derived cell lines that each stably express a single human cytochrome P450 (CYP1A1, 1A2, 1B1, 2A6, 2B6, 2C8, 2C18, 2C9, 2C19, 2D6, 2E1, 3A4, 3A5, and 3A7), we systematically evaluated luteolin-induced cytotoxicity and genotoxicity, and the role of specific CYPs in the bioactivation of luteolin. Treatments with luteolin for 4–24 h induced cytotoxicity, apoptosis, DNA damage, and chromosome damage in a concentration-dependent manner. Subsequently, we observed that luteolin-induced cytotoxicity and genotoxicity, measured by the high-throughput micronucleus assay, were significantly increased in TK6 cells transduced with CYP1A1 and 1A2. In addition, key apoptosis and DNA damage biomarkers, including cleaved PARP-1, cleaved caspase-3, and phosphorylated histone 2AX (γH2A.X), were all significantly increased in the CYP1A1- and 1A2-expressing cells compared with the empty vector controls. Analysis by LC-MS/MS revealed that TK6 cells biotransformed the majority of luteolin into diosmetin, a less toxic O-methylated flavone, after 24 h; the presence of CYP1A1 and 1A2 partially reversed this process. Altogether, these results indicate that metabolism by CYP1A1 and 1A2 enhanced the toxicity of luteolin in vitro. Our results further support the utility of our TK6 cell system for identification of the specific CYPs responsible for chemical bioactivation and toxicity potential.
Keywords: Flavonoids, TK6-derived cell lines, cytochrome P450, DNA damage, micronuclei, chromosome damage
Graphic abstract
1. Introduction
Flavonoids, discovered in 1936, consist of a large class of naturally-occurring, low molecular weight compounds that are ubiquitously present in the plant kingdom as common secondary plant metabolites (Middleton et al., 2000). Their basic chemical structure has two benzene rings linked via a heterocyclic pyrane ring, i.e., benzo-γ-pyrone or phenylchromone (Figure 1A). Based on heterocyclic C-ring variation, flavonoids can be divided into several subclasses, such as flavones (the basic flavonoid structure, Figure 1A), flavonols (adding a hydroxyl group at C-3), and isoflavones (attachment of the B-ring to C-3) (Hostetler et al., 2017). More than 5,000 structurally unique flavonoids have been identified and the list keeps growing (Luo et al., 2017). People from different regions and cultures consume flavonoid-containing foods daily but the amounts and subclasses of flavonoids are quite different. The daily U.S. diet contains up to 1 g of mixed flavonoids measured as glycosides (about 650 mg aglycones) while the estimated daily intake measured as aglycones is approximately 23–79 mg in some countries including Finland, Germany, Japan, the Netherlands, and the United Kingdom (Graf et al., 2005; Middleton et al., 2000). A recent study surveyed more than 38 thousand U.S. women for 11.5 years and showed that the median daily intake for five common flavonoids (apigenin, luteolin, kaempferol, myricetin, and quercetin) were approximately 9 to 47 mg (Wang et al., 2009).
Figure 1. The chemical structure of luteolin and its related flavonoids.
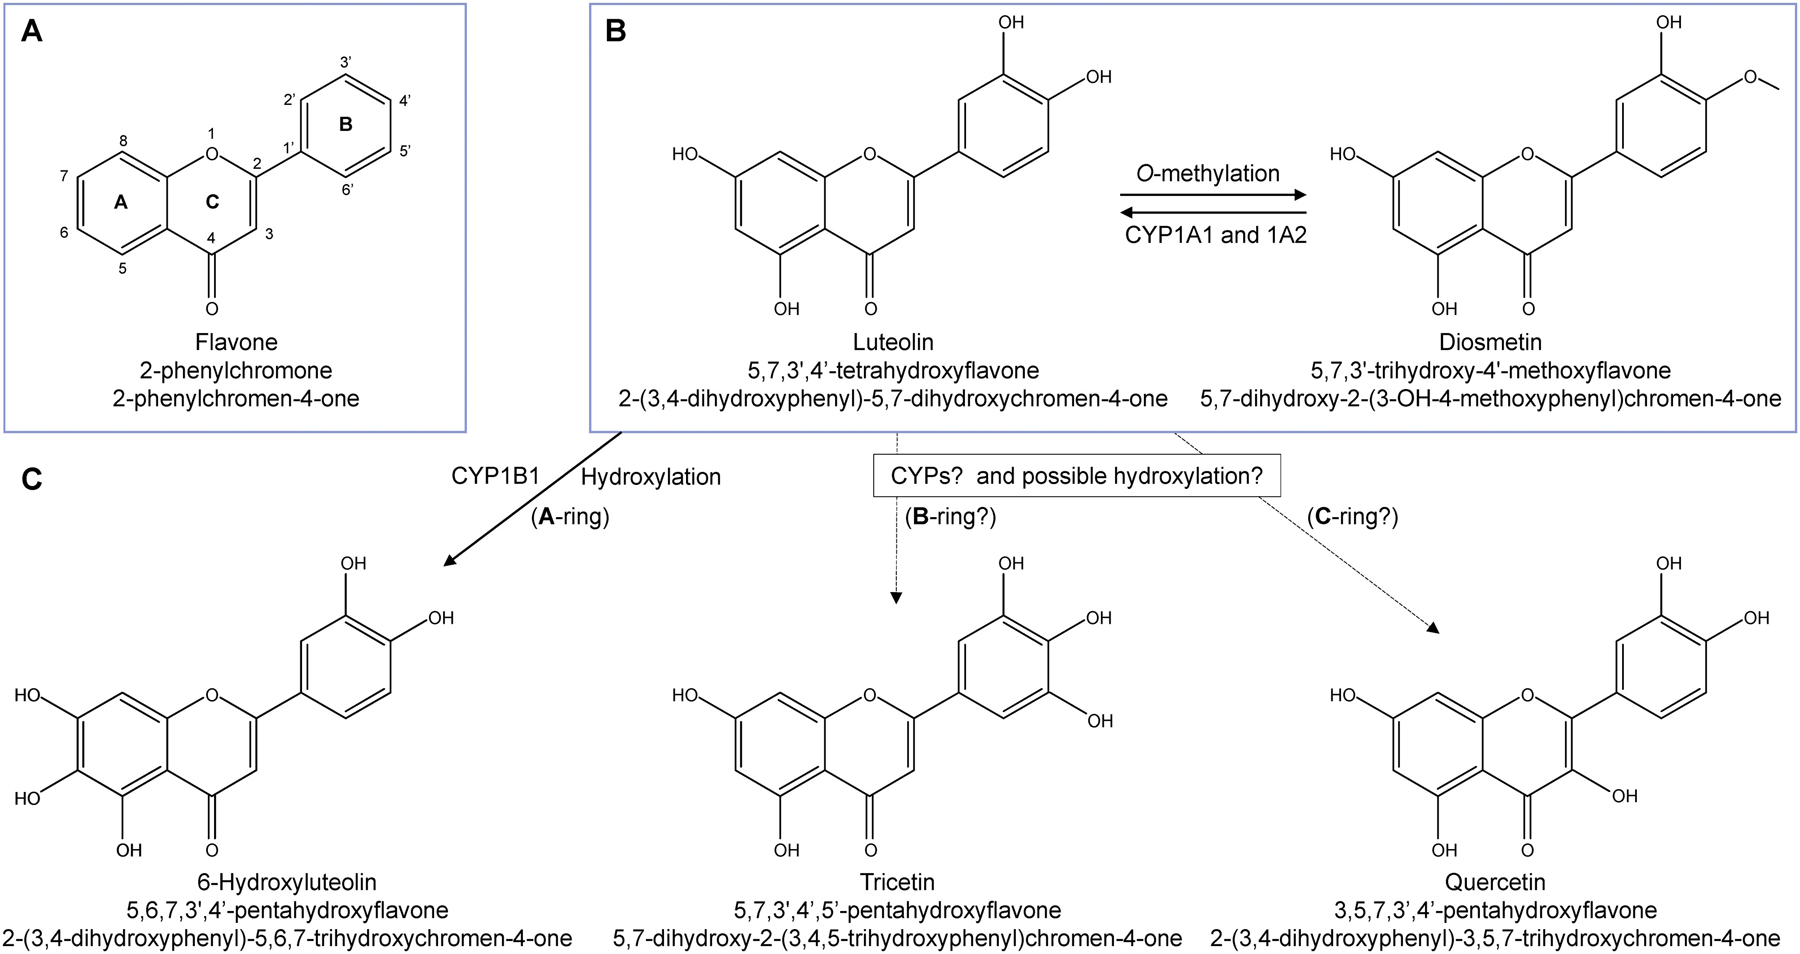
The basic structure of flavone (A) and chemical structures of luteolin and other flavonoids (B & C) are generated from PubChem (https://pubchem.ncbi.nlm.nih.gov). The hydroxyl substitution at the C3 position (A) distinguishes flavonols (e.g., quercetin) from flavones (e.g., luteolin). Chemical name, a common synonym, and IUPAC (the International Union of Pure and Applied Chemistry) name are listed for each flavonoid.
Because flavonoids are present in fruits, vegetables, nuts, tea, wine, and coffee (Hostetler et al., 2017), they have been considered health-promoting or disease-preventing substances. The popular idea of using flavonoids as dietary supplements has encouraged the conduct of various in vitro, in vivo, and clinical studies to identify their potential benefits. It has been reported that flavonoids have antioxidant, antiallergic, anti-inflammatory, antiviral, antiproliferative, anticancer, and other activities (George et al., 2017; Middleton et al., 2000). However, epidemiologic studies on dietary flavonoid intake and cancer risk remains controversial. For example, there was no significant association between the intake of five common flavonoids or selected flavonoid-rich foods and the risk of cancer among >38,000 women aged ≥ 45 years (Wang et al., 2009). In addition, many flavonoids have been reported to be mutagenic in diverse bacterial strains and in several mammalian cell lines (Middleton et al., 2000; Resende et al., 2012). Thus, consumption of flavonoids as dietary supplements at a high dose for extended periods of time may pose a potential for adverse effects. Any possible detrimental effects relating to the concentration, composition, and possible contaminants of individual dietary supplements, and any interactions with drugs or other dietary supplements should be investigated (Galati and O’Brien, 2004; Mei et al., 2017).
Luteolin (5,7,3′,4′-tetrahydroxyflavone, Figure 1B) is one of the main members in the flavone subclass of flavonoids. Along with its glycosides, luteolin exists in many botanical families, edible plants, fruits, and vegetables (Lopez-Lazaro, 2009; Manzoor et al., 2019). The median daily intake of luteolin is less than 2 mg in middle-aged and older U.S. women (Wang et al., 2009). After oral administration, luteolin can be absorbed quickly and the maximum concentrations of luteolin are achieved within 1–2 h, although detectable levels remain in plasma for several hours (Lopez-Lazaro, 2009). Free luteolin, glucuronide- and sulfate-conjugates of luteolin, and O-methyl luteolin (i.e., diosmetin, Figure 1B) were observed in human and animal plasma. Like many phytochemicals, luteolin’s potential pharmacological effects have been widely addressed. It has been reported that luteolin may plays a protective role against various cardiovascular diseases such as coronary artery disease and atherosclerosis (Luo et al., 2017) and neurodegenerative diseases such as Parkinson’s and Alzheimer’s diseases (Nabavi et al., 2015), and displays antioxidant, antiallergic, anti-autophagic, and anti-inflammatory activities (Seelinger et al., 2008; Vukelic et al., 2020). During the last decade, luteolin has gained increasing interest due to its possible protective effects against cancers (Imran et al., 2019). At IC50 (50% inhibitory concentration) from 7 to 90 μM for 24–72-h treatments, luteolin can inhibit the growth of various types of human cancer cell lines derived from various organ sites (Sak, 2014).
Recently, a case report indicated that the consumption of Verbena officinalis, a traditional medicine plant with a composition that is approximately 50% flavonoids, induced pregnancy loss, and a follow-up study in rats suggested that luteolin, apigenin, and other glycosylated flavonoids were responsible for this reported prenatal development toxicity (Fateh et al., 2019). In addition, it was reported that a 24-h treatment with 100 μg/mL luteolin induced cytotoxicity, as measured by the MTT and Neutral Red intake assays, and DNA and chromosome damage, as determined by the comet and micronucleus assays (Cariddi et al., 2015). Luteolin was also reported to be mutagenic in Salmonella typhimurium strain TA102 when tested in the presence of rat liver S9 activation enzymes (Resende et al., 2012). Because the safety profile of luteolin remains unclear, it is important to clarify the potential mechanisms of luteolin-induced cytotoxicity and genotoxicity.
Cytochrome P450s (CYPs) are often involved in the bioactivation of genotoxicants. Flavonoids have also been shown to be metabolized by CYPs, giving rise to metabolites that may exhibit biological activities distinct from the parent compound (Breinholt et al., 2002). Demethylation and hydroxylation are the most common reactions catalyzed by CYPs. The number of hydroxyl groups on the B-ring of flavonoids appears to significantly affect their biological activities (Androutsopoulos et al., 2009). For example, CYP1A1 metabolizes kaempferol to quercetin (both are flavonols) by adding a hydroxyl group at the 3′ position of the B-ring, which contributes to the increased mutagenicity of quercetin in the Ames test (Silva et al., 1997). Diosmetin, a flavone containing a methoxy group at the 4′ position of the B-ring (Figure 1B), is metabolized by human recombinant CYP1A1 and 1A2 in a cell-free system into luteolin via demethylation (Androutsopoulos and Spandidos, 2013). A recent study showed human recombinant CYP1B1 was responsible for the conversion of luteolin to 6-hydroxyluteolin by adding a hydroxy group onto the A-ring of the structure (C-6 position, Figure 1C) in a cell-free system; none of the CYP1A family of enzymes showed this effect (Wilsher et al., 2017). The potential role of other CYPs in metabolizing luteolin is not yet fully understood. Achieving a better understanding of the types of biotransformation that luteolin may undergo is important, as the resulting metabolites may have different levels of cytotoxicity and may exhibit different genotoxicity profiles in human cells.
Recently, we developed a battery of human TK6 lymphoblastoid cell lines that each express one of fourteen human CYPs (CYP1A1, 1A2, 1B1, 2A6, 2B6, 2C8, 2C18, 2C9, 2C19, 2D6, 2E1, 3A4, 3A5, and 3A7). We demonstrated that this novel system is effective in identifying the specific CYPs involved in the bioactivation of prototypical genotoxicants such as benzo[a]pyrene (B[a]P) and 7,12-dimethylbenz[a]anthracene (Li et al., 2020a), and pyrrolizidine alkaloids such as lasiocarpine, riddelliine, and senkirkine (Li et al., 2020b), without an added rat liver S9 fraction. In the present study, we used these cell lines to systematically evaluate the cytotoxicity and genotoxicity of luteolin and the effects of each of these CYPs in the bioactivation of luteolin. We chose the comet assay to detect DNA damage, the high-throughput micronucleus test to detect chromosome damage, and phosphorylation of histone 2AX (γH2A.X) as the endpoints for investigation.
2. Methods and materials
2.1. Test chemicals
Luteolin (CAS# 491–70-3, >98%), diosmetin (CAS# 520–34-3, >98%), and quercetin (CAS#117–39-5, >95%) were purchased from Millipore Sigma (MO, USA). 6-Hydroxyluteolin (CAS# 18003–33-3, >99%) and tricetin (CAS# 520–31-0, >99%) were purchased from Clearsynth (Ontario, Canada) and Biosynth Carbosynth (Campton, UK), respectively. All chemicals were stored according to vendor recommendations.
2.2. Cell culture and treatment
Human lymphoblastoid TK6 cells were purchased from ATCC (Manassas, VA) and the CYP-expressing TK6 cell lines were generated and stored previously (Li et al., 2020a). All TK6 cell lines were cultured at 37 °C in a humidified atmosphere with 5% CO2 in RPMI 1640 medium supplemented with L-glutamine (Gibco, Gaithersburg, MD), 100 U/mL penicillin (Gibco), 100 µg/mL streptomycin (Gibco), and 10% fetal bovine serum (FBS) (Atlanta Biologicals, Lawrenceville, GA). Cells were maintained at a density of 2 × 10⁵ to 1.5 × 10⁶ cells/mL with up to 10 passages. Luteolin and its structurally related flavonoids were freshly dissolved in dimethyl sulfoxide (DMSO) and sonicated briefly in the dark before treatment. Unless stated otherwise, cells at 2 × 10⁵ cells/mL were treated for 24 h. The final concentration of DMSO did not exceed 0.2%.
2.3. Measurement of cell viability, cellular ATP level, and caspase 3/7 activity
Cells were seeded in 24-well plates at a density of 2 × 10⁵ mL. After 24-h treatment, cell viability and cellular ATP levels were determined using the CellTiter-Blue® fluorescent cell viability assay kit (Promega, Madison, WI) and the CellTiter-Glo® luminescent cell viability assay kit (Promega), respectively. The relative cell viability and cellular ATP content were calculated by comparing the signal intensity of the treated cells to that of the controls. Caspase 3/7 enzymatic activity was measured by the Caspase-Glo® 3/7 Assay System (Promega) following the manufacturer’s instructions and results were expressed as fold-change relative to the vehicle control.
2.4. Alkaline comet assay
TK6 cells were seeded into 24-well plates and treated with luteolin (1.25–20 µM) for 4 h. After the treatment, cells were washed with ice-cold PBS. The comet assay was performed as previously described (Chen et al., 2013), using a CometAssay® Kit according to the manufacturer’s instructions (Trevigen Inc.; Gaithersburg, MD). Briefly, 500–1000 cells were mixed with 1% agarose gel and spread evenly onto each well of the comet slide. Slides then were immersed in lysis solution overnight at 4 °C in the dark. Subsequently, electrophoresis was run in the alkaline solution (pH > 13) at 4° C in the dark. The power supply was set to 21 volts and voltage was applied for 30 minutes. Cells were then stained with SYBR® Gold for fluorescence detection. The percentage of DNA in tails was calculated using the Comet Assay V digital analysis system (Perceptive Instruments; Edmunds, UK).
2.5. High-throughput micronucleus assay
Cells were seeded in 96-well plates and washed twice with sterile PBS after the 24-h treatment. Ethidium monoazide and SYTOX® Green were used to label apoptotic/necrotic cells and chromatin, respectively, following the protocol described in the In Vitro MicroFlowTM Kit (Litron Laboratories, Rochester, NY). After cell lysis, the high-throughput (HT) micronucleus analysis was performed using a FACSCanto II flow cytometer equipped with a High Throughput Sampler (BD Biosciences, San Jose, CA). The stopping gate was set to record 10,000 intact nuclei and threshold parameters were set as recommended by the manufacturer. The percentage of micronuclei (%MN) was calculated as the ratio of micronucleus events to the total number of nucleated events. The data were expressed as the fold-change of %MN in treated groups over vehicle controls. Cell cycle data were collected by retrieving histograms of SYTOX® Green nucleic acid stain fluorescence. The analysis was conducted using FlowJo® (v10.1) with Watson pragmatic model.
2.6. Western blot analysis
Cells were seeded in 25 cm² flasks at 2 × 10⁵ cells/mL and treated for 24 h. A total of 5–6 × 10⁶ cells was lysed in RIPA buffer with Halt™ Protease Inhibitor Cocktail (ThermoFisher Scientific, Waltham, MA) for protein extraction. The protein concentrations of cell lysates were determined using the BCA assay (ThermoFisher Scientific). Equivalent amounts of total protein were used, and standard Western blot procedures were performed. Primary antibodies against phosphorylated histone 2AX (γH2A.X), cleaved caspase-3, cleaved poly (ADP-ribose) polymerase 1 (PARP-1), myeloid leukemia cell differentiation protein (Mcl-1), B-cell lymphoma 2 (Bcl-2), B-cell lymphoma extra-large (Bcl-xL), and GAPDH (loading control) were diluted in blocking reagent at a concentration of 1:1,000. Secondary antibodies conjugated with horseradish peroxidase (HRP) (Santa Cruz Biotechnology, Dallas, TX) were incubated at a dilution of 1:10,000. The protein signals were determined by FluroChem E System and quantified by AlphaView SA (ProteinSimple, San Jose, CA).
2.7. Measurement of luteolin and its potential metabolites by LC-MS/MS
Cells were treated with 2.5 μM luteolin for 2 and 24 h at 37 °C in a humidified atmosphere with 5% CO2. After incubation, cell culture medium was collected, and the protein was removed by adding 2 volumes of acetonitrile (i.e., a ratio of 1:2). After concentration centrifugation at 14,000 × g for 5 min, 20 μL of supernatant was collected for LC-MS/MS analysis. A Shimadzu 20A ultra-fast liquid chromatograph system coupled with an AB SCIEX 3200 QTRAP mass spectrometer (Sciex, Redwood City, CA) was used for quantitative analysis of flavonoids. An Atlantis T3 C18 column (4.6 × 150 mm, 5 μm) with an Atlantis T3 VanGuard pre-column (3.9 × 5 mm, 5 μm) (Waters Corporation, Milford, MA) was used and the column oven temperature was 40 °C. The mobile phase was composed of solvent A (H2O) and B (acetonitrile), both containing 0.4% formic acid. The gradient was as follows: 0–1 min, 20% B; 1–10 min, 20–90% B; 10–10.4 min, 90% B; 10.4–10.5 min, 90–20% B; 10.5–15 min, 20% B for column re-equilibration. The flow rate of mobile phase was 0.5 mL/min. The mass spectrometer equipped with a Turbo V source and ESI probe was operated in negative ion mode. The ion source settings were optimized as follows: ion-spray voltage was set at 4500 V; turbo ion spay heater temperature was 600 °C; nitrogen was used for gas 1 (nebulizer gas), gas 2 (turbo heater gas), and curtain gas, respectively at 60, 70, and 20 psi. Multiple reaction monitoring (MRM) was employed for data acquisition. Collison gas was set at medium. MRM transitions were as follows: m/z 285–133 for luteolin, collision energy (CE) 45 eV; m/z 299–284 for diosmetin, CE 30 eV; m/z 301–151 for tricetin, CE 40 eV; m/z 301–151 for quercetin, CE 30 eV; m/z 301–133 for 6-hydroxyluteolin, CE 40 eV.
2.8. Statistical analysis
All data are presented as mean ± standard deviation (SD) from at least three independent experiments. Statistical analyses were performed using GraphPad Prism version 6.0 (GraphPad Software, La Jolla, CA). One-way ANOVA followed by Dunnett’s post hoc test or two-way ANOVA followed by Bonferroni post hoc test were used to compare the differences between groups, with statistical significance set at P < 0.05.
3. Results
3.1. Luteolin induces cytotoxicity and genotoxicity in wild-type TK6 cells
We first tested the cytotoxicity and genotoxicity of luteolin in wild-type human lymphoblastoid TK6 cells. As shown in Figures 2A & B, luteolin induced concentration-related decreases in cellular ATP content and cell viability after a 24-h treatment. The lowest observed adverse effect level (LOAEL) for both endpoints was 2.5 µM. Compared to the vehicle controls, cellular ATP level and cell viability were reduced to 63% and 58% of the control level, respectively, at the highest concentration (10 µM) tested.
Figure 2. Luteolin-induced cytotoxicity and genotoxicity in human TK6 cells.
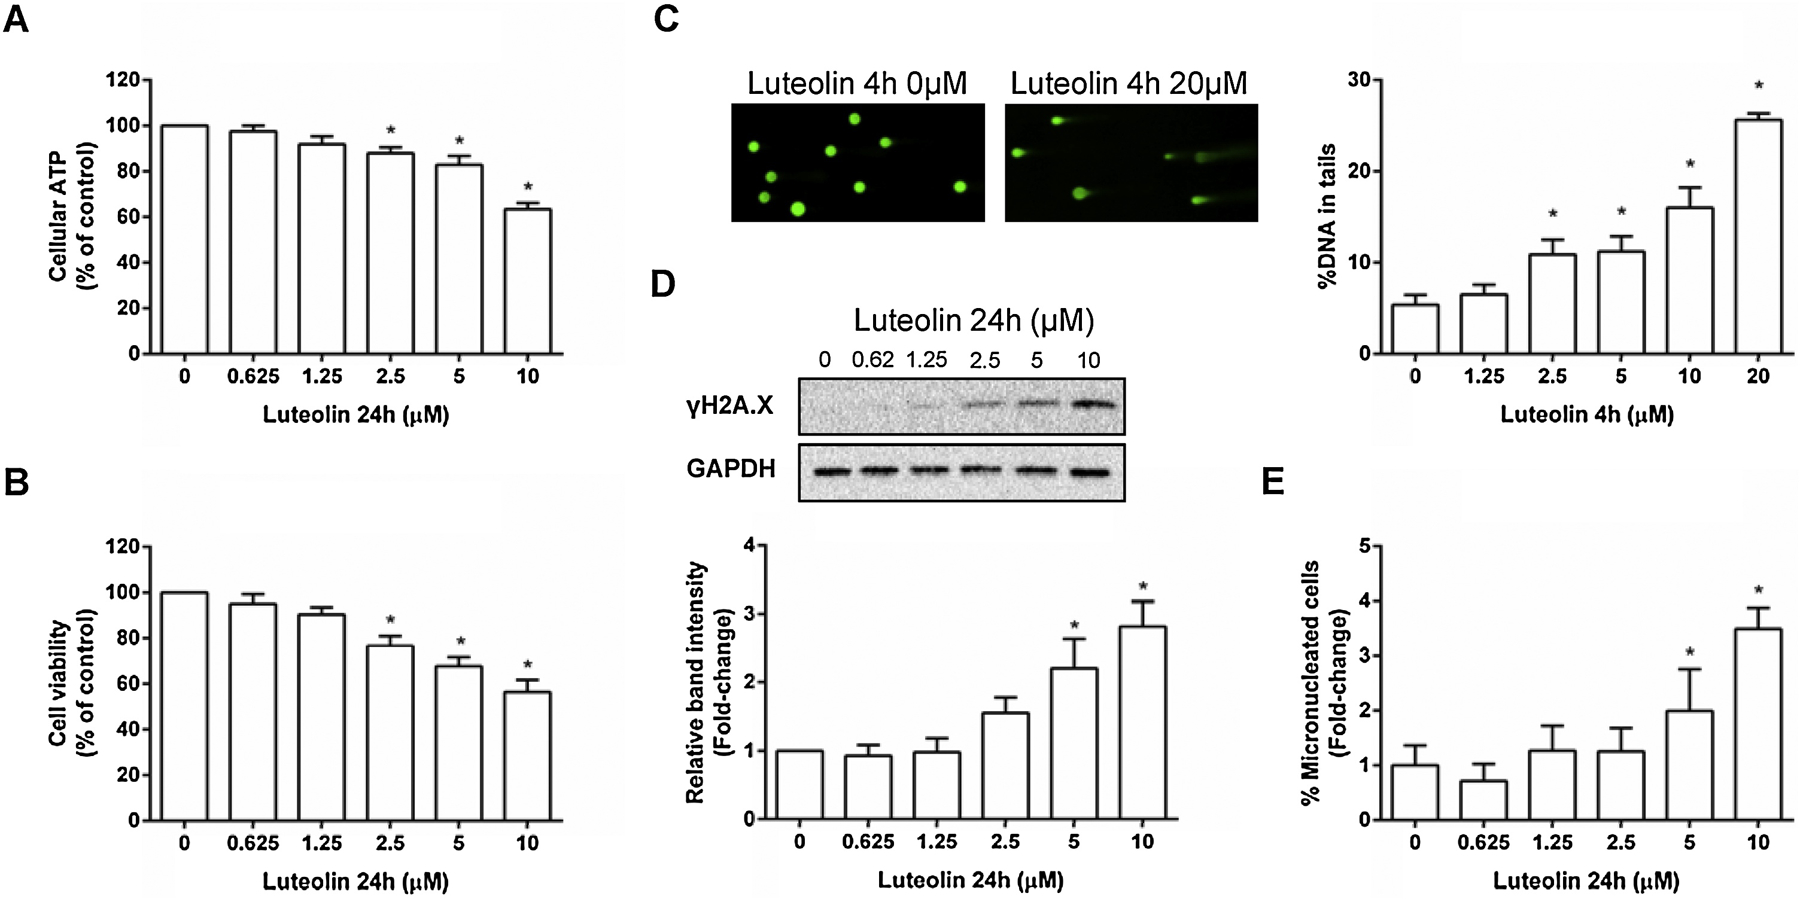
Cells were treated at the indicated concentrations for 24 h. The cellular ATP level (A), cell viability (B), and micronuclei (E) were determined by the CellTiter-Glo® assay, CellTiter-Blue® assay, and high-throughput micronucleus assay, respectively. Representative images are shown from one experiment for the alkaline comet assay after 4-h treatment (C) and Western blot of γH2A.X after 24-h treatment (D). The data represent the mean ± SD from three independent experiments (A, B, C, & E). Protein expression of γH2A.X levels was quantified and normalized to the amount of GAPDH, then expressed as the mean ± SD from three independent experiments (D). * indicates P < 0.05 comparing to the vehicle controls.
Luteolin’s genotoxic potential was evidenced by the observed DNA damages, measured by the alkaline comet assay and the expression of γH2A.X. A 4-h treatment with luteolin induced a significant and concentration-dependent increase in the percentage of DNA in comet tails (Figure 2C). After 24-h treatments, the γH2A.X protein level was significantly elevated at concentrations above 5 µM, and significant increases in the percentage of micronuclei (%MN) were observed at concentrations of 5 and 10 µM (2- and 3.5-fold, respectively; Figures 2D & E). Taken together, these results clearly indicate that luteolin exhibited cytotoxic and genotoxic effects in wild-type TK6 cells.
3.2. Luteolin induces apoptosis in wild-type TK6 cells with reduction of Mcl-1
Previous studies have shown that luteolin exposure leads to the apoptotic cell death in vitro (Imran et al., 2019; Tuorkey, 2016); it is of interest to investigate whether luteolin produces similar effects in TK6 cells and the underlying mechanisms involve in inducing these effects. Several measures of apoptosis were employed. First, luteolin increased caspase 3/7 enzymatic activity in a concentration-related manner after a 24-h exposure (Figure 3A), an observation consistent with induction of apoptotic cell death. Second, production of the cleaved form of caspase-3 was confirmed by Western blot analysis. Because PARP-1 is one of the well-documented substrates of caspases, we measured PARP-1 levels in luteolin-treated cells compared with controls. We observed that the amount of cleaved PARP-1 was also increased in a concentration-dependent manner in luteolin-treated TK6 cells (Figures 3B & C). Third, we investigated the expression of several key protein regulators in the apoptosis signaling pathway. While no changes in the amounts of Bcl-2 and Bcl-xl were observed, Mcl-1, another important protein in the anti-apoptotic Bcl-2 family, was significantly downregulated by 24-h luteolin exposure (Figure 3B).
Figure 3. Luteolin-induced apoptosis in human TK6 cells.
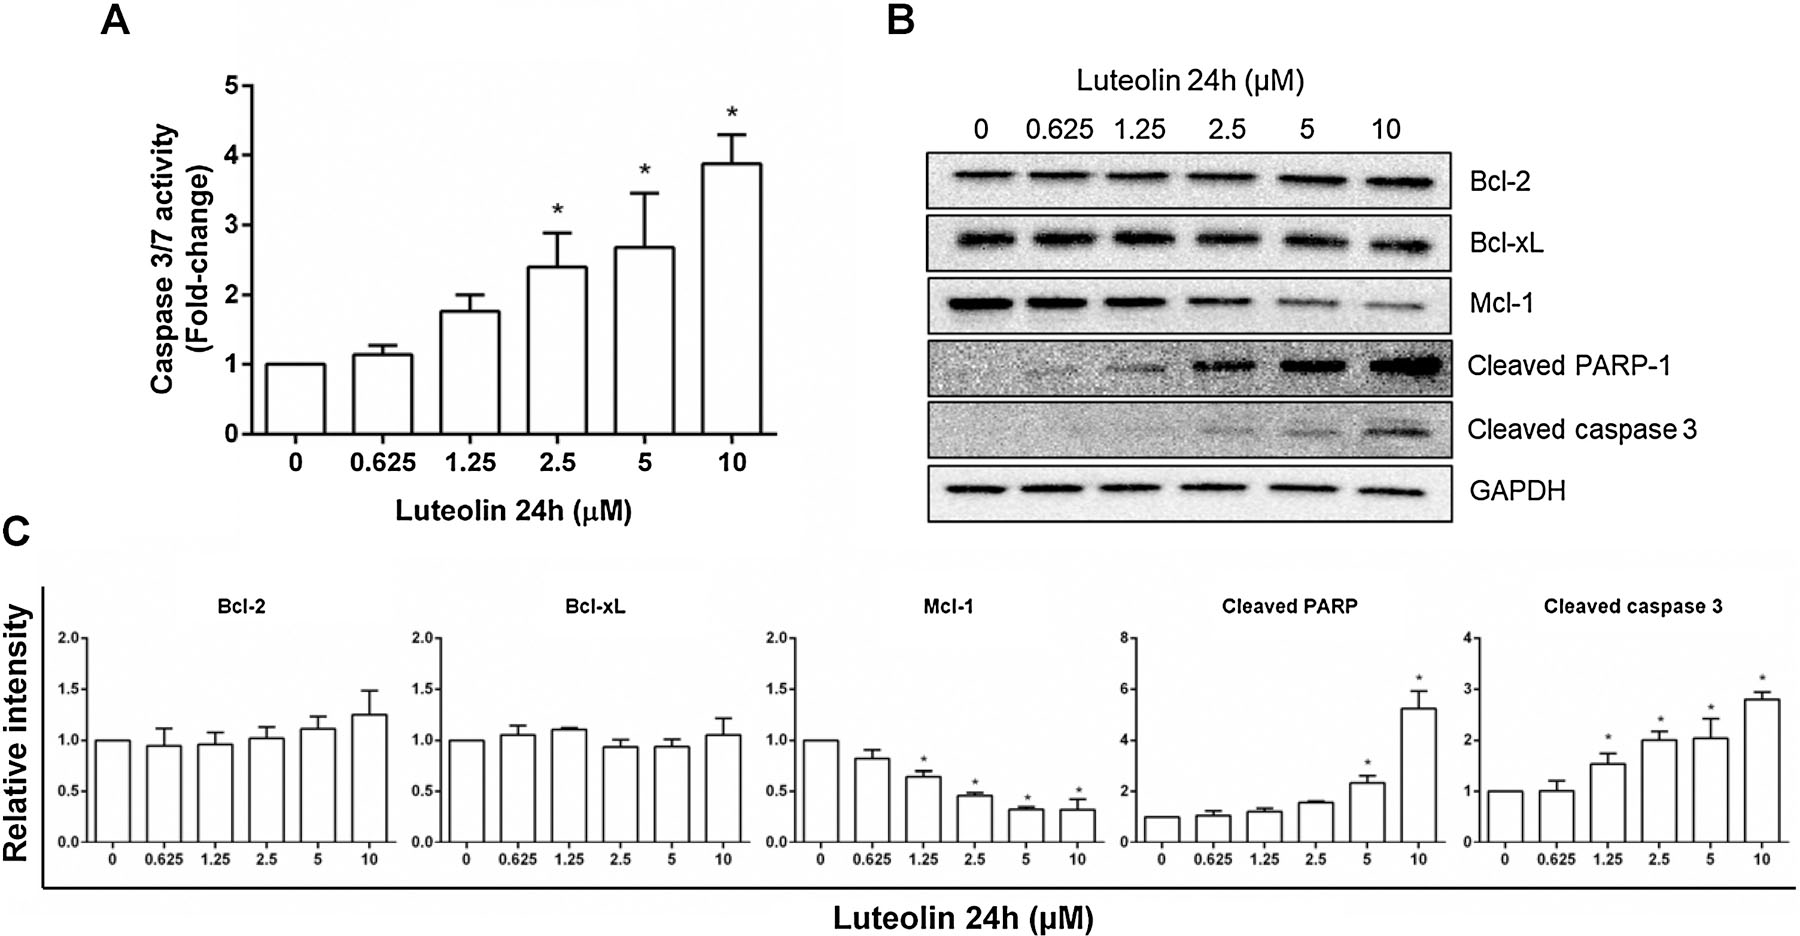
Cells were treated at the indicated concentrations for 24 h. (A) Histogram shows the caspase 3/7 activity as fold-change relative to the vehicle control from three independent experiments (mean ± SD). (B & C) Western blot shows the protein expression of Bcl-2, Bcl-xL, Mcl-1, cleaved PARP-1, and cleaved caspase 3 in treated cells (B); all proteins were quantified and normalized to the amount of GAPDH, then expressed as the mean ± SD from three independent experiments (C). * indicates P < 0.05 comparing to the vehicle controls.
3.3. Luteolin-induced cytotoxicity is enhanced by CYP1A1 and 1A2 metabolism
It has been reported that various flavonoids can be metabolized by CYPs (Breinholt et al., 2002). Thus, one of the main goals of this study is to investigate whether the toxicity of luteolin can be modified by CYP metabolism. We used our newly developed TK6 cell system consisting of fourteen human CYP-expressing TK6 cell lines and an empty vector (EV) control to conduct the experiments. As shown in Figure 4A, cellular ATP content was significantly decreased in the CYP1A1- and 1A2-expressing cells compared to the EV control at concentrations above 1.25 and 2.5 µM, respectively. The other 12 CYPs showed no effects on cellular ATP levels following treatment with luteolin. The results from cell viability assays showed the same pattern of response (Figure 4B). The CYP1A2-expressing TK6 cells showed a statistically lower cell viability starting at 5 µM. Interestingly, although the viability of CYP1A1-expressing cells was reduced compared to the EV controls even at the lowest concentration tested (0.625 µM), there was no significant decrease at the highest concentration (10 µM, about 52% and 45% for both groups), suggesting that the enzymatic activity of CYP1A1 might be inhibited due to severe cytotoxicity. Collectively, these results demonstrate that metabolism of luteolin by CYP1A1 and 1A2 enhances its cytotoxicity in TK6 cells.
Figure 4. Comparison of the cytotoxicity of luteolin in TK6 cells transduced with empty vector (EV) and various CYPs.
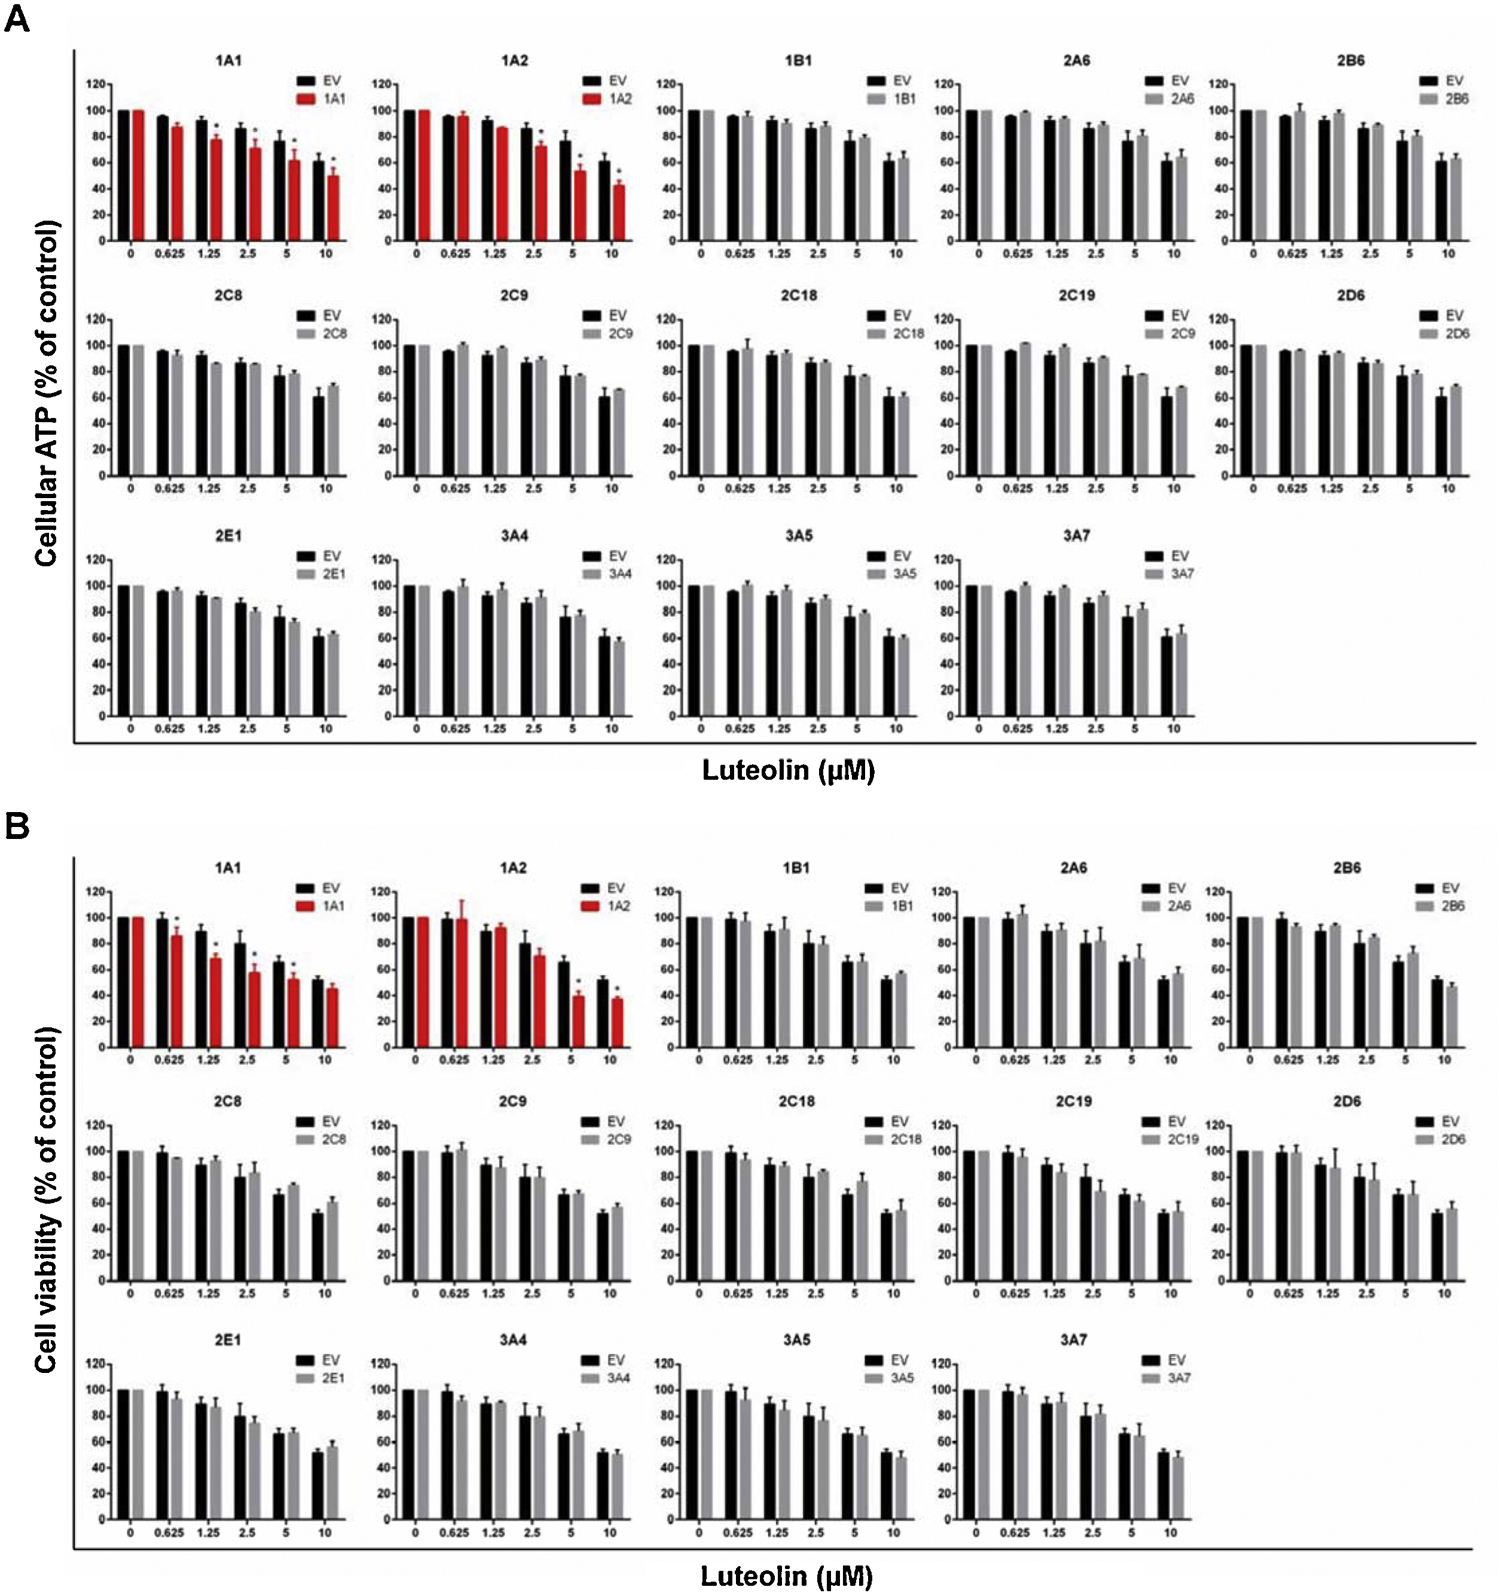
Cells were treated at the indicated concentrations for 24 h. The cellular ATP level (A) and cell viability (B) were determined by the CellTiter-Glo® assay and CellTiter-Blue® assay, respectively. The data represent the mean ± SD from at least three independent experiments. * indicates P < 0.05 comparing a CYP-expressing cell line versus the corresponding EV cells at the same concentration.
3.4. Metabolism by CYP1A1 and 1A2 enhances luteolin-induced chromosome damage
Previously we demonstrated that the HT micronucleus assay is a sensitive and robust method to detect the genotoxicity of compounds that require metabolic activation (Li et al., 2020a). Therefore, we used this method to determine whether the bioactivation of luteolin by CYPs could result in the formation of metabolites that have distinct genotoxic potential in TK6 cells. Testing luteolin in each of the fourteen CYP-transduced cell lines for induction of MN revealed that %MN was significantly increased in the TK6 cells expressing CYP1A1 and 1A2 (Figure 5). This was concordant with the observations in cytotoxicity screening (Figure 4). At 2.5 µM, the CYP1A1- and 1A2-expressing cells showed a significant increase in %MN over the EV controls. At the high dose of 5 µM, the %MN increased more than 25-fold in the CYP1A2-expressing TK6 cells compared to the vehicle control while the increase was less than 4-fold in the EV cell line. The other 12 cell lines showed no significant difference in %MN compared with the EV controls.
Figure 5. Induction of micronuclei by luteolin in TK6 cells transduced with EV and various CYPs.
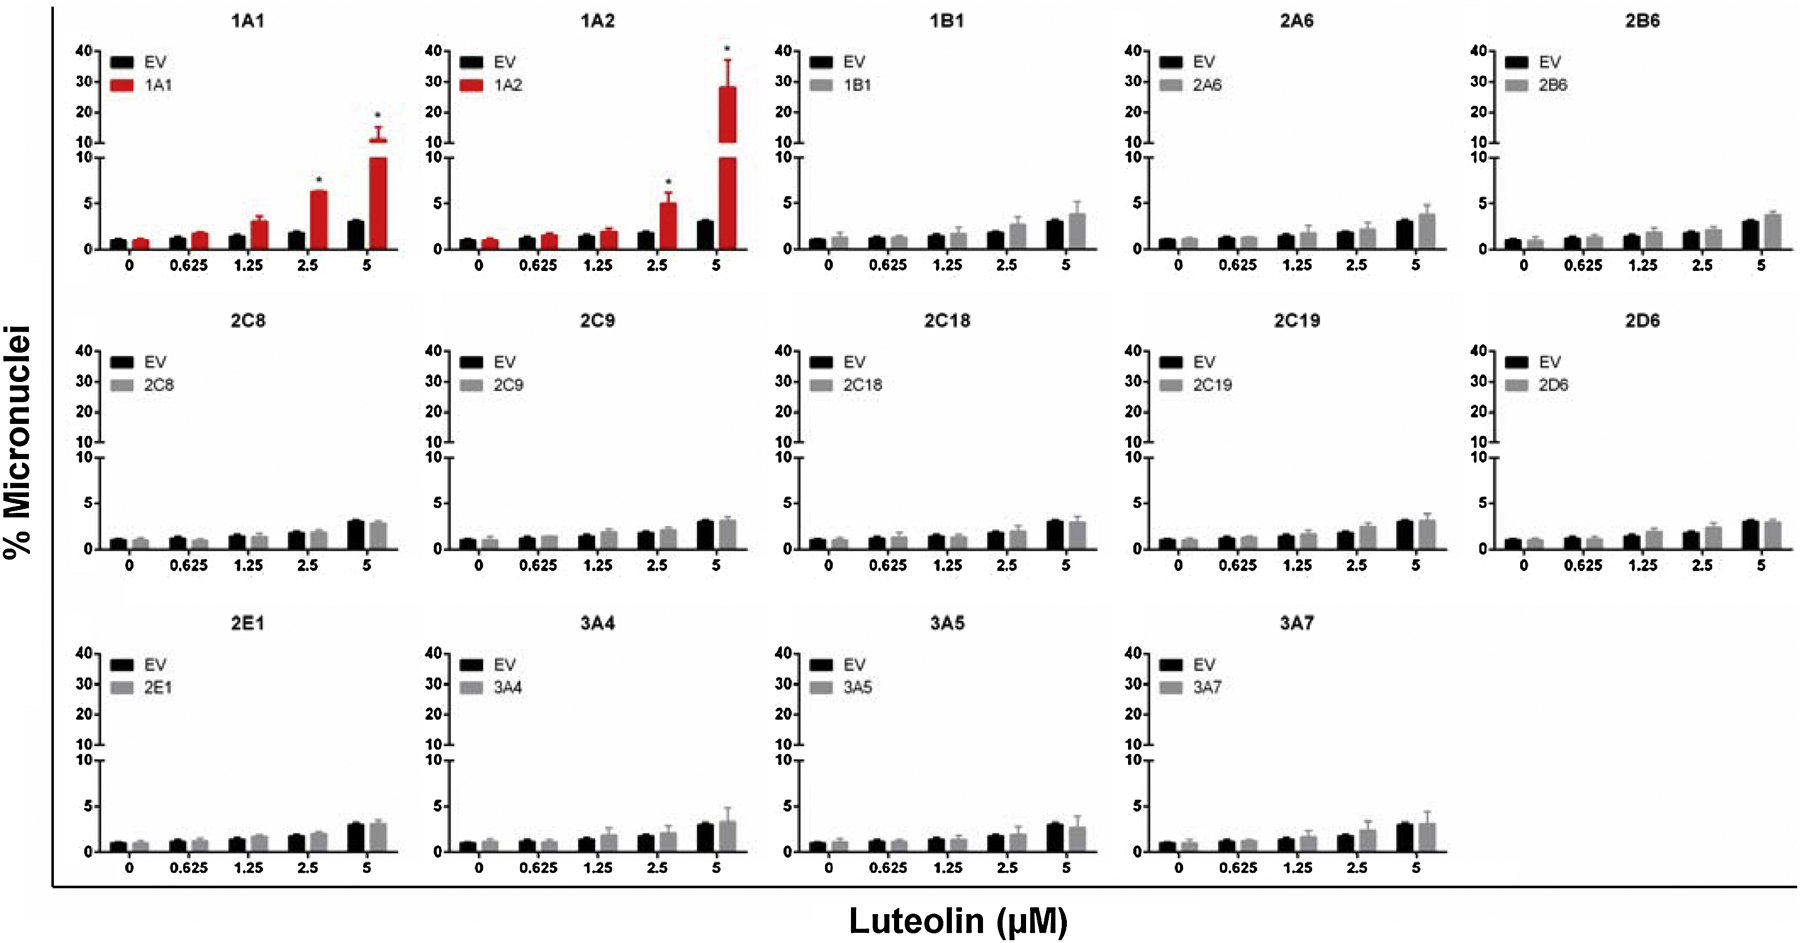
A high-throughput micronucleus assay was used to quantify the micronuclei. The stopping gate was set to record 10,000 intact nuclei. The data represent mean ± SD from at least three independent experiments. * indicates P < 0.05 comparing a CYP-expressing cell line versus the corresponding EV cells at the same concentration.
3.5. Metabolism by CYP1A1 and 1A2 enhances luteolin-induced apoptotic cell death
Because luteolin causes apoptotic cell death in wild-type TK6 cells (Figure 3), we investigated if such effects were enhanced by CYP1A metabolism. As shown in Figure 6A, the magnitude of the increase in caspase 3/7 enzymatic activity was significantly higher in the CYP1A1-expressing TK6 cells when compared to their EV controls, even at the lowest concentration studied (i.e., 0.625 µM). Using Western blot, we first noted that expression of CYP1A1 was significantly inhibited (>2.5-fold) by luteolin (Figures 6B & C), which has been reported before in other biological systems (Kim et al., 2005). Second, apoptosis and DNA damage biomarkers, including cleaved PARP-1, cleaved caspase-3, and γH2A.X, were all significantly increased in the CYP1A1-expressing cells at the 2.5 µM concentration. Induction of apoptosis was further confirmed by the increased ratio of cells with sub-diploid nuclei (sub-G1 phase). At a concentration of 2.5 µM luteolin, about 20% of cells were found in the sub-G1 phase after metabolic activation by CYP1A1 (Figures 6D & E). A concurrent reduction of cells in G1 and S phase was also observed.
Figure 6. Luteolin-induced apoptosis, DNA damage, and cell cycle changes in the CYP1A1-expressing TK6 cells.
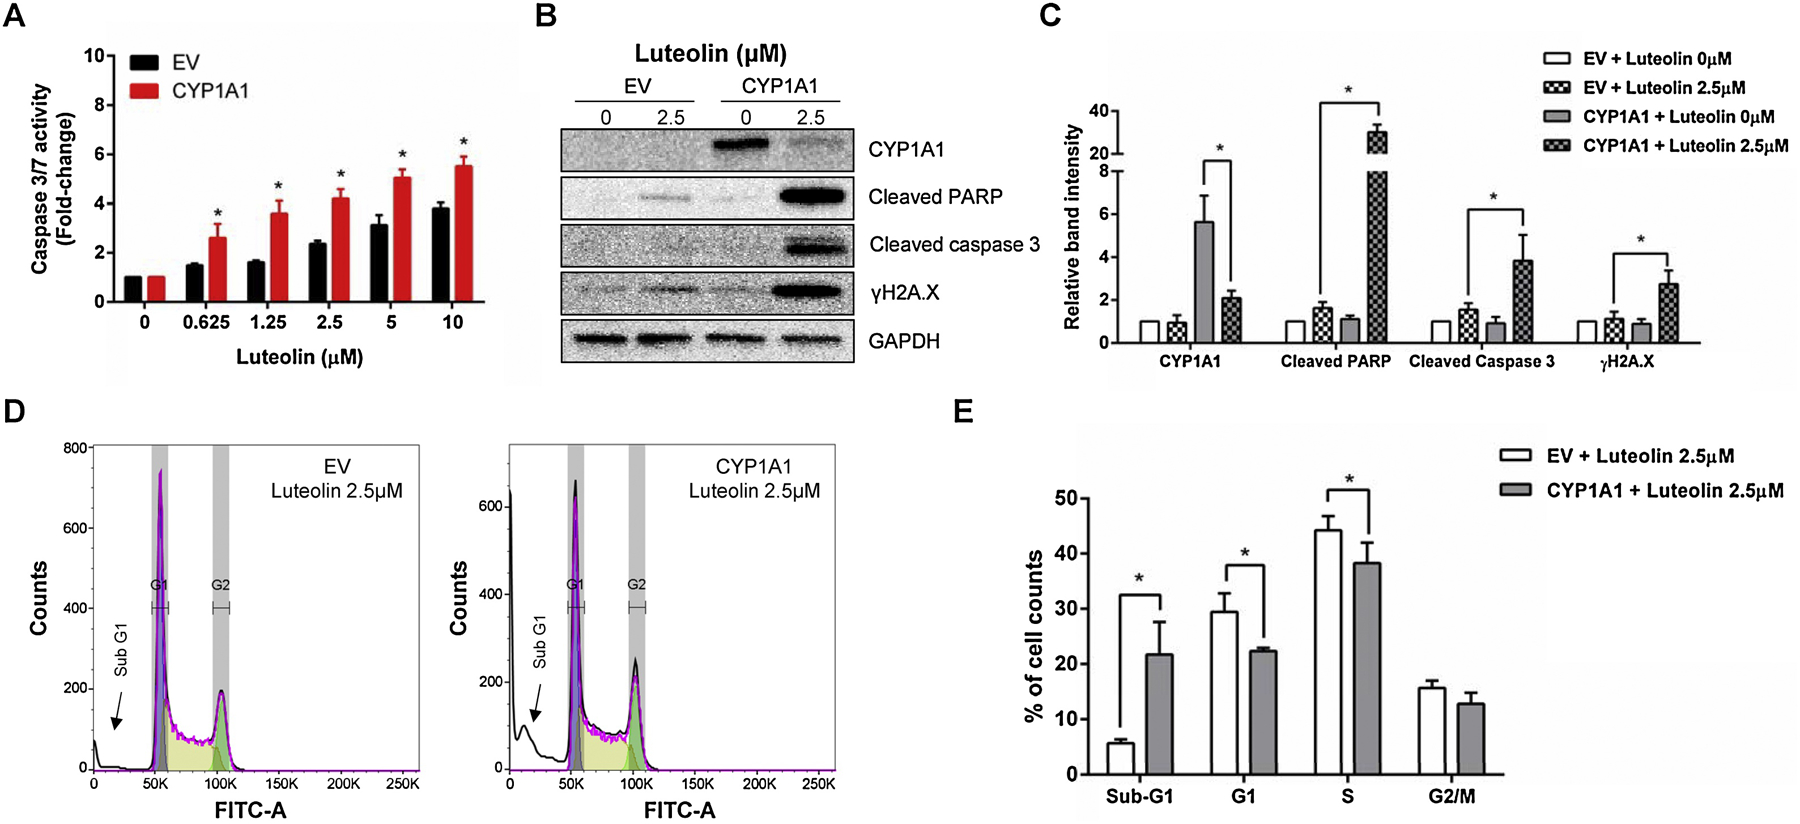
Cells were treated with the indicated concentrations for 24 h. (A) Histogram shows the caspase 3/7 enzymatic activity comparing the CYP1A1-expressing cells to their EV controls. (B & C) Western blot shows the protein expression of CYP1A1, cleaved PARP-1, cleaved caspase 3, and γH2A.X in treated cells (B); all proteins were quantified and normalized to the amount of GAPDH (C). (D & E) Representative flow cytometry plots are shown from one experiment (D) and histogram is cell cycle changes comparing the CYP1A1-expressing cells to their EV controls. The data represent the mean ± SD from three independent experiments (A, C, & E). * indicates P < 0.05 comparing the CYP1A1-expressing cell line versus their corresponding EV controls at the same concentration.
Compared with CYP1A1 (at 0.625 µM), a higher concentration (2.5 µM) was required to observe a significant increase in caspase 3/7 enzymatic activity in the CYP1A2-expressing TK6 cells (Figure 7A), suggesting the efficiency of CYP1A2 may be lower than CYP1A1 in metabolizing luteolin. Similar to the observations in the CYP1A1-expressing cells, CYP1A2 metabolism increased the levels of cleaved PARP-1, cleaved caspase-3, and γH2A.X. Although the CYP1A2 level was reduced in the presence of 5 µM luteolin (Figures 7B & C), the effect was less than what was seen with CYP1A1. At 5 µM, luteolin induced a significant increase in cells in the sub-G1 phase and decreases in cells in the G1 and S phases. Taken together, these data clearly indicate that CYP1A1 and 1A2 enhanced luteolin induced apoptosis after a 24-h exposure in TK6 cells.
Figure 7. Luteolin-induced apoptosis, DNA damage, and cell cycle changes in the CYP1A2-expressing TK6 cells.
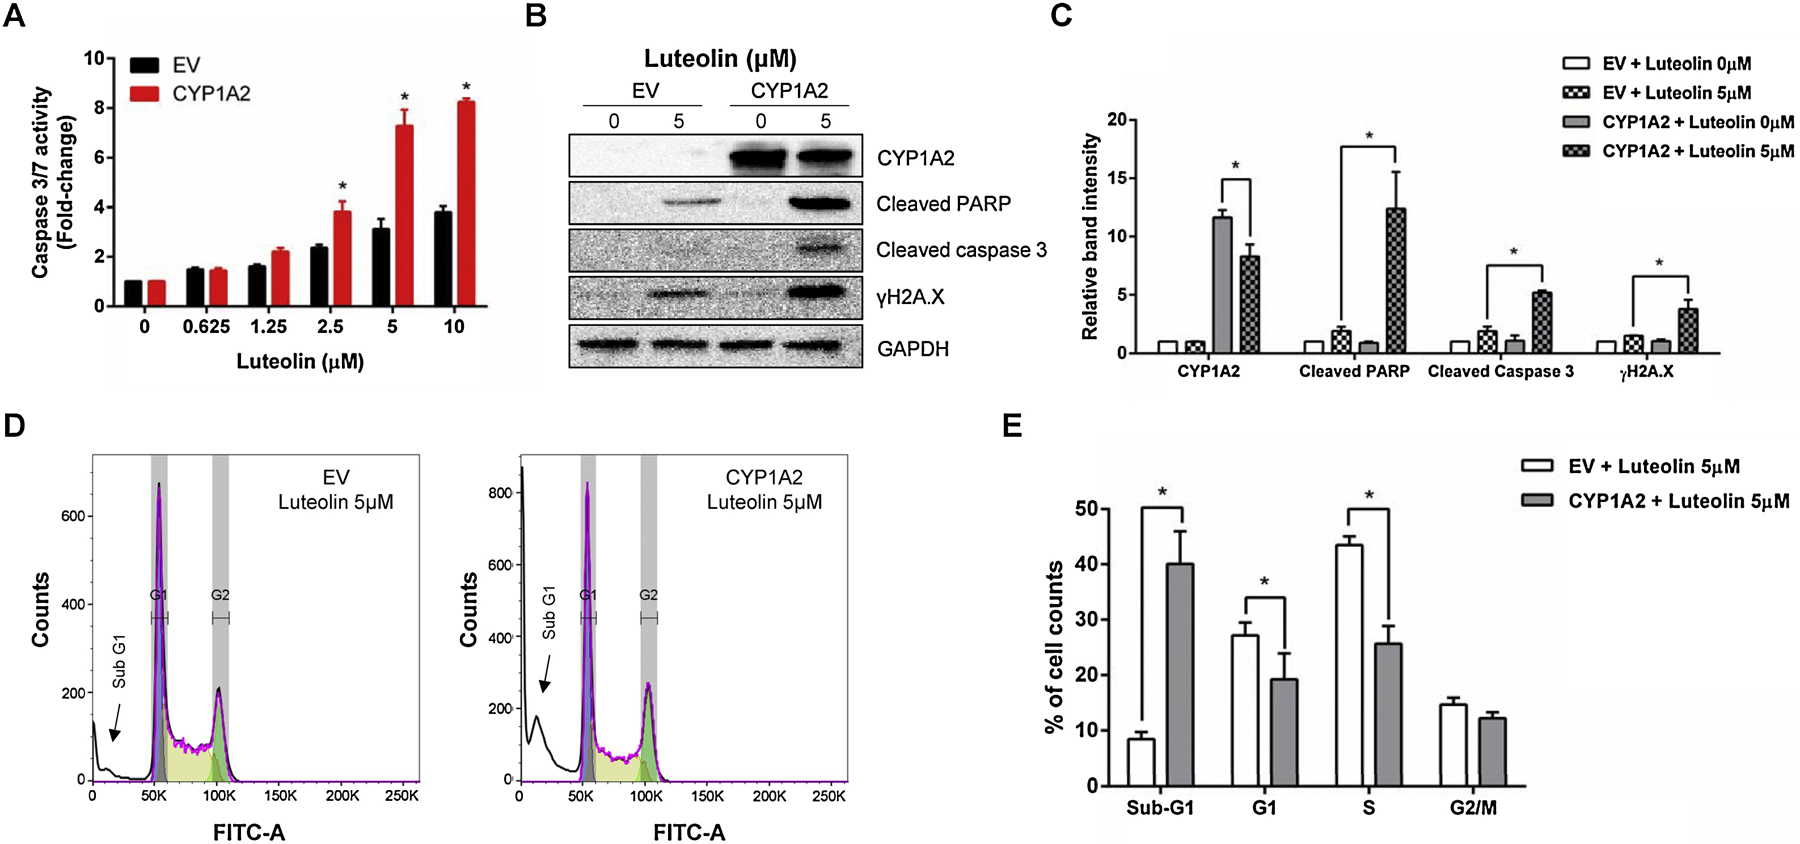
Cells were treated with the indicated concentrations for 24 h. (A) Histogram shows the caspase 3/7 enzymatic activity comparing the CYP1A2-expressing cells to their EV controls. (B & C) Western blot shows the protein expression of CYP1A1, cleaved PARP-1, cleaved caspase 3, and γH2A.X in treated cells (B); all proteins were quantified and normalized to the amount of GAPDH (C). (D & E) Representative flow cytometry plots are shown from one experiment (D) and histogram is cell cycle changes comparing the CYP1A2-expressing cells to their EV controls. The data represent the mean ± SD from three independent experiments (A, C, & E). * indicates P < 0.05 comparing the CYP1A2-expressing cell line versus their corresponding EV controls at the same concentration from three independent experiments.
3.6. Metabolism by CYP1A1 and 1A2 enhances the cytotoxicity of luteolin indirectly via demethylation
Since hydroxylation is the major reaction catalyzed by CYPs for flavonoids, we first investigated whether there were any hydroxylated metabolites of luteolin present in the CYP1A1- and 1A2-expressing TK6 cells. Using LC-MS/MS, we tried to detect the presence of 6-hydroxyluteolin, quercetin, and tricetin, which have an additional hydroxyl group on the A, B, and C ring of luteolin, respectively (Figure 1). However, none of these three flavonoids were detected in either cell lysates or culture medium (data not shown) in the CYP1A1 and CYP1A2-expressing TK6 cells after luteolin exposure.
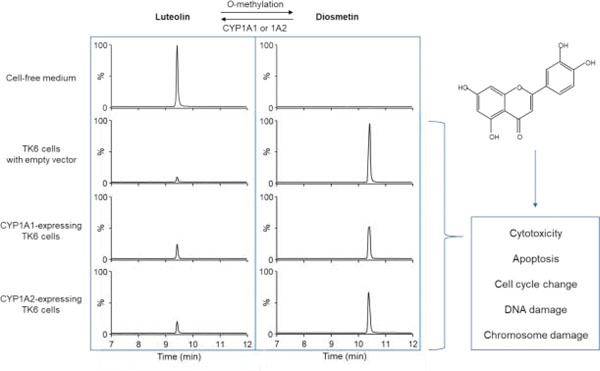
Interestingly, we found that only a small amount of luteolin could be recovered in the culture medium with TK6 cells after 24-h treatment at the concentration of 2.5 µM, and the level of luteolin was non-detectable in the cell lysate. We first confirmed that such a significant decrease was not caused by luteolin degradation by running parallel cell-free medium controls under the same experimental condition. As shown in Figure 8A (left panel), compared to the cell-free medium, the level of luteolin decreased to approximately 8% in the EV controls, suggesting a non-CYP related biotransformation of luteolin in TK6 cells. Subsequently, using LC-MS/MS, we found that most of the luteolin was methylated into diosmetin by TK6 cells, while diosmetin was non-detectable in the cell-free medium controls after 24 h (Figure 8A, right panel). When compared to the EV controls, the levels of luteolin were significantly higher in the CYP1A1- and 1A2-expressing TK6 cells at 24 h (Figure 8B). Concordantly, the levels of diosmetin in the CYP1A1- and 1A2-expressing TK6 cells were significantly lower than the levels in the EV controls as early as 2 h (Figure 8C). These results indicate the balance between luteolin and diosmetin in the system was shifted toward luteolin by CYP1A1 and 1A2 (Figure 1B).
Figure 8. Quantification of luteolin and diosmetin in the cell culture medium of different TK6 cell lines.
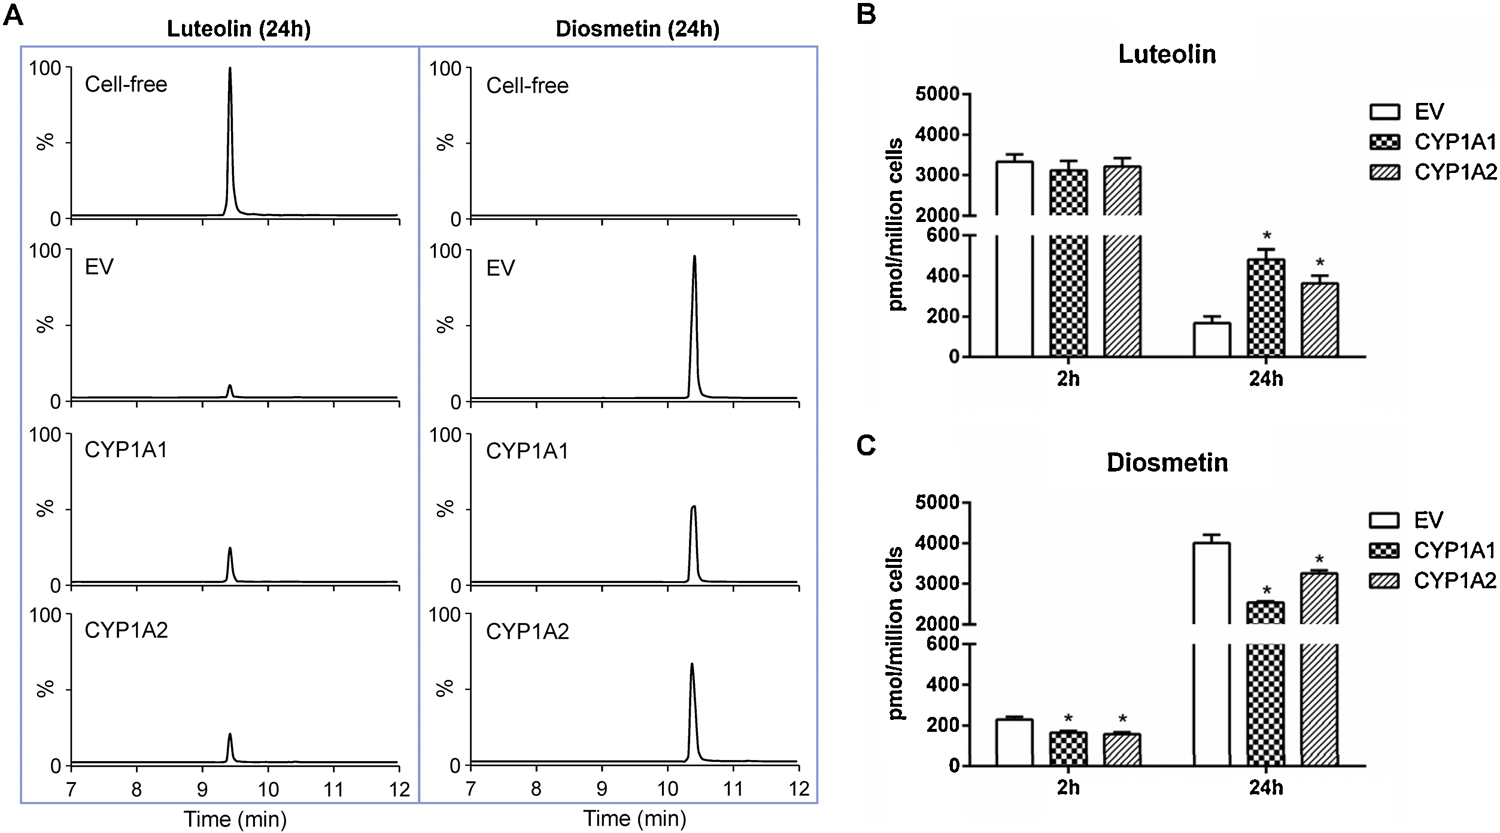
Cells were treated with 2.5 µM luteolin for 2 and 24 h. (A) Representative LC-MS/MS chromatograms show the biotransformation of luteolin to diosmetin after 24-h treatment in the cell-free medium and the cell culture medium of different TK6 cell lines. The amount of luteolin (B) and diosmetin (C) in the cell culture media were quantified after 2- and 24-h treatments. The data represent the mean ± SD from three independent experiments (B & C). * indicates P < 0.05 comparing a CYP-expressing cell line versus the EV controls at the same concentration.
Based on these observations, we then compared the toxicity of diosmetin and luteolin in wild-type TK6 cells. As expected, diosmetin showed no evidence of cytotoxicity as measured by cellular ATP levels, while luteolin induced concentration-dependent cytotoxicity (Figure 9A). In contrast, diosmetin induced cytotoxicity and genotoxicity in the CYP1A1- and 1A2-expressing TK6 cells when compared to the EV controls (Figures 9B & C). At 10 µM diosmetin, the %MN in the EV controls increased 1.7-fold while the %MN in the CYP1A1- and 1A2-expressing TK6 cells increased 4.1- and 6.2-fold, respectively. Taken together, these results suggest that the enhanced toxicity of luteolin in the CYP1A-expressing TK6 cells results from a reduction in diosmetin formation (i.e., biotransformation of luteolin) in TK6 cells.
Figure 9. Effects of diosmetin on cytotoxicity and genotoxicity in different TK6 cell lines.
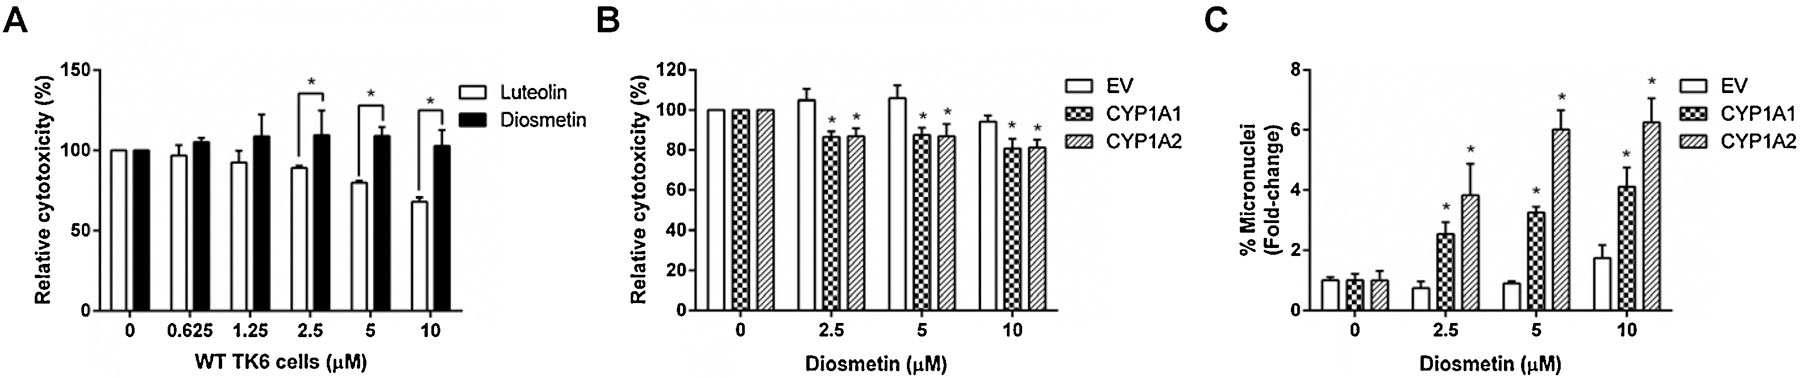
Cells were treated with diosmetin at the indicated concentrations for 24 h. (A & B) Cytotoxicity was measured by the cellular ATP level using the CellTiter-Glo® assay. (C) Genotoxicity was determined by the high-throughput micronucleus assay using flow cytometry. The data represent as mean ± SD from three independent experiments * indicates P < 0.05 comparing diosmetin and luteolin at the same concentration (A) or a CYP-expressing cell line versus the EV controls at the same concentration (B & C).
4. Discussion
Flavonoids are ubiquitous constituents of plants, including edible plants. Based on chemical structure (Figure 1), flavones and flavonols are the two main subclasses of flavonoids (Hostetler et al., 2017; Middleton et al., 2000). The beneficial properties of flavonoids have been studied extensively, as evidenced by the fact that 90% of publications in PubMed related to flavonoid bioactivity address beneficial effects (searched in November of 2020). Flavonoid toxicity, however, has not been as widely investigated. Currently, herbal medicines and dietary supplements serve as an additional source of exposure to flavonoids, and large numbers of flavonoid supplements in various forms (e.g., capsules or pills) and compositions (either single flavonoids or flavonoid-mixture), with a variety of health claims, are available in markets around the world (Egert and Rimbach, 2011; Espin et al., 2007). Therefore, concerns for the safety of some flavonoids within realistic human exposure scenarios have been growing (Barenys et al., 2017; Mei et al., 2017).
For example, quercetin (a flavonol, Figure 1C) is one of the most abundant flavonoids in our foods, with a median dietary intake of ~33 mg/day (Wang et al., 2009). However, the recommended daily dose for marketed dietary supplements of quercetin ranges up to 1 g per day. The U.S. National Toxicology Program (NTP) conducted a two-year feeding study with quercetin in rats (40–1900 mg/kg/day as estimated doses) and reported that long-term exposure to quercetin in the diet resulted in dose-related increases in renal lesions in male F344/N rats (NTP, 1992). In addition, quercetin and another two flavonols, kaempferol and isorhamnetin, have been shown to induce genotoxicity and DNA damage in mouse lymphoma L5178Y cells (Lin et al., 2014) and in human hepatoma HepG2 cells (Zhang et al., 2015).
Compared to quercetin, the flavone luteolin (Figure 1B) and its derivatives have not been as widely investigated for toxicity potential. Average dietary flavone (including luteolin) intake in selected regions or countries is less than 2 mg per day (Graf et al., 2005; Wang et al., 2009), while marketed, isolated luteolin dietary supplements have recommended daily intakes of up to 200 mg/day. Results of a comet assay with luteolin in cultured human lymphocytes showed that the balance between protection from oxidative damage to DNA and induction of oxidative damage was strongly dependent on luteolin concentration and exposure duration (Rusak et al., 2010). Results of additional testing adds to the evidence that exposures to these types of compounds may have adverse consequences. Luteolin and luteolin-7-O-glucoside at 10–20 μg/mL for 48-h induced sister-chromatid exchanges (SCE) and micronuclei in cultured human lymphocytes (Popp and Schimmer, 1991). When Chinese hamster V79 cells were treated with 20 μM luteolin without S9 activation for 3 h, clastogenic (as measured by the MN assay), DNA intercalative, and topoisomerase II-interactive effects were observed (Snyder and Gillies, 2002). Therefore, regular consumption of flavonoids in a concentrated supplement could potentially pose greater health risks than benefits (Galati and O’Brien 2004), and this possibility should be further investigated.
In the present study, we used human lymphoblastoid TK6 cells to measure luteolin-induced cytotoxic and genotoxic effects. This cell line was established in 1978 and has been widely used as a standard cell model for in vitro genotoxicity testing (Lorge et al., 2016; OECD, 2016). We demonstrated that luteolin (0.625–10 µM)-induced cytotoxicity was detected after a 24-h treatment, DNA damage was observed by the comet assay and γH2A.X protein expression, and chromosome damage was confirmed by the high-throughput MN assay (Figure 2). Our results confirm previously published reports that luteolin shows a potential for inducing genetic damage. In addition, we also observed that caspase-3/7 activity was significantly increased in TK6 cells after exposure to 2.5 µM luteolin, and the expression of one anti-apoptotic protein, Mcl-1, was inhibited by luteolin (Figure 3). Mcl-1 plays an important role in the sensitization of cells to apoptotic signals (Nijhawan et al., 2003). For example, quercetin has been shown to downregulate Mcl-1 in B cells isolated from patients and induce a proteasome-dependent degradation of Mcl-1 proteins in U-937 human myelomonocytic cell line (Spagnuolo et al., 2011). The destruction of Mcl-1 can be an initial step in the apoptosis signaling pathway in cells exposed to stresses such as DNA damage (Cuconati et al., 2003). In support of our findings, luteolin was reported to activate caspases and induce apoptosis in vitro and in vivo (Tuorkey, 2016), and at concentrations of 30 and 100 µM, luteolin significantly increased total apoptotic cells and upregulated caspase-3 and −9 in human chronic lymphocytic leukemia cell lines (Sak et al., 2016).
The addition of Aroclor 1254-induced rat liver S9, which expresses a high level of CYP1A enzymes, has been shown to increase the mutagenicity of luteolin in S. typhimurium strain TA102 in the Ames assay (Resende et al., 2012), suggesting that metabolism may enhance the biological effects of this flavone. Therefore, we applied our newly constructed CYP-expressing TK6 cell lines (Li et al., 2020a; Li et al., 2020b) to investigate the effects of individual CYPs in the bioactivation of luteolin and any associated changes in luteolin-induced toxicity. Among the fourteen CYPs tested, we found that the toxicity of luteolin was enhanced only in the presence of CYP1A1 and 1A2, suggesting that these two CYPs may transform luteolin to a more active form (Figure 4). The observed increases in cytotoxicity, micronucleus formation, caspase 3/7 activity, and apoptotic/DNA damage responsive proteins in the CYP1A-expressing cells (Figures 5–7) provide consistent evidence in support of our findings. The role of CYP1A enzymes in metabolizing other flavones has been demonstrated in vitro. Acacetin (an O-methylated flavone), for example, is metabolized by CYP1A1 to the structurally similar flavone apigenin by demethylation (Androutsopoulos et al., 2011). Diosmetin (Figure 1B) has also been shown to be a substrate of CYP1A enzymes (Doostdar et al., 2000). However, in a cell-free microsome system, human recombinant CYP1A1 and 1A2 did not metabolize luteolin (Wilsher et al., 2017). We originally postulated that this difference could be attributed to the intrinsic differences between the two test systems. To test our hypothesis, we measured CYP1A-mediated metabolites of luteolin in the CYP1A-expressing TK6 cell lines. CYP1A enzymes are known to catalyze a variety of reactions including demethylation, hydroxylation, oxidation, epoxidation, and quinol formation (Lu et al., 2020). Among these, hydroxylation and demethylation are the most relevant to flavonoids (Halbwirth, 2010; Hamada et al., 2010). Since there is no methoxy group on luteolin, we hypothesized that hydroxylation was the major reaction involved in the metabolism of luteolin by CYP1A1 and 1A2. However, using LC-MS/MS analysis, we identified none of the metabolites that could be produced via hydroxylation of luteolin (6-hydroxyluteolin, tricetin, quercetin) in the CYP1A1- and 1A2-expressing cells (data not shown). This finding is consistent with the results from the cell-free microsome study (Wilsher et al., 2017), confirming that luteolin is not directly hydroxylated by CYP1A enzymes.
Previously, breast cancer cells expressing CYP1 enzymes (MDA-MB-468 cells) were shown to be more sensitive to luteolin-induced cytotoxicity compared with breast cancer cells without these enzymes (MCF10A cells) (Wilsher et al., 2017). Similarly, MCF7 cells pre-treated with TCDD (a CYP1 inducer) showed enhanced sensitivity to the anti-proliferative effect of luteolin. These data suggest involvement of CYP1 enzymes in enhancing the toxicity of luteolin in human cells. 6-Hydroxyluteolin is a metabolite of luteolin, as shown in bioactivation studies using human recombinant CYP1B1 in a cell-free system. However, the cytotoxicity of luteolin, the parent compound, is much higher than that of the metabolite 6-hydroxyluteolin in the CYP1-expressing MDA-MB-468 cells (Wilsher et al., 2017), suggesting that there are other mechanisms underlying the enhanced cytotoxicity of luteolin with CYP1 enzymes. In our newly developed TK6 cell system, we specifically showed that CYP1A1 and 1A2, but not CYP1B1, were the major enzymes that account for the enhanced cytotoxic and genotoxic effects of luteolin (Figures 4–7). This enhanced bioactivity is due at least in part to the demethylation of diosmetin in the CYP1A1- and 1A2-expressing TK6 cells (Figures 8 & 9). This proposed mechanism is supported by results from a previous study which demonstrated that a human microsome containing CYP1A1 and 1A2 was capable of removing the 4’ methyl group on diosmetin (Androutsopoulos and Spandidos, 2013). On the other hand, the observed methylation reaction that biotransforms luteolin to diosmetin is likely catalyzed by catechol O-methyltransferase (COMT), an enzyme that is widely expressed and active in numerous human cell types including lymphocytes (Chen et al., 2004). It has been reported that human lymphoblastoid cells have appreciable COMT activity both from membrane-bound and soluble COMT proteins (Chen et al., 2011). Furthermore, in cultured human hepatocytes, diosmetin was detected as the major methylated metabolite of luteolin produced by COMT activity in vitro (Ha et al., 2017). Because luteolin also contains a catechol on the B-ring, we believe that COMT rapidly converted most of the luteolin in human lymphoblastoid TK6 cells into the much less cytotoxic metabolite diosmetin (Figure 9), and this action is partially reversed or inhibited in TK6 cells that express CYP1A1 and 1A2 (Figures 1B & 8).
The current study is limited in that only a cell-based in vitro system was used to examine the role of individual CYP enzymes in luteolin-induced toxicities. The complexity of in vivo metabolism, especially when the processes involved in phase II detoxification are considered, is significantly greater than the processes captured in an in vitro system. For example, after oral administration of 5 mg/kg luteolin to rats, two methylated metabolites (diosmetin and chrysoeriol), three glucuronides of luteolin, and four methylated glucuronides were detected in plasma samples (Wang et al., 2017). The UDP-glucuronosyltransferases (UGTs) and COMT can interact, competing with each other, and depending on which factors dominate, can alter the disposition of luteolin in vivo. Because the dynamic balance or imbalances between competing phase I (e.g., CYP1A1 and 1A2) and phase II (e.g., COMT) enzymes may result in enhanced susceptibility to luteolin and therefore luteolin-induced genotoxicity, additional in vivo studies are needed to evaluate the relationship between the concentrations of these chemicals in the blood and the relative activities of phase I/II enzymes. In addition, the possible effects of genetic polymorphisms in CYP1A1, CYP1A2, COMT, and other genes that play important roles in the activation and detoxification of luteolin should be examined in future studies.
5. Conclusion
The results of this study demonstrated that luteolin, a flavone in the class of flavonoids, induced cytotoxic and genotoxic effects in human TK6 cells; luteolin-induced apoptosis and DNA or chromosome damage were enhanced in the CYP1A1- and 1A2-expressing TK6 cell lines. These results provide additional evidence that CYP1A enzyme levels could be one of the factors responsible for the observed different toxicities of luteolin in different cell types. The mechanism whereby CYP1A enzymes enhance luteolin bioactivity may be via demethylation of diosmetin that is formed from luteolin in TK6 cells. Furthermore, the results from this latest study demonstrate the utility of our newly developed TK6 cell system for identification of the specific CYPs that are responsible for chemical bioactivation and toxicity potential. Individuals who routinely use flavonoids (e.g., luteolin) as dietary supplements (either as a single ingredient or in a mixture) should be aware of potential safety issues arising from the adverse effects we identified with luteolin in vitro. More investigations to better characterize the safety profiles of flavonoids are warranted.
Highlights:
Luteolin induces concentration-dependent cytotoxicity and genotoxicity in TK6 cells
Luteolin-induced toxicity is enhanced in the TK6 cells expressing CYP1A1 and 1A2
Luteolin is methylated in TK6 cells to form the less toxic metabolite diosmetin
CYP1A enzymes partially reverse luteolin’s methylation, leading to increased toxicity
Acknowledgments
We thank Drs. Page McKinzie and Qiangen Wu for their critical review of this manuscript.
Funding
This work was supported by the U.S. Food and Drug Administration (FDA), National Center for Toxicological Research (NCTR, project number E0765701), and in part by the U.S. National Institutes of Health (NIH), National Institute of Environmental Health Sciences (NIEHS). XL and YL were supported by an appointment to the Postgraduate Research Program at the NCTR administered by the Oak Ridge Institute for Science Education through an interagency agreement between the U.S. Department of Energy and the U.S. FDA.
Footnotes
Publisher's Disclaimer: This is a PDF file of an unedited manuscript that has been accepted for publication. As a service to our customers we are providing this early version of the manuscript. The manuscript will undergo copyediting, typesetting, and review of the resulting proof before it is published in its final form. Please note that during the production process errors may be discovered which could affect the content, and all legal disclaimers that apply to the journal pertain.
Declaration of Competing Interest
The information in this manuscript is not a formal dissemination of information by the U.S. FDA or the U.S. NIH and does not represent the agency position or policy of either agency.
Declaration of Interest Statement
The authors declare that they have no known competing financial interests or personal relationships that could have appeared to influence the work reported in this paper.
References
- Androutsopoulos VP, Papakyriakou A, Vourloumis D, Spandidos DA, 2011. Comparative CYP1A1 and CYP1B1 substrate and inhibitor profile of dietary flavonoids. Bioorg Med Chem 19, 2842–2849. [DOI] [PubMed] [Google Scholar]
- Androutsopoulos VP, Ruparelia K, Arroo RR, Tsatsakis AM, Spandidos DA, 2009. CYP1-mediated antiproliferative activity of dietary flavonoids in MDA-MB-468 breast cancer cells. Toxicology 264, 162–170. [DOI] [PubMed] [Google Scholar]
- Androutsopoulos VP, Spandidos DA, 2013. The flavonoids diosmetin and luteolin exert synergistic cytostatic effects in human hepatoma HepG2 cells via CYP1A-catalyzed metabolism, activation of JNK and ERK and P53/P21 up-regulation. The Journal of nutritional biochemistry 24, 496–504. [DOI] [PubMed] [Google Scholar]
- Barenys M, Masjosthusmann S, Fritsche E, 2017. Is Intake of flavonoid-based food supplements during pregnancy safe for the developing child? a literature review. Curr Drug Targets 18, 196–231. [DOI] [PubMed] [Google Scholar]
- Breinholt VM, Offord EA, Brouwer C, Nielsen SE, Brosen K, Friedberg T, 2002. In vitro investigation of cytochrome P450-mediated metabolism of dietary flavonoids. Food Chem Toxicol 40, 609–616. [DOI] [PubMed] [Google Scholar]
- Cariddi LN, Sabini MC, Escobar FM, Montironi I, Manas F, Iglesias D, Comini LR, Sabini LI, Dalcero AM, 2015. Polyphenols as possible bioprotectors against cytotoxicity and DNA damage induced by ochratoxin A. Environ Toxicol Pharmacol 39, 1008–1018. [DOI] [PubMed] [Google Scholar]
- Chen J, Lipska BK, Halim N, Ma QD, Matsumoto M, Melhem S, Kolachana BS, Hyde TM, Herman MM, Apud J, Egan MF, Kleinman JE, Weinberger DR, 2004. Functional analysis of genetic variation in catechol-O-methyltransferase (COMT): effects on mRNA, protein, and enzyme activity in postmortem human brain. Am J Hum Genet 75, 807–821. [DOI] [PMC free article] [PubMed] [Google Scholar]
- Chen J, Song J, Yuan P, Tian Q, Ji Y, Ren-Patterson R, Liu G, Sei Y, Weinberger DR, 2011. Orientation and cellular distribution of membrane-bound catechol-O-methyltransferase in cortical neurons: implications for drug development. Journal of Biological Chemistry 286, 34752–34760. [DOI] [PMC free article] [PubMed] [Google Scholar]
- Chen S, Wan L, Couch L, Lin H, Li Y, Dobrovolsky VN, Mei N, Guo L, 2013. Mechanism study of goldenseal-associated DNA damage. Toxicology letters 221, 64–72. [DOI] [PMC free article] [PubMed] [Google Scholar]
- Cuconati A, Mukherjee C, Perez D, White E, 2003. DNA damage response and MCL-1 destruction initiate apoptosis in adenovirus-infected cells. Genes & development 17, 2922–2932. [DOI] [PMC free article] [PubMed] [Google Scholar]
- Doostdar H, Burke MD, Mayer RT, 2000. Bioflavonoids: selective substrates and inhibitors for cytochrome P450 CYP1A and CYP1B1. Toxicology 144, 31–38. [DOI] [PubMed] [Google Scholar]
- Egert S, Rimbach G, 2011. Which sources of flavonoids: complex diets or dietary supplements? Adv Nutr 2, 8–14. [DOI] [PMC free article] [PubMed] [Google Scholar]
- Espin JC, Garcia-Conesa MT, Tomas-Barberan FA, 2007. Nutraceuticals: facts and fiction. Phytochemistry 68, 2986–3008. [DOI] [PubMed] [Google Scholar]
- Fateh AH, Mohamed Z, Chik Z, Alsalahi A, Md Zin SR, Alshawsh MA, 2019. Prenatal developmental toxicity evaluation of Verbena officinalis during gestation period in female Sprague-Dawley rats. Chem Biol Interact 304, 28–42. [DOI] [PubMed] [Google Scholar]
- Galati G, O’Brien PJ, 2004. Potential toxicity of flavonoids and other dietary phenolics: significance for their chemopreventive and anticancer properties. Free Radic Biol Med 37, 287–303. [DOI] [PubMed] [Google Scholar]
- George VC, Dellaire G, Rupasinghe HPV, 2017. Plant flavonoids in cancer chemoprevention: role in genome stability. J Nutr Biochem 45, 1–14. [DOI] [PubMed] [Google Scholar]
- Graf BA, Milbury PE, Blumberg JB, 2005. Flavonols, flavones, flavanones, and human health: epidemiological evidence. J Med Food 8, 281–290. [DOI] [PubMed] [Google Scholar]
- Ha SK, Lee JA, Cho EJ, Choi I, 2017. Effects of catechol O-methyl transferase inhibition on anti-inflammatory activity of luteolin metabolites. J Food Sci 82, 545–552. [DOI] [PubMed] [Google Scholar]
- Halbwirth H, 2010. The creation and physiological relevance of divergent hydroxylation patterns in the flavonoid pathway. Int J Mol Sci 11, 595–621. [DOI] [PMC free article] [PubMed] [Google Scholar]
- Hamada M, Satsu H, Ashida H, Sugita-Konishi Y, Shimizu M, 2010. Metabolites of galangin by 2, 3, 7, 8-tetrachlorodibenzo-p-dioxin-inducible cytochrome P450 1A1 in human intestinal epithelial Caco-2 cells and their antagonistic activity toward aryl hydrocarbon receptor. Journal of agricultural and food chemistry 58, 8111–8118. [DOI] [PubMed] [Google Scholar]
- Hostetler GL, Ralston RA, Schwartz SJ, 2017. Flavones: food sources, bioavailability, metabolism, and bioactivity. Adv Nutr 8, 423–435. [DOI] [PMC free article] [PubMed] [Google Scholar]
- Imran M, Rauf A, Abu-Izneid T, Nadeem M, Shariati MA, Khan IA, Imran A, Orhan IE, Rizwan M, Atif M, 2019. Luteolin, a flavonoid, as an anticancer agent: A review. Biomedicine & Pharmacotherapy 112, 108612. [DOI] [PubMed] [Google Scholar]
- Kim H-J, Lee SB, Park S-K, Kim HM, Park YI, Dong M-S, 2005. Effects of hydroxyl group numbers on the B-ring of 5,7-dihydroxyflavones on the differential inhibition of human CYP 1A and CYP1B1 enzymes. Archives of Pharmacal Research 28, 1114. [DOI] [PubMed] [Google Scholar]
- Li X, Chen S, Guo X, Wu Q, Seo JE, Guo L, Manjanatha MG, Zhou T, Witt KL, Mei N, 2020a. Development and application of TK6-derived cells expressing human cytochrome P450s for genotoxicity testing. Toxicol Sci 175, 251–265. [DOI] [PMC free article] [PubMed] [Google Scholar]
- Li X, He X, Chen S, Guo X, Bryant MS, Guo L, Manjanatha MG, Zhou T, Witt KL, Mei N, 2020b. Evaluation of pyrrolizidine alkaloid-induced genotoxicity using metabolically competent TK6 cell lines. Food Chem Toxicol 145, 111662. [DOI] [PMC free article] [PubMed] [Google Scholar]
- Lin H, Guo X, Zhang S, Dial SL, Guo L, Manjanatha MG, Moore MM, Mei N, 2014. Mechanistic evaluation of Ginkgo biloba leaf extract-induced genotoxicity in L5178Y cells. Toxicol Sci 139, 338–349. [DOI] [PMC free article] [PubMed] [Google Scholar]
- Lopez-Lazaro M, 2009. Distribution and biological activities of the flavonoid luteolin. Mini Rev Med Chem 9, 31–59. [DOI] [PubMed] [Google Scholar]
- Lorge E, Moore MM, Clements J, O’Donovan M, Fellows MD, Honma M, Kohara A, Galloway S, Armstrong MJ, Thybaud V, Gollapudi B, Aardema MJ, Tanir JY, 2016. Standardized cell sources and recommendations for good cell culture practices in genotoxicity testing. Mutat Res 809, 1–15. [DOI] [PubMed] [Google Scholar]
- Lu J, Shang X, Zhong W, Xu Y, Shi R, Wang X, 2020. New insights of CYP1A in endogenous metabolism: a focus on single nucleotide polymorphisms and diseases. Acta Pharmaceutica Sinica B 10, 91–104. [DOI] [PMC free article] [PubMed] [Google Scholar]
- Luo Y, Shang P, Li D, 2017. Luteolin: A flavonoid that has multiple cardio-protective effects and its molecular mechanisms. Front Pharmacol 8, 692. [DOI] [PMC free article] [PubMed] [Google Scholar]
- Manzoor MF, Ahmad N, Ahmed Z, Siddique R, Zeng XA, Rahaman A, Muhammad Aadil R, Wahab A, 2019. Novel extraction techniques and pharmaceutical activities of luteolin and its derivatives. J Food Biochem 43, e12974. [DOI] [PubMed] [Google Scholar]
- Mei N, Guo X, Ren Z, Kobayashi D, Wada K, Guo L, 2017. Review of Ginkgo biloba-induced toxicity, from experimental studies to human case reports. J Environ Sci Health C Environ Carcinog Ecotoxicol Rev 35, 1–28. [DOI] [PMC free article] [PubMed] [Google Scholar]
- Middleton E Jr., Kandaswami C, Theoharides TC, 2000. The effects of plant flavonoids on mammalian cells: implications for inflammation, heart disease, and cancer. Pharmacol Rev 52, 673–751. [PubMed] [Google Scholar]
- Nabavi SF, Braidy N, Gortzi O, Sobarzo-Sanchez E, Daglia M, Skalicka-Wozniak K, Nabavi SM, 2015. Luteolin as an anti-inflammatory and neuroprotective agent: A brief review. Brain Res Bull 119, 1–11. [DOI] [PubMed] [Google Scholar]
- Nijhawan D, Fang M, Traer E, Zhong Q, Gao W, Du F, Wang X, 2003. Elimination of Mcl-1 is required for the initiation of apoptosis following ultraviolet irradiation. Genes & development 17, 1475–1486. [DOI] [PMC free article] [PubMed] [Google Scholar]
- NTP, 1992. Toxicology and Carcinogenesis Studies of Quercetin (CAS No. 117–39-5) in F344 Rats (Feed Studies). Natl Toxicol Program Tech Rep Ser 409, 1–171. [PubMed] [Google Scholar]
- OECD, 2016. In vitro mammalian cell gene mutation test usaing the thymidine kinase gene, OECD Guideline for Testing of Chemicals, No. 490. https://www.oecd-ilibrary.org/environment/test-no-490-in-vitro-mammalian-cell-gene-mutation-tests-using-the-thymidine-kinase-gene_9789264264908-en (Accessed 25 Feb 2021).
- Popp R, Schimmer O, 1991. Induction of sister-chromatid exchanges (SCE), polyploidy, and micronuclei by plant flavonoids in human lymphocyte cultures. A comparative study of 19 flavonoids. Mutat Res 246, 205–213. [DOI] [PubMed] [Google Scholar]
- Resende FA, Vilegas W, Dos Santos LC, Varanda EA, 2012. Mutagenicity of flavonoids assayed by bacterial reverse mutation (Ames) test. Molecules 17, 5255–5268. [DOI] [PMC free article] [PubMed] [Google Scholar]
- Rusak G, Piantanida I, Masic L, Kapuralin K, Durgo K, Kopjar N, 2010. Spectrophotometric analysis of flavonoid-DNA interactions and DNA damaging/protecting and cytotoxic potential of flavonoids in human peripheral blood lymphocytes. Chem Biol Interact 188, 181–189. [DOI] [PubMed] [Google Scholar]
- Sak K, 2014. Cytotoxicity of dietary flavonoids on different human cancer types. Pharmacogn Rev 8, 122–146. [DOI] [PMC free article] [PubMed] [Google Scholar]
- Sak K, Kasemaa K, Everaus H, 2016. Potentiation of luteolin cytotoxicity by flavonols fisetin and quercetin in human chronic lymphocytic leukemia cell lines. Food Funct 7, 3815–3824. [DOI] [PubMed] [Google Scholar]
- Seelinger G, Merfort I, Schempp CM, 2008. Anti-oxidant, anti-inflammatory and anti-allergic activities of luteolin. Planta Med 74, 1667–1677. [DOI] [PubMed] [Google Scholar]
- Silva ID, Rodrigues AS, Gaspar J, Maia R, Laires A, Rueff J, 1997. Involvement of rat cytochrome 1A1 in the biotransformation of kaempferol to quercetin: relevance to the genotoxicity of kaempferol. Mutagenesis 12, 383–390. [DOI] [PubMed] [Google Scholar]
- Snyder RD, Gillies PJ, 2002. Evaluation of the clastogenic, DNA intercalative, and topoisomerase II-interactive properties of bioflavonoids in Chinese hamster V79 cells. Environ Mol Mutagen 40, 266–276. [DOI] [PubMed] [Google Scholar]
- Spagnuolo C, Cerella C, Russo M, Chateauvieux S, Diederich M, Russo GL, 2011. Quercetin downregulates Mcl-1 by acting on mRNA stability and protein degradation. Br J Cancer 105, 221–230. [DOI] [PMC free article] [PubMed] [Google Scholar]
- Tuorkey MJ, 2016. Molecular targets of luteolin in cancer. European Journal of Cancer Prevention 25, 65. [DOI] [PMC free article] [PubMed] [Google Scholar]
- Vukelic I, Detel D, Baticic L, Potocnjak I, Domitrovic R, 2020. Luteolin ameliorates experimental colitis in mice through ERK-mediated suppression of inflammation, apoptosis and autophagy. Food Chem Toxicol 145, 111680. [DOI] [PubMed] [Google Scholar]
- Wang L, Chen Q, Zhu L, Li Q, Zeng X, Lu L, Hu M, Wang X, Liu Z, 2017. Metabolic disposition of luteolin is mediated by the interplay of UDP-glucuronosyltransferases and catechol-O-methyltransferases in rats. Drug Metab Dispos 45, 306–315. [DOI] [PMC free article] [PubMed] [Google Scholar]
- Wang L, Lee IM, Zhang SM, Blumberg JB, Buring JE, Sesso HD, 2009. Dietary intake of selected flavonols, flavones, and flavonoid-rich foods and risk of cancer in middle-aged and older women. Am J Clin Nutr 89, 905–912. [DOI] [PMC free article] [PubMed] [Google Scholar]
- Wilsher NE, Arroo RR, Matsoukas MT, Tsatsakis AM, Spandidos DA, Androutsopoulos VP, 2017. Cytochrome P450 CYP1 metabolism of hydroxylated flavones and flavonols: Selective bioactivation of luteolin in breast cancer cells. Food and Chemical Toxicology 110, 383–394. [DOI] [PubMed] [Google Scholar]
- Zhang Z, Chen S, Mei H, Xuan J, Guo X, Couch L, Dobrovolsky VN, Guo L, Mei N, 2015. Ginkgo biloba leaf extract induces DNA damage by inhibiting topoisomerase II activity in human hepatic cells. Sci Rep 5, 14633. [DOI] [PMC free article] [PubMed] [Google Scholar]