

Abstract
MAX phases are layered ternary carbides or nitrides that are attractive for catalysis applications due to their unusual set of properties. They show high thermal stability like ceramics, but they are also tough, ductile, and good conductors of heat and electricity like metals. Here, we study the potential of the Ti3AlC2 MAX phase as a support for molybdenum oxide for the reverse water–gas shift (RWGS) reaction, comparing this new catalyst to more traditional materials. The catalyst showed higher turnover frequency values than MoO3/TiO2 and MoO3/Al2O3 catalysts, due to the outstanding electronic properties of the Ti3AlC2 support. We observed a charge transfer effect from the electronically rich Ti3AlC2 MAX phase to the catalyst surface, which in turn enhances the reducibility of MoO3 species during reaction. The redox properties of the MoO3/Ti3AlC2 catalyst improve its RWGS intrinsic activity compared to TiO2- and Al2O3-based catalysts.
Keywords: CO2 hydrogenation, MAX phases, RWGS, syn gas, molybdenum
Short abstract
MAXimize your conversion! The hydrogenation of CO2via reverse water−gas shift can be catalyzed efficiently by molybdenum oxide supported on a MAX phase.
Introduction
There is a global interest on reducing anthropogenic CO2 emissions into the atmosphere.1,2 The main sources of CO2 are power generation and manufacturing, which emitted 12.4 and 3.9 Gt of CO2 in 2015.3,4 However, CO2 is a valuable C1 feedstock that should not be thrown away. After CO2 capture, either from the atmosphere or from industrial flue gases, it should be efficiently converted into high value-added products via catalytic processes.5−8
The reverse water–gas shift (RWGS) reaction (eq 1) using renewable hydrogen is a sustainable way for converting CO2.9 This reaction produces CO, a basic building block for a variety of valuable chemicals and fuels, such as methanol, paraffins, and olefins.10 However, RWGS is an equilibrium-limited reaction, favored at high temperatures (>700 °C) because it is endothermic.11 At lower temperatures, the exothermic CO methanation (eq 2) and Sabatier reaction (eq 3) also take place, consuming a substantial amount of H2 and producing undesired methane. Therefore, catalyst development is focused on improving the catalytic performance at <500 °C.12,13
| 1 |
| 2 |
| 3 |
Traditionally, RWGS catalysts are based on Cu, Pt, and Rh nanoparticles supported on metal oxides (Al2O3, TiO2, and CeO2, among others).9,14,15 Molybdenum is more abundant and cheaper than precious metals, increasing the potential for the large-scale industrial application of Mo-based catalysts. While previous work only focused on its promoting effect,16−20 we are interested in molybdenum oxide as an active phase itself due to its redox properties.21,22 The oxygen vacancies created when reducing MoO3 will affect the reaction performance, whether it takes place via the redox mechanism (where CO2 adsorbs and dissociates on the reduced sites previously created by H2) or via the associative pathway (where oxygen vacancies can stabilize adsorbed carbon-containing intermediates), see Figure 1.10,23,24
Figure 1.

Scheme of the formation of oxygen vacancies on MoO3 particles during RWGS, and its ability to dissociate CO2via the redox pathway and/or to stabilize carbon-containing species (indicated by R) via the associative pathway.
Another important factor is the choice of support. Although typically inert, supports can enhance the reaction performance by increasing the active sites’ dispersion, facilitating charge transfer, and modifying the morphology of the supported particles.25−27 More importantly, the support can prevent catalyst deactivation and boost the industrial application of high-temperature reactions.26 Here, we explored a new type of supports, MAX phases, and their application in catalysis. MAX phases (Mn+1AXn) are a group of layered ternary carbides or nitrides, where M is an early transition metal, A is an element mostly from groups 13 and 14, X is carbon or nitrogen, and n = 1, 2, or 3.28 MAX phases stand out by their unusual set of properties. They are stiff and high-temperature shock resistant like ceramics, but they are also tough, ductile, and good conductors of heat and electricity like metals.29−31 They are typically used in mechanical and thermal applications, such as high-temperature structural components and protective coatings.32−34 Their potential as catalysts has recently emerged, as we reported the activity and improved selectivity of the Ti3AlC2 MAX phase during butane oxidative dehydrogenation.35 We also showed that MAX phases are promising supports for CO2 conversion reactions.36 The thermal stability and acid–base properties of the Ti2AlC MAX phase increased the stability and coking resistance of a Co3O4/Ti2AlC catalyst during dry reforming of butane.36 Elsewhere, Trandafir et al. recently showed the potential of Pd/Ti3SiC2 as a chemoselective catalyst in the hydrogenation of functionalized nitro derivatives.37
Here, we use for the first time the Ti3AlC2 MAX phase as a support for molybdenum oxide RWGS catalysts. We study the properties and the RWGS activity of the MoO3/Ti3AlC2 catalyst and compare it to titania and alumina-based catalysts.
Experimental Section
Materials and Instrumentation
X-ray diffraction (XRD) patterns were recorded on a MiniFlex II X-ray diffractometer, described previously by Ronda-Lloret et al.(36) X-ray photoelectron spectroscopy (XPS) was performed using a K-α spectrometer from Thermo Scientific (Al–K radiation), with a source of electrons and ions for automated charge balancing. The binding energies were referenced to the C 1s line at 284.6 eV, with an accuracy of ±0.2 eV (a detailed description of the analysis procedure is published elsewhere36).
Thermogravimetric analysis (TGA) was carried out using an NETZSCH Jupiter STA 449F3 instrument, under air (20 mL·min–1, O2:N2 mixture) between 30 and 1000 °C.
Scanning transmission electron microscopy (STEM) spectra combined with high-angle annular dark field (HAADF) images were obtained using a double Cs aberration-corrected FEI Titan3 Themis 60–300 microscope (operated at 200 kV).
We performed X-ray absorption spectroscopy (XAS) using the SuperXAS beamline of the SLS Synchrotron at the PSI (Switzerland). We prepared the samples by mixing with cellulose and pressing into pellets of approximately one absorption length in thickness. We performed the measurements at the Mo K-edge (20,000 eV) in the QEXAFS mode using an oscillating monochromator and collected spectra with a fluorescence detector (sensor silicon drift detector) and with a transmission detector (ionization chambers) simultaneously. A spectrum was recorded every second and averaged over 1 min to improve the signal-to-noise ratio. We calibrated with respect to the edge position of a metal foil measured simultaneously and normalized spectra using Python-based graphical interface ProQEXAFS software.38 The edge position (E0) of each sample spectrum was set to the most intense peak of the first derivative (see Figure S7). Further processing of X-ray absorption near-edge spectroscopy (XANES) and extended X-ray absorption fine structure (EXAFS) was carried out using the Demeter software package (0.9.25, using Ifeffit 1.2.12).39 We used Athena for background subtraction of long-range oscillations and linear combination fitting (LCF) of supported catalyst spectra using α-MoO3 and MoO3-NP references. We then used Artemis to carry out EXAFS fitting using scattering paths generated from crystallographic α-MoO3 data (COD ID 1537654) which were summed to simulate the EXAFS spectrum.40 Fitting parameters are reported in Tables S3–S5, where Debye-Waller factors (Δσ2), path distances (R), and energy shift (ΔE0) were refined, but coordination numbers (N) were set according to the crystal structure. The amplitude reduction factor (S02) was determined by first fitting Mo0 foil data measured at the same time as the sample spectra. We carried out the fits in the ranges indicated in R in Tables S3–S5 and evaluated the quality of fit using an R-factor.
N2 adsorption–desorption analysis was performed in a Thermo Scientific Surfer instrument at 77 K. The samples were previously evacuated in vacuum at 200 °C for 16 h.
CO chemisorption analyses were performed with a Micromeritics Pulses Chemisorb 2705 apparatus. Before the analysis, the samples were pretreated under a helium gas flow of 80 mL·min–1 at 350 °C for 3 h and then reduced at 500 °C for 6 h under pure hydrogen. More details on the analysis procedure can be found in Ronda-Lloret et al.(36)
Procedure for Catalyst Synthesis
10 wt % molybdenum (in metal-basis) materials were prepared using the wet impregnation method. (NH4)6Mo7O24·4H2O (Sigma Aldrich) was used as a metal oxide precursor. Ti3AlC2, TiO2 (Hombikat M311), and γ-Al2O3 (CK-300, Ketjen) were used as supports. In a typical procedure, 0.40 g of (NH4)6Mo7O24·4H2O and 2 g of support were mixed in 20 mL of water and stirred at 65 °C for 24 h. The resulting solid was dried at 120 °C for 2 h and then calcined under air at 350 °C for 4 h (heating rate 4 °C·min–1). The Ti3AlC2 MAX phase was prepared by mixing the elemental powders purchased from STRTEM chemicals: Ti (325 mesh, 99.5%), Al (325 mesh, 99.5%), and graphite (325 mesh, 99.9%). The composition corresponding to Ti3Al1.1C2 was mixed in a 3D blender (40 rpm) in hexane for 8 h, using 5 mm zirconia balls. The resulting mixture was placed in an alumina crucible covered with an alumina lid and heated to 1450 °C for 2 h under an argon atmosphere (heating and cooling rate was 2 °C·min–1). The resulting powder was mechanically grinded in an agate mortar. The Mo2TiAlC2 MAX phase was prepared by mixing the elemental powders purchased from STRTEM chemicals: Ti (325 mesh, 99.5%), Mo (2–4 microns, 99.9%), Al (325 mesh, 99.5%), and graphite (325 mesh, 99.9%). The composition corresponding to Mo2Ti1.1AlC2 was mixed in a 3D blender (40 rpm) in hexane for 8 h, using 5 mm zirconia balls. The resulting mixture was placed in an alumina crucible covered with an alumina lid and heated to 1550 °C for 2 h under an argon atmosphere (heating and cooling rate was 2 °C·min–1). The resulting powder was mechanically ground in an agate mortar. A bulk MoO3 sample was obtained from the calcination of Mo2C using compressed air (50 mL·min–1) at 600 °C for 2 h (heating ramp 5 °C·min–1).
Procedure for Catalytic Testing
The catalysts were tested in the RWGS reaction in a vertical fixed bed reactor. A total of 200 mg of catalyst was placed on quartz wool in the middle of the reactor, which had 7 mm inner diameter. The samples were heated under N2 to 400 °C. The catalytic tests were then performed at atmospheric pressure and at a H2:CO2 ratio of 4:1. We performed temperature screening tests between 400 and 750 °C using 100 mL·min–1 total flow (30,000 mL·g–1·h–1) and stability tests for 48 h at 550 °C using 50 mL·min–1 total flow (15,000 mL·g–1·h–1). The reactants and products were analyzed using an online ABB AO2020 advanced optima process gas analyzer, equipped with thermal conductivity and infrared detectors.
The conversion and selectivity values were calculated using eqs 4 and 5
| 4 |
| 5 |
The number of active sites was calculated from CO chemisorption analysis (see the Experimental Section for details). Using the CO uptake values obtained from this analysis, we estimated the turnover frequency (TOF) values (eq 6).
| 6 |
The CO production rate was calculated using eq 7
| 7 |
Results and Discussion
Catalyst Synthesis
We compared the properties and activity in RWGS of MoO3-based catalysts, using the Ti3AlC2 MAX phase, γ-Al2O3, and TiO2 as supports. The catalysts, each containing 10 wt % on Mo metal basis, were prepared by wet impregnation, using ammonium molybdate tetrahydrate as a precursor. γ-Al2O3 and anatase TiO2 were purchased from commercial sources. Ti3AlC2 was prepared by mixing elemental powders of Ti, Al, and graphite, followed by heating at 1450 °C under argon. Samples of a molybdenum-containing MAX phase, Mo2TiAlC2, and bulk MoO3 were also tested as reference materials (see the Experimental Section for details).
Characterization of the Fresh Catalysts
The XRD pattern of the fresh MoO3/Ti3AlC2 catalyst shows the characteristic peaks of the Ti3AlC2 MAX phase structure (Figure 2), indicating that the bulk of the support remains stable after calcination. Anatase and rutile TiO2 peaks are also present at 2θ = 25.7 and 27.4°, indicating a slight oxidation of Ti3AlC2.41 The characteristic peaks of MoO3 are also visible at 2θ = 12.8 and 23.5°.42 The pattern of MoO3/TiO2 only shows broad peaks of anatase TiO2 at 2θ = 25.4, 38.2, 48.1, 54.8, 62.7, 70.0, 75.4, and 82.9°.41 Similarly, the pattern of MoO3/Al2O3 only shows the peaks of γ-Al2O3 at 2θ = 37.8, 45.8, 60.7, and 67.0° (Figure S1).43,44 The absence of MoO3 diffraction peaks indicates that molybdenum particles are small and well-dispersed over the oxide supports.
Figure 2.

XRD patterns of the MoO3/Ti3AlC2 catalyst and the Ti3AlC2 MAX phase used as a support.
We studied the surface composition of the fresh catalysts with XPS. The Ti 2p and Al 2p spectra of the MoO3/Ti3AlC2 catalyst only show the Ti–O and the Al–O bonds at 458.8 eV (Ti 2p3/2) and 74.3 eV (Al 2p3/2), respectively (Figure 3). The distinctive peaks of the Ti3AlC2 structure (Ti–C bond at 454 eV (Ti 2p3/2) and Al–Ti bond at 72 eV (Al 2p3/2)) are absent.35,45 This indicates that the Ti3AlC2 surface completely oxidizes to titania and alumina under our calcination conditions (i.e., under air at 350 °C for 4 h).46 The Ti–O and Al–O peaks of MoO3/Ti3AlC2 shift to lower binding energies compared to MoO3/TiO2 and MoO3/Al2O3. This indicates a charge transfer effect from the bulk MAX phase to the surface oxide layer, enriching the surface with electrons.47
Figure 3.

Ti 2p, Al 2p, and Mo 3d XPS spectra of MoO3/Ti3AlC2, MoO3/TiO2, and MoO3/Al2O3 catalysts.
The Mo 3d spectra of the catalysts (Figure 3) show two spectral lines, assigned to Mo 3d5/2 and Mo 3d3/2 spin–orbit components. The Mo 3d5/2 binding energy in MoO3/Ti3AlC2 and MoO3/TiO2 spectra is 232.8 eV, which corresponds to MoO3 species (Mo6+).48,49 The Mo 3d spectrum of the MoO3/Al2O3 catalyst shows two contributions at Mo 3d5/2 binding energies of 232.6 and 233.6 eV, corresponding to Mo5+ and Mo6+ species. In the O 1s spectrum, MoO3/Ti3AlC2 and MoO3/TiO2 also show similar Mo–O binding energies (ca. 530.4 eV, cf.Figure S2).50 This indicates that the surface of the Ti3AlC2 undergoes oxidation and Mo predominantly sits on the oxidized titanium, as expected by the excess of titanium in this compound (Ti/Al ratio is 3 to 1). The excess of titanium on the MAX phase surface is also confirmed by the ITi/IAl intensity ratio obtained from XPS (Table S1). Previous work showed that during oxidation below 700 °C, Ti3AlC2 predominantly converts to titania rather than to alumina.46 While the three catalysts have the same metal loading, the Mo and support intensity ratio (IMo/ITi or IMo/IAl) is the largest for the MAX phase-based catalyst (Table S1). This indicates that this catalyst has the largest Mo-containing particles on the surface.
HAADF–STEM imaging showed that MoO3 is predominantly dispersed in the form of rods when deposited on Ti3AlC2 (Figure 4, see also Figures S3 and S4 in the Supporting Information). Some rods are in contact with the support, while others are “free” (i.e., unsupported). These rods are 480 ± 138 nm long and 88 ± 11 nm wide. The large size of MoO3 particles when supported on Ti3AlC2 results from the low surface area of this support (ca. 1 m2/g). In agreement with XRD and XPS results, we see that the MoO3 particles are very small and highly dispersed when supported on TiO2 (average particle size: 0.42 nm, σ = 0.11 nm) and γ-Al2O3 (average particle size: 0.67 nm, σ = 0.19 nm, Figure S5). The MoO3/TiO2 and MoO3/Al2O3 catalysts are mesoporous, with a BET surface area of 208 m2·g–1 and 145 m2·g–1, respectively (Figure S6 and Table S2).
Figure 4.
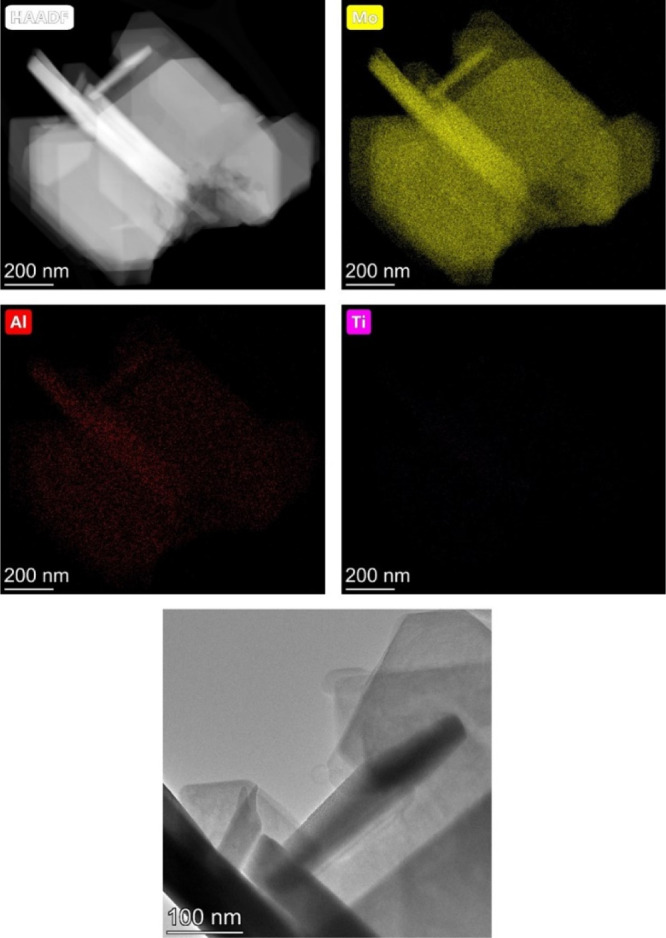
HAADF–STEM images of the MoO3/Ti3AlC2 catalyst.
We then studied the local structure of the molybdenum on each support using Mo K-edge XANES and EXAFS spectroscopy. We also measured MoO3 nanoparticles (MoO3-NPs) and bulk α-MoO3 references for comparison. In the XANES spectra (Figure 5a), all catalysts show the edge position at 20016.4 eV, characteristic of Mo6+ (1s → 5p, measured at the maximum of the second peak of the first derivative, see Figure S7), and a triple peak feature above the edge. The distinct pre-edge corresponds to the quadrupole 1s–4d transition, indicating a distorted octahedral environment.51 The triple peak feature above the edge in the XANES is slightly different for each catalyst. The MoO3/Ti3AlC2 spectrum is similar to that of bulk α-MoO3, whereas the features of the MoO3/Al2O3 spectrum are dampened similarly to that of MoO3-NPs. MoO3/TiO2 shows the largest discrepancy from the reference spectra, with a more intense central peak compared to the first and third features. These differences can be partially explained by differences in nanoparticle size and shape, which affect the ratio of surface sites to bulk sites, as well as by particle–support interactions.
Figure 5.
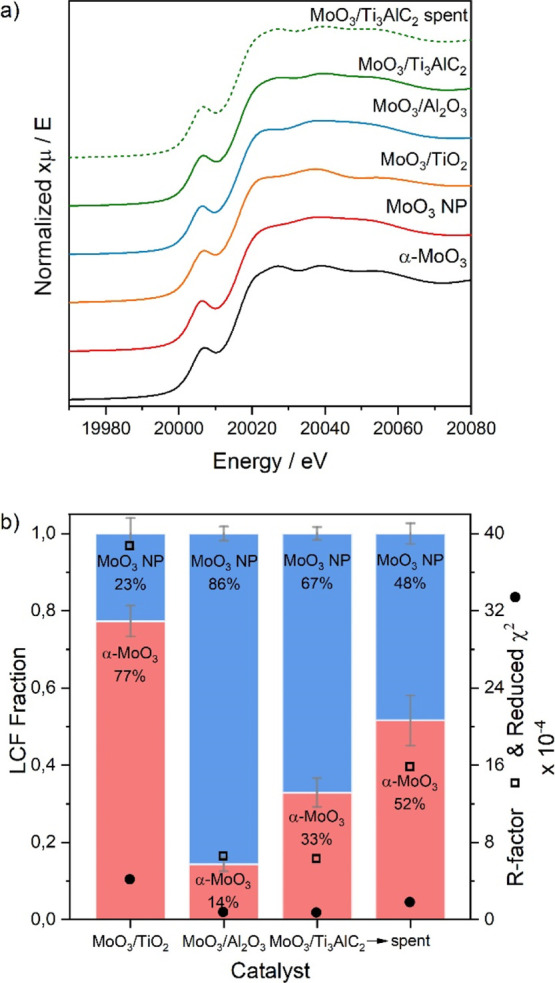
(a) Mo K-edge XANES spectra of the supported catalysts and reference structures. (b) Summary of the LCF analysis of the supported catalysts using reference spectra. The quality of the fit is indicated by the R-factor and reduced χ2 value.
We used the MoO3 nanoparticles and the bulk α-MoO3 samples as references for LCF (Figure 5b) to get an indication of the relative amounts of surface versus internal Mo sites in the studied catalysts. The absolute numbers obtained from the LCF cannot be directly related to the number of surface versus bulk sites, since (i) we only have two reference samples and (ii) the NP reference consists of a combination of surface and bulk atoms and the exact proportion of those is unknown. For this study, we are interested in the trends observed when using different supports; thus, we use the LCF analyses to infer the differences in particle sizes between samples. Moreover, the XAS measures all Mo atoms in the sample. This means that Mo atoms present in amorphous compounds and/or present as single site species, which are not detected with other techniques such as XRD and HAADF–STEM, are also taken into account in this analysis. We cannot correct for these contributions as we have no insights into the amount of Mo forming rods or other species (amorphous and/or single site species). Figure 5b shows that the MoO3/Al2O3 catalyst can be fitted to a mixture of bulk α-MoO3 and MoO3-NPs, suggesting that the average nanoparticle size in this catalyst is slightly larger than in the MoO3-NP reference. The contribution from bulk α-MoO3 increases in the MoO3/Ti3AlC2 catalyst, due to the presence of large rod-shaped MoO3 particles (as seen in STEM–HAADF). The shape of the XANES spectrum of the MoO3/TiO2 catalyst is slightly different to either reference spectra, resulting in a poorer fit (as indicated by the relatively high R-factor and χ2 value). This suggests that there is a contribution to the spectrum that is not accounted for by the nanoparticle or bulk α-MoO3 data.52 More details on the LCF results are given in Figure S8 and Table S3.
In the EXAFS spectra (Figure S9), we observe in more detail the structural differences between MoO3 nanoparticles and bulk α-MoO3. In k-space, the oscillations of the MoO3-NP spectrum are dampened compared to α-MoO3, especially at higher wavenumbers, as expected. This results in an R-space spectrum in which the amplitude of the second shell is suppressed. The shape of the first shell in the MoO3-NP spectrum is also affected, with just one main peak compared to the complex first shell of α-MoO3. The EXAFS spectrum of MoO3/Al2O3 is very similar to the MoO3 nanoparticle reference. The spectrum of MoO3/Ti3AlC2 is more similar to the bulk α-MoO3 reference, indicating that MoO3 has bulk-like properties, interacting only weakly with the support. The MoO3/TiO2 spectrum exhibits dampened oscillations compared to the other spectra. This could result from destructive interference by an additional, non-MoO3, contribution to the spectrum or a different coordination geometry in this catalyst. From the EXAFS fitting (Figure S10), we can see that the supported catalysts can be fitted in the same way as α-MoO3, using three doubly degenerate O paths at three different distances from Mo (Tables S4–S6). This suggests that the {MoO6} octahedra are distorted in the supported MoO3 catalysts.53 The MoO3/TiO2 spectrum was fitted with an additional Ti path at 2.76 Å, giving rise to the destructive interference that dampens the EXAFS oscillations and indicating that there is a close metal–support interaction. More details on the EXAFS fitting are reported in the Supporting Information
Catalytic Tests
We then tested the catalysts in the RWGS reaction. A total of 200 mg of catalyst was placed in a vertical fixed bed reactor. As high H2:CO2 ratios improve CO2 conversion,54,55 we set the H2:CO2 ratio to 4:1. We ran temperature-screening tests between 400–750 °C (100 mL·min–1 total flow) and long-term stability tests at 550 °C for 48 h (50 mL·min–1 total flow).
Control experiments showed that Ti3AlC2 alone is active only above 700 °C, converting between 10–18% of CO2 (Figure S11). A Mo2TiAlC2 MAX phase, which contains molybdenum in the layered MAX phase structure,56 showed no activity within the entire temperature range. This confirms that a metal or metal oxide available on the surface as active sites are required to improve CO2 activation in RWGS. The prereduction of a MoO3/Al2O3 catalyst at 750 °C did not improve CO2 conversion and CO selectivity compared to the unreduced catalyst (Figure S12). Therefore, we focused on the catalytic tests of the pristine catalysts after calcination, without prereduction. This is an interesting advantage of our MAX phase-supported catalyst, as avoiding the preactivation step results in significant process savings in a real industrial application.
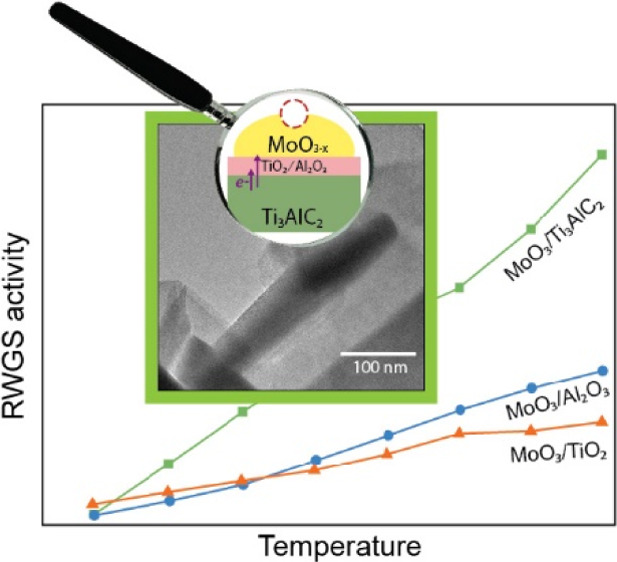
The temperature-screening tests show that the MoO3/Ti3AlC2 catalyst is already active at 450 °C, reaching 50% conversion at 750 °C (Figure S13). Despite the low surface area and large particle size of this catalyst, its conversion is similar to MoO3/Al2O3 and MoO3/TiO2. All catalysts were highly selective to CO above 550 °C. Since the three catalysts show a similar conversion and selectivity, their CO production rate values are also similar (Table S7). Due to its low surface area, the Ti3AlC2-based catalyst has fewer available active sites compared to the other catalysts, as quantified by CO chemisorption (Table S8). Thus, we compared the catalyst in terms of their intrinsic activity, using their TOF (Figure 6a). MoO3/Ti3AlC2 shows higher TOF values from 450 °C onward, indicating that it is intrinsically more active than MoO3/Al2O3 and MoO3/TiO2.
Figure 6.

TOF values of the catalysts during (a) temperature-screening tests (reaction conditions: 200 mg catalyst, H2:CO2 ratio = 4:1, 100 mL·min–1 total flow, WHSV = 30,000 mL·g–1·h–1) and (b) stability tests (reaction conditions: 550 °C, 200 mg catalyst, H2:CO2 ratio = 4:1, 50 mL·min–1 total flow, WHSV = 15,000 mL·g–1·h–1).
We also studied the long-term stability of the catalysts at a WHSV of 15,000 mL·g–1·h–1, which is a relatively high space velocity that would result in a compact RWGS reactor, potentially reducing the capital costs of a continuous CO2 conversion unit. In addition, the MoO3/Ti3AlC2 catalyst shows higher CO2 conversion with considerable CO selectivity at lower space velocity (Figure S14). To be far from equilibrium conditions and study the potential of the MAX phase catalyst in low-temperature RWGS, we performed the stability tests at 550 °C. The MoO3/Ti3AlC2 catalyst is stable over time and it converts 20% CO2 (Figure S15). MoO3/TiO2 and MoO3/Al2O3 catalysts give 20–25% and 30% CO2 conversion, respectively. The increase in conversion at the start of the reaction might be related to the reduction of the MoO3 species upon exposure to the hydrogen-rich reaction mixture (4H2:1CO2). Under these conditions, MoO3/Ti3AlC2 showed a lower CO production rate (0.01 mol CO produced·gcatalyst–1·min–1) than MoO3/TiO2 and MoO3/Al2O3 catalysts (0.02 mol CO produced·gcatalyst–1·min–1), see Table S9. When comparing their intrinsic activity by means of TOF (Figure 6b), MoO3/Ti3AlC2 stands out as the most active catalyst. It converts 18 mol CO2·site–1·min–1, while MoO3/Al2O3 and MoO3/TiO2 convert 10 and 7 mol CO2·site–1·min–1, respectively. Control experiments showed that a bulk MoO3 sample is significantly less active than MoO3/Ti3AlC2 (Figure S16). This indicates that the activity of the Mo sites is enhanced in the MoO3/Ti3AlC2 catalyst due to metal–support interactions and/or the exposure of a particular set of planes when MoO3 grows as rods.57,58
In the stability tests, CO selectivity followed the order MoO3/TiO2 (70–100%) > MoO3/Al2O3 (60–80%) > MoO3/Ti3AlC2 (60–65%), indicating the formation of side products (Figure S15). Methane was not detected. TGA analysis (Figure S17) of the spent catalysts shows the absence of carbon deposits, indicating the inhibition of coking reactions. We hypothesize that alcohols are produced as side products, as previous work reported the formation of alcohols from CO hydrogenation and CH4 oxidation reactions when using MoO3-based catalysts under similar conditions.59−62 In addition, the CO selectivity profiles oscillate with time (Figure S15). We hypothesize that this is due to changes in the molybdenum oxidation state during reaction. Depending on the balance of reduced/oxidized states, CO hydrogenation to alcohols can also occur, thus decreasing CO selectivity. The decrease in CO concentration in the reaction mixture might shift the equilibrium toward CO2 consumption, giving higher CO2 conversion with lower CO selectivity. To understand the working of the catalysts better, we also characterized them after the reaction. The XRD patterns of the spent catalysts show that the Ti3AlC2 MAX phase is stable under reaction conditions (Figure S1). As expected, the Al2O3 and TiO2 supports were also stable (Figure S1).
In the LCF analysis of the MoO3/Ti3AlC2 sample XANES spectrum (Figure 5), the percentage of bulk α-MoO3 increases after stability testing. The EXAFS spectrum of the spent sample is also more similar to bulk α-MoO3 compared to the fresh sample (Figure S9). This reflects a change in the molybdenum oxide particle morphology that increases the volume-to-surface ratio. HAADF–STEM images of the spent catalyst confirm that the size and morphology of MoO3 particles change during the reaction, from large rods to agglomerates (Figures S17 and S18). These agglomerates are smaller than the rods, but their varied shape does not allow us to calculate the particle size. The nanoparticle sizes on MoO3/TiO2 (average particle size: 0.51 nm, σ = 0.18 nm) and MoO3/Al2O3 (average particle size: 0.70 nm, σ = 0.15 nm) catalysts do not significantly change during the reaction compared to the fresh samples (Figure S19).
The Mo 3d XPS spectra of the spent catalysts show the reduction of MoO3 species during the reaction (Figure 7). Interestingly, MoO3/Ti3AlC2 shows MoO2 (Mo4+), Mo4O11 (Mo5+), and MoO3 (Mo6+) species on the surface, while the other two catalysts only contain Mo4O11 and MoO3.48,63 The percentage of reduced species is significantly higher on the MoO3/Ti3AlC2 catalyst surface (Table 1), indicating that this catalyst is reduced more during the reaction. The higher activation percentage observed with MoO3/Ti3AlC2 during the stability test (around 8%, Figure S15) can be related to its higher reduction degree under reaction conditions. These results indicate that a more reduced MoO3 surface leads to the formation of more oxygen vacancies, which in turn increases the RWGS activity.
Figure 7.
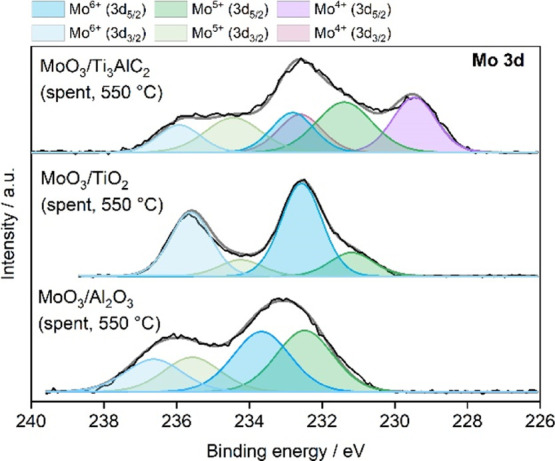
Mo 3d XPS spectra of the catalysts after the stability test at 550 °C.
Table 1. Atomic Percentage of MoO2 (Mo4+), Mo4O11 (Mo5+), and MoO3 (Mo6+) Species on the Spent Catalyst Surface, based on Mo 3d XPS.
| catalyst | atomic percentage on the surface (%) |
||
|---|---|---|---|
| Mo6+ | Mo5+ | Mo4+ | |
| MoO3/Ti3AlC2 (spent) | 24 | 41 | 35 |
| MoO3/Al2O3 (spent) | 50 | 50 | 0 |
| MoO3/TiO2 (spent) | 80 | 20 | 0 |
Typically, RWGS results in catalyst reduction, especially in hydrogen-rich mixtures.64 Hydrogen can remove active oxygen sites from MoO3, creating water and leaving surface oxygen vacancies. The CO2 can regenerate the oxygen vacancies by dissociating on the surface to CO and O.65 The ability of the catalyst to enhance this redox cycle determines its activity. In this study, MoO3 nanoparticles in close interaction with the support lead to poor redox properties, as seen with the MoO3/TiO2 and MoO3/Al2O3 catalysts. The low surface area of the Ti3AlC2 MAX phase leads to large bulk-like MoO3 rods. Nevertheless, MoO3/Ti3AlC2 is the most intrinsically active catalyst in terms of TOF (Figure 5). We attribute this to the electronically rich Ti3AlC2, which transfers the charge to the active site. This charge transfer effect enhances the redox properties of MoO3, facilitating the formation of surface oxygen vacancies that participate in the reaction (see Figure 8).66 In addition, electronically richer molybdenum sites are ideal for CO2 activation, as the charge transfer from Mo to CO2 antibonding orbitals can weaken the C–O bond, facilitating its reduction to CO.67
Figure 8.

Cartoon showing the composition of the MoO3/Ti3AlC2 catalyst under reaction conditions and the proposed RWGS reaction pathway.
Conclusions
In this work, we show for the first time the potential of MAX phase-based catalysts for application in CO2 conversion via the RWGS reaction. When supporting molybdenum oxide on the Ti3AlC2 MAX phase, the low surface area of the MAX phase leads to the formation of large MoO3 rods with bulk-like properties. Nevertheless, the presence of electronically rich Ti3AlC2 enhances the redox properties of MoO3 under RWGS conditions, resulting in a highly reduced surface that contains a large amount of oxygen vacancies. The MoO3/TiO2 and MoO3/Al2O3 catalysts contain small and highly dispersed MoO3 nanoparticles, but their close contact with the support inhibits the formation of oxygen vacancies during the reaction. As MoO3/Ti3AlC2 forms more oxygen vacancies under reaction, this catalyst showed the highest intrinsic activity in terms of TOF during the catalytic experiments. The electronically richer Mo sites when supported on MAX phases are ideal activation sites for CO2via electron transfer to CO2 antibonding orbitals. Such an interaction weakens the C–O bond and favors its reduction to CO. All catalysts are selective to CO, inhibiting the formation of undesired methane and coke. However, unidentified side products, most likely alcohols, also form. This study, which brings more insights into the workings of MAX phase catalysts on CO2 conversion reactions, shows the high potential of MAX phases as catalyst supports.
Acknowledgments
We thank the Netherlands Organisation for Scientific Research (NWO) for the grant “Developing novel catalytic materials for converting CO2, methane and ethane to high-value chemicals in a hybrid plasma-catalytic reactor” (China.15.119). We also acknowledge financial support by MINECO (Spain) through projects MAT2017-86992-R and MAT2016-80285-P. Z.S. was supported by the project LTAUSA19034, from the Ministry of Education Youth and Sports (MEYS). M.H. and M.T. gratefully acknowledge NWO under LIFT, Launchpad for Innovative Future Technology, PreCiOuS, 731.015.407. We also thank the staff of the Swiss Light Source (SLS) synchrotron (SuperXAS beamline and proposal number 20190956), Maarten Nachtegaal and Adam Clark, for support during synchrotron measurements.
Supporting Information Available
The Supporting Information is available free of charge at https://pubs.acs.org/doi/10.1021/acssuschemeng.0c07881.
Characterization of the fresh and spent catalysts (XRD patterns, XPS, temperature-programmed reduction profiles, nitrogen adsorption–desorption isotherms, CO chemisorption, TGA, and HAADF–STEM images); detailed analysis of XANES and EXAFS spectra; CO2 conversion and CO selectivity values of control samples (Ti3AlC2, Mo2TiAlC2, reduced MoO3/Al2O3, and bulk MoO3) and studied catalysts (10 wt % MoO3/Ti3AlC2, MoO3/TiO2, and MoO3/Al2O3), and CO formation rates of the studied catalysts (PDF).
The authors declare no competing financial interest.
Supplementary Material
References
- Hartmann D. L.Anthropogenic Climate Change. Global Physical Climatology, 2nd ed.; Elsevier Inc., 2016; pp 397–425. [Google Scholar]
- Vallero D. A.Air Pollution Biogeochemistry. Air Pollution Calculations; Elsevier Inc., 2019; pp 175–206. [Google Scholar]
- Shell International B. V . Shell Scenarios. The Numbers behind Sky. 2018, https://www.shell.com/energy-and-innovation/the-energy-future/scenarios/shell-scenario-sky.html (accessed August 2020).
- Lüthi D.; Le Floch M.; Bereiter B.; Blunier T.; Barnola J.-M.; Siegenthaler U.; Raynaud D.; Jouzel J.; Fischer H.; Kawamura K.; Stocker T. F. High-Resolution Carbon Dioxide Concentration Record 650,000-800,000 Years before Present. Nature 2008, 453, 379–382. 10.1038/nature06949. [DOI] [PubMed] [Google Scholar]
- Sanz-Pérez E. S.; Murdock C. R.; Didas S. A.; Jones C. W. Direct Capture of CO2 from Ambient Air. Chem. Rev. 2016, 116, 11840–11876. 10.1021/acs.chemrev.6b00173. [DOI] [PubMed] [Google Scholar]
- Kothandaraman A.; Nord L.; Bolland O.; Herzog H. J.; McRae G. J. Comparison of Solvents for Post-Combustion Capture of CO2 by Chemical Absorption. Energy Procedia 2009, 1, 1373–1380. 10.1016/j.egypro.2009.01.180. [DOI] [Google Scholar]
- Gnanakumar E. S.; Chandran N.; Kozhevnikov I. V.; Grau-Atienza A.; Ramos Fernández E. V.; Sepulveda-Escribano A.; Shiju N. R. Highly Efficient Nickel-Niobia Composite Catalysts for Hydrogenation of CO2 to Methane. Chem. Eng. Sci. 2019, 194, 2–9. 10.1016/j.ces.2018.08.038. [DOI] [Google Scholar]
- Ronda-lloret M.; Wang Y.; Oulego P.; Rothenberg G.; Tu X.; Shiju N. R. CO2 Hydrogenation at Atmospheric Pressure and Low Temperature Using Plasma-Enhanced Catalysis over Supported Cobalt Oxide Catalysts. ACS Sustainable Chem. Eng. 2020, 8, 17397–17407. 10.1021/acssuschemeng.0c05565. [DOI] [PMC free article] [PubMed] [Google Scholar]
- Daza Y. A.; Kuhn J. N. CO2 Conversion by Reverse Water Gas Shift Catalysis: Comparison of Catalysts, Mechanisms and Their Consequences for CO2 Conversion to Liquid Fuels. RSC Adv. 2016, 6, 49675–49691. 10.1039/c6ra05414e. [DOI] [Google Scholar]
- Ronda-Lloret M.; Rothenberg G.; Shiju N. R. A Critical Look at Direct Catalytic Hydrogenation of Carbon Dioxide to Olefins. ChemSusChem 2019, 12, 3896–3914. 10.1002/cssc.201900915. [DOI] [PubMed] [Google Scholar]
- Wang W.; Wang S.; Ma X.; Gong J. Recent Advances in Catalytic Hydrogenation of Carbon Dioxide. Chem. Soc. Rev. 2011, 40, 3703–3727. 10.1039/c1cs15008a. [DOI] [PubMed] [Google Scholar]
- Wei J.; Ge Q.; Yao R.; Wen Z.; Fang C.; Guo L.; Xu H.; Sun J. Directly Converting CO2 into a Gasoline Fuel. Nat. Commun. 2017, 8, 15174. 10.1038/ncomms15174. [DOI] [PMC free article] [PubMed] [Google Scholar]
- Yang L.; Pastor-Pérez L.; Gu S.; Sepúlveda-Escribano A.; Reina T. R. Highly Efficient Ni/CeO2-Al2O3 Catalysts for CO2 Upgrading via Reverse Water-Gas Shift: Effect of Selected Transition Metal Promoters. Appl. Catal., B 2018, 232, 464–471. 10.1016/j.apcatb.2018.03.091. [DOI] [Google Scholar]
- Su X.; Yang X.; Zhao B.; Huang Y. Designing of Highly Selective and High-Temperature Endurable RWGS Heterogeneous Catalysts: Recent Advances and the Future Directions. J. Energy Chem. 2017, 26, 854–867. 10.1016/j.jechem.2017.07.006. [DOI] [Google Scholar]
- Ronda-Lloret M.; Rico-Francés S.; Sepúlveda-Escribano A.; Ramos-Fernandez E. V. CuOx/CeO2 Catalyst Derived from Metal Organic Framework for Reverse Water-Gas Shift Reaction. Appl. Catal., A 2018, 562, 28–36. 10.1016/j.apcata.2018.05.024. [DOI] [Google Scholar]
- Gharibi Kharaji A.; Shariati A. Performance Comparison of Two Newly Developed Bimetallic (X-Mo/Al2O3, X=Fe or Co) Catalysts for Reverse Water Gas Shift Reaction. China Pet. Process. Petrochem. Technol. 2016, 18, 51–58. [Google Scholar]
- Kharaji A. G.; Shariati A.; Takassi M. A. A Novel γ-Alumina Supported Fe-Mo Bimetallic Catalyst for Reverse Water Gas Shift Reaction. Chin. J. Chem. Eng. 2013, 21, 1007–1014. 10.1016/S1004-9541(13)60573-X. [DOI] [Google Scholar]
- Kharaji A. G.; Shariati A.; Ostadi M. Development of Ni-Mo/Al2O3 Catalyst for Reverse Water Gas Shift (RWGS) Reaction. J. Nanosci. Nanotechnol. 2014, 14, 6841–6847. 10.1166/jnn.2014.8962. [DOI] [PubMed] [Google Scholar]
- Carrasquillo-Flores R.; Ro I.; Kumbhalkar M. D.; Burt S.; Carrero C. A.; Alba-Rubio A. C.; Miller J. T.; Hermans I.; Huber G. W.; Dumesic J. A. Reverse Water-Gas Shift on Interfacial Sites Formed by Deposition of Oxidized Molybdenum Moieties onto Gold Nanoparticles. J. Am. Chem. Soc. 2015, 137, 10317–10325. 10.1021/jacs.5b05945. [DOI] [PubMed] [Google Scholar]
- Ro I.; Sener C.; Stadelman T. M.; Ball M. R.; Venegas J. M.; Burt S. P.; Hermans I.; Dumesic J. A.; Huber G. W. Measurement of Intrinsic Catalytic Activity of Pt Monometallic and Pt-MoOx Interfacial Sites over Visible Light Enhanced PtMoOx/SiO2 Catalyst in Reverse Water Gas Shift Reaction. J. Catal. 2016, 344, 784–794. 10.1016/j.jcat.2016.08.011. [DOI] [Google Scholar]
- Akande S. O.; Chroneos A.; Vasilopoulou M.; Kennou S.; Schwingenschlögl U. Vacancy Formation in MoO3: Hybrid Density Functional Theory and Photoemission Experiments. J. Mater. Chem. C 2016, 4, 9526–9531. 10.1039/c6tc02571d. [DOI] [Google Scholar]
- Borgschulte A.; Sambalova O.; Delmelle R.; Jenatsch S.; Hany R.; Nüesch F. Hydrogen Reduction of Molybdenum Oxide at Room Temperature. Sci. Rep. 2017, 7, 40761. 10.1038/srep40761. [DOI] [PMC free article] [PubMed] [Google Scholar]
- Wang L. C.; Widmann D.; Behm R. J. Reactive Removal of Surface Oxygen by H2, CO and CO/H2 on a Au/CeO2 Catalyst and Its Relevance to the Preferential CO Oxidation (PROX) and Reverse Water Gas Shift (RWGS) Reaction. Catal. Sci. Technol. 2015, 5, 925–941. 10.1039/c4cy01030b. [DOI] [Google Scholar]
- Chen Y.; Wang H.; Burch R.; Hardacre C.; Hu P. New Insight into Mechanisms in Water-Gas-Shift Reaction on Au/CeO2 (111): A Density Functional Theory and Kinetic Study. Faraday Discuss. 2011, 152, 121–133. 10.1039/c1fd00019e. [DOI] [PubMed] [Google Scholar]
- Deelen T. W.; Mejía C. H.; Jong K. P. Control of Metal-Support Interactions in Heterogeneous Catalysts to Enhance Activity and Selectivity. Nat. Catal. 2019, 2, 955–970. 10.1038/s41929-019-0364-x. [DOI] [Google Scholar]
- Beckers J.; Rothenberg G. Redox Properties of Doped and Supported Copper-Ceria Catalysts. Dalton Trans. 2008, 46, 6573–6578. 10.1039/b809769k. [DOI] [PubMed] [Google Scholar]
- Slot T. K.; Yue F.; Xu H.; Ramos-Fernandez E. V.; Sepúlveda-Escribano A.; Sofer Z.; Rothenberg G.; Shiju N. R. Surface Oxidation of Ti3C2Tx Enhances the Catalytic Activity of Supported Platinum Nanoparticles in Ammonia Borane Hydrolysis. 2D Mater. 2020, 8, 015001. 10.1088/2053-1583/ababef. [DOI] [Google Scholar]
- Barsoum M.; El-Raghy T. The MAX Phases: Unique New Carbide and Nitride Materials. Am. Sci. 2001, 89, 334–343. 10.1511/2001.28.736. [DOI] [Google Scholar]
- Boatemaa L.; Bosch M.; Farle A. S.; Bei G. P.; Zwaag S.; Sloof W. G. Autonomous High-Temperature Healing of Surface Cracks in Al2O3 Containing Ti2AlC Particles. J. Am. Ceram. Soc. 2018, 101, 5684–5693. 10.1111/jace.15793. [DOI] [Google Scholar]
- Barsoum M. W.Physical Properties of the MAX Phases. Encyclopedia of Materials: Science and Technology, 2nd ed.; Elsevier Ltd, 2006; pp 1–11. [Google Scholar]
- Medkour Y.; Roumili A.; Maouche D.; Louail L.. Electrical Properties of MAX Phases. Advances in Science and Technology of Mn+1AXn Phases; Woodhead Publishing Limited, 2012; pp 159–175. [Google Scholar]
- Wang X. H.; Zhou Y. C. Oxidation Behavior of Ti3AlC2 at 1000-1400 °C in Air. Corros. Sci. 2003, 45, 891–907. 10.1016/S0010-938X(02)00177-4. [DOI] [Google Scholar]
- Sloof W. G.; Pei R.; McDonald S. A.; Fife J. L.; Shen L.; Boatemaa L.; Farle A.-S.; Yan K.; Zhang X.; Van Der Zwaag S.; Lee P. D.; Withers P. J. Repeated Crack Healing in MAX-Phase Ceramics Revealed by 4D in Situ Synchrotron X-Ray Tomographic Microscopy. Sci. Rep. 2016, 6, 23040. 10.1038/srep23040. [DOI] [PMC free article] [PubMed] [Google Scholar]
- Eklund P.; Beckers M.; Jansson U.; Högberg H.; Hultman L. The MN+1AXn Phases: Materials Science and Thin-Film Processing. Thin Solid Films 2010, 518, 1851–1878. 10.1016/j.tsf.2009.07.184. [DOI] [Google Scholar]
- Ng W. H. K.; Gnanakumar E. S.; Batyrev E.; Sharma S. K.; Pujari P. K.; Greer H. F.; Zhou W.; Sakidja R.; Rothenberg G.; Barsoum M. W.; Shiju N. R. The Ti3AlC2 MAX Phase as an Efficient Catalyst for Oxidative Dehydrogenation of n-Butane. Angew. Chem., Int. Ed. 2018, 57, 1485–1490. 10.1002/anie.201702196. [DOI] [PMC free article] [PubMed] [Google Scholar]
- Ronda-Lloret M.; Marakatti V. S.; Sloof W. G.; Delgado J. J.; Sepúlveda-Escribano A.; Ramos-Fernandez E. V.; Rothenberg G.; Shiju N. R. Butane Dry Reforming Catalyzed by Cobalt Oxide Supported on Ti2AlC MAX Phase. ChemSusChem 2020, 13, 6401–6408. 10.1002/cssc.202001633. [DOI] [PMC free article] [PubMed] [Google Scholar]
- Trandafir M. M.; Neaţu F.; Chirica I. M.; Neaţu Ş.; Kuncser A. C.; Cucolea E. I.; Natu V.; Barsoum M. W.; Florea M. Highly Efficient Ultralow Pd Loading Supported on MAX Phases for Chemoselective Hydrogenation. ACS Catal. 2020, 10, 5899–5908. 10.1021/acscatal.0c00082. [DOI] [Google Scholar]
- Clark A. H.; Imbao J.; Frahm R.; Nachtegaal M. ProQEXAFS: A Highly Optimized Parallelized Rapid Processing Software for QEXAFS Data. J. Synchrotron Radiat. 2020, 27, 551–557. 10.1107/S1600577519017053. [DOI] [PMC free article] [PubMed] [Google Scholar]
- Ravel B.; Newville M. ATHENA, ARTEMIS, HEPHAESTUS: Data Analysis for X-Ray Absorption Spectroscopy Using IFEFFIT. J. Synchrotron Radiat. 2005, 12, 537–541. 10.1107/S0909049505012719. [DOI] [PubMed] [Google Scholar]
- Andersson G.; Magnéli A.; Sillén L. G.; Rottenberg M. On the Crystal Structure of Molybdenum Trioxide. Acta Chem. Scand. 1950, 4, 793–797. 10.3891/acta.chem.scand.04-0793. [DOI] [Google Scholar]
- Liu X.; Khan M.; Liu W.; Xiang W.; Guan M.; Jiang P.; Cao W. Synthesis of Nanocrystalline Ga-TiO2 Powders by Mild Hydrothermal Method and Their Visible Light Photoactivity. Ceram. Int. 2015, 41, 3075–3080. 10.1016/j.ceramint.2014.10.151. [DOI] [Google Scholar]
- Inzani K.; Nematollahi M.; Vullum-Bruer F.; Grande T.; Reenaas T. W.; Selbach S. M. Electronic Properties of Reduced Molybdenum Oxides. Phys. Chem. Chem. Phys. 2017, 19, 9232–9245. 10.1039/c7cp00644f. [DOI] [PubMed] [Google Scholar]
- Papageridis K. N.; Siakavelas G.; Charisiou N. D.; Avraam D. G.; Tzounis L.; Kousi K.; Goula M. A. Comparative Study of Ni, Co, Cu Supported on γ-Alumina Catalysts for Hydrogen Production via the Glycerol Steam Reforming Reaction. Fuel Process. Technol. 2016, 152, 156–175. 10.1016/j.fuproc.2016.06.024. [DOI] [Google Scholar]
- Jongsomjit B.; Panpranot J.; Goodwin J. G. Co-Support Compound Formation in Alumina-Supported Cobalt Catalysts. J. Catal. 2001, 204, 98–109. 10.1006/jcat.2001.3387. [DOI] [Google Scholar]
- Chen K.; Qiu N.; Deng Q.; Kang M.-H.; Yang H.; Baek J.-U.; Koh Y.-H.; Du S.; Huang Q.; Kim H.-E. Cytocompatibility of Ti3AlC2, Ti3SiC2, and Ti2AlN: In Vitro Tests and First-Principles Calculations. ACS Biomater. Sci. Eng. 2017, 3, 2293–2301. 10.1021/acsbiomaterials.7b00432. [DOI] [PubMed] [Google Scholar]
- Wang X. H.; Zhou Y. C. Oxidation Behavior of Ti3AlC2 Powders in Flowing Air. J. Mater. Chem. 2002, 12, 2781–2785. 10.1039/b203644d. [DOI] [Google Scholar]
- White R. T.; Thibau E. S.; Lu Z.-H. Interface Structure of MoO3 on Organic Semiconductors. Sci. Rep. 2016, 6, 21109. 10.1038/srep21109. [DOI] [PMC free article] [PubMed] [Google Scholar]
- Xiang D.; Han C.; Zhang J.; Chen W. Gap States Assisted MoO3 Nanobelt Photodetector with Wide Spectrum Response. Sci. Rep. 2015, 4, 4891. 10.1038/srep04891. [DOI] [PMC free article] [PubMed] [Google Scholar]
- Xie F.; Choy W. C. H.; Wang C.; Li X.; Zhang S.; Hou J. Low-Temperature Solution-Processed Hydrogen Molybdenum and Vanadium Bronzes for an Efficient Hole-Transport Layer in Organic Electronics. Adv. Mater. 2013, 25, 2051–2055. 10.1002/adma.201204425. [DOI] [PubMed] [Google Scholar]
- Zhao X.; Jia W.; Wu X.; Lv Y.; Qiu J.; Guo J.; Wang X.; Jia D.; Yan J.; Wu D. Ultrafine MoO3 Anchored in Coal-Based Carbon Nanofiber as Anode for Advanced Lithium-Ion Batteries. Carbon 2020, 156, 445–452. 10.1016/j.carbon.2019.09.065. [DOI] [Google Scholar]
- Leliveld R. G.; Van Dillen A. J.; Geus J. W.; Koningsberger D. C. A Mo-K Edge XAFS Study of the Metal Sulfide-Support Interaction in (Co)Mo Supported Alumina and Titania Catalysts. J. Catal. 1997, 165, 184–196. 10.1006/jcat.1997.1480. [DOI] [Google Scholar]
- Wang J.; Boelens H. F. M.; Thathagar M. B.; Rothenberg G. In Situ Spectroscopic Analysis of Nanocluster Formation. ChemPhysChem 2004, 5, 93–98. 10.1002/cphc.200300859. [DOI] [PubMed] [Google Scholar]
- Caro C.; Thirunavukkarasu K.; Anilkumar M.; Shiju N. R.; Rothenberg G. Selective Autooxidation of Ethanol over Titania-Supported Molybdenum Oxide Catalysts: Structure and Reactivity. Adv. Synth. Catal. 2012, 354, 1327–1336. 10.1002/adsc.201000841. [DOI] [PMC free article] [PubMed] [Google Scholar]
- Whitlow J. E.; Parrish C. E. Operation, Modeling and Analysis of the Reverse Water Gas Shift Process. AIP Conf. Proc. 2003, 654, 1116–1123. 10.1063/1.1541409. [DOI] [Google Scholar]
- Zhang Q.; Pastor-Pérez L.; Jin W.; Gu S.; Reina T. R. Understanding the Promoter Effect of Cu and Cs over Highly Effective Β-Mo2C Catalysts for the Reverse Water-Gas Shift Reaction. Appl. Catal., B 2019, 244, 889–898. 10.1016/j.apcatb.2018.12.023. [DOI] [Google Scholar]
- Anasori B.; Dahlqvist M.; Halim J.; Moon E. J.; Lu J.; Hosler B. C.; Caspi E. a. N.; May S. J.; Hultman L.; Eklund P.; Rosén J.; Barsoum M. W. Experimental and Theoretical Characterization of Ordered MAX Phases Mo2TiAlC2 and Mo2Ti2AlC3. J. Appl. Phys. 2015, 118, 094304. 10.1063/1.4929640. [DOI] [Google Scholar]
- Shiju N. R.; Liang X.; Weimer A. W.; Liang C.; Dai S.; Guliants V. V. The Role of Surface Basal Planes of Layered Mixed Metal Oxides in Selective Transformation of Lower Alkanes: Propane Ammoxidation over Surface Ab Planes of Mo-V-Te-Nb-O M1 Phase. J. Am. Chem. Soc. 2008, 130, 5850–5851. 10.1021/ja800575v. [DOI] [PubMed] [Google Scholar]
- Shiju N. R.; Rondinone A. J.; Mullins D. R.; Schwartz V.; Overbury S. H.; Guliants V. V. XANES Study of Hydrothermal Mo-V-Based Mixed Oxide M1-Phase Catalysts for the (Amm)Oxidation of Propane. Chem. Mater. 2008, 20, 6611–6616. 10.1021/cm800546h. [DOI] [Google Scholar]
- Spencer N. D.; Pereira C. J. Partial Oxidation of CH4 to HCHO over a MoO3-SiO2 Catalyst: A Kinetic Study. AIChE J. 1987, 33, 1808–1812. 10.1002/aic.690331107. [DOI] [Google Scholar]
- Tatsumi T.; Muramatsu A.; Yokota K.; Tominaga H. Mechanistic Study on the Alcohol Synthesis over Molybdenum Catalysts. J. Catal. 1989, 115, 388–398. 10.1016/0021-9517(89)90043-2. [DOI] [Google Scholar]
- Kim H.-G.; Lee K. H.; Lee J. S. Carbon Monoxide Hydrogenation over Molybdenum Carbide Catalysts. Res. Chem. Intermed. 2000, 26, 427–443. 10.1163/156856700X00435. [DOI] [Google Scholar]
- Muramatsu A.; Tatsumi T.; Tominaga H. Active Species of Molybdenum for Alcohol Synthesis from Carbon Monoxide-Hydrogen. J. Phys. Chem. 1992, 96, 1334–1340. 10.1021/j100182a058. [DOI] [Google Scholar]
- Nacimiento F.; Cabello M.; Alcántara R.; Pérez-Vicente C.; Lavela P.; Tirado J. L. Exploring an Aluminum Ion Battery Based on Molybdite as Working Electrode and Ionic Liquid as Electrolyte. J. Electrochem. Soc. 2018, 165, A2994–A2999. 10.1149/2.0391813jes. [DOI] [Google Scholar]
- Karpenko A.; Leppelt R.; Cai J.; Plzak V.; Chuvilin A.; Kaiser U.; Behm R. Deactivation of a Au/CeO2 Catalyst during the Low-Temperature Water-Gas Shift Reaction and Its Reactivation: A Combined TEM, XRD, XPS, DRIFTS, and Activity Study. J. Catal. 2007, 250, 139–150. 10.1016/j.jcat.2007.05.016. [DOI] [Google Scholar]
- Wang L. C.; Tahvildar Khazaneh M.; Widmann D.; Behm R. J. TAP Reactor Studies of the Oxidizing Capability of CO2 on a Au/CeO2 Catalyst-A First Step toward Identifying a Redox Mechanism in the Reverse Water-Gas Shift Reaction. J. Catal. 2013, 302, 20–30. 10.1016/j.jcat.2013.02.021. [DOI] [Google Scholar]
- Puigdollers A. R.; Schlexer P.; Tosoni S.; Pacchioni G. Increasing Oxide Reducibility: The Role of Metal/Oxide Interfaces in the Formation of Oxygen Vacancies. ACS Catal. 2017, 7, 6493–6513. 10.1021/acscatal.7b01913. [DOI] [Google Scholar]
- Álvarez A.; Borges M.; Corral-Pérez J. J.; Olcina J. G.; Hu L.; Cornu D.; Huang R.; Stoian D.; Urakawa A. CO2 Activation over Catalytic Surfaces. ChemPhysChem 2017, 18, 3135–3141. 10.1002/cphc.201700782. [DOI] [PubMed] [Google Scholar]
Associated Data
This section collects any data citations, data availability statements, or supplementary materials included in this article.