

Abstract
Qing Hao Gan Cao (QHGC), a Chinese medicinal formula containing Artemisia annua and Glycyrrhizae Radix et Rhizoma, has been used to treat sunstroke and as an antiviral agent for more than 800 years. It has not previously been subject to a toxicological safety evaluation in acute and subacute (28 days) studies. Therefore, the acute and subacute toxicity of an aqueous extract of QHGC were evaluated in vivo. For the QHGC preparation, the botanical raw materials were crushed into pieces and mixed in the ratio of 10:1 in distilled water for 12 h, then boiling three times for 2 h each time. The three decoctions were mixed and filtered, then spray-dried with hot air at 160°C for 30 min, and stored at room temperature. For the acute toxicity test, 72.0 g/kg of QHGC extract was administered by gavage to male and female mice. Body weight, general observations, and autopsy results were recorded. No mortality or toxicity signs were observed during the studies. For the subacute toxicity test, 4.0, 8.0, or 16.0 g/kg/day of QHGC extract was administered to rats for 28 days. General observations and mortality, body weight, biochemical and hematological parameters, organ weight, and pathological morphology were analyzed. The acute and subacute toxicity studies did not show significant changes in body weight, general observations, hematology and biochemical parameters, organ weight, and liver, spleen, stomach, duodenum, testis, ovary, lung, heart, and kidney histopathological analyses. The consumption of QHGC aqueous extract can be considered safe within the conditions of this study.
Keywords: Qing Hao Gan Cao extract, Artemisia annua, Glycyrrhizae Radix et Rhizoma, acute toxicity, subacute toxicity, safety evaluation
Introduction
The above ground parts of Artemisia annua L. are documented as the authentic source of the traditional Chinese medicine qinghao (QH hereafter) in the Chinese Pharmacopoeia [1]. This herbal medicine has been used to treat fevers for 2000 years, and its chemistry has been well described [2–5]. In the book, “Chongqing tang essay” written by Wang Xuequan in 1808 reported that “Qinghao not only can be a special solution to a damp-warm plague but also to accumulated heat in the liver and gallbladder blood.” It is a well-known component of many formulations as a “monarch drug,” such as Qinghao Biejia soup, Gaoqin Qingdan soup, and Qingliang Dishu soup. The phytochemistry of A. annua L. is dominated by terpenoids (in particular sesquiterpene lactones), flavonoids, coumarins, and other shikimate metabolites [6, 7]. In addition, qinghao has antibacterial and anti-inflammatory effects [8].
Glycyrrhizae Radix et Rhizoma (gancao in Chinese, GC hereafter) is listed in the Chinese Pharmacopoeia as the roots of Glycyrrhiza uralensis Fisch., Glycyrrhiza inflata Bat., or Glycyrrhiza glabta L [1]. Herbal preparations containing Glycyrrhiza spp. have been used in China for thousands of years to treat virus-induced cough and viral hepatitis. It contains active compounds, including glycyrrhizin, glycyrrhetinic acid, flavonoids, isoflavonoids, and chalcones. Glycyrrhizin and glycyrrhetinic acid are considered to be the main active components and are potent inhibitors of cortisol metabolism, due to their steroid-like structures.
Qing Hao Gan Cao (QHGC hereafter) is a traditional Chinese formula first listed in the General Medical Collection of Royal Benevolence (Sheng Ji Zong Lu) written by the doctors of the Royal Hospital in 1117 and it is used to treat fever caused by summer heat and dampness.
Molecular docking was used to research TCMs’ activity against different influenza in recent studies [9]. The results show that TCM compounds can inhibit influenza viral proteins in a multi-target/multi-component manner, revealing GC and QH had the most number of selected compounds in 312 TCM compounds in 18 TCMs for treating different influenza virus subtypes, respectively [9].
It is well known that the medicinal plants of GC and QH are widely used. Studies have shown that QHGC was extremely effective in alleviating the symptoms of fever in pigs. This treatment has been done about the relationship between scopoletin and fever. However, the literature contains few data on the toxicity or side effects of an aqueous extract of QHGC. We, therefore, assessed the safety of this formula by evaluating its acute and subacute toxicity in mice and rats.
Material and Methods
Plant materials and QHGC extract preparation
QH and GC were purchased from Sichuan and Xinjiang, respectively. The plant material was authenticated morphologically in our laboratory by Dr Pan, in compliance with the quality standard of the Chinese Pharmacopoeia [1]. Artemisia annua (200 kg, no. 201801002) was collected from Mianyang in Sichuan, China (latitude: 30°42′S, longitude: 103°45′W) and Glycyrrhizae Radix et Rhizoma authenticated as G. glabta L. (20 kg, no. 201803004) was harvested from Aksu in Xinjiang, China (Latitude: 39°30′N, longitude: 79°45′E). The voucher specimen of the two traditional herbs was deposited in the herbarium of Traditional Chinese Medicine (Zhengzhou University, School of Pharmaceutical Sciences, QH-201801002, GC-201803004). The preparation and manufacturing process of herbs followed standard operating procedures. The plant raw materials were crushed into pieces, soaked in distilled water at a ratio of 10:1 (w/w) for 12 h, and then boiled three times (220 kg/2640 L; 220 kg/2200 L; 220 kg/2200 L) for 2 h each time. The botanical raw materials were crushed into pieces and mixed in the ratio of 10:1 (w/w) in distilled water for 12 h, then boiling three times (220 kg/2640 L; 220 kg/2200 L; 220 kg/2200 L) for 2 h each time. The three decoctions were mixed and filtered, then spray-dried with hot air at 160°C for 30 min, and stored at normal atmospheric temperature. The herbal extract ratio was about 26.5% (w/w, crude extract/raw materials).
Reagents and equipment
The reference standards scopoletin, one of the most important active constituent in QH aqueous extract (batch number 110768-200504) and ammonium glycyrrhizinate, the main active component in GC (batch number 110731-201720) were purchased from the National Institutes for Food and Drug Control (Beijing, China) and were at least 98% pure based on HPLC analysis. LC-MS grade acetonitrile, methanol, and water were purchased from Trunpu Weiye Tech Co., Ltd. (Tianjin, China). All other reagents were of analytical grade. The quality assessment of the QHGC extract was performed using an Agilent 1200 HPLC system (Agilent, Santa Clara, CA) and an ODS-C18 column (4.60 × 250.00 mm, 5 μm; Agilent). Signals were detected by ultraviolet visible light detector.
Animals and ethics
Forty Kunming (KM) mice (female and male, 4–5 weeks old, 18–22 g body weight) and 80 Sprague–Dawley (SD) rats (female and male, 5 weeks old, 160–170 g body weight) were purchased from the Henan Medical Laboratory Animal Center [Zhengzhou, China; certificate number SCXK (henan) 2017-0001]. All mice and rats were kept in pathogen-free conditions in an air-conditioned environment with a 12-h light/dark cycle, a temperature of 20 ± 2°C, and a humidity of 40–70%. All animals had free access to food and water during the experiments. This experimental study was reviewed and approved by the Animal Ethics Committee of Zhengzhou University. The approval number for the use of animals by the Committee is ZZUCDSER2017006.
In vivo toxicological tests
Acute and subacute toxicity tests were based on OECD Guidelines 425 and 407 [10, 11]. The QHGC extract was freshly dissolved in sterile water before gavage, and the extract solution was prepared as 0.8 g/ml, which can be reluctantly taken from the mice gavage needle and was demonstrated as the maximum dose concentration. In the acute oral toxicity study, the QHGC extract concentration was prepared as 0.8 g/ml for the 72.0-g/kg/day dose group, then three times a day. In the subactue oral toxicity study, the QHGC extract concentration was prepared as 0.2, 0.4, and 0.8 g/ml for the low-dose group (4.0 g/kg/day), medium-dose group (8.0 g/kg/day), and high-dose group (16.0 g/kg/day), respectively.
Acute oral toxicity
The acute oral toxicity of the QHGC extract was evaluated in KM mice using the maximum-tolerated dose method, according to OECD Guideline 425 [11]. After an 8-h fast, 40 KM mice were randomly divided into two experimental groups of 20 (10 of each sex): a normal control group treated with sterile water and a group treated with QHGC (24.0 g/kg). Each animal received treatments via oral gavage (30 ml/kg) three times a day (at 08:30, 15:00, and 21:00). After the last dose of the QHGC extract, the general observations of the mice were recorded at 0, 5, 15, and 30 min and at 1, 2, 4, and 6 h, respectively, and then daily for 14 days. At the end of the experiment, all animals were euthanized, and gross pathological changes in vital organs (heart, liver, spleen, stomach, lung, kidneys, brain, thymus, ovaries, and testes) were observed. Histopathologic examinations were performed if any gross pathological changes were observed.
Repeated dose 28-day oral toxicity (subacute) study
The doses were chosen based on OECD Guideline 407 [10] and according to the estimate of LD50 obtained from the acute toxicity test. Female and male SD rats were divided into four groups of 20 (10 female and 10 male) and treated with QHGC extract at oral doses of 4.0, 8.0, and 16.0 g/kg/day (20 ml/kg) or vehicle (sterile water) once a day for 28 days. The animals’ general observations, clinical signs of toxicity, mortality, body weight, and food intake were recorded every 7 days. Cumulative weight gain (%) was calculated based on initial weights. At the end of the administration period, the animals were subjected to overnight fasting, euthanized, and exsanguinated. Blood samples were collected via the abdominal aorta for the analysis of biochemical and hematological parameters. Organs (brain, heart, liver, spleen, lung, kidneys, adrenal gland, thymus, testis, epididymis, ovaries, and uterus) were excised and weighed.
Hematological analysis
For the hematological analysis, red blood cell (RBC) count, hemoglobin (Hb), hematocrit (HCT), platelet (PLT) count, mean platelet volume (MPV), mean corpuscular volume (MCV), mean corpuscular hemoglobin (MCH), MCH concentration (MCHC), white blood cell (WBC) count, neutrophil (NEUT) ratio, lymphocyte (LYM) ratio, monocyte (MONO) ratio, and eosinophil (EOS) ratio were evaluated using an XT-2000i Automated Hematology Analyzer.
Serum biochemistry analysis
For the serum biochemistry assay, albumin (ALB), alkaline phosphatase (ALP), alanine transaminase (ALT), aspartate transaminase (AST), creatine phosphokinase (CK), blood urea nitrogen (BUN), creatinine (CRE), glucose (GLU), total cholesterol (TC), triglyceride (TG), total protein (TP), potassium (K+), sodium (Na+), chloride (Cl-), and calcium (Ca2+) concentrations were determined with a BX-4000 Automated Biochemistry Analyzer.
Histopathological examinations
The excised organs were fixed in 10% formaldehyde for histological analysis [12]. Liver, kidney, spleen, stomach, duodenum, testis, ovary, lung, and heart tissues from the control group and from the group treated with the high-dose QHGC extract (16.0 g/kg/day) were dehydrated, embedded in paraffin, cut into 4- to 5-μm-thick sections, stained with hematoxylin-eosin (H&E), and examined via light microscopy [13]. Degeneration, necrosis, leukocyte infiltration, congestion, extravasation of blood, and fibrosis were assessed.
Statistical analysis
The data are expressed as mean ± standard deviation (SD). A statistical comparison of the data was performed using one- or two-way analysis of variance followed by t-tests in SPSS 21.0 for Windows to evaluate the differences between the groups. A P-value of less than 0.05 was considered to indicate statistical significance.
Results
HPLC analysis
The analysis of scopoletin was conducted using acetonitrile (solvent A) and ultrapure water acidified with formic acid (0.1%) (solvent B). The gradient procedure was 0–35 min, 13→17% A, 87→83% B; 35–36 min, 17→13% A, 83→87% B; 36–45 min, 13% A, 87% B. The flow rate was 0.8 ml/min. The detection wavelength for compounds was set at 345 nm, and the column temperature was 30°C. The analysis of glycyrrhizic acid was conducted using acetonitrile as solvent A and 0.05% phosphoric acid as solvent B. The detection wavelength was 250 nm, and the flow rate was 1 ml/min. The gradient procedure was 0–8 min, 19% A, 80% B; 8–60 min, 19→50% A, 81→50% B; 60–61 min, 50→100% A, 50→0% B; 61–65 min, 100→19% A, 0→81% B. The HPLC results show that the contents of scopoletin and glycyrrhizic acid in the extract were 1.773 and 10.774 mg/g, respectively (Fig. 1), which indicates the good quality of the QHGC extract in this study.
Figure 1.
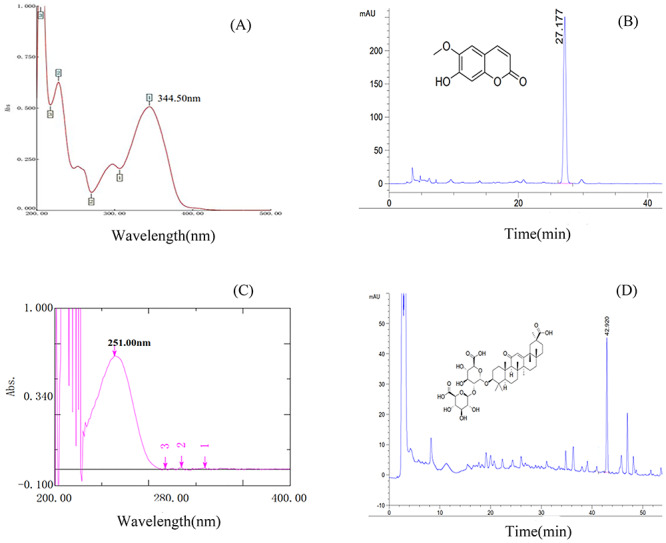
HPLC results for the QHGC extract used in this study: (A) UV spectrum for scopoletin, (B) retention time of scopoletin, (C) UV spectrum for glycyrrhizic acid, and (D) retention time of glycyrrhizic acid.
Acute oral toxicity
In the acute toxicity study, all animals were observed carefully for the development of any toxic signs or symptoms at time intervals of 0, 5, 15, and 30 min and at 1, 2, 4, and 6 h, respectively, and then daily for a period of 14 days. The dose of 72.0 g/kg did not cause death or any clinical signs of acute toxicity in KM mice during the 14 days of the observation period. No significant difference was found in the body weights of the treated group relative to the control group (Table 1, Fig. 2). All mice survived until the end of the observation period, and no abnormalities were found at necropsy in any vital organs, including the heart, liver, spleen, lung, stomach, duodenum, and kidney. These findings indicate that the LD50 of the QHGC extract is much greater than 72.0 g/kg.
Table 1.
body weight gain of KM mice treated with QHGC extract in acute toxicity test
| Parameter | Control | QHGC extract 72.0 (g/kg/day) |
|---|---|---|
| Initial weight (g) | 18.62 ± 1.31 | 18.34 ± 0.58 |
| Day 1 weight (g) | 19.90 ± 1.33 | 19.88 ± 0.86 |
| Day 2 weight (g) | 21.52 ± 1.75 | 21.76 ± 1.20 |
| Day 3 weight (g) | 22.17 ± 1.46 | 22.55 ± 0.98 |
| Day 4 weight (g) | 23.56 ± 1.95 | 24.32 ± 1.11 |
| Day 5 weight (g) | 25.48 ± 2.19 | 25.82 ± 1.14 |
| Day 6 weight (g) | 27.32 ± 2.46 | 27.13 ± 1.44 |
| Day 7 weight (g) | 28.34 ± 2.99 | 28.25 ± 1.54 |
| Day 10 weight (g) | 30.16 ± 2.53 | 30.41 ± 1.24 |
| Day 12 weight (g) | 31.27 ± 2.52 | 31.33 ± 1.10 |
| Final weight (g) | 32.80 ± 2.54 | 32.76 ± 1.27 |
| Body weight gain (%) | 80.47 | 87.23 |
Data are presented as mean ± SD (n = 20). No significant differences were found between the control and treatment groups.
Figure 2.

body weights of animals that received acute (A) or subacute (B, male; C, female) treatment with QHGC extract
Subacute oral toxicity
General observations and mortality
Throughout the experiment, daily oral administration of the extract at concentrations of 4.0, 8.0, and 16.0 g/kg/day resulted in no noticeable changes in the treated rats compared with the control rats. Furthermore, no deaths were recorded in either group at any of the doses administered.
Body weight and food intake
No significant differences in body weight gain or food intake (Table 2, Fig. 2) were observed between the control group and all treated groups of SD rats.
Table 2.
effect of oral administration of QHGC extract for 28 days on body weight and food intake of SD rats
| Parameter | Group 1 (0 g/kg/day) | Group 2 (4.0 g/kg/day) | Group 3 (8.0 g/kg/day) | Group 4 (16.0 g/kg/day) |
|---|---|---|---|---|
| Male | ||||
| Week 0 weight (g) | 170.43 ± 6.94 | 168.96 ± 5.33 | 165.17 ± 6.08 | 170.14 ± 8.55 |
| Week 1 weight (g) | 214.10 ± 10.22 | 210.90 ± 9.01 | 206.44 ± 10.46 | 205.08 ± 11.77 |
| Week 2 weight (g) | 262.90 ± 16.29 | 259.83 ± 11.48 | 263.32 ± 16.20 | 263.30 ± 16.82 |
| Week 3 weight (g) | 294.94 ± 21.70 | 292.32 ± 15.36 | 301.95 ± 23.64 | 292.72 ± 14.99 |
| Week 4 weight (g) | 319.07 ± 23.25 | 309.67 ± 18.41 | 325.35 ± 24.06 | 313.24 ± 14.11 |
| Body weight gain (g) | 148.65 ± 24.05 | 140.71 ± 18.34 | 160.19 ± 24.43 | 143.09 ± 20.51 |
| Week 0 food intake (g/day) | 24.86 ± 1.77 | 23.56 ± 2.26 | 23.19 ± 2.50 | 21.60 ± 2.25 |
| Week 1 food intake (g/day) | 25.52 ± 0.80 | 25.20 ± 3.43 | 26.22 ± 1.98 | 22.64 ± 3.52 |
| Week 2 food intake (g/day) | 25.27 ± 3.04 | 24.28 ± 2.20 | 23.15 ± 2.47 | 21.88 ± 3.17 |
| Week 3 food intake (g/day) | 20.48 ± 4.51 | 22.36 ± 2.89 | 21.92 ± 3.61 | 21.87 ± 3.05 |
| Week 4 food intake (g/day) | 24.63 ± 2.72 | 24.72 ± 3.81 | 24.76 ± 1.76 | 21.33 ± 3.57 |
| Female | ||||
| Week 0 weight (g) | 161.97 ± 7.84 | 161.21 ± 7.73 | 160.07 ± 8.80 | 160.12 ± 9.34 |
| Week 1 weight (g) | 178.10 ± 9.19 | 177.71 ± 7.26 | 176.61 ± 9.74 | 176.85 ± 11.79 |
| Week 2 weight (g) | 195.11 ± 10.28 | 190.40 ± 9.63 | 190.15 ± 8.25 | 192.83 ± 10.11 |
| Week 3 weight (g) | 208.20 ± 10.24 | 204.83 ± 6.64 | 202.71 ± 6.74 | 205.74 ± 8.91 |
| Week 4 weight (g) | 224.34 ± 6.64 | 224.18 ± 17.79 | 219.28 ± 20.42 | 221.56 ± 15.11 |
| Body weight gain (g) | 62.38 ± 11.69 | 62.98 ± 16.28 | 59.21 ± 20.11 | 61.43 ± 14.36 |
| Week 0 food intake (g/day) | 16.54 ± 2.23 | 15.08 ± 3.10 | 14.75 ± 2.29 | 14.76 ± 3.89 |
| Week 1 food intake (g/day) | 17.49 ± 1.57 | 16.72 ± 1.89 | 17.06 ± 0.58 | 18.04 ± 2.03 |
| Week 2 food intake (g/day) | 18.33 ± 2.79 | 16.91 ± 3.35 | 17.51 ± 3.62 | 16.41 ± 4.17 |
| Week 3 food intake (g/day) | 21.06 ± 2.64 | 18.75 ± 1.69 | 18.34 ± 2.47 | 19.23 ± 2.23 |
| Week 4 food intake (g/day) | 19.26 ± 3.06 | 18.86 ± 2.76 | 17.05 ± 2.95 | 17.93 ± 3.79 |
Values are means ± SD for groups of rats (n = 10). There were no significant differences.
Hematological parameters
Treatment for 28 consecutive days with QHGC extract at the three doses did not produce any changes in the hematologic parameters of the SD rats compared with the control group (Table 3).
Table 3.
effect of subacute oral administration of QHGC extract on hematological parameters in SD rats
| Parameter | Group 1 (0 g/kg/day) | Group 2 (4.0 g/kg/day) | Group 3 (8.0 g/kg/day) | Group 4 (16.0 g/kg/day) |
|---|---|---|---|---|
| Male | ||||
| RBC (1012/mm3) | 8.39 ± 0.32 | 8.46 ± 0.39 | 8.67 ± 0.44 | 8.56 ± 0.27 |
| Hb (g/l) | 159.20 ± 7.84 | 158.50 ± 4.93 | 164.60 ± 7.38 | 165.90 ± 4.09 |
| HCT (%) | 46.39 ± 2.08 | 46.64 ± 2.31 | 47.15 ± 2.03 | 48.23 ± 1.45 |
| PLT (109/l) | 1289.50 ± 137.63 | 1271.10 ± 140.14 | 1365.90 ± 153.70 | 1272.70 ± 82.40 |
| MPV (fl) | 7.64 ± 0.36 | 8.06 ± 0.39 | 7.39 ± 0.20 | 7.78 ± 0.40 |
| MCV (fl) | 55.32 ± 2.16 | 55.14 ± 1.90 | 54.44 ± 1.28 | 56.42 ± 2.01 |
| MCH (pg) | 19.00 ± 0.74 | 18.73 ± 0.38 | 19.01 ± 0.46 | 19.39 ± 0.65 |
| MCHC (g/l) | 343.20 ± 4.37 | 340.20 ± 8.32 | 349.10 ± 4.77 | 344.10 ± 5.00 |
| WBC (109/l) | 7.02 ± 2.63 | 7.43 ± 5.24 | 9.63 ± 2.67 | 8.94 ± 2.10 |
| NEUT (%) | 15.93 ± 5.59 | 18.41 ± 7.55 | 13.09 ± 2.50 | 11.42 ± 3.70 |
| LYM (%) | 80.30 ± 5.21 | 78.52 ± 7.06 | 82.75 ± 2.68 | 84.55 ± 4.42 |
| MONO (%) | 3.30 ± 0.72 | 2.72 ± 1.26 | 3.74 ± 0.69 | 3.63 ± 1.00 |
| EOS (%) | 0.45 ± 0.42 | 0.33 ± 0.35 | 0.39 ± 0.20 | 0.37 ± 0.31 |
| NEUT(103/l) | 1.04 ± 0.35 | 1.15 ± 0.60 | 1.26 ± 0.46 | 0.98 ± 0.26 |
| LYM (109/l) | 5.70 ± 2.25 | 6.03 ± 4.50 | 7.97 ± 2.19 | 7.60 ± 1.95 |
| MONO (109/l) | 0.23 ± 0.10 | 0.22 ± 0.17 | 0.36 ± 0.13 | 0.32 ± 0.10 |
| EOS (109/l) | 0.04 ± 0.04 | 0.04 ± 0.06 | 0.03 ± 0.02 | 0.03 ± 0.03 |
| Female | ||||
| RBC (1012/mm3) | 8.77 ± 0.34 | 8.89 ± 0.55 | 8.62 ± 0.44 | 8.68 ± 0.37 |
| Hb (g/l) | 165.20 ± 5.57 | 166.00 ± 7.60 | 161.00 ± 6.04 | 163.60 ± 5.97 |
| HCT (%) | 47.49 ± 1.37 | 47.54 ± 1.77 | 46.80 ± 1.89 | 523.22 ± 1506.22 |
| PLT (109/l) | 1244.40 ± 102.35 | 1036.03 ± 398.56 | 1184.10 ± 126.19 | 1173.80 ± 127.38 |
| MPV (fl) | 7.56 ± 0.26 | 7.30 ± 0.27 | 7.73 ± 0.27 | 7.52 ± 0.24 |
| MCV (fl) | 54.21 ± 1.41 | 53.58 ± 2.17 | 54.30 ± 1.31 | 54.24 ± 2.73 |
| MCH (pg) | 18.85 ± 0.45 | 18.70 ± 0.53 | 18.67 ± 0.52 | 18.86 ± 0.77 |
| MCHC (g/l) | 347.70 ± 5.70 | 349.10 ± 5.36 | 344.30 ± 7.97 | 348.00 ± 5.14 |
| WBC (109/l) | 5.79 ± 2.31 | 7.98 ± 2.84 | 7.25 ± 3.37 | 6.80 ± 2.72 |
| NEUT (%) | 11.11 ± 6.61 | 6.54 ± 2.18 | 6.58 ± 3.24 | 7.74 ± 6.41 |
| LYM (%) | 85.30 ± 6.66 | 90.43 ± 2.74 | 89.69 ± 4.46 | 88.97 ± 7.08 |
| MONO (%) | 3.39 ± 0.78 | 2.63 ± 1.01 | 3.47 ± 1.74 | 3.06 ± 1.31 |
| EOS (%) | 0.20 ± 0.35 | 0.39 ± 0.47 | 0.19 ± 0.23 | 0.22 ± 0.37 |
| NEUT (103/l) | 0.59 ± 0.39 | 0.48 ± 0.13 | 0.39 ± 0.12 | 0.48 ± 0.29 |
| LYM (109/l) | 4.99 ± 2.11 | 7.25 ± 2.72 | 6.59 ± 3.28 | 6.09 ± 2.56 |
| MONO (109/l) | 0.20 ± 0.09 | 0.21 ± 0.12 | 0.24 ± 0.12 | 0.22 ± 0.15 |
| EOS (109/l) | 0.02 ± 0.03 | 0.03 ± 0.04 | 0.02 ± 0.03 | 0.02 ± 0.04 |
The data are presented as mean ± SD (n = 10). There was no significant difference.
Biochemical parameters
The QHGC extract did not cause any significant change in biochemical parameters at any of the tested subacute doses when compared with the control (Table 4).
Table 4.
effects of subacute doses of QHGC extract on biochemical parameters in male and female SD rats
| Subacute dose | ||||
|---|---|---|---|---|
| Parameter | Group 1 (0 g/kg/day) | Group 2 (4.0 g/kg/day) | Group 3 3 (8.0 g/kg/day) | Group 4 (16.0 g/kg/day) |
| Male | ||||
| ALB (g/dl) | 36.30 ± 1.52 | 36.86 ± 1.87 | 37.23 ± 1.62 | 36.60 ± 1.11 |
| ALP (U/l) | 179.87 ± 27.17 | 208.90 ± 39.05 | 208.01 ± 25.66 | 192.71 ± 30.34 |
| ALT (U/l) | 48.79 ± 7.48 | 52.69 ± 11.26 | 56.34 ± 10.77 | 50.08 ± 3.16 |
| AST (U/l) | 124.61 ± 42.24 | 117.31 ± 24.19 | 123.09 ± 30.79 | 117.07 ± 28.26 |
| CK (U/l) | 329.10 ± 119.69 | 296.26 ± 65.88 | 274.38 ± 69.94 | 352.58 ± 110.48 |
| BUN (mg/dl) | 4.22 ± 1.00 | 4.29 ± 0.83 | 4.84 ± 0.79 | 4.32 ± 0.63 |
| CRE (mg/dl) | 26.88 ± 2.00 | 27.00 ± 3.74 | 25.99 ± 3.15 | 26.86 ± 3.36 |
| GLU (mg/dl) | 8.11 ± 1.24 | 7.70 ± 0.86 | 8.27 ± 1.21 | 7.98 ± 0.93 |
| TC (mg/dl) | 1.86 ± 0.39 | 1.90 ± 0.29 | 1.99 ± 0.33 | 1.98 ± 0.48 |
| TG (mg/dl) | 1.64 ± 0.25 | 1.46 ± 0.17 | 1.73 ± 0.14 | 1.58 ± 0.14 |
| TP (g/dl) | 70.65 ± 3.28 | 72.06 ± 3.01 | 73.17 ± 3.25 | 72.09 ± 1.67 |
| K+ (mmol/l) | 2.47 ± 0.28 | 2.32 ± 0.23 | 2.36 ± 0.36 | 2.52 ± 0.26 |
| Na+ (mmol/l) | 107.43 ± 18.74 | 102.73 ± 1.34 | 105.03 ± 3.68 | 102.05 ± 0.74 |
| Cl-(mmol/l) | 108.00 ± 2.99 | 109.85 ± 2.63 | 112.78 ± 5.15 | 108.94 ± 0.96 |
| Ca2+ (mmol/l) | 2.17 ± 0.13 | 2.16 ± 0.09 | 2.23 ± 0.09 | 2.19 ± 0.06 |
| Female | ||||
| ALB (g/dl) | 43.15 ± 4.20 | 43.89 ± 2.41 | 43.42 ± 3.90 | 41.48 ± 2.90 |
| ALP (U/l) | 101.18 ± 36.43 | 103.34 ± 23.85 | 109.50 ± 49.75 | 111.52 ± 52.12 |
| ALT (U/l) | 42.10 ± 5.35 | 44.29 ± 13.15 | 34.95 ± 9.64 | 43.74 ± 13.41 |
| AST (U/l) | 97.13 ± 20.64 | 112.63 ± 25.13 | 105.49 ± 27.04 | 119.05 ± 37.48 |
| CK (U/l) | 216.64 ± 109.70 | 214.19 ± 90.46 | 272.07 ± 212.38 | 375.08 ± 299.69 |
| BUN (mg/dl) | 5.95 ± 2.39 | 6.33 ± 1.14 | 6.96 ± 2.26 | 6.15 ± 1.21 |
| CRE (mg/dl) | 34.32 ± 7.46 | 38.98 ± 8.59 | 38.94 ± 13.93 | 33.70 ± 4.94 |
| GLU (mg/dl) | 8.21 ± 1.55 | 7.52 ± 0.91 | 8.51 ± 1.04 | 8.78 ± 0.77 |
| TC (mg/dl) | 2.03 ± 0.52 | 2.19 ± 0.41 | 1.94 ± 0.29 | 2.25 ± 0.44 |
| TG (mg/dl) | 1.50 ± 0.20 | 1.41 ± 0.07 | 1.43 ± 0.20 | 1.54 ± 0.12 |
| TP (g/dl) | 81.93 ± 5.57 | 84.43 ± 3.27 | 84.60 ± 6.02 | 81.14 ± 5.44 |
| K+ (mmol/l) | 2.44 ± 0.32 | 2.25 ± 0.21 | 2.43 ± 0.23 | 2.44 ± 0.29 |
| Na+ (mmol/l) | 106.14 ± 4.45 | 110.98 ± 1.65 | 110.15 ± 5.74 | 110.39 ± 3.26 |
| Cl-(mmol/l) | 116.84 ± 3.68 | 119.11 ± 1.83 | 118.89 ± 3.56 | 119.87 ± 2.60 |
| Ca2+ (mmol/l) | 2.38 ± 0.11 | 2.43 ± 0.08 | 2.41 ± 0.14 | 2.38 ± 0.13 |
Data are presented as mean ± SD (n = 10). There were no significant differences between groups.
Organ weight
No significant changes were seen in the organ weight in either the male or female rats, apart from the relative organ coefficient of the left kidney of male rats treated with 16.0 g/kg/day, which differed significantly (P < 0.05) from that of the control group. No significant correlation was found between the organ weight and the toxicity evaluation of the drug (Table 5).
Table 5.
absolute and relative organ weights of SD rats treated with subacute doses of QHGC extract
| Absolute (g) and relative (%) organ coefficients | |||||
|---|---|---|---|---|---|
| Organ | Group 1 (0 g/kg/day) | Group 2 (4.0 g/kg/day) | Group 3 (8.0 g/kg/day) | Group 4 (16.0 g/kg/day) | |
| Male | |||||
| Fasting weight (g) | 317.76 ± 21.45 | 312.57 ± 25.33 | 312.59 ± 22.54 | 319.31 ± 16.11 | |
| Adrenal gland, left | Absolute | 0.0225 ± 0.0061 | 0.0243 ± 0.0058 | 0.0250 ± 0.0082 | 0.0236 ± 0.0135 |
| Relative | 0.0071 ± 0.0019 | 0.0078 ± 0.0018 | 0.0081 ± 0.0028 | 0.0073 ± 0.0041 | |
| Adrenal gland, right | Absolute | 0.0218 ± 0.0034 | 0.0221 ± 0.0050 | 0.0255 ± 0.0063 | 0.0251 ± 0.0111 |
| Relative | 0.0069 ± 0.0011 | 0.0071 ± 0.0015 | 0.0082 ± 0.0021 | 0.0078 ± 0.0032 | |
| Thymus | Absolute | 0.5452 ± 0.1560 | 0.5304 ± 0.1570 | 0.4647 ± 0.1086 | 0.4846 ± 0.1114 |
| Relative | 0.1729 ± 0.0533 | 0.1702 ± 0.0500 | 0.1494 ± 0.0369 | 0.1530 ± 0.0397 | |
| Testis, left | Absolute | 1.3058 ± 0.2959 | 1.4532 ± 0.1244 | 1.3821 ± 0.2570 | 1.3941 ± 0.1629 |
| Relative | 0.0041 ± 0.0010 | 0.0047 ± 0.0004 | 0.4418 ± 0.0747 | 0.4377 ± 0.0557 | |
| Testis, right | Absolute | 1.2862 ± 0.3212 | 1.4517 ± 0.1211 | 1.3940 ± 0.3152 | 1.3520 ± 0.1897 |
| Relative | 0.4053 ± 0.1019 | 0.4659 ± 0.0412 | 0.4451 ± 0.0927 | 0.4246 ± 0.0631 | |
| Epididymis, left | Absolute | 0.4789 ± 0.4404 | 0.4085 ± 0.1610 | 0.4588 ± 0.1678 | 0.3724 ± 0.0529 |
| Relative | 0.1506 ± 0.1369 | 0.1307 ± 0.0493 | 0.1470 ± 0.0551 | 0.1168 ± 0.0171 | |
| Epididymis, right | Absolute | 0.4694 ± 0.4250 | 0.4020 ± 0.1238 | 0.4686 ± 0.1966 | 0.3802 ± 0.0457 |
| Relative | 0.1476 ± 0.1322 | 0.1289 ± 0.0393 | 0.1494 ± 0.0623 | 0.1192 ± 0.0143 | |
| Spleen | Absolute | 0.7214 ± 0.1084 | 0.7154 ± 0.1338 | 0.6824 ± 0.1130 | 0.7342 ± 0.1094 |
| Relative | 0.2272 ± 0.0322 | 0.2280 ± 0.0333 | 0.2180 ± 0.0314 | 0.2303 ± 0.0361 | |
| Kidney, left | Absolute | 1.2724 ± 0.1009 | 1.1988 ± 0.0938 | 1.1182 ± 0.1421 | 1.1650 ± 0.0787 |
| Relative | 0.4009 ± 0.0271 | 0.3842 ± 0.0227 | 0.3575 ± 0.0346 | 0.3653 ± 0.0261* | |
| Kidney, right | Absolute | 1.2526 ± 0.1386 | 1.1848 ± 0.1123 | 1.1325 ± 0.1466 | 1.1520 ± 0.0851 |
| Relative | 0.3944 ± 0.0382 | 0.3793 ± 0.0251 | 0.3620 ± 0.0356 | 0.3610 ± 0.0235 | |
| Heart | Absolute | 1.1536 ± 0.1514 | 1.2664 ± 0.2064 | 1.0879 ± 0.0878 | 1.1855 ± 0.1103 |
| Relative | 0.3624 ± 0.0339 | 0.4047 ± 0.0532 | 0.3492 ± 0.0327 | 0.3722 ± 0.0401 | |
| Lung | Absolute | 1.3559 ± 0.3272 | 1.2173 ± 0.1160 | 1.2153 ± 0.1302 | 1.3398 ± 0.1597 |
| Relative | 0.4238 ± 0.0779 | 0.3904 ± 0.0349 | 0.3882 ± 0.0230 | 0.4195 ± 0.0423 | |
| Brain | Absolute | 1.8628 ± 0.1559 | 1.9597 ± 0.0935 | 1.9077 ± 0.0833 | 1.8832 ± 0.1294 |
| Relative | 0.5880 ± 0.0565 | 0.6296 ± 0.0436 | 0.6131 ± 0.0499 | 0.5905 ± 0.0415 | |
| Liver | Absolute | 10.9798 ± 1.8358 | 9.3235 ± 1.5318 | 9.2356 ± 0.9739 | 9.6353 ± 0.7352 |
| Relative | 3.4555 ± 0.5360 | 2.9738 ± 0.3560 | 2.9506 ± 0.1700 | 3.0213 ± 0.2350 | |
| Female | |||||
| Fasting weight (g) | 204.20 ± 16.34 | 208.54 ± 18.97 | 208.21 ± 7.60 | 207.80 ± 10.25 | |
| Ovary, left | Absolute | 0.0673 ± 0.0170 | 0.0585 ± 0.0226 | 0.0718 ± 0.0169 | 0.0610 ± 0.0150 |
| Relative | 0.0333 ± 0.0094 | 0.0281 ± 0.0108 | 0.0345 ± 0.0081 | 0.0294 ± 0.0074 | |
| Ovary, right | Absolute | 0.0643 ± 0.0088 | 0.0609 ± 0.0270 | 0.0650 ± 0.0160 | 0.0556 ± 0.0129 |
| Relative | 0.0315 ± 0.0042 | 0.0293 ± 0.0132 | 0.0313 ± 0.0081 | 0.0242 ± 0.0102 | |
| Adrenal gland, left | Relative | 0.0264 ± 0.0068 | 0.0286 ± 0.0079 | 0.0274 ± 0.0050 | 0.0248 ± 0.0043 |
| Absolute | 0.0130 ± 0.0034 | 0.0137 ± 0.0035 | 0.0131 ± 0.0023 | 0.0119 ± 0.0015 | |
| Adrenal gland, right | Relative | 0.0235 ± 0.0041 | 0.0263 ± 0.0044 | 0.0259 ± 0.0040 | 0.0224 ± 0.0043 |
| Absolute | 0.0116 ± 0.0021 | 0.0127 ± 0.0021 | 0.0124 ± 0.0019 | 0.0108 ± 0.0019 | |
| Thymus | Relative | 0.4326 ± 0.0780 | 0.4492 ± 0.1112 | 0.4586 ± 0.1094 | 0.4683 ± 0.0738 |
| Absolute | 0.2135 ± 0.0445 | 0.2171 ± 0.0582 | 0.2211 ± 0.0564 | 0.2252 ± 0.0333 | |
| Uterus | Relative | 0.6006 ± 0.2002 | 0.6007 ± 0.2727 | 0.5712 ± 0.1939 | 0.5189 ± 0.1226 |
| Absolute | 0.2958 ± 0.1003 | 0.2925 ± 0.1440 | 0.2740 ± 0.0918 | 0.2497 ± 0.0565 | |
| Spleen | Relative | 0.4693 ± 0.0579 | 0.5073 ± 0.0887 | 0.4704 ± 0.0543 | 0.4918 ± 0.0758 |
| Absolute | 0.2301 ± 0.0261 | 0.2436 ± 0.0398 | 0.2266 ± 0.0303 | 0.2360 ± 0.0296 | |
| Kidney, left | Absolute | 0.7816 ± 0.1096 | 0.7361 ± 0.0754 | 0.7781 ± 0.0846 | 0.7713 ± 0.0720 |
| Relative | 0.3821 ± 0.0376 | 0.3543 ± 0.0387 | 0.3733 ± 0.0336 | 0.3711 ± 0.0269 | |
| Kidney, right | Absolute | 0.7712 ± 0.0854 | 0.7386 ± 0.0697 | 0.7608 ± 0.0601 | 0.7614 ± 0.0607 |
| Relative | 0.3774 ± 0.0259 | 0.3555 ± 0.0351 | 0.3654 ± 0.0255 | 0.3665 ± 0.0250 | |
| Heart | Absolute | 0.9170 ± 0.0942 | 0.8150 ± 0.1079 | 0.8245 ± 0.0558 | 0.8294 ± 0.0618 |
| Relative | 0.4510 ± 0.0529 | 0.3917 ± 0.0471 | 0.3961 ± 0.0249 | 0.4003 ± 0.0396 | |
| Lung | Absolute | 1.0581 ± 0.1742 | 1.0711 ± 0.1387 | 1.0549 ± 0.1226 | 1.0670 ± 0.1181 |
| Relative | 0.5170 ± 0.0620 | 0.5150 ± 0.0612 | 0.5076 ± 0.0647 | 0.5129 ± 0.0440 | |
| Brain | Absolute | 1.7625 ± 0.0938 | 1.8203 ± 0.0987 | 1.7717 ± 0.1303 | 1.7760 ± 0.0907 |
| Relative | 0.8678 ± 0.0777 | 0.8803 ± 0.0977 | 0.8510 ± 0.0555 | 0.8558 ± 0.0491 | |
| Liver | Absolute | 6.4309 ± 0.7721 | 6.4182 ± 0.9124 | 6.3679 ± 0.5368 | 6.2343 ± 0.3699 |
| Relative | 3.1447 ± 0.2096 | 3.0736 ± 0.2736 | 3.0606 ± 0.2661 | 3.0010 ± 0.1281 | |
Data are expressed as mean ± SD (n = 10). *Significant difference compared with control group: P < 0.05.
Histopathologic analyses of vital organs
Compared with the control group, pathologic examination of the liver, kidney, spleen, stomach, duodenum, testis, ovary, lung, and heart tissues from the treated groups showed no significant pathological changes in color and texture. No remarkable differences in cellular appearance were seen between the 16.0-g/kg/day group and the control group (Fig. 3).
Figure 3.

histopathological specimens of liver, kidney, spleen, lung, and heart (H&E ×400), and stomach, duodenum, testis, and ovary (H&E ×200) treated with QHGC extract (16.0 g/kg/day)
Discussion
Artemisia annua is known for its long use as an antimalarial agent. It contains artemisinin, which is the first-line antimalarial drug as part of combination treatment therapies since they act rapidly and are well tolerated and highly effective [14]. The Chinese pharmacologist Tu You You was awarded the Nobel Prize for Physiology or Medicine 2015 for her research on Artemisia [4]. The chemical composition and bioactivities of organic solvent and aqueous extracts of A. annua show remarkable differences [15].
To date, more than 20 triterpenoids and 300 flavonoids have been isolated from Glycyrrhizae radix et rhizoma [16]. Glycyrrhizic acid has been shown to have antitumor, anti-inflammatory, antiviral, immunoregulatory, and hepatoprotective activities as well as adrenal cortical hormone-like function and an inhibitory effect on diabetes [16, 17]. The standardization of Glycyrrhizae radix et rhizoma is based on the content of glycyrrhizic acid, which is a triterpenoid saponin compound that is converted in vivo into glycyrrhetinic by the enzyme glycaronidase [18, 19].
Interestingly, scopoletin and glycyrrhizic acids were defined as the principal components in QHGC aqueous extract, but artemisinin was not identified. We analyzed the contents of the therapeutic chemical components scopoletin (1.773 mg/g) and glycyrrhizic acid (10.774 mg/g) using HPLC with different solvent systems, flow rates, and detection wavelengths. Scopoletin is a coumarin derivative widespread in the Asteraceae that has shown beneficial effects in the experimental models of various diseases [20]. It is thus necessary to establish the determination method of scopoletin and glycyrrhizic acid in QHGC extract by HPLC analysis for toxicological safety study in this study.
In the acute study, no adverse effects or mortality were observed in KM mice for 14 days after an oral administration of 72.0-g/kg QHGC extract. In addition, no abnormality was detected in vital organs at necropsy at the end of the experimental period. Thus, the LD50 of QHGC extract can be assumed to be much higher than 72.0 g/kg/day in mice. According to the Globally Harmonized Classification System [21], QHGC extract is Category 5 (relatively low acute toxicity if oral dose is in the range of 2500–5000 mg/kg). It has been reported that substances with an LD50 higher than 5000 mg/kg by the oral route may be considered essentially nontoxic [22].
In the subacute study, the extract did not produce any signs of toxicity in the treated rats, and no deaths were recorded after the oral administration of QHGC extract at doses of 4.0, 8.0, or 16.0 g/kg/day for 28 consecutive days. Hematological parameters and biochemical parameters are important for assessing physiological and pathological status in humans and animals. Changes in certain indicators can reflect the health of the body, which is also crucial for the toxicological evaluation of drugs. Enzymes ALT, AST, ALP are important biomarkers of liver health; they can reflect the function of the liver. Similarly, the changes of CRE and BUN can reflect the physiological changes of the kidney. In repeated dose 28-day oral toxicity (subacute) study, no significant changes in hematological parameters and biochemical parameters were observed in all administration groups. No significant changes were observed in the body weight, food intake in the treated groups at any of the three doses relative to the control animals. Changes in body weight gain and relative organ weight are commonly monitored indicators of toxicity after exposure to drugs and chemicals [23]. The relative organ coefficient of the left kidney of the male rats was significantly decreased relative to the control group (P < 0.05) after treatment with 16.0 g/kg/day of the extract. However, this change was not dose-dependent and was within normal ranges [24]. Furthermore, macroscopic and histopathologic examinations of organs from animals treated with 16.0 g/kg/day revealed normal architecture, which suggests that no detrimental changes or morphological disorders were induced by the oral administration of QHGC extract for 28 consecutive days. Therefore, the statistical change in the relative organ coefficient of the left kidney was not associated with the toxicological safety evaluation of subacute doses of QHGC extract.
Conclusion
The acute toxicity test showed that the maximum tolerated dose of QHGC extract was much greater than 72.0 g/kg/day. Furthermore, the no-observed-adverse-effect level of QHGC extract was 16.0 g/kg/day in the subacute toxicity test, which is ~56 times higher than the dose used in clinical practice. Therefore, oral administration of QHGC extract at doses of less than 16.0 g/kg/day for 28 consecutive days can be considered safe.
Funding
This work was supported by government grants from the National Key R&D Program of China (grant number 2017YFD0501401).
Conflict of interest statement
The authors declare that there are no conflicts of interest in this study.
References
- 1. Chinese Pharmacopoeia Commission . Pharmacopoeia of the People’s Republic of China (version 2015). Beijing: People’s Medical Publishing House, 2015. [Google Scholar]
- 2. Saitbaeva IM, Sidyakin GP.. Coumarins from artemisia annua. Chem Nat Compd 1970;6:766. [Google Scholar]
- 3. China Cooperative Research Group on qinghaosu and its derivatives as antimalarials . Antimalarial studies on Qinghaosu. Chin Med J 1979;92:811–6.117984 [Google Scholar]
- 4. Tu YY, Ni MY, Zhong YRet al. Studies on the constituents of Artemisia annua Part II. Planta Med 1982;44:143–5. [DOI] [PubMed] [Google Scholar]
- 5. Tu YY, Wang J, Wang M.. Qinghao and qinghaosu derivative drugs (in Chinese). Beijing: Chemical Industry Press, 2009. [Google Scholar]
- 6. Brown GD. The biosynthesis of artemisinin (Qinghaosu) and the phytochemistry of Artemisia annua L.(Qinghao). Molecules 2010;15:7603–98. [DOI] [PMC free article] [PubMed] [Google Scholar]
- 7. Chu Y, Wang HB, Chen Jet al. New Sesquiterpene and polymethoxy-flavonoids from Artemisia annua L. Pharmacogn Mag 2014;10:213–6. [DOI] [PMC free article] [PubMed] [Google Scholar]
- 8. Kim W-S, Choi WJ, Lee Set al. Anti-inflammatory, Antioxidant and antimicrobial effects of artemisinin extracts from Artemisia annua L. Korean J Physiol Pharmacol 2015;19:21–7. [DOI] [PMC free article] [PubMed] [Google Scholar]
- 9. Gu S, Yin N, Pei JFet al. Understanding molecular mechanisms of traditional Chinese medicine for the treatment of influenza viruses infection by computational approaches. Mol Biosyst 2013;9:2696–700. [DOI] [PubMed] [Google Scholar]
- 10.OECD. Test No. 407: OECD Guidelines for the Testing of Chemicals. Repeated Dose 28-day Oral Toxicity Study in Rodents. Adopted: 16 October 2008.
- 11.OECD. Test No. 425: OECD Guidelines for the Testing of Chemicals. Acute Oral Toxicity: Up-and-Down Procedure. Adopted: 16 October 2008.
- 12. Afolabi SO, Akindele AJ, Awodele Oet al. A 90 day chronic toxicity study of Nigerian herbal preparation DAS-77 in rats. BMC Complement Altern Med 2012;12:79. [DOI] [PMC free article] [PubMed] [Google Scholar]
- 13. Martey ON-K, Armah G, Okine LKN-A. Absence of organ specific toxicity in rats treated with tonica, an aqueous herbal haematinic preparation. Afr J Tradit Complement Altern Med 2010;7:231–40. [DOI] [PMC free article] [PubMed] [Google Scholar]
- 14. White NJ. Antimalarial drug resistance. J Clin Invest 2004;113:1084–2. [DOI] [PMC free article] [PubMed] [Google Scholar]
- 15. Nageeb A, Al-Tawashi1 A, Emwas A-HMet al. Comparison of Artemisia annua bioactivities between traditional medicine and chemical extracts. Curr Bioact Compd 2013;9:324–32. [DOI] [PMC free article] [PubMed] [Google Scholar]
- 16. Yang R, Wang LQ, Yuan BCet al. The pharmacological activities of licorice. Planta Med 2015;81:1654–69. [DOI] [PubMed] [Google Scholar]
- 17. Fouladi S, Masjedi M, Hakemi MGet al. The review of in vitro and in vivo studies over the glycyrrhizic acid as natural remedy option for treatment of allergic asthma. Iran J Allergy Asthma Immunol 2019;18:1–11. [PubMed] [Google Scholar]
- 18. Asl MN, Hosseinzadeh H.. Review of pharmacological effects of Glycyrrhiza sp.and its bioactive compounds. Phytother Res 2008;22:709–24. [DOI] [PMC free article] [PubMed] [Google Scholar]
- 19. Nazari S, Rameshrad M, Hosseinzadeh H.. Toxicological effects of Glycyrrhiza glabra (licorice): a review. Phytother Res 2017;31:1635–50. [DOI] [PubMed] [Google Scholar]
- 20. Juvonen RO, Novák F, Emmanouilidou Eet al. Metabolism of scoparone in experimental animals and humans. Planta Med 2019;85:453–64. [DOI] [PubMed] [Google Scholar]
- 21.OECD. OECD Series on Testing and Assessment. Harmonised integrated classification system for human health and environmental hazards of chemical substances and mixtures. Adopted:10 May 2002.
- 22. Kennedy GL Jr, Ferenz RL, Burgess BAet al. Estimation of acute oral toxicity in rats by determination of the approximate lethal dose rather than the LD50. J Appl Toxicol 1986;6:145–8. [DOI] [PubMed] [Google Scholar]
- 23. Li W, Jiang H, Ablat Net al. Evaluation of the acute and sub-chronic oral toxicity of the herbal formula Xiaoer Chaigui Tuire oral liquid. J Ethnopharmacol 2016;189:290–9. [DOI] [PubMed] [Google Scholar]
- 24. Han Z-Z, Xu H-D, Kim K-Het al. Reference data of the main physiological parameters in control Sprague-Dawley rats from pre-clinical toxicity studies. Lab Anim Res 2010;26:153–64. [Google Scholar]