

Abstract
Benzene metabolites (HQ and BQ) are toxic compounds and their presence in human cause alteration in cellular respiration and kidney damage. In the current study, Saccharomyces cerevisiae has been used as a model organism and acute exposure of hydroquinone (HQ) decreased cell growth and increased reactive oxygen species (ROS). The expression of apoptosis regulatory genes (YCA1, NUC1, YSP1 and AIF1) were increased with HQ exposure in the wild-type cells. HQ exposure in the wild-type cells altered both the phospholipid and neutral lipid levels. Phosphatidylcholine is a vital membrane lipid that has a vital role in membrane biogenesis and was increased significantly with HQ. The neutral lipid results were supported with lipid droplets data and mRNA expression study. The phospholipid knockouts (Kennedy pathway) accumulated neutral lipids via the CDP-DAG (cytidine-diphosphate-diacylglycerol) pathway genes both in the presence and absence of HQ.
Keywords: phosphatidylcholine, benzene metabolites, triacylglycerol, steryl ester, hydroquinone, lipid droplets
Introduction
Hydroquinone (HQ, a benzene metabolite) is an environmental toxicant and a human carcinogen, present in the chemical industry, petroleum refineries, oil pipelines, cigarette smoke, automobile exhaust and skin whitening cream [1–3]. The US Cosmetic Ingredient Review [4] reported that <1% HQ is only safe to be used in cosmetic formulations and National Institute for Occupational Safety and Health (NIOSH) also has set a recommended exposure limit of HQ at 2 mg/m3 for 15 min and is health hazardous at the concentration of 50 mg/m [3, 5]. It is primarily metabolized in the liver and lungs, and secondary in bone marrow by cytochrome P450 2E1 (CYP2E1), and CYP2E1 knockout mice produce less hydroxylated metabolites [6, 7]. The 9, 10-phenanthrenequinone induces DNA deletions and canavanine-resistance forward mutations in the presence of oxygen [8]. Yeast S. cerevisiae is a well-established model organism to elucidate the cytotoxic mechanisms of several quinones [8–10] and the lipid metabolism, due to the well-known biochemical pathways, easily available gene knockout strains, and is similar to the mammalian system [11]. Multiple yeast orthologs of essential mammalian apoptotic proteins YCA1, NUC1, YSP1 and AIF1 have been identified. The YCA1 encodes for metacaspase and is structurally and functionally analogous to mammalian caspases [12]. NUC1 is a crucial mitochondrial death effector with endonuclease G activity [13] and is involved in cytochrome c release [14]. The mitochondrial protein Ysp1 is required for the mitochondrial thread-grain transition, de-energization and the cell death in yeast. The decline of cellular and organ function is associated with disturbed lipid homeostasis and altered lipid metabolism resulting in cell death [15].
In our earlier study, benzene metabolites {hydroquinone (HQ) and benzoquinone (BQ)} increased the ROS, damaged the macromolecules. BQ altered the lipid homeostasis in S. cerevisiae [9, 10]. HQ is hydroxylated benzene, which is further oxidized to para-benzoquinone [16], and in yeast acute exposure alters the phospholipids and neutral lipids [9], membrane integrity, and might also result in cell death [15]. Changes in phospholipids and specifically the PC metabolism are linked to apoptosis [17]. PC is the major phospholipid [18] serving as a structural component in S. cerevisiae [19]; and is synthesized either via the CDP-DAG (cytidine-diphosphate-diacylglycerol) pathway or the Kennedy pathway [20]. In the CDP-DAG pathway, PC is synthesized via the reactions catalyzed by PS synthase, PE methyltransferases (Cho2p and Opi3p). In the Kennedy pathway, PC is synthesized from choline via the reactions catalyzed by choline kinase (Cki1p), phosphocholine-cytidyltransferase (Pct1p), and choline phosphotransferase (Cpt1p) (Fig. 6) [18, 21]. We deleted the genes involved in the PC synthesis and tried to elucidate the impact on lipid homeostasis with acute HQ exposure.
Figure 6.

Schematic representation of hydroquinone induced lipid alteration.
Endoplasmic reticulum (ER) is involved in lipid biosynthesis and Lipid droplets (LD) formation; and addresses the functional, structural and metabolic aspects of the cell-compartment [22]. In yeast, the neutral lipids triacylglycerol (TAG) serves as a fatty acid donor for membrane and stored energy, along with sterol ester (SE) forms LDs [23]. This current study also might emphasize the toxic effect of HQ and its associated metabolic dysregulations on human beings and so for future perspectives, an increase in neutral lipid can be associated with biofuel production.
Materials and Methods
Chemicals
Yeast extract, peptone, dextrose, H2O2 (hydrogen peroxide), and HQ were purchased from Hi-media, India. Phospholipid standards were procured from Avanti Polar lipids, USA. Silica gel 60F254 TLC (thin layer chromatography) plates were purchased from Merck, India. Remaining all other chemicals and solvents were purchased from Sigma unless specifically mentioned. A stock solution of HQ was prepared with dimethyl sulphoxide (DMSO) as a solvent, and the final concentration of DMSO in the growth medium was 0.02% (v/v) and had no effect on yeast cells. Wild-type cells were treated with 0.02% DMSO (v/v) and are the control cells. The maximum concentration of HQ used in our study is 400 μM (44 mg/l = 0.044%) within the range used for humans [23].
Strains and culture conditions
The strains of S. cerevisiae wild-type BY4741 [MATα his3 Δ1 leu2 Δ0 met15 Δ0 ura3 Δ0], and single knockouts cho2Δ, opi3Δ, cki1Δ, cpt1Δ and pct1Δ were gifted by Prof. Ram Rajasekharan, CFTRI, India and this group procured the mutants from Euroscarf (European Saccharomyces cerevisiae archive for functional analysis, Germany). The gene names and abbreviations are mentioned in the previously published article [10]. The cho2opi3Δ double knockout was gifted by Anton i. p. M. de Kroon, Institute of Biomembranes, Utrecht University, the Netherlands. Yeast cells were grown in the YPD medium (1% yeast extract, 2% peptone and 2% dextrose) and incubated for 24 h (stationary phase) at 30°C with orbital shaking (120 rpm). Aliquot of 0.1 OD (A600 nm) cells were transferred to fresh YPD medium, and grown up to the late logarithmic phase (12 h) for all experiments, except for growth phenotypes and ROS studies. To analyze the growth phenotypes, the wild-type cells were grown for 6 h (until cells reached the exponential phase) at 30°C with orbital shaking of 120 rpm. The cells were then exposed to various concentrations (10–70 μg/ml) of H2O2 [22] or HQ (400 μM) and grown for 24 h. At the end of every 2 h, the OD (A600 nm) of cells was taken to check the growth pattern. In another set of experiments, cells were grown up to 12 h centrifuged, washed thrice with sterile double distilled water, and adjusted to 1.0 OD (A600 nm). Aliquots (3 μl) of 1:10 serial dilutions were applied to YPD solid media with or without H2O2 and HQ. Subsequently, for ROS studies, yeast cells were grown for 10 h (until cells reached the early logarithmic phase) and then exposed to 50 μM H2O2, and the cells were grown up to 12 h, which serves as a positive control for confirming the results with control and HQ exposure. H2O2, as an individual ROS, can diffuse freely into cells and is relatively more stable compared with O2•− and •OH and used as a positive control [25]. Subsequently, for ROS studies, yeast cells were grown for 10 h (until cells reached the early logarithmic phase) and then exposed to 50 μM H2O2, and the cells were grown up to 12 h, which serves as a positive control for confirming the results with control and HQ exposure.
Lipid extraction and quantification
Total lipids were extracted from yeast cells by the modified Bligh and Dyer method [24]. In short, chloroform, methanol and, 2% orthophosphoric acid were added to the cell pellet in the ratio 1:2:1 and vortexed. The upper organic phase containing the lipids was separated by centrifugation and dried under nitrogen and the different type of lipids separated [26]. Phospholipids were separated by two-dimensional TLC using chloroform/methanol/ammonia (65:25:5, v/v) in the first dimension and chloroform/methanol/acetone/acetic acid/water (50:10:20:15:5, v/v) in the second dimension. Individual separated phospholipid spots were scraped off from the plate and subjected to phosphorus quantification [27]. Neutral lipids were separated by single-dimensional TLC using petroleum ether/diethyl ether/acetic acid (70: 29: 1, v/v) and densitometric values were obtained using ImageJ software.
The mRNA expression studies by quantitative real-time polymerase chain reaction
The total RNA (DNase-treated) was isolated from yeast cells using the RNeasy kit from Qiagen. The total RNA (1 μg) was used to synthesize cDNA (First-strand cDNA Synthesis Kit, Applied Biosystem, India) with random hexadeoxy nucleotides and reverse transcriptase. Quantitative real-time polymerase chain reaction (qRT-PCR) was performed with LightCycler FastStart DNA Master PLUS SYBR Green I kit (Roche applied science, Meylan, France), according to the manufacturer’s instructions, and the data were analyzed with the ICycler IQ5 software. Gene expression was studied using the cycle threshold-based method [28]. The relative expression of each target gene was normalized with the reference gene, actin (Table 1).
Table 1.
Detail information of selected gene specific primers for mRNA expression
| S. No | Gene name | Full name | Primer sequence (5′-3′) |
|---|---|---|---|
| 1 | DGA1 | diacylglycerol acyltransferase | FP TGACTATCGCAACCAGGAATGT RP AACGCACCAAGTGCTCCTATG |
| 2 | LRO1 | lecithin cholesterol acyltransferase | FP CGTACAACCCTGCCGCCGGAAT RP GTCTACGTGTTCGGCGCTTT |
| 3 | ARE1 | acyl-CoA, sterol acyltransferase-1 | FP TGTTCCCCGTCCTCGTGTA RP CGCACACCTTCTCCAACACA |
| 4 | ARE2 | acyl-CoA, sterol acyltransferase-2 | FP GCAACTCACCAGCCAATGAA RP ATGCGACGTCTCCGTTTGA |
| 9 | ACT1 | Actin | FP GATATGGAAAAGATCTGGCATCATAC RP CGCCATTTTGAGAATCGATTTG |
Laser scanning confocal microscopy and dichlorodihydro-fluorescein diacetate estimation
Wild-type control and PC knockout yeast cells were washed and resuspended in phosphate-buffered saline (PBS). Wild-type cells were stained with Rhodamine B/Nile Red (0.0005% in PBS) for 15 min at room temperature in the dark, and the cells were washed six times with PBS to remove the surplus dye. After the washes with PBS buffer, cells were resuspended in 50 μl PBS and observed with a laser scanning confocal microscope. The measurements were carried out for Rhodamine B with an excitation (Ex) of 490 nm and emission (Em) of 516 nm and for Nile Red staining, with an excitation (Ex) of 490 nm and emission (Em) of 528 nm [29].
The ROS level was quantified using a nonpolar compound DCF-DA, which reacts with ROS to form the highly fluorescent dichlorofluorescein (DCF). The samples (100 mg) were incubated with Locke’s solution (NaCl 154 mmol, KCl 5.6 mmol, NaHCO3 3.6 mmol, HEPES 5.0 mmol (pH 7.4), CaCl2 2.0 mmol, glucose 10 mmol ml−1, containing DCF-DA 5 mmol ml−1 for 30 min at 37°C and the fluorescence was measured with Ex and Em wavelength at 480 nm and 530 nm [30]. ROS levels were also quantified from a DCF standard curve and expressed as pmol DCF (min/mg protein).
Statistical analysis
Statistical data were analyzed using the programs of SPSS 18.0 software (SPSS Inc., Chicago, IL, USA), and significant differences were determined by ANOVA test, and shown data were mean ± SD values from three independent experiments. GraphPad Prism 7 data processing software was used to perform statistical analyses and graph the data. The control cells were compared with the HQ and, or H2O2 exposed groups with a statistical significance of *P ≤ 0.05, **P ≤ 0.01, ***P ≤ 0.001.
Results
Exposure of hydroquinone on cell growth
To check the effect of H2O2 and HQ on wild-type cells, different concentrations of H2O2 (10–70 μM) and HQ (100–500 μM) were exposed (data not shown); from that 50 μM H2O2 treatment and 400 μM HQ exposure notably decreased the growth and viability of cells (Fig. 1). The growth of the cells with HQ exposure and H2O2 treatment was significantly reduced, when compared to wild-type control cells (Fig. 1).
Figure 1.

Assessment of cell viability. Cell growth was measured at A600 nm in the culture medium at frequent time intervals with H2O2 (50 μM) and HQ (400 μM) exposure. Cells were serially diluted in the presence or absence of H2O2 (50 μM) and HQ (400 μM) and incubated at 30°C for spot test.
Hydroquinone exposure increased the ROS in yeast cells
ROS determines the cellular redox status, and was measured using Rhodamine B staining. The staining was higher with the H2O2 and HQ exposed cells compared to wild-type control cells (Fig. 2a). Similarly, the DCF-DA estimation also depicted an increase of ROS levels, ~70% with H2O2, and ~30% with HQ (Fig. 2b).
Figure 2.
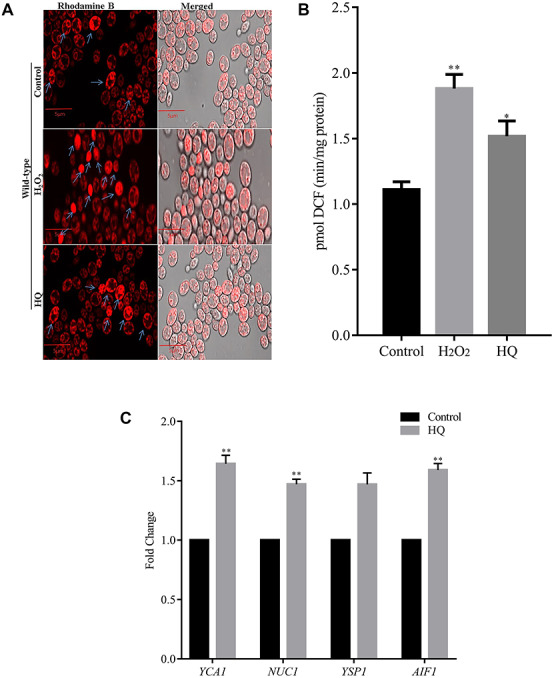
ROS evaluation by Rhodamine B staining. (a) ROS generation was assessed by the laser scanning fluorescent microscope using Rhodamine B staining. Arrow (↑) marks indicate Rhodamine-B stained cells. (b) ROS estimation—equal amount of cells were taken, and the pmol of DCF (min/mg protein) formed was calculated using a spectrophotometer. (c) The expression of apoptosis genes (YCA1, NUC1, YSP1 and AIF1) were studied by qRT-PCR.
Hydroquinone induces yeast cell death accompanied by the hallmarks of apoptosis
There was a reduction in cell growth with HQ exposure, and so, we studied the impact of HQ on apoptosis genes. In yeast, the stress is induced by increased ROS and results in apoptosis [31]. Here we studied the mRNA expression of yeast apoptosis inducible genes YCA1, NUC1, AIF1 and YSP1 upon HQ exposure. The mRNA expression of all apoptotic genes was significantly increased with HQ exposure, namely YCA1 (~0.63 fold), NUC1 (~0.48 fold), YSP1 (~0.46 fold) and AIF1 (~0.58 fold) with HQ exposure (Fig. 2c).
Increased lipid levels on hydroquinone exposure
The effect of HQ exposure on neutral lipid metabolism was explored, and we observed an increase in the TAG and a decrease in SE, sterol and free fatty acid in the wild-type cells (Fig. 3 a). In S. cerevisiae, four acyltransferase genes are involved in neutral lipid formation, the LRO1 and DGA1 form TAG [29], whereas the other two genes acyl-CoA sterol acyltransferase-1 (ARE1) and −2 (ARE2) are involved in SE formation [32]. Using the qRT-PCR analysis, the gene expression of DGA1 (~0.86 fold) and LRO1 (~1.13 fold) were upregulated, but the expression of ARE1 (~0.51 fold), and ARE2 (~0.66 fold) encoding the SE acyltransferases were down-regulated in HQ exposed cells supporting the TLC results (Fig. 3b).
Figure 3.
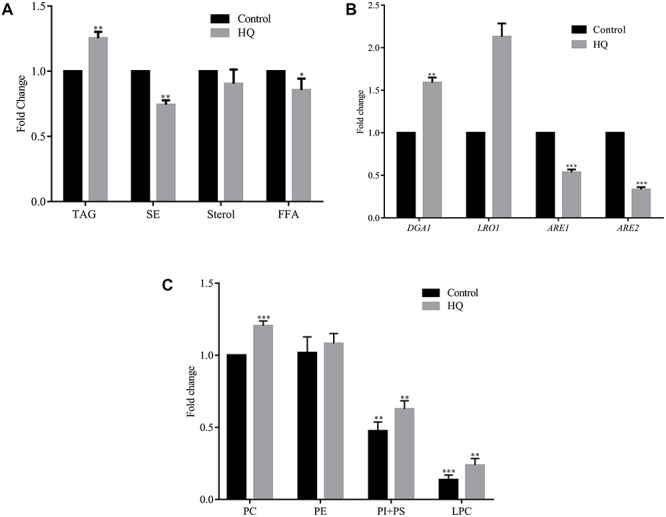
Effect of hydroquinone on lipid composition. Wild-type cells were grown in the presence or absence of HQ for 12 h, and the lipids were extracted and resolved on TLC. (a) The graphical representation of neutral lipids profile. (b) Neutral lipid synthesizing genes expression (DGA1, LRO1, ARE1 and ARE2) using qRT-PCR. (c) The figure shows the graphical representation of the phospholipid profile of wild-type cells.
The phospholipids, including the major phospholipids PC, PI and PS, were increased significantly with the HQ exposure (Fig. 3c). In lipid metabolism, there is a link between phospholipids and neutral lipids [18]. In the current study with HQ exposure, both the neutral lipids (TAG) and phospholipids were increased. So, using the PC knockouts we were interested in studying the neutral lipid pattern with HQ exposure. During the deletion of CDP-DAG pathway genes, the Kennedy pathway genes are active and vice-versa.
Neutral lipid profiles in the PC knockouts
In the absence of HQ, TAG levels in the Kennedy pathway knockouts were higher, whereas lower in the CDP-DAG knockouts (Fig. 4a and b), suggesting that TAG is mainly accumulated via the CDP-DAG genes. With HQ exposure also, TAG levels were increased in the wild-type control cells (~0.25 fold), opi3∆ (~0.58 fold), and the Kennedy pathway knockouts [cki1∆ (~0.25 fold), cpt1∆ (~0.28 fold), pct1∆ (~0.15 fold)], but decreased in the cho2∆ (~0.20 fold) and cho2opi3∆ (~0.43 fold) (Fig. 4a and b).
Figure 4.
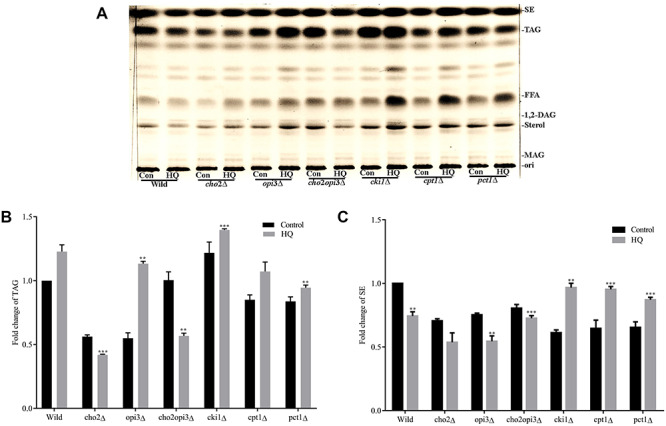
Neutral lipid levels in PC knockouts. PC knockouts of yeast were grown in the presence or absence of HQ for 12 h, and the lipids ware extracted and separated using TLC. Panels (d) and (e) show the quantity of TAG and SE in all the PC knockouts. Values were obtained using ImageJ software.
In the absence of HQ, SE level in the CDP-DAG pathway knockouts [cho2∆ (~0.25 fold), opi3∆ (~0.22 fold) and cho2opi3∆ (~0.10 fold) and Kennedy pathway knockouts [cki1∆ (~0.08 fold), cpt1∆ (~0.07 fold), pct1∆ (~0.10 fold)] were lower when compared with the WT control cells. In the presence of HQ exposure SE level was increased in the Kennedy pathway knockouts [cki1∆ (~0.35 fold), cpt1∆ (~0.30 fold), pct1∆ (~0.21 fold)] but decreased in the CDP-DAG pathway knockouts [cho2∆ (~0.25 fold), opi3∆ (~0.20 fold) (Fig. 4a and c).
Lipid droplet formation
Increased LD numbers with HQ exposure was observed in the wild-type, CDP-DAG pathway knockout (opi3∆, and Kennedy pathway knockouts [cki1∆, and cpt1∆] whereas decreased in some CDP-DAG pathway knockouts [cho2∆, and cho2opi3∆] (Fig. 5a and b, Table 2). Interestingly our quantitative results showed increased TAG levels, and LDs in the Kennedy pathway knockouts with HQ exposure and TAG and LDs were decreased in the CDP-DAG pathway knockouts (Figs. 4a and b and 5 a and b, and Table 2).
Figure 5.

Lipid droplet morphology studies with/without hydroquinone exposure. Cells were grown in YPD media for 12 h. Nile red-stained cells were observed under a fluorescence microscope as described in material and methods. (a) Wild-type, cho2∆, opi3∆, cho2opi3∆ (b) cki1∆, cpt1∆, pct1∆.
Table 2.
Number of LDs in wild-type cells and PC knockouts with exposure of HQ
| Average number of LDs/Cell | ||
|---|---|---|
| Strains | Control | HQ exposure |
| Wild-type | 9.4 ± 0.17 | 12.27 ± 0.47*** |
| cho2Δ | 5.62 ± 0.15 | 4.18 ± 0.56** |
| opi3Δ | 5.49 ± 0.51 | 8.33 ± 0.15*** |
| cho2opi3Δ | 10.04 ± 0.20 | 5.67 ± 0.26** |
| cki1Δ | 12.17 ± 0.3 | 13.97 ± 0.35** |
| cpt1Δ | 8.50 ± 0.26 | 10.72 ± 0.26** |
| pct1Δ | 8.37 ± 0.30 | 9.45 ± 0.25 |
* P < 0.05; **P < 0.01; ***P < 0.001; all the wild-type control cells were compared with HQ treatment (n = 20).
Discussion
The balance between oxidant and antioxidant in the system is essential for cellular homeostasis, and disruption in the antioxidant redox system results in the accumulation of ROS, such as super oxygen ions, H2O2 and hydroxy free radicals. ROS are detrimental to mammalian and yeast cells, due to the formation of oxidized cellular macromolecules, including lipids, proteins and DNA, thereby disrupting cellular function and initiating subsequent cell death via necrosis or apoptosis [11, 31, 33]. HQ at concentrations <200 μM had a moderate cytotoxic effect on the HepG2 cells and at 400 μM showed about 40% decrease in cell viability [34]. Exposure of glycolic acid and H2O2 also considerably reduced the growth rate of S. cerevisiae [35, 36]. The exposure of H2O2 and HQ reduced the cell growth (Fig. 1) and a similar reduction in cell growth was observed with benzene metabolites [9, 37].
Several quinone-derived drugs generate ROS through redox cycling. In yeast, apoptosis is a highly regulated cellular suicide program and dysfunction of apoptosis occurs during several diseases. AbA (aureobasidin A) administration was demonstrated to induce apoptotic cell death that was inhibited by deletion of the yeast metacaspase YCA1. The toxicity of cadmium-induced yeast caspase Yca1p [12]. A homolog of human AIF1, is mitochondrial apoptotic factor WAH1 in the C. elegans, and was affected during cell corpse engulfment [38]. In our laboratory, we observed that under cadmium exposure, NUC1 mRNA level was upregulated in yap1Δ cells (unpublished data). It is reported that the low doses of H2O2 increased ROS generation and induced apoptosis [12]. The current work showed that HQ exposure inhibited cell growth, increased ROS and enhanced apoptosis gene expression (Fig. 2a–c).
Apoptotic cell death was induced during ER stress, LD accumulation [39]. In Schizosaccharomyces pombe, blockage of TAG synthesis led to fatty acid accumulation and resulted in lipotoxicity and is dependent on ROS levels [40]. In the current study, we analyzed the effect of HQ on the neutral lipid and phospholipid composition in wild-type S. cerevisiae (Figs. 3 and 4). In the neutral lipid with HQ exposure, TAG was increased and SE was decreased (Fig. 3a). The upregulation of DGA1 and LRO1 [41] and downregulation of ARE1 and ARE2 genes suggested HQ increased the TAG and reduced the SE synthesis (Fig. 3b). The mRNA expression pattern supported the obtained TLC pattern (Figs. 3a and b and 4a–c). In our laboratory with Cd exposure, there was an accumulation of the major phospholipid PC, and also, the neutral lipid TAG was increased that resulted in LD accumulation in zrt2Δ yeast strain [42]. In the current study also, there was an increase in TAG and LDs that were accompanied by the accumulation of the major phospholipid PC with HQ exposure (Figs. 3c and 5 a and b, Table 2).
BQ exposure channelized the neutral lipids synthesis through the CDP-DAG pathway genes [10]. In the cells, with HQ exposure TAG levels were increased in the Kennedy pathway cki1∆, cpt1∆ and pct1∆ and was reduced in CDP-DAG knockout (cho2∆) (Fig. 4a and b and Table 2). SEs are the storage form of sterols, and in our study, the SE levels were also accumulated in the Kennedy pathway knockouts with HQ exposure compared to the control cells (HQ unexposed strains) (Fig. 4c), These results support our previously published data [10], and suggests TAG accumulation mainly took place via the CDP-DAG pathway genes both in the absence and presence of HQ. However, SE accumulation mainly took place via the CDP-DAG pathway genes in the absence and presence of HQ.
So, we believed that HQ accumulated ROS altered the membrane lipid PC, storage lipid TAG, and disturbed the defense mechanism against lipo-toxicity [43, 15] and also activates signaling pathways during stress conditions [44]. This current report demonstrated that CDP: DAG genes under HQ exposure is an effective strategy to improve the TAG production and is also an alternative approach in metabolic engineering to increase biofuel production in S. cerevisiae, and can contribute to the production of sustainable liquid fuel.
Summary
HQ decreased cell growth, increased ROS and increased the neutral lipid accumulation and was due to activation of the CDP-DAG pathway genes (Fig. 6). The present study attempts to understand the effect of HQ on neutral lipid alteration.
Acknowledgment
We acknowledge the infrastructure facilities from the DST-FIST of Biochemistry Department, DST-PURSE, and Life Sciences facilities of Bharathidasan University.
Contributor Information
Abhishek Raj, Biomembrane Lab, Department of Biochemistry, School of Life Sciences, Bharathidasan University, Tiruchirappalli 620024, Tamil Nadu, India; Department of Pediatric Surgery, Xin Hua Hospital, School of Medicine, Shanghai Jiao Tong University, Shanghai 200092, China.
Vasanthi Nachiappan, Biomembrane Lab, Department of Biochemistry, School of Life Sciences, Bharathidasan University, Tiruchirappalli 620024, Tamil Nadu, India.
Conflict of interest statement
None declared.
References
- 1. ATSDR ., Toxicological Profile for Benzene. http://www.atsdr.cdc.gov/toxprofiles/tp3.html. U.S. Department of Health and Human Services. 2007Agency for Toxic Substances and Disease Registry, Atlanta, GA: [PubMed] [Google Scholar]
- 2. Golding BT, Watson WP. Possible mechanisms of carcinogenesis after exposure to benzene. IARC Sci Publ 1999;150:75–88. [PubMed] [Google Scholar]
- 3. Cralley LV, Caplan K, Mutchler JEet al. In-plant practices for job related health hazards control. New York: John Wiley & Sons, 1989. [Google Scholar]
- 4. Andersen FA, Bergfeld WF, Belsito DVet al. Final amended safety assessment of hydroquinone as used in cosmetics. Int J Toxicol 2010;29:274–87. [DOI] [PubMed] [Google Scholar]
- 5. OSHA . Occupational Safety and Health Administration: Chemical Sampling Information: Hydroquinone. 2008. In http://www.osha.gov/dts/chemicalsampling/data/CH_246890.html. U.S. Department of labor, Washington, DC 20210, United States of America.
- 6. McHale CM, Zhang L, Martyn TS. Current understanding of the mechanism of benzene-induced leukemia in humans: implications for risk assessment. Carcinogenesis 2012;33:240–52. [DOI] [PMC free article] [PubMed] [Google Scholar]
- 7. Valentine JL, Lee SS, Seaton MJet al. Reduction of benzene metabolism and toxicity in mice that lack CYP2E1 expression. Toxicol Appl Pharmacol 1996;141:205–13. [DOI] [PubMed] [Google Scholar]
- 8. Rodriguez CE, Sobol Z, Schiestl RH. 9, 10-Phenanthrenequinone induces DNA deletions and forward mutations via oxidative mechanisms in the yeast Saccharomyces cerevisiae. Toxicol In Vitro 2008;22:296–300. [DOI] [PubMed] [Google Scholar]
- 9. Raj A, Nachiappan V. Exposure to benzene metabolites causes oxidative damage in Saccharomyces cerevisiae. Antonie Van Leeuwenhoek 2016;109:841–54. [DOI] [PubMed] [Google Scholar]
- 10. Raj A, Nachiappan V. Benzoquinone alters the lipid homeostasis in Saccharomyces cerevisiae. Toxicol Res 2019;8:1035–41. [DOI] [PMC free article] [PubMed] [Google Scholar]
- 11. Jeltsch A. Beyond Watson and Crick. DNA methylation and molecular enzymology of DNA methyltransferases. Chem Biochem 2002;3:274–93. [DOI] [PubMed] [Google Scholar]
- 12. Madeo F, Carmona-Gutierrez D, Ring Jet al. Caspase-dependent and caspase-independent cell death pathways in yeast. Biochem Biophys Res Commun 2009;382:227–31. [DOI] [PubMed] [Google Scholar]
- 13. Buttner S, Eisenberg T, Carmona-Gutierrez Det al. Endonuclease G regulates budding yeast life and death. Mol Cell 2007;25:233–46. [DOI] [PubMed] [Google Scholar]
- 14. Ludovico P, Sousa MJ, Silva MTet al. Côrte-real. Saccharomyces cerevisiae commits to a programmed cell death process in response to acetic acid. Microbiology 2001;147:2409–15. [DOI] [PubMed] [Google Scholar]
- 15. Garbarino J, Sturley SL. Saturated with fat: new perspectives on lipotoxicity. Curr Opin Clin Nutr Metab Care 2009;12:110–6. [DOI] [PubMed] [Google Scholar]
- 16. Snyder R, Hedli CC. An overview of benzene metabolism. Environ Health Perspect 1996;104:1165–71. [DOI] [PMC free article] [PubMed] [Google Scholar]
- 17. Rothman N, Haas R, Hayes RBet al. Benzene induces gene duplicating but not gene inactivating mutations at the glycophorin a locus in exposed humans. Proc Natl Acad Sci 1995;92:4069–73. [DOI] [PMC free article] [PubMed] [Google Scholar]
- 18. Paltauf F, Kohlwein SD, Henry SA. Regulation and compartmentalization of lipid synthesis in yeast. NY: Cold Spring Harbor Laboratory Press, 1992, 415–500. [Google Scholar]
- 19. Descatha A, Jenabian A, Conso Fet al. Occupational exposures and haematological malignancies: overview on human recent data. Cancer Causes Control 2005;16:939–53. [DOI] [PubMed] [Google Scholar]
- 20. Carman GM, Zeimetz GM. Regulation of phospholipid biosynthesis in the yeast Saccharomyces cerevisiae. J Biol Chem 1996;271:13293–6. [DOI] [PubMed] [Google Scholar]
- 21. Voelker DR. New perspectives on the regulation of inter membrane glycerophos- pholipid traffic. J Lipid Res 2003;44:441–9. [DOI] [PubMed] [Google Scholar]
- 22. Czabany T, Wagner A, Zweytick Det al. Structural and biochemical properties of lipid particles from the yeast Saccharomyces cerevisiae. J Biol Chem 2008;283:17065–74. [DOI] [PubMed] [Google Scholar]
- 23. Leber R, Zinser E, Zellnig G. Characterization of lipid particles of the yeast, Saccharomyces cerevisiae. Yeast 1994;10:1421–8. [DOI] [PubMed] [Google Scholar]
- 24. Siegers CP, Siegers JP, Pentz Ret al. Metabolism or arbutin from Uvae Ursi-extracts in humans. Pharm Lett 1997;7:90–2. [Google Scholar]
- 25. Ma L, Zhu W-Z, Liu T-Tet al. H2O2 inhibits proliferation and mediates suppression of migration via DLC1/RhoA signaling in cancer cells. Asian Pac J Cancer Prev 2015;16:1637–42. [DOI] [PubMed] [Google Scholar]
- 26. Bligh EG, Dyer WJ. A rapid method for total lipid extraction and purification. Can J Biochem Physiol 1959;37:911–7. [DOI] [PubMed] [Google Scholar]
- 27. Rouser G, Fleischer S, Yamamoto A. Two dimensional then layer chromatographic separation of polar lipids and determination of phospholipids by phosphorus analysis of spots. Lipids 1970;5:494–6. [DOI] [PubMed] [Google Scholar]
- 28. Simpson DA, Feeney S, Boyle Cet al. Retinal VEGF mrna measured by SYBR green I fluorescence: a versatile approach to quantitative PCR. Mol Vis 2000;6:178–83. [PubMed] [Google Scholar]
- 29. Kohlwein SD, Veenhuis M, Klei IJ. Lipid droplets and peroxisomes: key players in cellular lipid homeostasis or a matter of fat--store 'em up or burn 'em down. Genetics 2013;193:1–50. [DOI] [PMC free article] [PubMed] [Google Scholar]
- 30. Driver AS, Kodavanti PS, Mundy WR. Age-related changes in reactive oxygen species production in rat brain homogenates. Neurotoxicol Teratol 2000;22:175–81. [DOI] [PubMed] [Google Scholar]
- 31. Orrenius S, Nicotera P, Zhivotovsky B. Cell death mechanisms and their implications in toxicology. Toxicol Sci 2011;119:3–19. [DOI] [PubMed] [Google Scholar]
- 32. Lige B, Sampels V, Isabelle C. Characterization of a second sterol-esterifying enzyme in toxoplasma highlights the importance of cholesterol storage pathways for the parasite. Mol Microbiol 2013;87:951–67. [DOI] [PMC free article] [PubMed] [Google Scholar]
- 33. Castro FA, Mariani D, Panek ADet al. Cytotoxicity mechanism of two Naphthoquinones (Menadione and Plumbagin) in Saccharomyces cerevisiae. PLoS One 2008;3:e3999. [DOI] [PMC free article] [PubMed] [Google Scholar]
- 34. Yu MH, Lee SO. Hydroquinone stimulates cell invasion through activator protein-1-dependent induction of MMP-9 in HepG2 human hepatoma cells. Food Chem Toxicol 2016;89:120–5. [DOI] [PubMed] [Google Scholar]
- 35. Koivistoinen OM, Kuivanen J, Barth Det al. Glycolic acid production in the engineered yeasts Saccharomyces cerevisiae and Kluyveromyces lactis. Microb Cell Fact 2013;23:12–82. [DOI] [PMC free article] [PubMed] [Google Scholar]
- 36. Su J, Yu W, Gong Met al. Overexpression of a novel tumor metastasis suppressor gene TMSG1/LASS2 induces apoptosis via a caspase-dependent mitochondrial pathway. J Cell Biol 2015;116:1310–7. [DOI] [PubMed] [Google Scholar]
- 37. Wiemels J, Smith MT. Enhancement of myeloid cell growth by benzene metabolites via the production of active oxygen species. Free Radic Res 1997;30:93–103. [DOI] [PubMed] [Google Scholar]
- 38. Wang X, Wang J, Gengyo-Ando Ket al. C. elegans mitochondrial factor WAH-1 promotes phosphatidylserine externalization in apoptotic cells through phospholipid scramblase SCRM-1. Nat Cell Biol 2007;9:541–9. [DOI] [PubMed] [Google Scholar]
- 39. Kajiwara K, Muneoka T, Watanabe Yet al. Perturbation of sphingolipid metabolism induces endoplasmic reticulum stress-mediated mitochondrial apoptosis in budding yeast. Mol Microbiol 2012;86:1246–61. [DOI] [PubMed] [Google Scholar]
- 40. Zhang Q, Chieu HK, Low CPet al. Schizosaccharomyces pombe cells deficient in triacylglycerols synthesis undergo apoptosis upon entry into the stationary phase. J Biol Chem 2003;278:47145–55. [DOI] [PubMed] [Google Scholar]
- 41. Athenstaedt K. YALI0E32769g (DGA1) and YALI0E16797g (LRO1) encode major triacylglycerol synthases of the oleaginous yeast Yarrowia lipolytica. Biochim Biophys Acta 2011;1811:587–96. [DOI] [PMC free article] [PubMed] [Google Scholar]
- 42. Rajakumar S, Ravi C, Nachiappan V. Defect of zinc transporter ZRT1 ameliorates cadmium induced lipid accumulation in Saccharomyces cerevisiae. Metallomics 2016;8:453–60. [DOI] [PubMed] [Google Scholar]
- 43. Listenberger LL, Han X, Lewis SEet al. Triglyceride accumulation protects against fatty acid-induced lipotoxicity. Proc Natl Acad Sci 2003;100:3077–82. [DOI] [PMC free article] [PubMed] [Google Scholar]
- 44. Bell RM, Coleman RA. Enzymes of glycerolipid synthesis in eukaryotes. Annu Rev Biochem 1980;49:459–87. [DOI] [PubMed] [Google Scholar]