

Abstract
2-Naphthalene sulfonate (2NS) is a sulfonated aromatic compound and a momentous intermediate involved in the synthesis of dyes and surfactants. Thus, the present experiment was undertaken to evaluate the variation in biochemical constituents in liver and kidney of fresh water fish, Channa punctatus, after 2NS intoxication. After determination of lethal dose (LD) two sublethal doses, i.e. 0.33 mg/15 g body weight (one-half of LD50) and 0.16 mg/15 g b.w. (one-fourth of LD50) were selected for analyzing oxidative stress, genotoxicity and bioaccumulative potential of 2NS. Highest significant increase in oxidative stress and DNA damage in the exposed groups as compared with control group (P ≤ 0.05) was observed at 96 h. However, decreased values of all the studied parameters after 30 days indicate repair capacity of fish. In order to study the alterations observed in biomolecules including lipids, proteins and nucleic acids, histopathology along with spectroscopic analysis using attenuated total reflection-Fourier transform infrared was also performed for 96 h exposed group. In addition, protein secondary structure analysis was focused in this study, which reveals alterations in α-helix and β-sheet structure after 2NS intoxication. Furthermore, the bioaccumulative potential of 2NS was revealed using high-performance liquid chromatography showing 1.83 and 45.54 μg/ml concentration of 2NS in liver and kidney homogenate, respectively. As the study revealed 2NS as the potential health hazard to aquatic organisms, it entails the augmentation and adoption of pertinent policies regarding the management of such toxic compounds.
Keywords: 2-naphthalene sulfonate, oxidative stress, genotoxicity, ATR-FTIR, histopathology
Introduction
Accelerated growth in industrialization has boosted human interference, which leads to high imbalance in virtue of ecosystem, leading to environmental pollution [1]. During series of processes, the water comes into contact with harmful chemicals, heavy metals, inorganic wastes and even organic sludge [2], which gets dumped into rivers or other water bodies, resulting in accumulation of high amount of industrial waste in them. This affects the status of the ecosystem as well as the health of man, plants and animals. The water pollution due to industrial effluent or wastewater having high chemical oxygen demand and containing metals, inorganic nutrients, organic compounds, cyanides and dyes is one of the biggest problems [3]. Studies showed water pollution to be cause of several dreadful diseases including skin irritation, kidney failure, intestinal tract infection and cancer [4]. Thus, aquatic contamination has been considered as one of the critical issues [4–6]. Textile industries being major contributor in water pollution is of high concern. An average sized textile industry uses around 8000 chemicals and huge amount of water, which is 1.6 million liters per day for production of about 8000 kg of fabric. The textile industry has also been increasingly using chemical-based dyes due to their high stability and low cost in comparison with natural dyes [7]. The raw materials used to synthesize dyes are known as dye intermediates and are mostly derivatives of aromatic compounds [8]. Aromatic sulfonates are considered to be one of the most commonly used chemical agents in industrial processes as well as in consumer products. Since the end of 19th century, aromatic sulfonates that are generated in large quantity in chemical industry have been highly applied in several textile industrial processes. Among aromatic sulfonates, naphthalene sulfonates are important products of industrial chemical processes and applied widely in concrete finishing, industrial textile processing, tanning of hides, and in the manufacture of agrochemicals and pharmaceuticals [9, 10]. 2-Naphthalene sulfonate (2NS) is mainly used as dye intermediate of azo dyes and pigments. Its salt is also used as a brightening and stabilization agent in the electroplating solution of printed wiring board industry. It is specifically produced from the condensation process of naphthalene sulfonic acid and formaldehyde, mainly used as retan agent [11]. These compounds belonging to aromatic compounds carrying sulfonate as their functional group are also used as an intermediate for the production of sulfonated azo dyes [11]. The presence of C-SO3− imparts polar nature to aromatic sulfonates [12, 13], which obstruct their transport through cell membrane, rendering these compounds resistant to biodegradation by microbial species, leading to their accumulation. Ignoring the toxic impact of such intermediate compounds, industries are indiscriminately using these chemicals and discharging their effluent in the water bodies affecting aquatic fauna. Although the aromatic sulfonates have been produced and applied for a long time, little information is known about their toxicology and ecotoxicology.
2NS get discharged to the environment through various points and nonpoint sources including azo dye producing plants, naphthalene refinery processing plants and disposal sites, as well as wastewater treatment plants. Several studies performed indicate its presence in the ground water as well as surface water present in the vicinity of an aromatic sulfonate and dye chemical plants. In the study performed by Hamann et al. [14], 2NS was found among 247 contaminants in the Lek River. The study also highlighted the first-order degradation half-life of 2NS, which was reported to be <469 days, showing its potential to remain in the environment for such a long time. Further studies also revealed the occurrence of 2NS in seven samples from the Bormida River [15]. Study performed by Pan et al. [16] also considered 2NS as the representative pollutant in his data. Being discharged into aquatic environment from several sources and having long half-life, 2NS has become a serious issue of concern for the aquatic life.
Although huge data have been published listing the applications of 2NS, scanty research on its toxic potential has been published; thus in the light of above factors, the present study aims to evaluate toxic potential of 2NS in fresh water fish Channa punctatus. Along with it, recovery potential of fish was also evaluated. This study also provides us the insight into the application of modern technique, i.e. attenuated total reflection-Fourier transform infrared (ATR-FTIR), along with histopathology to distinguish and determine sublethal effects of potential toxins in the surroundings. ATR-FTIR technique is the most accomplished of all spectroscopic sampling techniques, as it demands very compact sampling preparation and can be used on any kind of samples possessing any morphology, while maintaining the structural integrity of the sample. It helps in identifying the structural variation of biomolecules [17–19]. Further target tissue of 2NS was also evaluated by studying bioaccumulation of 2NS in kidney and liver of fish.
Material and Methods
Model organism
The freshwater fish C. punctatus (weight 15.00 ± 2.00 g, length 12.00 ± 2.00 cm) were procured from local sources. The fishes were further acclimatized for 15 days and fed with commercial fish diet daily, rich in protein, carbohydrates, fats, vitamins and minerals (as mentioned on the pack), bought from local fish market of Amritsar. These were kept in rectangular glass aquaria of capacity 200 L provided with proper aerator systems. The water was changed daily in order to avoid any harm from the accumulated nitrogenous waste of the fish. Experiments were performed according to the guidelines for use and care of laboratory animals provided by the institutional ethical committee. The mean values of physicochemical parameters of water were determined, which comes out to be as follows: temperature 26.7°C, pH values 7.2 and dissolved oxygen 5.63, electrical conductivity 630 μs/cm and total dissolved solids 307 mg/L.
Test chemical
2NS having ≥95% purity was purchased from Himedia Research Laboratory, Mumbai, India (CAS No. 120-18-3). The stock solution of 2NS was prepared by dissolving 10 mg of 2NS in 10 ml of water, according to method of Earnest and Ajaghaku [20]. Further dilutions were prepared from this stock solution.
Experimental design
LD50 of 2NS was estimated for C. punctatus [21], and the value comes out to be 0.66 mg/15 g b.w., 0.33 mg/15 g b.w. (one-half of LD50) and 0.16 mg/15 g b.w. (one-fourth of LD50) were selected for further experiment. Two groups were taken in which one was control and other was treated. Fishes maintained in tap water were considered as control group, whereas fishes in which 2NS was intraperitoneally injected in the midline of the pelvic fins in a constant volume of water were considered as treated group. The experiment was performed in triplicates. To determine oxidative stress, different biomarkers including malondialdehyde (MDA) content, glutathione-S-transferase (GST), catalase (CAT), superoxide dismutase (SOD) activities and DNA damage were observed after acute exposure (24, 48, 72 and 96 h) and during recovery period (10, 20 and 30 days), and comparison was made with control group of fishes. No positive control was needed as the stock solution was prepared in water. Further ATR-FTIR study was performed in order to study the alterations in biochemical constituents in 96 h exposed fish. Other part of 96 h exposed sample tissues were used for histopathology. Finally accumulation of 2NS was studied in 0.33 mg/15 g b.w. exposed group for 1 month at different time intervals.
Biochemical parameters
Sample preparation
The tissues were blotted dry, weighed and minced very finely with small scissors. A total of 10% homogenate was prepared in ice cold 0.1 M phosphate buffer saline (PBS), pH 7.4.
Lipid peroxidation
The lipid peroxidation was determined according the method of Draper and Hadley [22].
CAT
CAT activity was evaluated by the method of Aebi [23]. Result obtained was in n moles of H₂O₂ decomposed/min/mg protein.
GST
GST activity was estimated according to Habig et al. [24]. Result was obtained as n moles of 1-chloro-2,4-dinitrobenzene (CDNB) and glutathione (GSH) conjugate formed/min/mg protein.
SOD
SOD activity was determined according to the method of Kono [25]. Result was obtained as units of SOD/mg protein.
Estimation of protein content
Protein content was estimated according to Bradford assay using Bovine serum albumin (BSA) as standard [26].
Genotoxicity
The alkaline single-cell gel electrophoresis assay was carried out using the method of Ahuja and Saran [27] with some modifications. In a neutral comet assay, the DNA is kept as double strands so that the assay is used to detect double-stranded breaks. In contrast, an alkaline comet assay is carried out at pH 8 and a denaturing step is included so that both single- and double-stranded breaks can be determined. Liver and kidney tissues were homogenized in PBS followed by centrifugation at 3000 rpm for 10 min. Microscope slides were coated with 1% normal melting point agarose and were incubated at 37°C overnight. Approximately 20 μl of the sample was mixed with 80 μl of low melting point agarose (LMPA 0.5%) and was layered on coated slides. Finally, the third layer of LMPA (0.5%) was poured on the slides and returned to the refrigerator at 4°C for another 10 min. After gel solidification, the slides were placed in lysis buffer for about 3 h in the refrigerator. After lysis, the slides were incubated for 20 min in electrophoretic buffer, followed by electrophoresis in the same buffer for 20 min at 300 mA and 24 volts. The slides were then neutralized with the neutralization buffer for 15 min and after overnight drying, the slides were stained with ethidium bromide and analyzed under a fluorescence microscope by using excitation filter 515–560 nm with barrier filter of 590 nm at 40× magnification. A total of 100 cells per treatment were scored.
ATR-FTIR
Kidney and liver of 96 h exposed fishes were washed in PBS and stored at −80°C. The tissues were kept in lyophilizer for 24 h. Furthermore, the samples were grounded to powder with the help of pestle and mortar and analysis was performed using a Cary 630 Spectrometer in the spectral range of 4000–400 cm−1 using an FTIR imaging system coded for 128 scans at eight resolution, taking total 30 s as measurement time. The diamond ATR sensor was cleaned with ethyl alcohol or acetone before each sample measurement. Each sample analysis was performed in triplicates.
Histopathology
Sample preparation for histopathology
Tissues isolated from both groups of fish were rinsed and cleaned in saline solution (0.75% NaCl). This step was followed by fixation, which was carried out in 10% formalin solution for 48 h. Furthermore, the tissues were processed through graded series of alcohols. Finally, the samples were cleared in xylene and embedded in paraffin wax. After sectioning (5 μm), staining was done with eosin and hematoxylin. Finally, the prepared sections were observed and photographed using light microscope.
Bioaccumulation studies
Sample preparation
A total of 20% aqueous tissue homogenates were prepared in cold 150 mM KCl. The homogenates were then centrifuged at 15 000 rpm for 10 min at 4°C, and the clear supernatant thus obtained was used further. To 150 μl aliquot of the clear tissue homogenates, a 300 μl of the deprotinizing agent (methanol) was added and the dispersion was vortexed for 2 min. The samples were centrifuged at 15 000 rpm for 10 min at 4°C. The supernatant was collected and an equal volume of mobile phase was added to the clear supernatant. The samples were filtered (0.20 μm nylon filters) and were injected into the high-performance liquid chromatography (HPLC) system. Sample was prepared according to Bhandari and Kaur [28] methodology.
HPLC method
Shimadzu Prep HPLC System, equipped with fraction collector and ultraviolet/visible detector, was used for the present analysis, with C18 column. Acetonitrile and water was used as mobile phase in the ratio of 30:70 with the flow rate of 1 ml/min. The column was maintained at 30°C. Prior to use, solvents chosen as mobile phase were filtered through Millipore 0.45 μm. The detection wavelength of the detector was set at 270 nm. For HPLC analysis of aqueous stock solution of 2NS was prepared (1 mg/1 ml). Working standard solutions were prepared by gradual dilutions of stock solution each day with the mobile phase. Standard curves were plotted and using peak areas of known concentrations, quantification of 2NS in samples was performed.
Specificity of retention time for 2NS and method validation
Three replicates from the same sample of tissues were prepared, which were subjected to extraction described above. Exposed sample was run along with blank and standard solution. The peak area versus concentration data were used for the further analysis. Method developed was analyzed by using calibration curve.
Accuracy of method
The accuracy of the method was evaluated by studying the fortified samples for known concentration of 2NS in triplicate.
Statistical analysis
Statistical analysis was performed using SPSS 16.0. All data were presented as mean ± standard error. One-way analysis of variance followed by post hoc Tukey’s test was used to study the significant difference between control and treated groups.
Results
Markers of oxidative stress
The toxic effect of 2NS was observed by measuring oxidative stress in liver and kidney tissue samples of fish after treatment with both concentrations at different time intervals. Different oxidative stress markers were assessed for acute study till 96 h of exposure as well as for repair studies up to 30 days. The results (Tables 1 and 2) obtained show dose as well as time-dependent significant increase (P < 0.05) in the biochemical parameters after acute exposure in fish tissues. However, evident recovery was obtained after 30 days of exposure.
Table 1.
Effect of 2NS on MDA level and activities of different antioxidant enzymes in kidney and liver tissues of C. punctatus after different hours of exposure
| MDA level (n moles MDA/mg protein) | ||||||||
|---|---|---|---|---|---|---|---|---|
| Tissue | 24 h | 48 h | 72 h | 96 h | 10 days | 20 days | 30 days | |
| Kidney | Control | 1.25 ± 0.03a,p | 1.31 ± 0.09a,p | 1.44 ± 0.18a,p | 1.44 ± 0.18a,p | 1.57 ± 0.18a,p | 1.36 ± 0.22a,p | 1.44 ± 0.18a,p |
| 0.16 mg/15 g b.w. | 1.75 ± 0.04b,p | 1.89 ± 0.06b,p | 2.39 ± 0.31a,p | 2.61 ± 0.38a,p | 2.56 ± 0.41a,p | 1.58 ± 0.09a,p | 1.52 ± 0.15a,p | |
| 0.33 mg/15 g b.w. | 2.74 ± 0.04c,pq | 3.29 ± 0.16c,qr | 4.36 ± 0.19b,r | 5.99 ± 0.35b,s | 4.14 ± 0.38b,r | 2.71 ± 0.26b,pq | 1.86 ± 0.12a,p | |
| Liver | Control | 2.58 ± 0.29a,p | 2.52 ± 0.07a,p | 2.69 ± 0.04a,p | 2.64 ± 0.03a,p | 2.62 ± 0.05a,p | 2.72 ± 0.52a,p | 2.65 ± 0.02a,p |
| 0.16 mg/15 g b.w. | 2.19 ± 0.06a,pq | 2.72 ± 0.12a,pqr | 3.24 ± 0.13a,qr | 3.7 ± 0.19b,r | 2.87 ± 0.5a,pqr | 2.29 ± 0.1a,pq | 2.13 ± 0.13a,p | |
| 0.33 mg/15 g | 4.54 ± 0.18b,pq | 3.89 ± 0.04b,pqr | 4.21 ± 0.29b,pq | 4.93 ± 0.05c,p | 3.4 ± 0.2a,qrs | 2.94 ± 0.48a,rs | 2.38 ± 0.25a,s | |
| Catalase activity/mg protein | ||||||||
| Kidney | Control | 559.9 ± 11.49a,p | 541.5 ± 8.55a,p | 546.75 ± 4.43a,pq | 573.03 ± 15.85a,qr | 5.81.2 ± 3.26a,r | 574.39 ± 5.8a,qr | 565.19 ± 14.56a,pq |
| 0.16 mg/15 g b.w. | 513.47 ± 6.49ab,pq | 508.03 ± 4.39ab,pq | 506.28 ± 3.32a,pq | 452.07 ± 21.31b,q | 508.29 ± 17.44b,p | 530.16 ± 23.82a,pq | 535.58 ± 22.97a,p | |
| 0.33 mg/15 g | 467.92 ± 15.53b,pq | 469.27 ± 27.1b,p | 421.44 ± 17.06b,p | 407.73 ± 0.33b,p | 506.28 ± 2.3b,p | 528.16 ± 25.17a,p | 528.77 ± 8.35a,q | |
| Liver | Control | 554.56 ± 27.82a,p | 555.76 ± 28.02a,p | 562.64 ± 30.29a,pq | 555.76 ± 28.02a,qr | 547.76 ± 27.66a,r | 561.72 ± 29.73a,qr | 558.53 ± 28.67a,pq |
| 0.16 mg/15 g b.w. | 408.81 ± 3.55ab,pq | 380.66 ± 5.8ab,pq | 435 ± 10.08a,pq | 441.5 ± 5.57b,q | 421.81 ± 5.5b,pq | 508.38 ± 23.82a,pq | 528.16 ± 3.42a,p | |
| 0.33 mg/15 g | 329.61 ± 19.49b,pq | 355.46 ± 18.82b,p | 335.47 ± 16.83b,p | 321.9 ± 15.37b,p | 354.71 ± 21.99b,p | 322.05 ± 15.85a,p | 444.72 ± 15.56a,q | |
| SOD (U/mg protein) | ||||||||
| Kidney | Control | 18.37 ± 0.69a,p | 18.06 ± 0.96a,p | 17.69 ± 1.3a,p | 18.28 ± 0.76a,p | 18.3 ± 0.75a,p | 18.9 ± 0.41a,p | 18.28 ± 0.76a,p |
| 0.16 mg/15 g b.w. | 16.88 ± 0.66ab,pq | 15.22 ± 0.61ab,pqr | 13.32 ± 0.5b,r | 13.22 ± 0.56b,r | 14.7 ± 0.56b,qr | 16.63 ± 0.36b,pq | 17.44 ± 0.27a,p | |
| 0.33 mg/15 g | 15.44 ± 0.44b,pq | 13.41 ± 0.65b,qrs | 11.62 ± 0.66b,s | 11.26 ± 0.61b,s | 12.77 ± 0.53b,rs | 14.47 ± 0.38c,qr | 17.36 ± 0.31a,p | |
| Liver | Control | 17.73 ± 0.49a,p | 17.32 ± 0.87a,p | 17.56 ± 0.65a,p | 18.39 ± 0.3a,p | 17.37 ± 0.83a,p | 17.04 ± 1.15a,p | 18.67 ± 0.53a,p |
| 0.16 mg/15 g b.w. | 17.61 ± 0.32a,p | 14.51 ± 0.58ab,q | 13.34 ± 0.45b,rs | 11.4 ± 0.74b,s | 13.82 ± 0.48b,qrs | 15.62 ± 0.73a,pqr | 16.55 ± 0.64ab,pq | |
| 0.33 mg/15 g | 14.67 ± 0.35b,p | 12.56 ± 0.64b,qr | 10.88 ± 0.05b,r | 10.78 ± 0.05b,r | 11.68 ± 0.48b,r | 13.74 ± 0.51a,pq | 15.59 ± 0.4b,p | |
| GST activity (n moles of CDNB-GSH conjugate formed/min/mg protein) | ||||||||
| Kidney | Control | 247.85 ± 6.46a,p | 262.04 ± 2.91a,p | 256.34 ± 5.12a,p | 266.22 ± 7.37a,pq | 255.45 ± 1.89a,q | 265.54 ± 8.58a,pq | 268.44 ± 7.25a,pq |
| 0.16 mg/15 g b.w. | 290.97 ± 3.45ab,pqrs | 313.45 ± 3.15b,qrs | 340.24 ± 8.53b,s | 362.47 ± 6.2b,rs | 327.03 ± 16.53a,pq | 306.11 ± 2.16a,pq | 284.77 ± 15.98a,p | |
| 0.33 mg/15 g | 296.41 ± 2.52b,qr | 334.11 ± 9.52b,r | 357.9 ± 17.4b,r | 391.97 ± 4.67b,r | 341.33 ± 5.82a,pq | 320.63 ± 6.06a,q | 293.87 ± 6.17a,q | |
| Liver | Control | 377.15 ± 5.61a,p | 383.08 ± 0.85a,p | 382.8 ± 4.02a,p | 363.04 ± 9.03a,pq | 319.13 ± 9.34a,q | 345.61 ± 22.76a,pq | 351.18 ± 6.68a,pq |
| 0.16 mg/15 g b.w. | 422.71 ± 14.87ab,pqrs | 432.9 ± 14.36b,qrs | 486.11 ± 21.73b,s | 457.16 ± 22.37b,rs | 384.2 ± 4.02a,pqr | 361.33 ± 11a,pq | 353 ± 14.85a,p | |
| 0.33 mg/15 g | 458.99 ± 10b,qr | 461.74 ± 9.98b,r | 507.87 ± 24.85b,r | 486.08 ± 13.96b,r | 384.4 ± 28.49a,pq | 380.4 ± 6.92a,q | 370.4 ± 6.92a,q | |
The degree of significance was p ≤ 0.05.
Results are provided in mean values along with standard errors (SE). Different letters a, b, c signify effect of concentration and p, q, r and s signify the effect of duration.
Table 2.
Tail length and tail moment in liver and kidney of C. punctatus exposed to different concentrations of 2NS for different hours
| Tail length (μm) | ||||||||
|---|---|---|---|---|---|---|---|---|
| Tissue | 24 h | 48 h | 72 h | 96 h | 10 days | 20 days | 30 days | |
| Liver | Control | 22.7 ± 0.20a,p | 22.63 ± 0.56a,p | 23.46 ± 0.60a,p | 23.66 ± 0.69a,p | 24.20 ± 1.28a,p | 23.43 ± 0.52a,p | 23.03 ± 0.44a,p |
| 0.16 mg/15 g b.w. | 24.86 ± 0.69b,p | 26.10 ± 0.30b,pq | 27.33 ± 0.39b,pq | 30.13 ± 0.51b,q | 26.63 ± 0.86a,pq | 20.43 ± 1.85a,r | 23.33 ± 0.84a,pr | |
| 0.33 mg/15 g b.w. | 27.86 ± 0.69c,p | 29.60 ± 0.36c,pq | 32.20 ± 0.75c,q | 37.20 ± 0.32c,r | 29.13 ± 1.23a,pq | 21.76 ± 0.60a,s | 20.56 ± 0.75a,s | |
| Kidney | Control | 20.80 ± 0.43a,p | 21.06 ± 0.31a,p | 20.83 ± 0.13a,p | 20.87 ± 0.49a,p | 21.06 ± 0.31a,p | 19.97 ± 0.46a,p | 19.34 ± 0.75a,p |
| 0.16 mg/15 g b.w. | 21.36 ± 0.32a,p | 22.31 ± 0.41a,pq | 23.54 ± 0.42a,q | 26.53 ± 0.65b,r | 24.41 ± 0.36b,qr | 19.97 ± 0.46a,p | 21.03 ± 0.54a,p | |
| 0.33 mg/15 g b.w. | 23.26 ± 0.32b,p | 24.94 ± 0.08b,pq | 30.33 ± 1.15b,r | 37.54 ± 0.42c,s | 26.97 ± 0.69c,q | 21.96 ± 0.63a,ps | 20.94 ± 0.58a,s | |
| Tail moment (μm) | ||||||||
| Liver | Control | 4.19 ± 0.25a,p | 4.69 ± 0.06a,p | 4.37 ± 0.42a,p | 4.35 ± 0.32a,p | 4.08 ± 0.48a,p | 4.48 ± 0.19a,p | 4.60 ± 0.14a,p |
| 0.16 mg/15 g b.w. | 5.14 ± 0.29a,pq | 5.73 ± 0.44b,pq | 5.79 ± 0.55a,q | 8.23 ± 0.61b,r | 6.55 ± 0.22b,qr | 4.94 ± 0.11a,pq | 3.76 ± 0.50a,p | |
| 0.33 mg/15 g b.w. | 5.48 ± 0.25b,p | 7.30 ± 0.29b,pq | 7.52 ± 0.37b,pq | 11.74 ± 0.92c,r | 8.79 ± 0.61c,q | 6.96 ± 0.12b,pq | 6.81 ± 0.60b,pq | |
| Kidney | Control | 4.13 ± 0.34a,p | 3.54 ± 0.21 a,p | 3.84 ± 0.08 a,p | 4.09 ± 0.31 a,p | 3.57 ± 0.24 a,p | 4.11 ± 0.30 a,p | 3.74 ± 0.03 a,p |
| 0.16 mg/15 g b.w. | 4.89 ± 0.07a,pq | 5.80 ± 0.55b,pq | 6.31 ± 0.60a,q | 6.87 ± 0.08b,q | 6.31 ± 0.61b,q | 5.21 ± 0.60a,pq | 3.63 ± 0.31a,p | |
| 0.33 mg/15 g b.w. | 4.37 ± 0.37 a,p | 5.99 ± 0.57b,pq | 6.84 ± 1.04a,q | 6.89 ± 0.10b,q | 7.71 ± 0.30b,q | 6.94 ± 0.08b,q | 7.27 ± 0.32b,q | |
The degree of significance was P ≤ 0.05.
Results are provided in mean values along with standard errors (SE). Different letters a, b, c signify effect of treatment at the same time interval and p, q, r signify effect of concentration at different hours of exposure (one-way ANOVA).
Significant increase in MDA as well as GST activity was observed till 96 h of exposure of 2NS in kidney as well as liver. In kidney, 315.97%, and in liver, 86% increase in MDA content as compared with control have shown the oxidative stress induced by 2NS administration. In liver, MDA level increased after 24 h of exposure, thereafter decrease in MDA level at 48 and 72 h was observed. At 96 h, maximum MDA level, i.e. 4.93 n moles/mg protein, was obtained after exposure to higher dose. Significant increase in GST activity was also observed in both the tissues. In kidney, 32.08% increase as compared with control after treatment with highest dose, i.e. 0.33 mg/15 g b.w., was observed after 96 h of exposure, whereas in liver, maximum increase was observed at 72 h of exposure, i.e. 24.62% as compared with control group. CAT and SOD activity showed dose- as well as time-dependent significant decrease (P < 0.05) till 96 h of exposure in kidney as well as liver. In kidney, 28.84% reduction in CAT and 38.40% reduction in SOD activities were observed, whereas in liver, 42.02 and 41.38% decrease was observed in CAT and SOD activity, respectively. However, no significant difference between control and treated group in any of the biochemical markers was observed at 30 days of exposure, showing recovery in fish.
Genotoxicity
The results of comet assay have been given in Table 2. Tail length (TL) and tail moment (TM) were considered as parameters for assessing the genetic damage. Significant increase in the values of both the parameters was observed in liver and kidney cells of treated groups as compared with control groups. In case of liver tissue, significant increase in the TL was observed at 24 h of exposure and the maximum increase (37.20 ± 0.32) was seen at 96 h of exposure with the highest concentration (0.33 mg/15 g b.w.) of 2NS, which is 1.63 times as compared with control (22.7 ± 0.20). TM also increased significantly with the duration of exposure, and maximum increase (11.74 ± 0.92) was observed at 96 h with the highest concentration of 2NS. Similarly in the kidney tissue, significant increase in the values of both the parameters was observed with maximum increase at 96 h. TL value comes out to be 37.54 ± 0.42 and TM was 6.89 ± 0.10, showing 1.79 and 1.68 times increase, respectively, as compared with control. Thereafter, values of both the parameters decreased after 20 days for both the tissues, and at 30 days of exposure, no significant difference was observed as compared with control, thus showing recovery in fish.
ATR-FTIR analysis
For the present investigation, FTIR-ATR study was performed to study the effect of 2NS on biochemical components of kidney and liver of C. punctatus exposed to both concentrations. FTIR spectrums of control and the treated fish kidney and liver tissues, respectively, were recorded in 4000–400 cm−1 region, and the principal absorption bands were selected for analysis, which are defined in detail in Table 3 [29–34]. Different bands were picked and their absorption intensities were taken for comparison between control and treated organisms to determine variation in biochemical constituents.
Table 3.
General band assignments of the FTIR spectra
| Wavenumber (cm−1) | ||
|---|---|---|
| Lipids | 1468, 1461 | CH3-asymmetric bending: mainly lipids |
| 1736 | Carbonyl C=O stretch: lipids | |
| 3011 | Olefinic HC=CH stretch: lipids | |
| 2959, 2958 | CH3-asymmetric stretch: mainly lipids | |
| 2851, 2855 | CH2-asymmetric stretch: mainly lipids | |
| Nuclei acids | 1237 | PO2 asymmetric stretch: mainly nucleic acids |
| 1170 | CO-O-C asymmetric stretching: phospholipids | |
| 1080 | PO2-symmetric stretching: mainly nucleic acids | |
| 961–964 | C-N + -C stretch: nucleic acids | |
| Proteins | 1653, 1654 | Amide I: C=O stretching of proteins |
| 1550, 1543 | Amide II: N-H bending/C-N stretching of proteins | |
| 3302 | Amide A: mainly N-H stretching of proteins |
The quantitative relationship between control and treated group with respect to ratio of peak intensity of each band was used to differentiate normal tissue from diseased tissue. Table 4 shows the ratio of absorption of bands observed. The mean ratio of the absorption intensities of the bands observed at 1543 and 3284 cm−1 (I1543/I3284) was used as a quantification tool of the protein in the tissues. In liver tissues, decrease in this ratio (I1543/I3284) shows reduction in protein content in the membrane of intoxicated cells. After administration of highest dose, 10.55% significant reduction in protein content in liver was observed, whereas 1.93% reduction was observed in kidney.
Table 4.
Alterations in different peak intensities of biochemical constituents in kidney and liver tissues of C. punctatus after treatment with 2NS
| Liver | Kidney | ||||||
|---|---|---|---|---|---|---|---|
| Wavenumber(cm−1) | Control | Group 1 | Group 2 | Control | Group 1 | Group 2 | |
| Lipids | 1468 | 0.17 ± 0.003a | 0.15 ± 0.003b | 0.15 ± 0.003b | 0.17 ± 0.003a | 0.15 ± 0.003b | 0.15 ± 0.003b |
| 1461 | 0.20 ± 0.003a | 0.17 ± 0.003b | 0.17 ± 0.003b | 0.17 ± 0.005a | 0.17 ± 0.003a | 0.16 ± 0.006a | |
| 3011 | 0.10 ± 0.003a | 0.10 ± 0.005ab | 0.86 ± 0.003b | 0.37 ± 0.038a | 0.12 ± 0.008b | 0.10 ± 0.008b | |
| 2959 | 0.13 ± 0.003a | 0.13 ± 0.003a | 0.12 ± 0.003a | 0.15 ± 0.003a | 0.13 ± 0.003b | 0.12 ± 0.003b | |
| 2855 | 0.12 ± 0.003a | 0.13 ± 0.003a | 0.13 ± 0.003a | 0.13 ± 0.003a | 0.13 ± 0.003a | 0.13 ± 0.008a | |
| 1736 | 0.04 ± 0.003a | 0.05 ± 0.008a | 0.06 ± 0.003b | 0.05 ± 0.003a | 0.06 ± 0.003a | 0.05 ± 0.008a | |
| 1654 | 0.35 ± 0.003a | 0.31 ± 0.003b | 0.32 ± 0.003b | 0.34 ± 0.003a | 0.32 ± 0.003b | 0.32 ± 0.003b | |
| Proteins | 1543 | 0.35 ± 0.005a | 0.28 ± 0.003b | 0.28 ± 0.003b | 0.32 ± 0.008a | 0.29 ± 0.005ab | 0.27 ± 0.014b |
| 1550 | 0.32 ± 0.003a | 0.26 ± 0.003b | 0.26 ± 0.005b | 0.31 ± 0.003a | 0.27 ± 0.005b | 0.26 ± 0.008b | |
| 3302 | 0.20 ± 0.003a | 0.19 ± 0.003a | 0.16 ± 0.003b | 0.20 ± 0.003a | 0.19 ± 0.005a | 0.19 ± 0.003b | |
| 1237 | 0.20 ± 0.003a | 0.19 ± 0.005ab | 0.18 ± 0.003b | 0.19 ± 0.003a | 0.18 ± 0.003a | 0.19 ± 0.008a | |
| Nucleic acids | 1170 | 0.16 ± 0.003a | 0.15 ± 0.003a | 0.15 ± 0.003a | 0.17 ± 0.005a | 0.16 ± 0.003a | 0.16 ± 0.003a |
| 1080 | 0.34 ± 0.003a | 0.29 ± 0.003b | 0.25 ± 0.008c | 0.37 ± 0.010a | 0.33 ± 0.008ab | 0.29 ± 0.008b | |
| 961 | 0.21 ± 0.005a | 0.20 ± 0.005a | 0.18 ± 0.006b | 0.25 ± 0.008a | 0.16 ± 0.005b | 0.17 ± 0.005b | |
The values are the mean ± SE for each group (n = 3). Comparisons were done by ANOVA followed by post hoc Tukey’s test. The degree of significance was P < 0.05. Group 1 represents group of fishes exposed to 0.16 mg/15 g b.w., which is one-fourth of LD50, and group 2 represents group of fishes exposed to 0.33 mg/15 g b.w., which is one-half of LD50.
Different letters a, b, c signify effect of concentration.
Band (I2956/I2853) attribute to the alterations observed in methyl and methylene band. The significant reduction of 20.89% was observed in case of kidney, whereas in liver tissues, 3.81% reduction was obtained in case of group 2. The decreases in the ratio indicate a decrease in the number of methyl groups in protein fibers compared with methylene groups in 2NS intoxicated tissues.
Benedetti et al. [34] study suggest the mean ratio of absorption obtained at 1543 and 1652 cm−1 band attributes the variation in whole protein pattern. The 14.85% prominent significant reduction obtained in (I1543/I1652) in liver tissues shows the profound effect on protein structure; 3.92% reduction was observed in case of kidney tissues after the administration of highest dose.
The change in the composition of the glycoprotein is mainly revealed by the mean ratio of the intensities of the bands at 1082 and 1543 cm−1. Significant increase was observed in liver by 35.89% and in kidney by 34.21% in group 2. Results presented in Table 5 show that 2NS exposure leads to significant decrease in β-sheet and turns structures, as in liver, 16.3% absorption decreases, and in kidney, 14.28% reduction in absorption, indicating alterations in proteins, reduction in beta-structured proteins. Reduction in α-helix and random coil structures is also observed. This alteration implies that 2NS intraperitoneal administration leads to the disordering of protein secondary structures. The results obtained from the present study revealed that 2NS intoxication induces significant alterations in the major constituents such as proteins and lipids of the tissues of C. punctatus.
Table 5.
Band intensities for selected bands and intensities of specific peaks presenting protein structure of control and 2NS treated tissues of C. punctatus
| The average FTIR absorption intensity ratios for selected bands | |||||||
|---|---|---|---|---|---|---|---|
| Kidney | Liver | ||||||
| Ratio of bands | Control | Group 1 | Group 2 | Control | Group 1 | Group 2 | |
| I1543/I3284 | 1.55 ± 0.028a | 1.74 ± 0.023b | 1.52 ± 0.012a | 1.61 ± 0.008a | 1.61 ± 0.005a | 1.44 ± 0.008b | |
| I2956/2853 | 1.34 ± 0.023a | 1.14 ± 0.012b | 1.06 ± 0.005c | 1.05 ± 0.012a | 1.03 ± 0.020a | 1.01 ± 0.016a | |
| I1543/I1652 | 1.01 ± 0.005a | 0.97 ± 0.050b | 1.09 ± 0.050c | 1.01 ± 0.006a | 0.90 ± 0.005b | 0.86 ± 0.017b | |
| I1082/I1543 | 0.75 ± 0.008a | 1.13 ± 0.008b | 1.14 ± 0.008b | 0.75 ± 0.029a | 1.04 ± 0.007b | 1.17 ± 0.005c | |
| The peak centers and the absorption intensity of main protein secondary structures | |||||||
| Kidney | Liver | ||||||
| Absorption intensity | |||||||
| Structure | Peak centers (cm−1) | Control | Group 1 | Group 2 | Control | Group 1 | Group 2 |
| α-Helix | 1654 | 0.38 ± 0.005a | 0.34 ± 0.008b | 0.31 ± 0.005c | 0.33 ± 0.008a | 0.34 ± 0.005a | 0.32 ± 0.005a |
| β-Sheet | 1625, 1632, 1684 | 0.98 ± 0.016a | 0.86 ± 0.018b | 0.84 ± 0.019b | 0.92 ± 0.011a | 0.77 ± 0.018b | 0.77 ± 0.018b |
| Turns and bends | 1662, 1669 | 0.54 ± 0.008a | 0.55 ± 0.016a | 0.47 ± 0.010b | 0.52 ± 0.010a | 0.47 ± 0.013b | 0.46 ± 0.008b |
| Random coils | 1647 | 0.41 ± 0.008a | 0.38 ± 0.005b | 0.35 ± 0.005b | 0.40 ± 0.005a | 0.34 ± 0.012b | 0.34 ± 0.008b |
The degree of significance was P ≤ 0.05.
Results are provided in mean values along with standard errors (SE). Different letters a, b, c signify effect of treatment at the same time interval (one-way ANOVA).
Histopathology
The results observed revealed the histopathological alterations observed in studied tissues (liver and kidney) after intraperitoneal administration of 2NS. Liver and kidney histopathology of control fish revealed normal histological frame without indication of any damages and deformities; however, the 96 h 2NS-administered fish tissues revealed areas of necrosis and vacuolization in liver tissue and necrosis and tubular degeneration in kidney tissue revealing toxic potential of 2NS (Fig. 1).
Figure 1.

Histopathology slides of kidney (A–B) and liver (C–D) (×100) A: Control B: Treated.
Bioaccumulation of 2NS and specificity of method
In Fig. 2, representative chromatograms of 2NS standard, a control blank sample and sample from exposed fish, respectively, are shown. The specificity of the method was observed by comparing these three chromatograms. The retention time was found to be 8.39 min and the detector wavelength was 270 nm. The correlation coefficient was found to be 0.9914 (P < 0.05).
Figure 2.
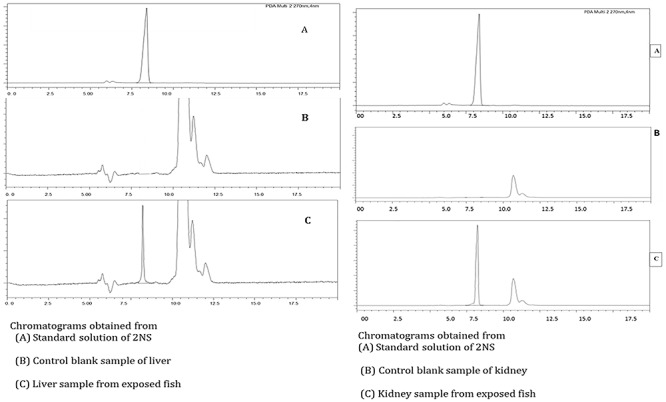
Chromatograms of standard, control and 2NS treated sample tissues of C. punctatus.
Accuracy of method
The accuracy of the method was obtained by calculating mean percentage recovery ± standard deviation, which was calculated from the concentration of the standard injected and the concentration of standard obtained after extraction, which was found to be 96.59 ± 4.71 μg/ml.
Concentration of 2NS in exposed fishes
Method was validated by using calibration plot for the assay of 2NS, which was found to be linear over the investigated range, i.e. 5–150 μg/ml. Correlation coefficient was 0.9956. Limit of detection was found to be 0.60 μg/ml and limit of quantification was found to be 1.83 μg/ml. Figure 3 represents the mean concentration of 2NS found in fishes exposed to 0.33 mg/15 g b.w. for 24 h, 96 h, 10 days, 20 days and 30 days. The concentration of 2NS was found to be highest after 24 h of exposure. Further decline in concentration were observed in both the tissues. In kidney tissue homogenate, maximum concentration observed was 45.54 μg/ml, whereas liver tissue homogenate, maximum concentration obtained was 1.83 μg/ml. In recovery group, minimum concentration was obtained after 30 days in kidney, which was found to be 1.85 μg/ml, and in liver, it was found to be 0.92 μg/ml.
Figure 3.
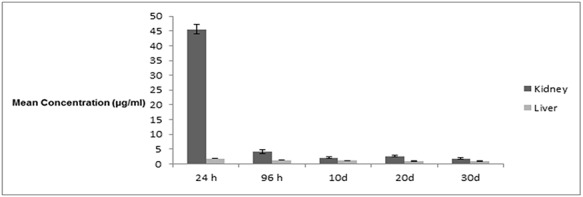
Column graph representing the mean concentration values along with standard errors of the kidney and liver of exposed fishes at different time intervals.
Discussion
In the present study, the toxic impact of two sublethal doses of 2NS was assessed using different parameters. The doses were selected after determining LD50 of 2NS, as reported in our earlier study [21]. The toxicity of xenobiotic in aquatic organisms is influenced by size of the organisms [35]; thus, it seems that in aquatic toxic evaluation in which it cannot be determined that how much a single organism is getting exposed to a particular xenobiotic, calculating LD50 with a fixed amount of the xenobiotic seems to be more suitable than LC50. Thus, the present study reveals the toxic evaluation of 2NS on kidney and liver tissue of C. punctatus after being intraperitoneally administered. Liver is the foremost organ to encounter chemicals for its biotransformation. It is crucial organ playing role in degradation of toxic materials, but its regulatory mechanism can be deactivated by the elevation of xenobiotic concentration, which may lead to damage in the tissue and affecting its function [36]. Like liver, kidney is a main organ for homeostasis, which plays an important role in maintaining osmotic balance and filtration. It receives blood from different organs and serves as major route for excretion of different types of toxic compounds and their metabolites. Thus, being constantly exposed to chemicals, its vulnerability to damage increases. Moreover, this study also highlights the application of ATR-FTIR along with histopathology as reliable damage determining markers. Analysis is mainly focused on effect of 2NS on oxidative stress along with genotoxicity. Measurement of alterations in the levels of MDA, GST, CAT and SOD has been considered in the present study to assess the overall antioxidant status of C. punctatus.
MDA being the major marker for lipid peroxidation has been analyzed in the present investigation. The increased content of MDA in the study indicates 2NS-induced oxidative stress. The rise observed in MDA levels at 72 h might be due to increase in free radicals and decrease in antioxidant enzymes potential. In a recent study, Sharma et al. [37] also found an increase in MDA level in C. punctatus after the exposure of tetrabromobisphenol A. Likewise, elevation in MDA level after the exposure of transition metal-doped titanium dioxide nanoparticles in goldfish and common carp was observed [38]. Alterations in antioxidant enzymes including GST, CAT and SOD activity were also observed, indicating the decrease potential in these antioxidant enzymes due to the oxidative stress induced by 2NS. These enzymes provide a first line of defense to organism being exposed to xenobiotic as they have proven to carry crucial role against cellular damage [39]. Significant increase in GST and significant decrease in CAT and SOD was observed in the present study after treating fishes with 2NS as compared with control. Elevation in GST activity indicates the apparent protective behavior of the enzyme against the free radicals being produced against xenobiotic; however, the decline in CAT and SOD activity might be due to generation of superoxide radicals, which leads to the inhibition of enzyme’s activity [40]. Many studies have reported similar alterations in antioxidant enzymes after exposure to various environmental pollutants and contaminants, as present study reported. Al-Mashhedy [41] also revealed the impact of textile dyes on antioxidant enzymes showing significant variations in their activities. Similarly, Javed et al. [42] also revealed alterations in activities of antioxidant enzymes after the exposure of thermal power plant effluent. Results reported by Mansour et al. [43] and Stara et al. [44] in freshwater fish treated with profenofos and prometryne, respectively, also showed the effect of free radicals generated due to xenobiotic on activities of enzymes involved in defense mechanism. The increase in free radicals leads to its interaction with biomolecules such as DNA, resulting in the formation of DNA adducts, which prevents replication accurately. In the present study, genotoxicity of 2NS in C. punctatus was also evaluated using comet assay. Comet assay is easy as well as authentic biomarker for measuring DNA damages; thus, it is considered as the most propitious tool for assessing genotoxicity. Dose- as well as time-dependent significant increase in TL and TM was recorded till 96 h of exposure. Similar to our findings, Fernandes et al. [45] also revealed genotoxicity in bone marrow of rats after the induction of textile dye Color Index Disperse Red 1. Likewise, the elevation in micronucleus cell frequency was also observed in blood of gill and kidney of C. punctatus after the exposure of 4-nonylphenol [37]. This genotoxic potential of 2NS might be due to its interaction with DNA, leading to breaks in strands of DNA, adduct and crosslink formation which might further lead to incomplete transcription, cellular dysfunction and many other diseases in the organism. 2NS after entering the body might disturb the antioxidant system of the fish and leads to the production of reactive oxygen species (ROS), which may interact with DNA and other cellular biomolecules, resulting in damaging them. Significant reduction in all the toxicity parameters studied in the present analysis including antioxidant enzymes as well as genotoxicity biomarkers after 30 days (720 h) revealed evident recovery in C. punctatus. The reason behind the recovery might be the repair or replacement of maximally impaired cells or both. Activation of p450 gene could be one of the other reasons of recovery. Similar study performed by Sharma et al. (2020, [46]) also showed the recovery gained by fresh water fish C. punctatus after the cessation of nonionic surfactant, nonylphenol.
Further analysis of alterations in biochemical constituents was also performed by ATR-FTIR in maximum damaged group (96 h exposed groups). FTIR spectroscopy is helpful in analyzing structural as well as concentration changes in proteins and lipids. FTIR gives absorption spectra in which intensity of bands is directly related to concentration of the molecules. Study performed by Obinaju et al. [19] suggested the application of ATR-FTIR spectroscopy to inquire the alterations observed in cellular constituents due to the exposure of xenobiotics. In the present study, variation in lipids, proteins and nucleic acids were studied with the help of ATR-FTIR by studying different wavenumbers. In addition, protein secondary structure analysis was also focused in this study, which reveals alterations in α-helix and β-sheet structure after 2NS intoxication. Comparing kidney and liver, study suggests that liver is more prone to protein damage as compared with kidney, but significant difference is observed in the absorption intensities for both the tissues as compared with control. Similar alterations in biochemical contents of brain tissue were studied in Catla catla and Zebrafish after the exposure of lead and titanium dioxide, respectively, using FTIR [47, 48]. In order to study the effect of alterations in the structure of major biomolecules on the integrity of tissue, along with ATR-FTIR, histopathological evaluation of kidney and liver was also considered. The present study showed normal histology indicating no deformities in case of control group (Fig. 1). However, in those administered with 2NS, areas of necrosis, vacuolization, etc. in liver and kidney were observed, indicating the toxic nature of 2NS. Srivastava et al. [49] reported histopathological changes and alterations in the activity of certain metabolic and antioxidant enzymes in the head skin of Labeo rohita. Similarly Barot and Bahadur [50] studied the histopathological effects of azo dye, Direct Green 6 on kidney of L. rohita fingerlings exposed to sublethal concentrations (2.5, 5.0 and 10.0 ppm) of dye for 5, 10 and 15 days. Thus, the study clearly indicated that alterations in the main biochemical constituents might lead to the histopathological changes in kidney and liver tissues.
Bioaccumulation of xenobiotic is said to elevate ROS, thus creating imbalance between the internal stress combat systems of the fish, leading to the generation of oxidative stress. The bioaccumulation potential of 2NS in kidney and liver of C. punctatus was also studied in the present study. For this experiment, highest dose, i.e. 0.33 mg/15 g b.w., was selected and the presence of 2NS for 1 month at different time intervals after intraperitoneal administration was investigated. The result showed the decrease in concentration with time. Maximum concentration, i.e. 45.54 μg/ml, was obtained in case of kidney homogenate, whereas in case of liver, 1.83 μg/ml of 2NS was obtained, indicating kidney being more vulnerable to 2NS-induced damage. Vulnerability to damage in kidney is also shown in the present study as kidney shows higher oxidative stress as compared with liver. Minimum concentration was obtained after 30 days; in case of kidney, it was found to be 1.85 μg/ml, whereas in liver, it was found to be 0.92 μg/ml. At 30 days, tissues show recovery, indicating that 1.85 μg/ml in kidney and 0.92 μg/ml in liver tissues are not sufficient enough to induce oxidative stress. The quantification was observed for 1 month at different time intervals with the help of HPLC. Similar study was performed by Morales-Trejo et al. [51], which revealed the presence of clenbuterol with the help of HPLC and considered quantification process as one of the application of HPLC.
Conclusion
The study highlights the bioaccumulative, DNA damaging and oxidative stress-inducing potential of 2NS—a toxic intermediate compound used in textile industries. Also, the present investigation indicates the ATR-FTIR along with histopathology as the reliable tool for toxicity assessment.
Acknowledgment
The authors are sincerely thankful to CSIR-UGC for awarding fellowship to S.M. and UGC SAP (New Delhi) for providing infrastructural facilities.
Contributor Information
Sukanya Mehra, Department of Zoology, Guru Nanak Dev University, Amritsar 143005, India.
Pooja Chadha, Department of Zoology, Guru Nanak Dev University, Amritsar 143005, India.
Conflict of Interest
None declared.
References
- 1. Zhou H. Population growth and industrialization. Econ Inq 2009;47:249–65. [Google Scholar]
- 2. Yang Q, Li Z, Lu Xet al. A review of soil heavy metal pollution from industrial and agricultural regions in China: pollution and risk assessment. Sci Total Environ 2018;642:690–700. [DOI] [PubMed] [Google Scholar]
- 3. Gupta S, Satpati S, Nayek Set al. Effect of wastewater irrigation on vegetables in relation to bioaccumulation of heavy metals and biochemical changes. Environ Monit Assess 2010;165:169–77. [DOI] [PubMed] [Google Scholar]
- 4. Hassan M, Hassan R, Mahmud Aet al. Sewage waste water characteristics and its management in urban areas-a case study at Pagla Sewage Treatment Plant. Dhaka Urban Reg Plan 2017;2:13–6. [Google Scholar]
- 5. Robinson T, McMullan G, Marchant Ret al. Remediation of dyes in textile effluent: a critical review on current treatment technologies with a proposed alternative. Bioresour Technol 2001;77:247–55. [DOI] [PubMed] [Google Scholar]
- 6. Prado R, García R, Rioboo Cet al. Suitability of cytotoxicity endpoints and test microalgal species to disclose the toxic effect of common aquatic pollutants. Ecotoxicol Environ Saf 2015;114:117–25. [DOI] [PubMed] [Google Scholar]
- 7. Bhatia SC. Pollution Control in Textile Industry. India: Woodhead Publishing India Pvt. Ltd., 2017. [Google Scholar]
- 8. Freeman HS, Mock GN. Dye application, manufacture of dye intermediates and dyes. In: Kent JA (ed). Handbook of Industrial Chemistry and Biotechnology: Twelfth Edition, Vols 1–2. Springer US, 2012, 475–548. [Google Scholar]
- 9. Suter MJF, Riediker S, Giger W. Selective determination of aromatic sulfonates in landfill leachates and groundwater using microbore liquid chromatography coupled with mass spectrometry. Anal Chem 1999;71:897–904. [DOI] [PubMed] [Google Scholar]
- 10. Riediker S, Suter MJF, Giger W. Benzene- and naphthalenesulfonates in leachates and plumes of landfills. Water Res 2000;34:2069–79. [Google Scholar]
- 11. Song Z, Edwards SR, Howland Ket al. Analysis of a retan agent used in the tanning process and its determination in tannery wastewater. Anal Chem 2003;75:1285–93. [DOI] [PubMed] [Google Scholar]
- 12. Muthu SS. Introduction. In: Muthu SS (ed). Sustainability in the Textile Industry, Singapore: Springer, 2017, 1–8. doi: 10.1007/978-981-10-2639-3_1. [DOI] [Google Scholar]
- 13. Nigam P, Banat IM, Singh Det al. Microbial process for the decolorization of textile effluent containing azo, diazo and reactive dyes. Process Biochem 1996;31:435–42. [Google Scholar]
- 14. Hamann E, Stuyfzand PJ, Greskowiak Jet al. The fate of organic micropollutants during long-term/long-distance river bank filtration. Sci Total Environ 2016;545–546:629–40. [DOI] [PubMed] [Google Scholar]
- 15. Kameya T, Murayama T, Urano Ket al. Biodegradation ranks of priority organic compounds under anaerobic conditions. Sci Total Environ 1995;170:43–51. [DOI] [PubMed] [Google Scholar]
- 16. Pan B, Zhang W, Pan Bet al. Efficient removal of aromatic sulfonates from wastewater by a recyclable polymer: 2-naphthalene sulfonate as a representative pollutant. Environ Sci Technol 2008;42:7411–6. [DOI] [PubMed] [Google Scholar]
- 17. Velmurugan B, Senthilkumaar P, Karthikeyan S. Toxicity impact of fenvalerate on the gill tissue of Oreochromis mossambicus with respect to biochemical changes utilizing FTIR and principal component analysis. J Biol Phys 2018;44:301–15. [DOI] [PMC free article] [PubMed] [Google Scholar]
- 18. Mehra S, Chadha P. Alterations in structure of biomolecules using ATR-FTIR and histopathological variations in brain tissue of Channa punctatus exposed to 2naphthalene sulfonate. Toxicol Res 2020;9:530–6. [DOI] [PMC free article] [PubMed] [Google Scholar]
- 19. Obinaju BE, Graf C, Halsall Cet al. Linking biochemical perturbations in tissues of the African catfish to the presence of polycyclic aromatic hydrocarbons in Ovia River, Niger Delta region. Environ Pollut 2015;201:42–9. [DOI] [PubMed] [Google Scholar]
- 20. Erhirhie EO, Ekene NE, Ajaghaku DL. Guidelines on dosage calculation and stock solution preparation in experimental animals’ studies. J Nat Sci Res 2014;4:100–6. [Google Scholar]
- 21. Mehra S, Chadha P. Bioaccumulation and toxicity of 2-naphthalene sulfonate: an intermediate compound used in textile industry. Toxicol Res (Camb) 2020;9:127–36. [DOI] [PMC free article] [PubMed] [Google Scholar]
- 22. Draper HH, Hadley M. Malondialdehyde determination as index of lipid peroxidation. Methods Enzymol 1990;186:421–31. [DOI] [PubMed] [Google Scholar]
- 23. Aebi H. Catalase in vitro. Methods Enzymol 1984;105:121–6. [DOI] [PubMed] [Google Scholar]
- 24. Habig WH, Pabst MJ, Jakoby WB. Glutathione S-transferases: the first enzymatic step in mercapturic acid formation. J Biol Chem 1974;249:7130–9. [PubMed] [Google Scholar]
- 25. Kono Y. Generation of superoxide radical during autoxidation of hydroxylamine and an assay for superoxide dismutase. Arch Biochem Biophys 1978;186:189–95. [DOI] [PubMed] [Google Scholar]
- 26. Bradford MM. A rapid and sensitive method for the quantitation of microgram quantities of protein utilizing the principle of protein-dye binding. Anal Biochem 1976;72:248–54. [DOI] [PubMed] [Google Scholar]
- 27. Ahuja YR, Saran R. Alkaline single cell gel electrophoresis assay. J Cytol Genet 1999;34:57–62. [Google Scholar]
- 28. Bhandari R. A sensitive HPLC method for determination of isoniazid in rat plasma, brain, liver and kidney. J Chromatogr Sep Tech 2012;3:128. [Google Scholar]
- 29. Akkas SB, Severcan M, Yilmaz Oet al. Effects of lipoic acid supplementation on rat brain tissue: an FTIR spectroscopic and neural network study. Food Chem 2007;105:1281–8. [Google Scholar]
- 30. Dogan A, Siyakus G, Severcan F. FTIR spectroscopic characterization of irradiated hazelnut (Corylus avellana L.). Food Chem 2007;100:1106–14. [Google Scholar]
- 31. Severcan F, Toyran N, Kaptan Net al. Fourier transform infrared study of the effect of diabetes on rat liver and heart tissues in the C-H region. In: Talanta, Vol. 53. Elsevier Science Publ Co Inc, 2000, 55–9. [DOI] [PubMed] [Google Scholar]
- 32. Cakmak G, Togan I, Severcan F. 17β-Estradiol induced compositional, structural and functional changes in rainbow trout liver, revealed by FT-IR spectroscopy: a comparative study with nonylphenol. Aquat Toxicol 2006;77:53–63. [DOI] [PubMed] [Google Scholar]
- 33. Toyran N, Turan B, Severcan F. Selenium alters the lipid content and protein profile of rat heart: an FTIR microspectroscopic study. Arch Biochem Biophys 2007;458:184–93. [DOI] [PubMed] [Google Scholar]
- 34. Benedetti E, Bramanti E, Papineschi Fet al. Determination of the relative amount of nucleic acids and proteins in leukemic and normal lymphocytes by means of Fourier transform infrared microspectroscopy. Appl Spectrosc 1997;51:792–7. [Google Scholar]
- 35. Hassan J, Tabarraei H. Toxicity of copper on rainbow trout: lethal concentration or lethal dose evaluation. Environ Sci An Indian J 2015;11:98–102. [Google Scholar]
- 36. Brusle J, Anadon GG. The structure and function of fish liver. In: Munshi JSD, Dutta HM (eds.), Fish Morphology. North Holland: Science Publishers, 1996, 77–93. [Google Scholar]
- 37. Sharma P, Chadha P, Saini HS. Tetrabromobisphenol A induced oxidative stress and genotoxicity in fish Channa punctatus. Drug Chem Toxicol 2019;42:559–64. [DOI] [PubMed] [Google Scholar]
- 38. Pirsaheb M, Azadi NA, Miglietta MLet al. Toxicological effects of transition metal-doped titanium dioxide nanoparticles on goldfish (Carassius auratus) and common carp (Cyprinus carpio). Chemosphere 2019;215:904–15. [DOI] [PubMed] [Google Scholar]
- 39. Demir F, Uzun FG, Durak Det al. Subacute chlorpyrifos-induced oxidative stress in rat erythrocytes and the protective effects of catechin and quercetin. Pestic Biochem Physiol 2011;99:77–81. [Google Scholar]
- 40. Kono Y, Fridovich I. Superoxide radical inhibits catalase. J Biol Chem 1982;257:5751–4. [PubMed] [Google Scholar]
- 41. Al-Mashhedy LAM. Toxicity assessment of textile dyes via oxidative stress hypothesis for Iraqi textile workers. Int J Pharma Bio Sci 2013;4:577–87. [Google Scholar]
- 42. Javed M, Ahmad I, Usmani Net al. Bioaccumulation, oxidative stress and genotoxicity in fish (Channa punctatus) exposed to a thermal power plant effluent. Ecotoxicol Environ Saf 2016;127:163–9. [DOI] [PubMed] [Google Scholar]
- 43. Mansour M, El-Kashoury A, Rashed Met al. Oxidative and biochemical alterations induced by profenofos insecticide in rats. Nat Sci 2009;7:1–15. [Google Scholar]
- 44. Stara A, Kristan J, Zuskova Eet al. Effect of chronic exposure to prometryne on oxidative stress and antioxidant response in common carp (Cyprinus carpio L.). Pestic Biochem Physiol 2013;105:18–23. [DOI] [PubMed] [Google Scholar]
- 45. Fernandes FH, Umbuzeiro GdA, Salvadori DMF. Genotoxicity of textile dye C.I. Disperse Blue 291 in mouse bone marrow. Mutat Res Genet Toxicol Environ Mutagen 2019;837:48–51. [DOI] [PubMed] [Google Scholar]
- 46. Sharma M, Chadha P. From genotoxicity induction to recovery in different organs in fish Channa punctatus after sub chronic exposure to 4-nonylphenol. Toxicol Int 2020;27:8–13. [Google Scholar]
- 47. Palaniappan PR, Krishnakumar N, Vadivelu M. FT-IR study of the effect of lead and the influence of chelating agents, DMSA and D-Penicillamine, on the biochemical contents of brain tissues of Catla catla fingerlings. Aquat Sci 2008;70:314–22. [Google Scholar]
- 48. Palaniappan PR, Pramod KS. The effect of titanium dioxide on the biochemical constituents of the brain of Zebrafish (Danio rerio): an FT-IR study. Spectrochim Acta Part A Mol Biomol Spectrosc 2011;79:206–12. [DOI] [PubMed] [Google Scholar]
- 49. Srivastava A, Verma V, Mistri A et al. Alterations in the skin of Labeo rohita exposed to an azo dye, Eriochrome black T: a histopathological and enzyme biochemical investigation. Environ Sci Pollut Res 2017;24:8671–81. [DOI] [PubMed] [Google Scholar]
- 50. Barot J, Bahadur A. Behavioural and histopathological effects of azodye on kidney and gills of Labeo rohita finger lings. J Environ Biol 2013;34:147–52. [PubMed] [Google Scholar]
- 51. Morales-Trejo F, León SVY, Escobar-Medina Aet al. Application of high-performance liquid chromatography-UV detection to quantification of clenbuterol in bovine liver samples. J Food Drug Anal 2013;21:414–20. [Google Scholar]