Abstract
Plant-derived phenolics are utilized as chemopreventive agents to abate adverse toxic responses associated with drug-induced damages. Tamoxifen (TAM)—a chemotherapeutic agent—is used in managing all stages of hormone-dependent breast cancer. Notwithstanding TAM’s clinical side effect—including hepatic toxicity—its use is commonplace. The present study investigates the effect of Chlorogenic acid (CGA: 25 and 50 mg kg−1; per os (p.o)) reported to exhibit various beneficial properties, including antioxidative effect against TAM (50 mg/kg; p.o.)-induced hepatorenal toxicities in rats treated as follows: Control, CGA, or TAM alone, and rats co-treated with CGA and TAM for 2 weeks. Biomarkers of hepatorenal function, oxido-inflammatory stress, and hepatorenal histopathology were performed. We observed that TAM alone decreased relative organ weights (ROW), marginally impacted rat’s survivability, and significantly (P < 0.05) increased hepatorenal toxicities and reactive oxygen and nitrogen species (RONS). TAM decreased (P < 0.05) antioxidant, anti-inflammatory cytokine (IL-10), besides increase in (P < 0.05) lipid peroxidation (LPO), pro-inflammatory cytokines (IL-1β, TNF-α), nitric oxide (NO), xanthine oxidase (XO), myeloperoxidase (MPO), and apoptotic caspases (Casp-3 and -9) levels. These biochemical alterations were accompanied by morphological lesions in experimental rats’ liver and kidney. Conversely, that CGA dose-dependently relieved TAM-mediated toxic responses, restored antioxidants capacities, reduced oxidative stress, pro-inflammatory cytokines levels, and Casp-3 and -9 activities in experimental rats. Furthermore, CGA protected against lesions observed in the liver and kidney of rats treated with TAM alone. Overall, CGA blocked TAM-mediated hepatorenal injuries associated with pro-oxidative, inflammatory, and apoptotic mechanisms. CGA may serve as a chemoprotective agent boosting patients prognosis undergoing TAM chemotherapy.
Keywords: Tamoxifen, chlorogenic acid, hepatorenal toxicity, oxido-inflammatory stress, antioxidant, apoptosis
Introduction
Tamoxifen (Z-1-[4-(2-dimethylaminoethoxy)-phenyl]-1,2-diphenyl-1-butene; TAM) is used as a gold standard adjuvant treatment for both early and advanced breast cancers [1]. TAM is biotransformed by several drug-metabolizing enzymes including cytochrome P450 isoforms -MFO1, CYP3A, CYP2D6, CYP3A4; hydroxysteroid sulfotransferase subfamily enzymes in the liver into tamoxifen-N-oxide, N-desmethyl-tamoxifen, 4OH-tamoxifen, 4OH-N-desmethyl tamoxifen, α-hydroxylation products, and O-sulfonation [2]. TAM’s primary mechanism of action is thought to be through the inhibition of estradiol binding at the ligand-binding domain of the estrogen receptor alpha (ERα) and inducing conformational changes that block the interaction of estrogen receptor with co-activator proteins [2, 3]. TAM also modulates signaling proteins including protein kinase C (PKC), mitogen-activated protein kinases (MAPK), proto-oncogene c-myc, c-jun N-terminal kinase (JNK), and induces the expression of pro-apoptotic proteins (Bax and Bak). Moreover, TAM increases mitochondrial permeability transition and the release of cytochrome c from the inner mitochondrial membrane, thereby resulting in apoptotic cell death [4–6]. With the widespread use of TAM to manage breast cancer, attention has been drawn to its deleterious effects on liver and kidney function. TAM-induced hepatic toxicities, including massive steatosis, multifocal fatty infiltration, fibrosis, cirrhosis, and necrosis [7–9], have been reported in human and rat models. In the kidney, TAM has been reported to cause grade II renal toxicity [10], and aberration in Wnt/β-catenin signaling [11] in mice model, thus leading to derangement of renal functions [12]. Hepatic and renal toxicities associated with TAM therapy is believed to be associated with the formation of reactive oxygen and nitrogen species (RONS) mediated oxidative stress. RONS, including superoxide anion radical (O2.-), hydrogen peroxide (H2O2), hydroxyl radical (OH.), hypochlorous acid (HOCl), nitric oxide (NO), and peroxynitrite (ONOO−) [3, 13], are capable of reacting with the cellular DNA, proteins, and lipids to form DNA-adducts, protein crosslink, and lipid peroxidation products [14, 15] in target organs. Consequently, these reactions create a permissive inflammatory environment, cell dysfunction/death, and impair the integrity and functionality of the liver and kidney cells.
Chlorogenic acid (5-O-caffeoylquinic acid, CGA) is a polyphenolic compound widely distributed in foods and herbs [16–18]. CGA’s pharmacological potentials are widely documented in the pharmacopoeia, including antioxidant, anti-inflammatory, anti-lipidemic, anti-cancer, anti-diabetic, antihypertensive, and anti-neurodegenerative activities [19–25].
Our current interest is to minimize the side effects of TAM by supplementation with plant-derived phytochemicals in the management of breast cancer more effectively. Toward this end, the present study was carried out to investigate the effect of CGA against TAM-induced hepatorenal toxicities in albino Wistar rats. We evaluated the effects of TAM and co-administration of TAM and CGA on liver and kidney function, oxidative stress biomarkers, antioxidant enzyme activities, inflammatory and apoptotic mediator levels. We further explored histopathological alterations in experimental rats’ liver and kidney to gain further mechanistic insight of the ameliorative effects of CGA on TAM-mediated hepatorenal toxicities. We observed that CGA impeded TAM-mediated liver and kidney injuries associated with pro-oxidative, inflammatory, and apoptotic mechanisms.
Materials and Methods
Chemicals
TAM, CGA, epinephrine, glutathione (GSH), thiobarbituric acid (TBA), hydrogen peroxide (H2O2), 5,5-dithio-bis-2-nitrobenzoic acid (DTNB), Griess reagent, 1-chloro-2, 4-dinitrobenzene (CDNB), xanthine, trichloroacetic acid, and bovine serum albumin (BSA) were purchased from Sigma (St Louis, Missouri, USA). Monosodium dihydrogen phosphate, disodium hydrogen phosphate, sodium carbonate, sodium hydroxide, copper sulfate, potassium iodide, sodium–potassium tartrate, and sodium chloride were obtained from BDH Ltd. (Poole, Dorset, UK) and William Hopkins Ltd. (Birmingham, UK). Alanine aminotransferase (ALT), Aspartate aminotransferase (AST), Alkaline phosphatase (ALP), Lactate dehydrogenase (LDH), and gamma-glutamyl transferase (GGT) kits were obtained from Randox™ Laboratories Ltd. (Ardmore, Crumlin, Co., Antrim, UK). Enzyme-Linked Immunosorbent Assay (ELISA) kits for the assessment of Interleukin-1β (IL-1β), interleukin-10 (IL-10), tumor necrosis factor-alpha (TNF-α), caspase-9 (Casp-9), and Caspase-3 (Casp-3) were obtained from Elabscience Biotechnology Company (Beijing, China). All other chemicals used for these experiments are of analytical grade.
Animal model
Healthy albino Wistar rats of 9 weeks old (sex: female; 204 ± 12 g, n = 50) were obtained from the Experimental Laboratory animal house, Faculty of Basic Medical Sciences, University of Ibadan. Experimental rats were housed in natural photoperiod (12/12 h light–dark) conditions in a well-ventilated rodent facility at the Department of Biochemistry. The rats were provided with rat pellets (Ladokun™ Feeds, Ibadan, Nigeria) and allowed free access to water. Rats were allowed to adapt (7 days) to their new environment preceding experimentation and adequately cared for as specified by ‘Guide for the Care and Use of Laboratory Animals’ published by the National Institute of Health. Also, experiments were performed following the University of Ibadan Ethical Use of Animal Committee’s approval and following the United States National Academy of Sciences guidelines.
Experimental protocol
Experimental rats were randomly divided into five treatment cohorts (n = 10) after acclimatization, and were treated at random phases of the estrous cycle. The doses of TAM (50 mg/kg) and CGA (25 and 50 mg/kg) used in the current study were selected based on previously published data [26–28]. Different stock solutions of TAM (50 mg/mL) and CGA (50 mg/mL) were prepared freshly every other day and used in dosing the experimental rats by gavage or per os (p.o.). The gavage volumes for CGA (25 and 50 mg/kg) and TAM (25 or 50 mg/kg) were 100, 200, and 200 μl from the specific stock solution respectively. Cohorts of rats treated with TAM and CGA were treated separately using the appropriate volumes of TAM and CGA from the different stock solutions within 30 min of each other. The rats were dosed first with TAM before CGA in the specific treatment cohorts for 14 consecutive days as follows:
Group I: Control- administered corn oil-vehicle-(2 ml/kg; p.o) alone.
Group II: Treated with CGA dissolved in corn oil (50 mg/kg; p.o) alone.
Group III: Treated with TAM (50 mg/kg; p.o.)
Group IV: TAM + CGA1: Treated with (TAM: 50 mg/kg) and (CGA: 25 mg/kg; p.o.).
Group V: (TAM + CGA2): Treated with (TAM: 50 mg/kg) and (CGA: 50 mg/kg; p.o.).
Following the last treatment, on Day 15, the rats were weighed. Blood was collected from the retro-orbital venous plexus into plain pre-labeled sample bottles, before sacrificing by cervical dislocation. Subsequently, the clotted blood was centrifuged at 3000 g for 10 min at 4°C to obtain the serum. The liver and kidney were immediately excised, weighed, and processed for biochemical and histological analyses. The serum samples were stored (−20°C) until required for specific biochemical analysis.
Estimation of liver and kidney function indices
Analysis of serum activities of AST, ALT, ALP, GGT, and LDH and creatinine and urea levels in control, TAM-, and CGA-treated rats were performed using commercial kits from Randox™ Laboratories Limited (UK).
Assessment of oxidative stress indices
The liver and kidney samples from control, TAM-, and CGA-treated rats were homogenized in phosphate buffer (0.05 M, pH 7.4). The resultant tissue homogenates were then centrifuged at 12 000 g for 15 min at 4°C to obtain a clear supernatant, which was used to assess antioxidant, oxidative stress, inflammation, and apoptotic biomarkers. Hepatic and renal protein concentrations were evaluated according to the method of Lowry et al. [28]; total sulfhydryl group was assayed at 412 nm in line with the process of Ellman [29]; reduced GSH was determined at 412 nm according to the method described by Jollow et al. [30]; GST was assayed at 340 nm by the process of Habig et al. [31]; GPx activity was determined at 412 nm according to the method of Rotruck et al. [32]; SOD activity was determined at 480 nm by the method described by Misra and Fridovich [33]; CAT activity was determined at 240 nm using H2O2 as a substrate according to the method of Clairborne [34]; Xanthine oxidase was quantified at 290 nm by the method of Bergmeyer et al. [35]; and lipid peroxidation marker was quantified as malondialdehyde (MDA) at 532 nm according to the method described by Buege and Aust [36], and expressed as μmol MDA/mg protein.
Assessment of RONS
The levels of hepatic and renal RONS in control, TAM-, and CGA-treated rat samples were evaluated according to an established protocol, which is based on the RONS-dependent oxidation of 2′,7′-dichlorodihydrofluorescein diacetate (DCFH-DA) to dichlorofluorescein (DCF), according to Owumi and Dim [37]. Briefly, the reaction mixture (150 μl 0.1 M potassium phosphate buffer; 35 μl distilled water, 10 μl sample, and 5 μl freshly prepared DCFH-DA) was constituted with minimal exposure to air. Fluorescence emission of DCF produced from DCFH-DA oxidation was spectrophotometrically analyzed (wavelengths: 488 nm excitation; 525 nm emission) for 10 min at 30 s intervals using a Spectra Max 384 multimodal plate reader (Molecular Devices). DCF produced was expressed as a percentage over control.
Assessment of pro-inflammatory biomarkers and caspase-9 and caspase-3 activities
The level of hepatic and renal nitric oxide (NO) in control, TAM-, and CGA-treated rats was assessed using Griess reagent according to the established protocol of Green et al. [38]. Briefly, the reaction mixture consisting of an equal volume of sample and Griess reagent was incubated for 15 min before the absorbance was evaluated at 540 nm. The level of NO was extrapolated from the standard curve and then expressed as Units/mg protein. Moreover, myeloperoxidase (MPO) activity was evaluated according to the method described by Granell et al. [39]. Additionally, IL-1β, IL-10, TNF-α levels, as well as caspase-3 and caspase-9 activities were evaluated using commercially available ELISA Kits (Elabscience Biotechnology Company, Beijing, China) with the aid of a SpectraMax™ plate reader (Molecular Devices, CA, USA) as stated in the manufacturer’s manual.
Histopathology
The liver and kidney samples were fixed using 10% phosphate-buffered formalin for 3 days and then embedded in paraffin after dehydration. Microtome cut tissue sections (4–5 μm) and fixed on charged microscopic glass slides were subsequently stained with hematoxylin and eosin (H & E) [40]. The tissue histology slides were blinded to a pathologist who examined them under a light microscope (Leica DM 500, Germany). The histopathological aberrations were scored semiquantitatively following established methods and as previously reported [41–44]: None (0); mild (1); mild–moderate (2); moderate (3); moderate to severe (4); and severe (5) [45]. Representative images were captured with a digital camera (Leica ICC50 E, Germany) attached to the microscope.
Statistical analysis
Data were analyzed by the one-way analysis of variance (ANOVA) and post hoc Tukey test (GraphPad Prism 5 Software, La Jolla, California, USA, www.graphpad.com) was used to ascertain significant differences in the treatment groups. P values < 0.05 were considered significant. The results were subsequently expressed as mean+/− standard deviation (SD).
Results
Effect of CGA on survivability and body and relative organ weight of TAM-treated rats
The survivability (Kaplan–Meyers) results, mean body weight, and relative liver and kidney weights are presented in Fig. 1 and Table 1. There is no statistical difference between initial and final body weight in control, CGA, TAM + CGA1, and TAM + CGA2 groups (Table 1). Compared to TAM alone, groups that received TAM + CGA (25 and 50 mg/kg) revealed slight alterations in final mean body weight. Cohorts of rat treated with TAM only, TAM + CGA1, and TAM + CGA2 exhibited weight losses of −11.39, −9.30, and − 4.30 g, respectively, indicating the protective role of CGA again TAM-induced alteration in body weight. There was no significant difference in the mean liver and kidney weight and the percentage relative liver and kidney weights.
Figure 1.
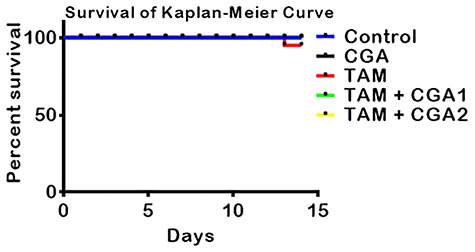
Experimental scheme and the effect of CGA on percentage rat’s survival of rats treated with TAM for 2 weeks. Tamoxifen -TAM: 50 mg/kg; Chlorogenic acid -CGA: 25 and 50 mg/kg; TAM + CGA1, (50 + 25) mg/kg; TAM + CGA2, (50 + 50) mg/kg.
Table 1.
Effect of CGA on body weight change, relative liver and kidney weights of rats following treatment with TAM for 14 consecutivedays
| Control | CGA | TAM | TAM + CGA1 | TAM + CGA2 | |
|---|---|---|---|---|---|
| Initial body weight (IBW; g) | 197.50 ± 18.45 | 203.90 ± 13.14 | 202.50 ± 18.45 | 201.30 ± 22.37 | 203.80 ± 8.50 |
| Final body weight (FBW; g) | 205.50 ± 20.61 | 210.50 ± 14.80 | 179.44 ± 19.91* | 192.00 ± 31.34 | 199.50 ± 16.06 |
| Liver weight (g) | 5.67 ± 0.72 | 6.19 ± 0.81 | 5.71 ± 0.34 | 5.97 ± 1.12 | 5.45 ± 0.69 |
| Kidney weight (g) | 1.23 ± 0.17 | 1.21 ± 0.10 | 1.17 ± 0.15 | 1.19 ± 0.21 | 0.16 ± 0.07 |
| Relative Liver weight (%) | 2.75 ± 0.12 | 3.18 ± 0.25 | 3.20 ± 0.21 | 2.99 ± 0.15 | 2.89 ± 0.51 |
| Relative Kidney weight (%) | 0.60 ± 0.04 | 0.65 ± 0.04 | 0.65 ± 0.04 | 0.60 ± 0.03 | 0.61 ± 0.02 |
Values are expressed as mean ± SD of five rats per experimental group. *P < 0.05: IBW versus FBW. Chlorogenic acid (CGA); Tamoxifen (TAM).
CGA abates hepatic and renal toxicities in TAM-treated rats
The effect of CGA on biomarkers of liver and kidney toxicities in the serum of rat cohorts treated with TAM for 14 consecutive days is presented in Fig. 2. Relative to the control, TAM-treated rats exhibited significant (P < 0.05) increase in the activities of ALT, ALP, LDH, GGT, and AST-biomarkers of liver function, as well as creatinine and urea-kidney function biomarkers levels. In contrast, rat cohorts co-treated with TAM + CGA at 25 and 50 mg/kg exhibited decreases (P < 0.05) in the serum of biomarkers of hepatorenal dysfunction compared to the rats treated with TAM alone. The protective effect of CGA is dose dependent— CGA at 50 mg/kg protected more than CGA at 25 mg/kg (CGA2 > CGA1) on hepatorenal toxicity rats caused by TAM only treatment.
Figure 2.
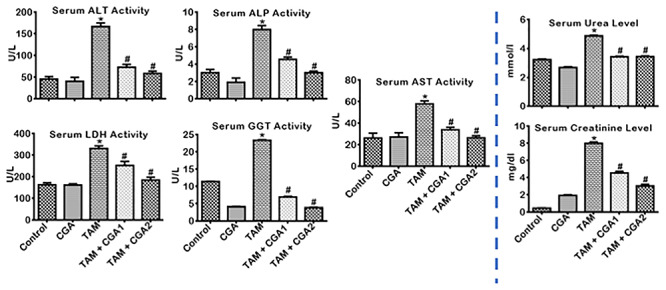
Effect of CGA on biomarkers of hepatic and renal function in rats treated with TAM for 2 weeks. Tamoxifen -TAM: 50 mg/kg; Chlorogenic acid -CGA: 25 and 50 mg/kg; TAM + CGA1, (50 + 25) mg/kg; TAM + CGA2, (50 + 50) mg/kg. Each bar represents mean ± SD of 10 rats. *P < 0.05 versus control; #P < 0.05 versus TAM only. SD: standard deviation; ALP: alkaline phosphatase; AST: aspartate amino transferase; ALT: alanine amino transferase; GGT: gamma glutamyl transferase; LDH: lactate dehydrogenase.
CGA abates TAM-induced hepatic and renal oxidative damage in rats
The influence of CGA on the antioxidant status, oxidative and nitrosative stress by TAM-induced toxicities in rats’ liver and kidney is presented in Figs 3–5. TAM only markedly decreased (P < 0.05) liver and kidney activities of GPx, GST, and GSH (Fig. 3). CGA—at 25 and 50 mg/kg; co-treatment with TAM markedly reverse (P < 0.05) the observed changes by increasing the quantities of GPx, GST, and GSH dose-dependently (CGA2 > CGA1). TAM only caused a similar decrease (P < 0.05) in liver and kidney activities of CAT and SOD as well as the TSH levels (Fig. 4) relative to control. SOD and CAT activities and TSH level increased (P < 0.05) in rat cohorts co-treated with CGA + TAM compared to TAM alone in a dose-dependent manner, except in the kidney where SOD activities and TSH level were not significantly affected at CGA1. Additionally, TAM treatment alone increased (P < 0.05) the levels of LPO and RONS, and XO activity in the liver and kidney of rats compared to the control (Fig. 5). The observed increases of prooxidant elements of LPO, RONS, and XO in the liver and kidney of rat cohorts treated with TAM alone were reduced (P < 0.05) in rat following CGA + TAM co-treatment, except in the liver where XO activities were not significantly affected atCGA1.
Figure 3.
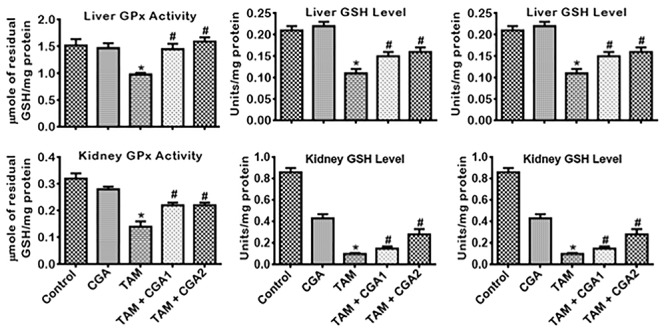
Effect of CGA on GSH-dependent enzyme activities and GSH level in the liver and kidney of rats treated with TAM for 2 weeks. Tamoxifen -TAM: 50 mg/kg; Chlorogenic acid -CGA: 25 and 50 mg/kg; TAM + CGA1, (50 + 25) mg/kg; TAM + CGA2, (50 + 50) mg/kg. Each bar represents mean ± SD of 10 rats. *P < 0.05 versus control; #P < 0.05 versus TAM only. SD: standard deviation; GPx: glutathione peroxidase; GST: glutathione S-transferase; GSH: glutathione.
Figure 5.
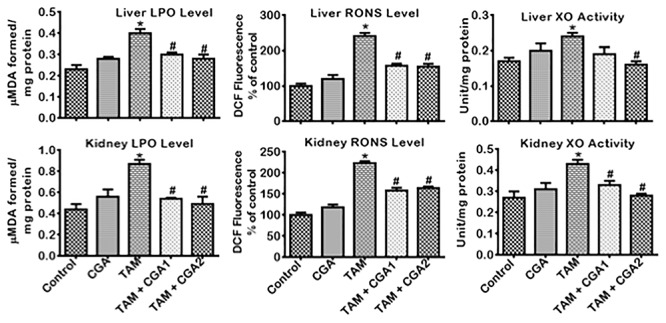
Effect of CGA on the levels of RONS and LPO and the activity of XO in the liver and kidney of rats treated with TAM for 2 weeks. Tamoxifen -TAM: 50 mg/kg; Chlorogenic acid -CGA: 25 and 50 mg/kg; TAM + CGA1, (50 + 25) mg/kg; TAM + CGA2, (50 + 50) mg/kg. Each bar represents mean ± SD of 10 rats. *P < 0.05 versus control; #P < 0.05 versus TAM only. SD: standard deviation; RONS: reactive oxygen/nitrogen species; LPO: lipid peroxidation; XO: xanthine oxidase.
Figure 4.
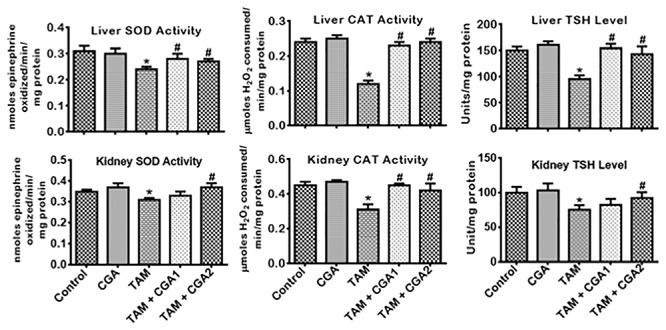
Effect of CGA on SOD and CAT activities and TSH level in the liver and kidney of rats treated with TAM for 2 weeks. Tamoxifen -TAM: 50 mg/kg; Chlorogenic acid -CGA: 25 and 50 mg/kg; TAM + CGA1, (50 + 25) mg/kg; TAM + CGA2, (50 + 50) mg/kg. Each bar represents mean ± SD of 10 rats. *P < 0.05 versus control; #P < 0.05 versus TAM only. SD: standard deviation; SOD: superoxide dismutase; CAT: catalase; TSH: total sulfhydryl group.
CGA suppresses TAM-mediated increase in biomarkers of inflammation and apoptosis in the liver and kidney tissues of rats
The impact of CGA on pro-inflammatory, anti-inflammatory, and apoptotic biomarkers in the liver and kidney of rats treated with TAM is presented in Figs 6–8. Treatment with TAM alone caused increase (P < 0.05) in the kidney and liver activity of MPO and NO level compared to the control rats (Fig. 6). Co-treatment with CGA + TAM reversed the MPO and NO status of rats’ liver and kidney relative to TAM only treated rat cohorts. IL-β and TNF-α level in rats’ liver and kidney treated with TAM only also increased (P < 0.05) with concurrent lessening of IL-10 level compared to the control (Fig. 7). Conversely, rat cohorts co-treated with TAM + CGA (at 25 and 50 mg/kg) exhibit reduced (P < 0.05) pro-inflammatory—IL-β and TNF-α—biomarker levels with a simultaneous increase in IL-10 level compared to TAM only treated rats. Additionally, TAM only treated rats showed increases (P < 0.05) in liver and kidney activities of Casp-9 and Casp-3 (Fig. 8) compared to the control cohort. The observed changes in initiator and executioner caspases’ activities were reduced (P < 0.05) following CGA + TAM co-treatment relative to rat cohorts treated with TAM alone.
Figure 6.
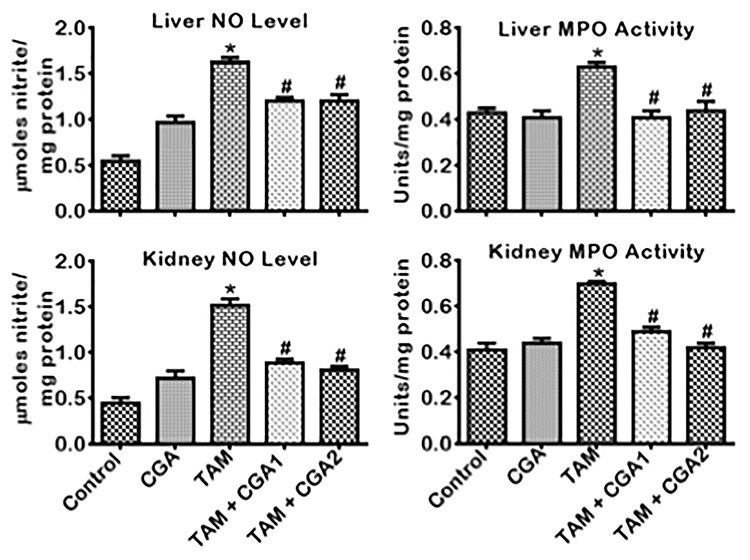
Effect of CGA on NO level and MPO activity in the liver and kidney of rats treated with TAM for 2 weeks. Tamoxifen -TAM: 50 mg/kg; Chlorogenic acid -CGA: 25 and 50 mg/kg; TAM + CGA1, (50 + 25) mg/kg; TAM + CGA2, (50 + 50) mg/kg. Each bar represents mean ± SD of 10 rats. *P < 0.05 versus control; #P < 0.05 versus TAM only. SD: standard deviation; NO: nitric oxide; MPO: myeloperoxidase.
Figure 8.
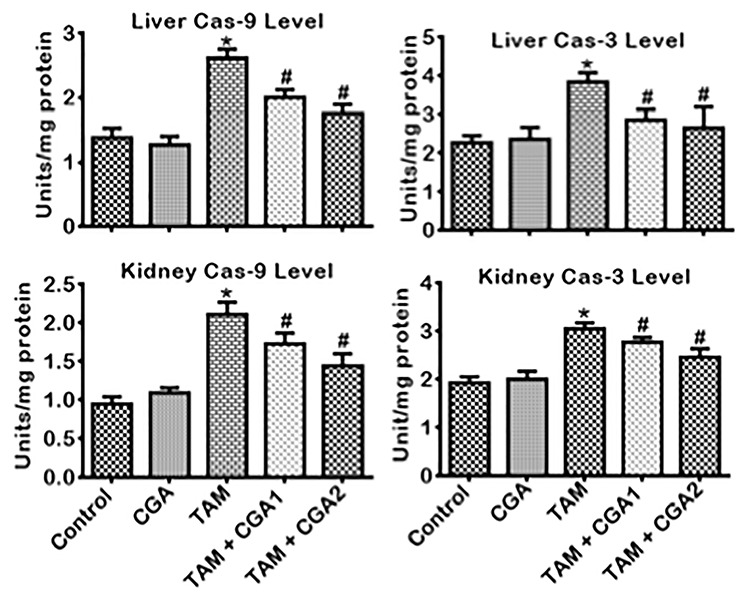
Effect of CGA on Caspase 3 and Caspase 9 activities in the liver and kidney of rats treated with TAM for 2 weeks. Tamoxifen -TAM: 50 mg/kg; Chlorogenic acid -CGA: 25 and 50 mg/kg; TAM + CGA1, (50 + 25) mg/kg; TAM + CGA2, (50 + 50) mg/kg. Each bar represents mean ± SD of 10 rats. *P < 0.05 versus control; #P < 0.05 versus TAM only. SD: standard deviation.
Figure 7.
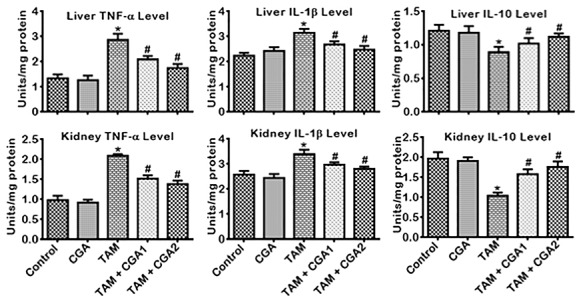
Effect of CGA on TNF-α, IL-1β and IL-10 levels in the liver and kidney of rats treated with TAM for 2 weeks. Tamoxifen -TAM: 50 mg/kg; Chlorogenic acid -CGA: 25 and 50 mg/kg; TAM + CGA1, (50 + 25) mg/kg; TAM + CGA2, (50 + 50) mg/kg. Each bar represents mean ± SD of 10 rats. *P < 0.05 versus control; #P < 0.05 versus TAM only. SD: standard deviation; TNF-α: tumor necrosis factor-alpha; IL1β: interleukin-1Beta; IL-10: interleukin-10.
CGA abates hepatorenal lesions in rats treated with TAM
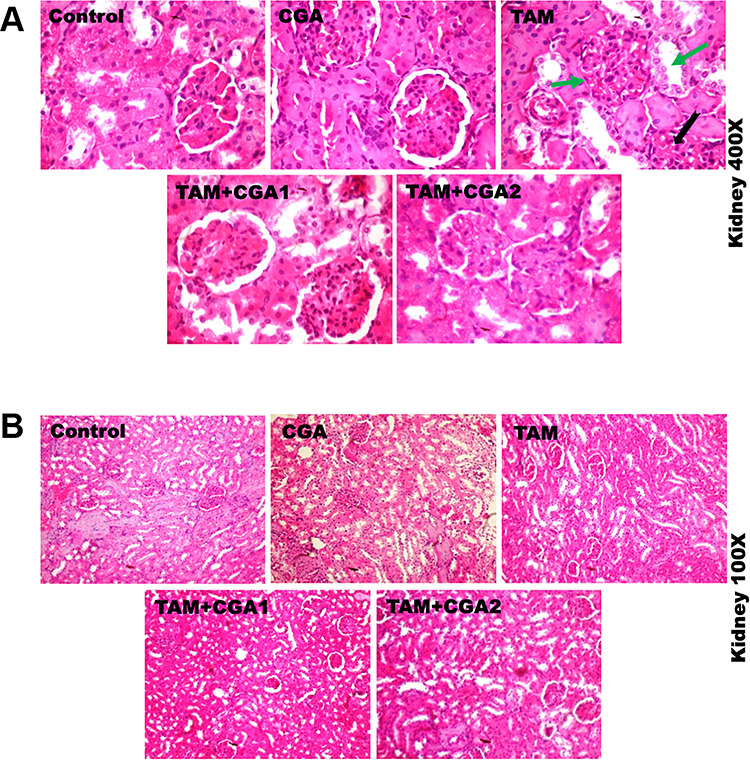
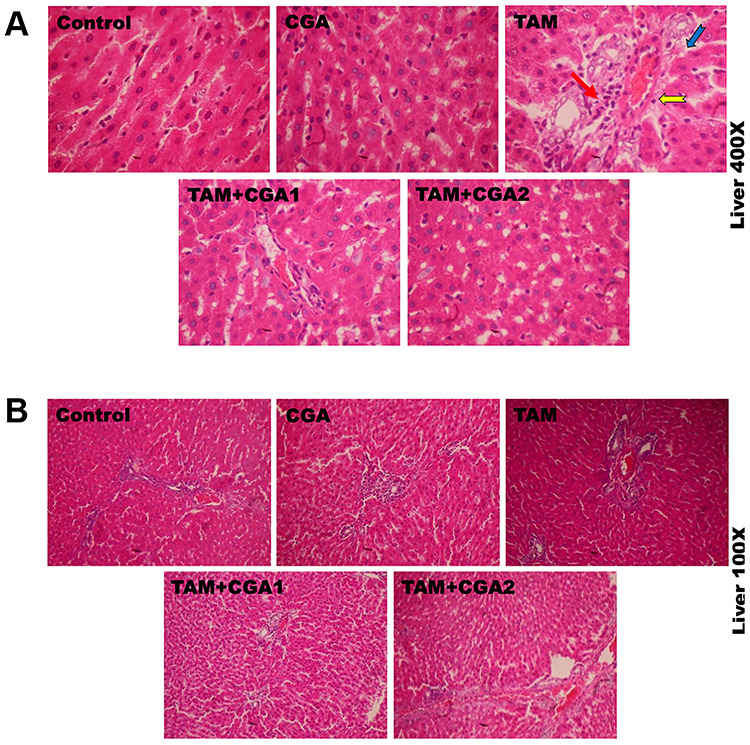
The representative photomicrographs showing the effect of CGA on TAM-induced histological damages in the liver and kidney of experimental rats are presented in Figs 9 and 10; at ×400 (top row) and ×100 (bottom row) magnification. The liver and kidney of control and rats treated with CGA alone appeared normal with well-preserved tissue morphological architecture. The liver of rats treated with TAM alone showed severe disseminated sinusoidal congestion (red arrow) and infiltration of inflammatory mononuclear cells (yellow notched arrow), couples with fibroplasia of the periportal region (blue arrow). The kidney of rats treated with TAM alone showed multiple area of glomerulonecrosis and tubular desquamation (green arrow) and the presence of inflammatory cells (black notched arrow). However, the liver and kidney of rats co-treated with CGA and TAM dose-dependently reduced TAM-mediated alterations in the liver and kidney with visible improvement in the liver and kidney cyto-architecture at CGA1, and histological features were somewhat similar to controls at higher CGA dose (CGA2), but with mild disseminated congestion in the kidney. Table 2 depicts semiquantitative values of hepatic and renal lesions frequencies identified in experimentalrats.
Figure 9.
Representative photomicrographs of experimental rat liver. Control rats showed normal liver morphology. Liver of rats treated with TAM alone presenting severe disseminated congestion (red arrow), and infiltration of inflammatory cells (yellow notched arrow), couples with fibroplasia of the periportal region (blue arrow). However, the liver of rats co-treated with CGA + TAM dose-dependently reduced TAM-mediated alterations in the liver to a degree somewhat similar to control rat cohort with visible improvement in the live cyto-architecture at CGA1, and histological features are similar to controls at higher CGA dose (CGA2). H and E stained. Magnification: top row ×400; bottom row ×100.
Figure 10.
Representative photomicrographs of experimental rat kidney. Control rats showed normal kidney morphology. Kidney of rats treated with TAM alone showing glomerulonecrosis and tubular desquamation (green arrow), and presence of inflammatory cells (black notched arrow). The kidney of rats co-treated with CGA + TAM dose-dependently abated TAM-mediated injuries in the kidney with visible improvement in the kidney cyto-architecture at CGA1, and histological features were somewhat similar to controls at higher CGA dose (CGA2), except with mild disseminated congestion in the kidney. H and E stained, magnification: top row ×400; bottom row ×100.
Table 2.
Frequency of histological alterations identified in the liver and kidney of rats treated with CGA and TAM for 14 consecutivedays
| Parameters | Control | TAM alone | CGA alone | TAM + CGA1 | TAM + CGA2 |
|---|---|---|---|---|---|
| Liver | |||||
| Congestion of vessels | 0 | 3 | 0 | 2 | 1 |
| Focal area of inflammation | 0 | 4 | 0 | 2 | 1 |
| Fatty infiltration | 0 | 4 | 0 | 1 | 1 |
| Kidney | |||||
| Large vacuoles | 0 | 3 | 0 | 2 | 1 |
| Focal area of necrosis | 0 | 4 | 0 | 1 | 1 |
| Inflammatory cells | 0 | 4 | 0 | 1 | 1 |
| Hepatic degeneration | 0 | 4 | 0 | 2 | 1 |
Chlorogenic acid -CGA: 25 and 50 mg/kg; Tamoxifen -TAM: 50 mg/kg n = 10. Values are indicative of the severity of histological changes observed in their tissues. Scores: 0—within normal limit; 1—change barely exceed that within normal limit; 2—easily identified lesion with limited severity; 3—prominent lesions with potential for severity; 4—complete severe changes as possible in organ.
Discussion
TAM is one of the most commonly prescribed chemotherapeutic agents for all stages of hormone-dependent breast malignancy [6]. Despite its several side effects, especially toxicity to the liver [8, 9] and kidney [10, 12] demonstrated in human and rat models, the usage of TAM in breast cancer therapeutic is a common practice in the clinical setting. Recent experimental studies revealed that plant-derived phytochemicals mediate antioxidant, anti-inflammatory, anti-cancer, antiapoptotic effects [19, 20, 22]. Thus, such plant-derived compounds are good natural source of chemopreventive agents against toxic responses from many antineoplastic agents. CGA is a phenolic compound present in several plant species, reported to protect against a wide range of xenobiotic-mediated toxicities, mechanistically by reducing ROS generation, and inflammatory responses. The present study examined the protective effect of CGA against TAM-induced hepatorenal toxicities in cohorts of rats treated for 2 weeks. Treatment with TAM alone altered mean body weight, and relative liver and kidney weights. Arnold et al. [46] and Elsea et al. [47] reported that reduction in weight may be brought about by cytokine (IL-6) stimulation, and growth hormones downregulation, and correlated to anorexia nervosa, lethargy, breakdown of body cell mass, and depletion of nitrogen. On the contrary, the co-administration of CGA at different doses abated TAM-induced body weight loss in the experimental rats. This finding may be attributed to CGA-mediated inhibition of the activation and propagation of IL-6 [48, 49].
Liver and kidney function biomarkers are relied upon in the proper diagnosis of hepatotoxicity and nephrotoxicity, and any significant increase in the levels of biomarkers of dysfunction of the liver and kidney correlates to injury to these organs. In this study, we observed that TAM markedly increased the activities of ALT, AST, ALP, LDH, and GGT in the liver of rats and the levels of creatinine and urea in the kidneys compared to the control and CGA only. These observations agree with the observation by Gao et al. [50], who demonstrated TAM’s hepatotoxic potential in mice. ALT is a gold standard for the detection of liver injury. It is located primarily in the liver and, together with AST which is localized in the liver and other organs such as the brain, heart, and skeletal muscles, plays an essential role in the metabolism of amino acid and gluconeogenesis. ALT and AST catalyze the transfer of amino group from alanine and aspartic acid to α-ketoglutarate to yield glutamic acid and pyruvic acid or oxaloacetic acid [51].
ALP, LDH, and GGT are nonspecific biomarkers for the diagnosis of hepatocellular damage. However, elevated levels of these biomarkers in the serum of experimental animals treated with a potent hepatotoxin could serve as a secondary diagnostic marker for liver disease. While ALP is part of a family zinc-metalloenzymes that are highly localized in the microvilli of the bile canaliculus as well as several other tissues including bone, intestines, and placenta; GGT is a glycoprotein that catalyzes the transfer of a gamma-glutamyl group from peptides to other amino acids, and is localized on membranes of cells with high secretory or absorptive activities like liver, kidney, pancreas, intestine, and prostate, testicles, spleen, heart, and brain. Significant elevation in these biomarkers is indicative of the cholestatic pattern of hepatic injury [52, 53]. LDH is an intracellular enzyme that catalyzes pyruvate’s reversible transformation to lactate with a concurrent generation of NAD+ to drive the glycolytic pathway and NADH for energy generation anaerobes. It is localized in tissues that utilize glucose energy, and therefore not organ-specific. An elevated level of LDH is an indication of cell necrosis, megaloblastic anemia, shock, and liver diseases [54]. Also, creatinine and urea are byproducts of the cellular breakdown of creatine phosphate in the myocytes, and protein metabolism is used to predict the same integrity and functionality of the kidney of experimental rats. The elevated level of creatinine and urea is indicative of the onset of nephrotoxicity. The diagnostic precision of the two biomarkers differs. Creatinine is a better predictor of renal damage than urea [55] as it provides an accurate measure of glomerular filtration rate [56]. Contrary to the preceding, CGA protected against hepatic and renal injury exemplified by decrease serum levels of hepatic transaminases and urea and creatinine, respectively, since. CGA protective effect averted injury-mediated leakage of transaminases into circulation and the excessive breakdown of creatine phosphate and amino acids in the body dose-dependently. CGA at both doses (25 and 50 mg/kg) tested brought about the reduction in serum urea level, but this reduction in urea level in the presence of TAM was not affected by the doses of CGA administered. The implication of this is that in some instances, the low doses of CGA (25 mg/kg) were not able to avert the effects of TAM, but confers partial protection.
The generation of ROS in the liver and kidney of experimental animals is necessary for normal physiologic and biochemical processes. However, increased ROS production beyond the scavenging potential of endogenous antioxidants has been shown to initiate oxidative stress leading to lipid peroxidation, the formation of DNA adducts, protein crosslinks as well as suppression of endogenous antioxidant levels in the liver and kidney [12, 13]. Compared to the control and CGA alone, TAM caused a significant increase in the levels of LPO and RONS activity with concurrent decrease in CAT, SOD, GPx, and GST activities as well as GSH and TSH levels. Increase in activities and levels of prooxidant elements following TAM administration and bioactivation to 4-hydroxytamoxifen (4-OHTAM) [54–58] results from concurrent production of RONS in the absence of RONS scavengers. Prooxidants also interact with membrane lipids, forming lipid peroxidation products, including malondialdehyde (MDA) and 4-Hydroxy-2-Nonenal (4-HNE) [59, 60]. Moreover, 4-OHTAM may be further biotransformed via P450-mediated oxidation into para-quinone methide, forming a stable adduct with nitrogenous bases of DNA [57]. The formation of DNA adducts by paraquinone methide may result in transition and transversion mutations in the liver and kidney cells. The elevated level of RONS in our study further revealed the oxidative and electrophilic tendency TAM. Owumi and Dim [37] opined that increased levels of RONS in the liver and kidney tissues of rats exposed to foreign compounds are an indication of increased generation of free radical species and suppression of the antioxidant defense system.
Another determinant of oxidative and electrophilic stress is XO. XO, together with xanthine dehydrogenase (XDH), forms the structural motif of xanthine oxidoreductase complex (XOR). XO catalyzes the oxidation of hypoxanthine to xanthine and then uric acid in the metabolism of purines with concomitant release of O2·− and H2O2 [61–63] in the liver and kidney cells. To maintain redox balance and tissues homeostasis, SOD, CAT, GPx, GST, GSH, and TSH protect against ROS and RNS. SOD mediates the dismutation of O2·− into H2O2, while CAT and GPx converts H2O2 into water and alcohols [64]; GST removes reactive intermediates capable of generating deleterious ROS [65], while GSH and TSH detoxify peroxides with their thiol residues [66, 67]. Treatment with TAM increases XO activity in the liver and kidney of the rats; XO is known to tilt redox balance in favor of prooxidants. The alteration in redox state of the experimental rats was abated by CGA augmentation of rat’s antioxidant defenses. CGA mediated reversals in the decreases of antioxidant enzyme, GSH and total thiol did not completely eliminate TAM toxicity nor restore these biomarkers of oxidative health to levels comparable to baseline -control. However, the observed improvement in anti-oxidative stress biomarkers implies that CGA within the limits of this study can mitigate the toxic effect of TAM with promising strategies to further explore to completely eliminate TAM toxicity. Our findings corroborate recent reports demonstrating the protective effect of CGA against lipopolysaccharide-induced hepatic toxicities in rats [68, 68], and sodium arsenite mediated kidney damages in mice [26].
Pro-inflammatory markers and ROS play essential roles in liver and kidney injuries in experimental animals [6, 26]. Typically, a balance between the pro-inflammatory and anti-inflammatory biomarkers is required to maintain organ and also systemic homeostasis in the liver and kidney of healthy individuals [69–71]. An imbalance in pro- and anti-inflammatory biomarkers can trigger toxic responses in the liver and kidney [72, 73] from an increase in pro-inflammation and decrease in anti-inflammatory mediators. TAM mediates a negative shift in the balance between the pro-inflammatory and the anti-inflammatory biomarkers. Pro-inflammatory biomarkers—NO, MPO, IL-1β, and TNF-α—were significantly increased by TAM, with a concomitant reduction in the level of IL-10 compared to the control and CGA alone treated groups. This imbalance is attributable to TAM-mediated toxicity. It can trigger the expression of the Toll-like receptors (TLRs) among other patterns of recognition receptors in the cells of the liver and kidney [74, 75], consequently activating specific transcription factors including mitogen-activating protein (MAP) kinases, nuclear factor kappa-light-chain-enhancer of activated B cells (NF-κB), and further production of pro-inflammatory cytokines such as IL-1β and TNF-α capable of mediating acute and chronic liver disorder [76, 77].
Also, IRF5, MAPK, and NF-κB can trigger the inducible nitric oxide synthase (iNOS) activation to produce NO in the liver [15, 78] and kidney [79, 80]. Uncontrolled generation of NO at high levels will lead to the production of numerous RNS, which can mediate a wide range of physiological and pathological effects in the liver and kidney [81]. Additionally, high levels of NO can readily react with O2.- forming highly reactive ONOO− which could induce lipid peroxidation or indirectly react with reduced GSH as well as nitrosative and oxidative modifications to proteins, nucleic acids, and lipids with simultaneous evolution of oxidative products which accumulate in the cells of the liver and kidney and cause their damage [82, 83]. MPO is a heme-containing enzyme found in mammalian neutrophils. It is known to catalyze the hydrogen peroxide mediated peroxidation of halide ions and the pseudohalide thiocyanate with concomitant release of HOCl. HOCl can react with several biomolecules, especially those containing thiols, nitrogen compounds, or unsaturated double carbon bonds, and trigger the dysfunction of the liver’s cells and the kidney [84, 85].
The induction of inflammation was further manifested in our studies following the significant suppression of IL-10 in TAM’s liver and kidney tissues. IL-10 is an anti-inflammatory cytokine that controls inflammation and inhibits dendritic cells’ activation and differentiation and macrophages [86, 87]. On the other hand, rats treated with CGA (25 and 50 mg/kg) exhibited reduced pro-inflammatory markers and cytokines (NO, MPO, IL-1β, and TNF-α) with concurrent increase in the level of IL-10. The anti-inflammatory property of CGA has recently been reported [48], and CGA may have abated inflammation by inhibiting some inducers—NF-κB and iNOS—of inflammatory and oxidative responses in experimentalrats.
Uncontrolled oxidative and nitrosative stress and inflammation in the liver and kidney cells, following exposure to foreign substances, can alter their architectural buildup, thereby making them susceptible to self-destruction. In our study, TAM significantly increased activities of Casp-9 and Casp-3 in the liver and kidney tissues. This signifies that TAM may have induced apoptosis via either the extrinsic or intrinsic pathways of apoptosis. Accordingly, sustained oxidative and inflammatory responses will mobilize Calpain to activate p38 resulting in the phosphorylation of p53, which then upregulates the expression of pro-apoptotic genes, including Bax and Bak. These proteins are translocated into the liver and kidney cells’ mitochondria, thereby inducing mitochondrial permeability transition with a simultaneous release of cytochrome C (Cyt. C). The assemblage of Cyt C with apoptotic protease activating factor 1 (APaf-1) and procaspase-9 will lead to the formation of apoptosome and active Casp-9 (initiator caspase), which then activates procaspase-3 into active Casp-3 (the executioner caspase). Active Caps-3 eventually commits the liver and kidney cells to apoptosis by cleaving the substrate and recognizing the DxxD motif [3, 5, 8]. However, rats treated with CGA (25 and 50 mg/kg) exhibited a significant decrease in apoptotic markers of Casp-9 and Caps-3 in the liver and kidney tissues. Earlier studies have also demonstrated the antiapoptotic effect of CGA [88–90].
Assessment of the liver and kidney tissues’ biochemical changes following TAM-induced hepatorenal injury without evaluating the histopathological changes will be clinically incorrect. To this end, we investigated the effect of TAM on the morphology of the liver and kidney tissues. The outcomes revealed severe disseminated congestion and infiltration of inflammatory cells in the liver and showed a focal area of necrosis and inflammatory cells in the kidney. This may be due to the increased generations of oxygen radicals such as O2−, OH, and H2O2, capable of damaging these organs’ cells via lipid peroxidation, the formation of protein crosslinks, and DNA double-strand breaks [6, 91]. CGA dose-dependently reduced TAM-mediated alterations in the liver and kidney with visible improvement in the live and kidney cyto-architecture at CGA1, and histological features were somewhat similar to controls at higher CGA dose (CGA2). However, there were still mild disseminated congestion in the kidney and the presence of inflammatory cells at TAM + CGA1.
The outcomes of the histopathology of the liver and kidney were similar to the biochemical findings on the protective effect of CGA against TAM-induced hepatorenal toxicities.
In conclusion, the present study reveals that the administration of TAM significantly alters the integrity and functionality of the cells of the liver and kidney by elevating the biomarkers of the dysfunction of the liver and kidney in the serum, as well as oxidative, inflammatory, and apoptotic markers with a concomitant decrease in mean body weight, anti-inflammatory markers, and antioxidant defense system. However, CGA demonstrated a protective activity by increasing the antioxidant defense system, mean body weight, with a concurrent decrease in serum liver biomarkers, as well as markers of oxidation, inflammation, and apoptosis. Based on these findings, we propose that the protective effect of CGA against TAM-induced hepatorenal toxicities could be a combination of the anti-oxidative, anti-inflammatory, and antiapoptotic effects of CGA as depicted in our proposed mechanism of action presented in Fig. 11. Therefore, CGA supplementation in the diet of patients undergoing TAM chemotherapy may be necessary to circumvent possible clinical sequelae. However, additional study is necessary to elucidate the molecular mechanisms of the anti-oxidative, anti-inflammatory, antiapoptotic, anti-hepatotoxic, and anti-nephrotoxic effects ofCGA.
Figure 11.
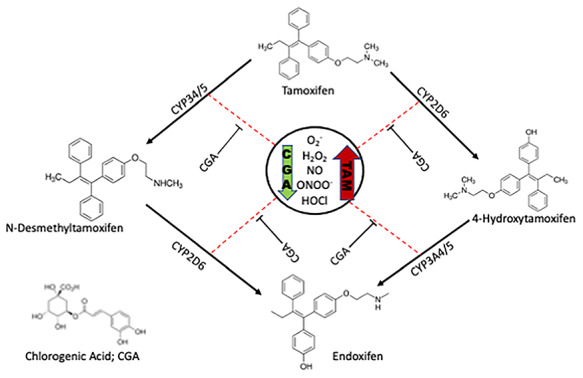
Plausible mechanisms of CGA-mediated amelioration of TAM-induced injury in rats’ hepatorenal system. Note that Cytochrome P450’s (CYP’s), known to biotransform TAM to various isoforms, here was used as a model to illustrate the consequence of induction of Phase II drug metabolizing enzymes is abrogated by CGA to produce less prooxidant radicals. The red arrow indicates upregulation and the green arrow indicates downregulation.
CRediT roles
S.E.O., A.K.O., U.O.A., and J.K.O. conceptualized the experiments, carried out the research and preliminary data analysis. S.E.O. and U.O.A. supervised the investigation. S.E.O. checked the generated data for error. The manuscript was written and revised by S.E.O., A.K.O., and U.O.A.
Supplementary Material
Acknowledgements
The authors will like to acknowledge the technical assistance of Mr Eric Sabo of the Department of Biochemistry, University of Ibadan.
Contributor Information
Solomon E Owumi, Cancer Research and Molecular Biology Laboratories, Department of Biochemistry, Faculty of Basic Medical Sciences, College of Medicine, University of Ibadan, Ibadan 200004, Nigeria.
Joseph K Olusola, Cancer Research and Molecular Biology Laboratories, Department of Biochemistry, Faculty of Basic Medical Sciences, College of Medicine, University of Ibadan, Ibadan 200004, Nigeria.
Uche O Arunsi, Department of Cancer Immunology and Biotechnology, School of Medicine, University of Nottingham, NG7 2RD, UK.
Adegboyega K Oyelere, School of Chemistry & Biochemistry, Parker H. Petit Institute for Bioengineering and Bioscience, Georgia Institute of Technology, Atlanta, GA 30332-0400, USA.
Conflict of Interest
The authors have no conflicts of interest to declare.
Funding
This research was done without a specific grant from any funding agency in the public, commercial, or not-for-profit sectors.
References
- 1. Lee S, Lee MS, Park Jet al. Oxidative stress in the testis induced by tamoxifen and its effects on early embryo development in isogenic mice. J Toxicol Sci 2012;37:675–9. [DOI] [PubMed] [Google Scholar]
- 2. Singh B, Bhat NK, Bhat HK. Partial inhibition of estrogen-induced mammary carcinogenesis in rats by tamoxifen: balance between oxidant stress and estrogen responsiveness. PLoS One 2011;6:e25125. [DOI] [PMC free article] [PubMed] [Google Scholar]
- 3. Nazarewicz RR, Zenebe WJ, Parihar Aet al. Tamoxifen induces oxidative stress and mitochondrial apoptosis via stimulating mitochondrial nitric oxide synthase. Cancer Res 2007;67:1282–90. [DOI] [PubMed] [Google Scholar]
- 4. Meunier L, Larrey D. Chemotherapy-associated steatohepatitis. Ann Hepatol 2020;19:597–601. [DOI] [PubMed] [Google Scholar]
- 5. Mandlekar S, Kong AT. Mechanisms of tamoxifen-induced apoptosis. Apoptosis 2001;6:469–77. [DOI] [PubMed] [Google Scholar]
- 6. Bekele RT, Venkatraman G, Liu RZet al. Oxidative stress contributes to the tamoxifen-induced killing of breast cancer cells: implications for tamoxifen therapy and resistance. Sci Rep 2016;6:21164. [DOI] [PMC free article] [PubMed] [Google Scholar]
- 7. Saphner T, Triest-Robertson S, Li Het al. The association of nonalcoholic steatohepatitis and tamoxifen in patients with breast cancer. Cancer 2009;115:3189–95. [DOI] [PubMed] [Google Scholar]
- 8. Ribeiro MP, Santos AE, Custódio JBA. Mitochondria: the gateway for tamoxifen-induced liver injury. Toxicology 2014;323:10–8. [DOI] [PubMed] [Google Scholar]
- 9. Miyamura M, Yokota J, Saibara T. Drug-induced nonalcoholic steatohepatitis. Journal of the Pharmaceutical Society of Japan 2016;136:579–82. [DOI] [PubMed] [Google Scholar]
- 10. McClay EF, McClay MET, Monroe Let al. The effect of tamoxifen and cisplatin on the disease- free and overall survival of patients with high risk malignant melanoma. Br J Cancer 2000;83:16–21. [DOI] [PMC free article] [PubMed] [Google Scholar]
- 11. Wong DWL, Yiu WH, Chan KWet al. Activated renal tubular Wnt/beta-catenin signaling triggers renal inflammation during overload proteinuria. Kidney Int 2018;93:1367–83. [DOI] [PMC free article] [PubMed] [Google Scholar]
- 12. El-Gendy AA, Elsaed WM, Abdallah HI. Potential role of estradiol in ovariectomy-induced derangement of renal endocrine functions. Ren Fail 2019;41:507–20. [DOI] [PMC free article] [PubMed] [Google Scholar]
- 13. Perumal SS, Shanthi P, Sachdanandam P. Augmented efficacy of tamoxifen in rat breast tumorigenesis when gavaged along with riboflavin, niacin, and CoQ10: effects on lipid peroxidation and antioxidants in mitochondria. Chem Biol Interact 2005;152:49–58. [DOI] [PubMed] [Google Scholar]
- 14. Hashiba M, Kasahara T, Kim SYet al. DNA damage and altered gene expression of enzymes for metabolism and DNA repair by tamoxifen and toremifene in the female rat liver. Cancer Sci 2006;97:468–77. [DOI] [PMC free article] [PubMed] [Google Scholar]
- 15. Kim SY, Suzuki N, Santosh Laxmi YRet al. Genotoxic mechanism of tamoxifen in developing endometrial cancer. Drug Metab Rev 2004;36:199–218. [DOI] [PubMed] [Google Scholar]
- 16. Li G, et al. Antimicrobial effect and mode of action of chlorogenic acid on Staphylococcus aureus. Eur Food Res Technol 2013;238:589–96. [Google Scholar]
- 17. Niggeweg R, Michael AJ, Martin C. Engineering plants with increased levels of the antioxidant chlorogenic acid. Nat Biotechnol 2004;22:746–54. [DOI] [PubMed] [Google Scholar]
- 18. Torres-Contreras AM, Nair V, Cisneros-Zevallos Let al. Effect of exogenous amylolytic enzymes on the accumulation of chlorogenic acid isomers in wounded potato tubers. J Agric Food Chem 2014;62:7671–5. [DOI] [PubMed] [Google Scholar]
- 19. Dhingra D, Gahalain N. Reversal of reserpine-induced orofacial dyskinesia by Chlorogenic acid in rats. Pharmacol Ther 2016;7:272–7. [Google Scholar]
- 20. Gao W, et al. Chlorogenic acid attenuates dextran sodium Sulfate-induced ulcerative colitis in mice through MAPK/ERK/JNK pathway. Biomed Res Int 2019;2019:6769789. [DOI] [PMC free article] [PubMed] [Google Scholar]
- 21. Huang K, Liang XC, Zhong YLet al. 5-Caffeoylquinic acid decreases diet-induced obesity in rats by modulating PPARalpha and LXRalpha transcription. J Sci Food Agric 2015;95:1903–10. [DOI] [PubMed] [Google Scholar]
- 22. Kim H, Pan JH, Kim SHet al. Chlorogenic acid ameliorates alcohol-induced liver injuries through scavenging reactive oxygen species. Biochimie 2018;150:131–8. [DOI] [PubMed] [Google Scholar]
- 23. Liu YJ, Zhou CY, Qiu CHet al. Chlorogenic acid induced apoptosis and inhibition of proliferation in human acute promyelocytic leukemia HL60 cells. Mol Med Rep 2013;8:1106–10. doi: 10.3892/mmr.2013.1652. [DOI] [PubMed] [Google Scholar]
- 24. Meng S, et al. Roles of chlorogenic acid on regulating glucose and lipids metabolism: a review. Evid Based Complement Alternat Med 2013;2013:801457. [DOI] [PMC free article] [PubMed] [Google Scholar]
- 25. Zhao Y, Wang J, Ballevre Oet al. Antihypertensive effects and mechanisms of chlorogenic acids. Hypertens Res 2012;35:370–4. [DOI] [PubMed] [Google Scholar]
- 26. al-Megrin WA, Metwally DM, Habotta OAet al. Nephroprotective effects of chlorogenic acid against sodium arsenite-induced oxidative stress, inflammation, and apoptosis. J Sci Food Agric 2020;100:5162–70. [DOI] [PubMed] [Google Scholar]
- 27. Albukhari AA, Gashlan HM, el-Beshbishy HAet al. Caffeic acid phenethyl ester protects against tamoxifen-induced hepatotoxicity in rats. Food Chem Toxicol 2009;47:1689–95. [DOI] [PubMed] [Google Scholar]
- 28. Lowry OH, Rosebrough NJ, Farr ALet al. Protein measurement with the Folin phenol reagent. J Biol Chem 1951;193:265–75. [PubMed] [Google Scholar]
- 29. Ellman GL. Tissue sulfhydryl groups. Arch Biochem Biophys 1959;82:70–7. [DOI] [PubMed] [Google Scholar]
- 30. Jollow DJ, Mitchell JR, Zampaglione Net al. Bromobenzene-induced liver necrosis. Protective role of glutathione and evidence for 3,4-bromobenzene oxide as the hepatotoxic metabolite. Pharmacology 1974;11:151–69. [DOI] [PubMed] [Google Scholar]
- 31. Habig WH, Pabst MJ, Jakoby WB. Glutathione S-transferases. The first enzymatic step in mercapturic acid formation. J Biol Chem 1974;249:7130–9. [PubMed] [Google Scholar]
- 32. Rotruck JT, Pope AL, Ganther HEet al. Selenium: biochemical role as a component of glutathione peroxidase. Science 1973;179:588–90. [DOI] [PubMed] [Google Scholar]
- 33. Misra HP, Fridovich I. The role of superoxide anion in the autoxidation of epinephrine and a simple assay for superoxide dismutase. J Biol Chem 1972;247:3170–5. [PubMed] [Google Scholar]
- 34. Clairborne A. In: Greenwald AR (ed). Catalase activity. Handbook of Methods for Oxygen Radical Research. Boca Raton, FL: CRC Press, 1995. [Google Scholar]
- 35. Bergmeyer HI, Gawehn K, Grassl M. Methods of Enzymatic Analysis, Vol. 1, 2nd edn. New York, NY: Academic Press Inc., 1974. [Google Scholar]
- 36. Buege JA, Aust SD. Microsomal lipid peroxidation. Methods Enzymol 1978;52:302–10. [DOI] [PubMed] [Google Scholar]
- 37. Owumi SE, Dim UJ. Manganese suppresses oxidative stress, inflammation and caspase-3 activation in rats exposed to chlorpyrifos. Toxicol Rep 2019;6:202–9. [DOI] [PMC free article] [PubMed] [Google Scholar]
- 38. Green LC, Wagner DA, Glogowski Jet al. Analysis of nitrate, nitrite, and [15N]nitrate in biological fluids. Anal Biochem 1982;126:131–8. [DOI] [PubMed] [Google Scholar]
- 39. Granell S, Gironella M, Bulbena Oet al. Heparin mobilizes xanthine oxidase and induces lung inflammation in acute pancreatitis. Crit Care Med 2003;31:525–30. [DOI] [PubMed] [Google Scholar]
- 40. Bancroft JD, Gamble M (eds). In: Theory and practise of histological techniques, 6th edn. Philadelphia, PA: Churchill Livingstone Elsevier, 2008, 83–134. [Google Scholar]
- 41. Owumi SE, Najophe ES. Dichloromethane and ethanol co-exposure aggravates oxidative stress indices causing hepatic and renal dysfunction in pubertal rats. Toxicology Research and Application 2019;3:1–10. doi: 10.1177/2397847319855285. [DOI] [Google Scholar]
- 42. Owumi SE, Aliyu-Banjo NO, Danso OF. Fluoride and diethylnitrosamine coexposure enhances oxido-inflammatory responses and caspase-3 activation in liver and kidney of adult rats. J Biochem Mol Toxicol 2019;33:e22327. [DOI] [PubMed] [Google Scholar]
- 43. Gibson-Corley KN, Olivier AK, Meyerholz DK. Principles for valid histopathologic scoring in research. Vet Pathol 2013;50:1007–15. [DOI] [PMC free article] [PubMed] [Google Scholar]
- 44. Klopfleisch R. Multiparametric and semiquantitative scoring systems for the evaluation of mouse model histopathology–a systematic review. BMC Vet Res 2013;9:123. [DOI] [PMC free article] [PubMed] [Google Scholar]
- 45. Owumi SE, Nwozo SO, Effiong MEet al. Gallic acid and omega-3 fatty acids decrease inflammatory and oxidative stress in manganese-treated rats. Exp Biol Med (Maywood) 2020;245:835–44. [DOI] [PMC free article] [PubMed] [Google Scholar]
- 46. Arnold WC, Shirkey B, Frindik Pet al. Effect of growth hormone on kidney growth and glomerular structure. Pediatr Nephrol 1991;5:529–32. [DOI] [PubMed] [Google Scholar]
- 47. Elsea CR, Kneiss JA, Wood LJ. Induction of IL-6 by cytotoxic chemotherapy is associated with loss of lean body and fat mass in tumor-free female mice. Biol Res Nurs 2015;17:549–57. [DOI] [PMC free article] [PubMed] [Google Scholar]
- 48. Lou L, Zhou J, Liu Yet al. Chlorogenic acid induces apoptosis to inhibit inflammatory proliferation of IL-6-induced fibroblast-like synoviocytes through modulating the activation of JAK/STAT and NF-kappa B signaling pathways. Exp Ther Med 2016;11:2054–60. [DOI] [PMC free article] [PubMed] [Google Scholar]
- 49. Hwang SJ, Kim YW, Park Yet al. Anti-inflammatory effects of chlorogenic acid in lipopolysaccharide-stimulated RAW 264.7 cells. Inflamm Res 2014;63:81–90. [DOI] [PubMed] [Google Scholar]
- 50. Gao FF, Lv JW, Wang Yet al. Tamoxifen induces hepatotoxicity and changes to hepatocyte morphology at the early stage of endocrinotherapy in mice. Biomed Rep 2016;4:102–6. [DOI] [PMC free article] [PubMed] [Google Scholar]
- 51. Ozer J, Ratner M, Shaw Met al. The current state of serum biomarkers of hepatotoxicity. Toxicology 2008;245:194–205. [DOI] [PubMed] [Google Scholar]
- 52. Gowda S, et al. A review on laboratory liver function tests. Pan Afr Med J 2009;3:17. [PMC free article] [PubMed] [Google Scholar]
- 53. Horn KD, Wax P, Schneider SMet al. Biomarkers of liver regeneration allow early prediction of hepatic recovery after acute necrosis. Am J Clin Pathol 1999;112:351–7. [DOI] [PubMed] [Google Scholar]
- 54. Arika WM, Nyamai DW. Biochemical markers of in vivo hepatotoxicity. Journal of Clinical Toxicology 2016;06:1–8. doi: 10.4172/2161-0495.1000297. [DOI] [Google Scholar]
- 55. Owumi SE, Olayiwola YO, Alao GEet al. Cadmium and nickel co-exposure exacerbates genotoxicity and not oxido-inflammatory stress in liver and kidney of rats: protective role of omega-3 fatty acid. Environ Toxicol 2020;35:231–41. [DOI] [PubMed] [Google Scholar]
- 56. van Veldhuisen DJ, Ruilope LM, Maisel ASet al. Biomarkers of renal injury and function: diagnostic, prognostic and therapeutic implications in heart failure. Eur Heart J 2016;37:2577–85. [DOI] [PubMed] [Google Scholar]
- 57. Banerjee S, Ghosh J. Drug metabolism and oxidative stress: cellular mechanism and new therapeutic insights. Biochemistry & Analytical Biochemistry 2016;5:255. doi: 10.4172/2161-1009.1000255. [DOI] [Google Scholar]
- 58. Horn TL, Torres KEO, Naylor JMet al. Subchronic toxicity and toxicogenomic evaluation of tamoxifen citrate + bexarotene in female rats. Toxicol Sci 2007;99:612–27. [DOI] [PubMed] [Google Scholar]
- 59. Ayala A, Munoz MF, Arguelles S. Lipid peroxidation: production, metabolism, and signaling mechanisms of malondialdehyde and 4-hydroxy-2-nonenal. Oxid Med Cell Longev 2014;2014:360438. [DOI] [PMC free article] [PubMed] [Google Scholar]
- 60. Ito F, Sono Y, Ito T. Measurement and clinical significance of lipid peroxidation as a biomarker of oxidative stress: oxidative stress in diabetes, atherosclerosis, and chronic inflammation. Antioxidants 2019;8:1–28. [DOI] [PMC free article] [PubMed] [Google Scholar]
- 61. Kellner, M., Noonepalle S., Lu Q.et al. ROS Signaling in the Pathogenesis of Acute Lung Injury (ALI) and Acute Respiratory Distress Syndrome (ARDS) Advances in experimental medicine and biology 2017;967:105–37. doi: 10.1007/978-3-319-63245-2_8. [DOI] [PMC free article] [PubMed] [Google Scholar]
- 62. Panth N, Paudel KR, Parajuli K. Reactive oxygen species: a key Hallmark of cardiovascular disease. Advances in Medicin 2016;2016:1–12. [DOI] [PMC free article] [PubMed] [Google Scholar]
- 63. Shaban NZ, Ahmed Zahran AM, el-Rashidy FHet al. Protective role of hesperidin against gamma-radiation-induced oxidative stress and apoptosis in rat testis. J Biol Res (Thessalon) 2017;24:5. [DOI] [PMC free article] [PubMed] [Google Scholar]
- 64. Ighodaro OM, Akinloye OA. First line defence antioxidants-superoxide dismutase (SOD), catalase (CAT) and glutathione peroxidase (GPX): their fundamental role in the entire antioxidant defence grid. Alexandria Journal of Medicine 2019;54:287–93. [Google Scholar]
- 65. Samuni AM, Chuang EY, Krishna MCet al. Semiquinone radical intermediate in catecholic estrogen-mediated cytotoxicity and mutagenesis: chemoprevention strategies with antioxidants. PNAS 2003;100:5390–5. [DOI] [PMC free article] [PubMed] [Google Scholar]
- 66. Dringen R. Metabolism and functions of glutathione in brain. Prog Neurobiol 2000;62:649–71. [DOI] [PubMed] [Google Scholar]
- 67. Prakash M, et al. Total thiols: biomedical importance and their alteration in various disorders. Online Journal of Health and Allied Sciences 2009;8:1–9. [Google Scholar]
- 68. Chen Z, et al. Hepatoprotective effect of chlorogenic acid against chronic liver injury in inflammatory rats. Journal of Functional Food 2019;62:1–11. [Google Scholar]
- 69. Lafferty EI, Qureshi ST, Schnare M. The role of toll-like receptors in acute and chronic lung inflammation. J Inflamm (Lond) 2010;7:57. [DOI] [PMC free article] [PubMed] [Google Scholar]
- 70. Oishi Y, Manabe I. Macrophages in inflammation, repair and regeneration. Int Immunol 2018;30:511–28. [DOI] [PubMed] [Google Scholar]
- 71. Robinson MW, Harmon C, O’Farrelly C. Liver immunology and its role in inflammation and homeostasis. Cell Mol Immunol 2016;13:267–76. [DOI] [PMC free article] [PubMed] [Google Scholar]
- 72. Del Campo JA, Gallego P, Grande L. Role of inflammatory response in liver diseases: therapeutic strategies. World J Hepatol 2018;10:1–7. [DOI] [PMC free article] [PubMed] [Google Scholar]
- 73. Lam CWK. Inflammation, cytokines and chemokines in chronic kidney disease. EJIFCC 2009;20:12–20. [PMC free article] [PubMed] [Google Scholar]
- 74. Schroppel B, He JC. Expression of toll-like receptors in the kidney: their potential role beyond infection. Kidney Int 2006;69:785–7. [DOI] [PubMed] [Google Scholar]
- 75. Aoyama T, Paik YH, Seki E. Toll-like receptor signaling and liver fibrosis. Gastroenterol Res Pract 2010;2010:192543. doi: 10.1155/2010/192543. Epub 2010 Jul 25. PMID: 20706677; PMCID: PMC2913673. [DOI] [PMC free article] [PubMed] [Google Scholar]
- 76. Kiziltas S. Toll-like receptors in pathophysiology of liver diseases. World J Hepatol 2016;8:1354–69. [DOI] [PMC free article] [PubMed] [Google Scholar]
- 77. Vallés PG, Lorenzo AG, Bocanegra Vet al. Acute kidney injury: what part do toll-like receptors play? International Journal of Nephrology and Renovascular Disease 2014;7:241–51. [DOI] [PMC free article] [PubMed] [Google Scholar]
- 78. Yuan GJ, Zhou XR, Gong ZJet al. Expression and activity of inducible nitric oxide synthase and endothelial nitric oxide synthase correlate with ethanol-induced liver injury. World J Gastroenterol 2006;12:2375–81. [DOI] [PMC free article] [PubMed] [Google Scholar]
- 79. Pfeilschifter J. Nitric oxide triggers the expression of proinflammatory and protective gene products in mesangial cells and the inflamed glomerulus. Nephrol Dial Transplant 2002;17:347–8. [DOI] [PubMed] [Google Scholar]
- 80. Poljakovic M, Karpman D, Svanborg Cet al. Human renal epithelial cells express iNOS in response to cytokines but not bacteria. Kidney Int 2002;61:444–55. [DOI] [PubMed] [Google Scholar]
- 81. Zamora R, Vodovotz Y, Billiar TR. Inducible nitric oxide synthase and inflammatory diseases. Mol Med 2000;6:347–73. [PMC free article] [PubMed] [Google Scholar]
- 82. Ghasemi M, et al. Role of nitric oxide in kidney and liver (as distance organ) function in bilateral renal ischemia-reperfusion: effect of L-arginine and NG-nitro-L-arginine methyl ester. Adv Biomed Res 2015;4:1–22. [DOI] [PMC free article] [PubMed] [Google Scholar]
- 83. Rensen SS, Slaats Y, Nijhuis Jet al. Increased hepatic myeloperoxidase activity in obese subjects with nonalcoholic steatohepatitis. Am J Pathol 2009;175:1473–82. [DOI] [PMC free article] [PubMed] [Google Scholar]
- 84. Kisic B, et al. Role of myeloperoxidase in patients with chronic kidney disease. Oxid Med Cell Longev 2016;2016:1069743. [DOI] [PMC free article] [PubMed] [Google Scholar]
- 85. Malle E, Buch T, Grone HJ. Myeloperoxidase in kidney disease. Kidney Int 2003;64:1956–67. [DOI] [PubMed] [Google Scholar]
- 86. Sinuani I, Beberashvili I, Averbukh Zet al. Role of IL-10 in the progression of kidney disease. World J Transplant 2013;3:91–8. [DOI] [PMC free article] [PubMed] [Google Scholar]
- 87. Stijlemans B, Korf H, de Baetselier Pet al. Hepatocyte-derived IL-10 plays a crucial role in attenuating pathogenicity during the chronic phase of T. congolense infection. PLoS Pathog 2020;16:e1008170. [DOI] [PMC free article] [PubMed] [Google Scholar]
- 88. Han D, Chen W, Gu Xet al. Cytoprotective effect of chlorogenic acid against hydrogen peroxide-induced oxidative stress in MC3T3-E1 cells through PI3K/Akt-mediated Nrf2/HO-1 signaling pathway. Oncotarget 2017;8:14680–92. [DOI] [PMC free article] [PubMed] [Google Scholar]
- 89. Xing W. Antioxidant and antiapoptotic properties of chlorogenic acid on human umbilical vein endothelial cells. J Med Plant Res 2012;6:708–15. doi: 10.5897/jmpr11.1044. [DOI] [Google Scholar]
- 90. Zhou Y, et al. Chlorogenic acid ameliorates intestinal mitochondrial injury by increasing antioxidant effects and activity of respiratory complexes. Biosci Biotechnol Biochem 2016;80:962–71. [DOI] [PubMed] [Google Scholar]
- 91. Zablocka A, Janusz M. [The two faces of reactive oxygen species]. Postepy Hig Med Dosw (Online) 2008;62:118–24. [PubMed] [Google Scholar]
Associated Data
This section collects any data citations, data availability statements, or supplementary materials included in this article.


