

Abstract
Air Potato Yam is widely used in the treatment of many conditions such as cancer, inflammation, and goiter. Diosbulbin B (DIOB) is the primary active component of Air Potato Yam, and it exhibits anti-tumor and anti-inflammatory properties. The main purpose of this study was to determine the mechanism by which DIOB induces lung toxicity, using metabonomics and molecular biology techniques. The results showed that the lung toxicity induced by DIOB may occur because of a DIOB-induced increase in the plasma levels of long-chain free fatty acids and endogenous metabolites related to inflammation. In addition, treatment with DIOB increases the expression of the cyp3a13 enzyme, which leads to enhanced toxicity in a dose-dependent manner. The molecular mechanism underlying toxicity in mouse lung cells is the DIOB-mediated inhibition of fatty acid β-oxidation, partial glycolysis, and the TCA cycle, but DIOB treatment can also compensate for the low Adenosine triphosphate (ATP) supply levels by improving the efficiency of the last step of the glycolysis reaction and by increasing the rate of anaerobic glycolysis. Using metabonomics and other methods, we identified the toxic effects of DIOB on the lung and clarified the underlying molecular mechanism.
Keywords: DIOB, metabonomics, β-oxidation, glycolysis
Introduction
Air Potato Yam is a tuber of Dioscorea bulbifera L. that grows throughout tropical and subtropical Asia. It has a long history of medicinal use and has been used for detoxification, resolving phlegm, eliminating gall, cooling the blood, and maintaining hemostasis [1]. Clinical research has shown that it possesses anti-tumor, anti-bacterial, anti-inflammatory, and anti-oxidation effects, and it is widely used in the treatment of a variety of conditions such as cancer, inflammation, and goiter [2]. Air Potato Yam is also used to treat diabetes in India and Brazil [3, 4], and in northern Bangladesh, it is used to treat leprosy [5]. Air Potato Yam contains many chemical components, including diterpenoids, which are unique components that are closely associated with the pharmacological activity of Air Potato Yam. However, Air Potato Yam can also cause toxicity, especially liver toxicity [6], which somewhat limits its application. Modern studies have shown that diterpene lactones, and specifically diosbulbin B (DIOB), not only exert anti-tumor and anti-inflammatory activities but also lead to liver toxicity [7, 8]. Our previous study performed in mice confirmed that DIOB was the main component of Air Potato Yam that causes the liver toxicity that has been reported in the literature [7, 8]. While a previous study showed that Air Potato Yam can be used clinically to treat chronic bronchitis, pertussis, and severe childhood asthma [9], DIOB targets the lung (among other organs) and can accumulate to high levels in the lung tissue because elimination of DIOB from the lungs is significantly slower than from other tissues [10]. Therefore, it is necessary to investigate the lung toxicity of the main active ingredient of Air Potato Yam, DIOB, so as to provide evidence-based support for its rational use.
In Western countries, some studies have shown that abnormal glucose tolerance or diabetes, hypertension, and cardiovascular disease are associated with impaired lung function [11–15], indicating that lung function is easily affected by other factors. Although there are no reports of DIOB toxicity in animal or human lungs, it is important to investigate the toxicity of this compound and its effects on the physiological function of the lung. The purpose of this study was to study the effect of DIOB, the primary active component of Air Potato Yam, on the lung: first, to determine whether DIOB has toxic effects on mouse lungs; and second, to elucidate the mechanism of this pulmonary toxicity.
According to clinical poisoning records [16–19], jaundice can appear in a patient taking Air Potato Yam at as early as 8 days or as late as 98 days after beginning treatment, with an average of time of onset at 32 days. Most of these patients took 10 g of Air Potato Yam per day. Air Potato Yam contains 506.1 mg DIOB/100 g yam [20], so a daily dose of 10 g of Air Potato Yam corresponds to 50.6 mg of DIOB. Given an average human body weight of 60 kg, the oral dose of DIOB is therefore 0.84 mg/kg. According to the conversion formula used to calculate mouse doses from human doses [21], the corresponding oral dose for mice would be 10.4 mg/kg. On the basis of this, we administered different doses (10, 30, and 60 mg/kg) of DIOB to mice over a period of 28 days and conducted metabonomics studies to clarify the molecular mechanism by which DIOB induces pulmonary toxicity.
Materials and Methods
Chemicals
DIOB with a purity of 95.11% was purchased from Chengdu MUST Biological Technology Co, LTD. The RNA extraction reagent, Trizol, was obtained from Invitrogen. A One-Step RNA PCR Kit was purchased from Takara. The mouse fatty acyl-CoA synthetase (acs) ELISA kit was provided by Shanghai Jonln Biological Technology Co, LTD. Glutamate transaminase, glutamate transaminase, lactate dehydrogenase, ultramicro ATPase, ATP content, citric acid synthase kits, mouse carnitine palmitoyl transferase I, and interleukin 1β ELISA kits were purchased from Nanjing Jiancheng Bioengineering Institute.
Animal experiments
After 1 week of acclimatization, 7-week-old ICR male mice (68) were randomly assigned to one of the three dose groups (10, 30, and 60 mg/kg) or to the control (no treatment) group (n = 15). Treatment was administrated by gavage for 4 consecutive weeks. The mice in the control group received an equal volume of 5% polyethylene glycol 400 in saline. Food and water were provided ad libitum throughout the experiment. Twenty-four hours after the last dose was administered, the mice were anesthetized with ether, and blood was collected, centrifuged to separate the plasma, and analyzed using an automatic biochemical analyzer (Model 7080, Hitachi High-Technologies Corporation, Tokyo, Japan). The mice were sacrificed by carbon dioxide inhalation and the body weights were determined. The lungs were removed and weighed. Lungs from two of the mice in each group were fixed in 10% formalin and were sectioned for pathological analysis, and the mitochondria and cytosol were isolated from the lungs from three of the mice to detect ATPase and other enzyme activity. The lungs from the remaining 10 mice in each group were cryopreserved in liquid nitrogen for metabonomics and molecular biology analysis.
Pathological observation
After the mice were sacrificed by carbon dioxide inhalation, the lungs were removed, washed with normal saline to remove the blood, and fixed in 10% formalin. Next, the whole lungs were dehydrated, cleared, and paraffin-embedded, followed by dewaxing, staining with HE, and sealing with neutral resin. The prepared pathological sections were photographed using a Proscanner APro 5 (Amos Scientific Pty Ltd, Australia), and lung histopathology was observed using K-viewer.
High-resolution mass spectrometry detection
Lung samples were homogenized with ultrapure water (containing 50% methanol) at a ratio of 1:10 (w/v). Then, 50 μl of homogenate and plasma were added to 450 μl of precipitant containing an internal standard (methanol:acetonitrile = 1:1), vortexed for 60 s, and centrifuged at 13 000 rpm for 10 min. Next, 100 μl of homogenate was analyzed using a QE-Orbitrap high-resolution mass spectrometer. Mobile phase: A-water containing 0.1% formic acid and 2 mmol/l ammonium formate, B-acetonitrile. Gradient elution procedure: 0–1.0 min, 5% B; 1.0–5.0 min, 5–60% B; 5.0–8.0 min, 60–100% B; 8.0–11.0 min, 100% B; 11.0–14.0 min, 100–60% B; 14.0–15.0 min, 60–5% B; 15.0–18.0 min, 5% B, analysis time 0–18 min, 5 μl per injection, flow rate: 0.25 ml/min. Column: ACQUITY BEH C18: 1.7 μm, 2.1 × 50 mm, column temperature: 30°C, and automatic injector temperature maintained at 4°C. Data were collected in the electrospray ion (ESI) source positive and negative ion mode (spray voltage: 3000 V). Evaporation temperature: 350°C; capillary temperature: 320°C; S-lens RF: 80. Resolution of full scan: 70 000, scanning range: 70–1050 m/z. Resolution of full MS/dd-ms2: 17 500; AGC target: 1e 5; Maximum TT: 50 ms; NCE: 20, 40, 60.
Metabolic pathway analysis
We used mzCloud (Thermo Fisher Scientific) to obtain the exact mass (to five decimal places) of endogenous substances and to identify the substance based on the mass and molecular formula (Fig. S1, Tables S1 and S2) [22]. Then, the information collected (exact mass and retention time) regarding the endogenous substances was input into TraceFinder (Thermo Fisher Scientific) for qualitative analysis of the peak area of each substance in the sample. Metaboanalyst 4.0 (https://www.metaboanalyst.ca/MetaboAnalyst/ModuleView.xhtml) was used to analyze the differences in the endogenous metabolite expression in the lung and plasma between the control and experimental groups to identify metabolites with a variable importance in projection (VIP) values larger than 1 and to draw principal component analysis (PCA), partial least squared-discriminant analysis (PLS-DA), and topological analysis diagrams. The pathway analysis function of Metaboanalyst 4.0 was used to analyze the metabolic pathways affecting lung function and plasma metabolism which were altered by treatment with DIOB, and the pathway with an impact value higher than 0.1 was selected as the main metabolic pathway.
RT-PCR analysis
The lungs were ground in liquid nitrogen, and total RNA was extracted according to the Trizol kit instructions. The primers used to detect phospholipase A2 (pla2), cluster of differentiation (cd) 36, acs, fatty acid binding protein (fabp5), carnitine palmitoyl transfer-1 (cpt1), carnitine palmitoyl transfer-2 (cpt2), glucose transporter (glut)-1, glucose transporter (glut)-8, hexokinase (hk1), phosphofructokinase (pfk), enolase (eno1), pyruvate kinase (pk), pyruvate dehydrogenase (pdh), lactate dehydrogenase (ldh), isocitrate dehydrogenase (idh), succinate dehydrogenase (sdh), malic dehydrogenase (mdh), and β-actin are shown in Table S3. Real-time quantitative PCR was performed using an ABI Prism 7300 sequence detector (SYBR Premix Ex Taq™). Reaction conditions: initial denaturation at 95°C for 10 s, followed by 40 cycles of 95°C for 30 s, 60°C for 15 s. The 2−∆∆Ct method was used to analyze the differences in the mRNA expression of Pla2, cd36, acs, fabp5, cpt1, cpt2, glut1, glut8, hk1, pfk, eno1, pk, pdh, ldh, idh, sdh, and mdh in the lungs from the control and experimental groups.
Enzyme activity detection in the lung
The lungs from the control and experimental groups were fully homogenized in PBS (pH 7.4) at a ratio of 1:10 (w/v) and centrifuged for approximately 20 min (2000g). The activity of ACS, carnitine palmitoyl transferase, and interleukin-1 β was detected by ELISA and that of alanine transaminase, alpaca transaminase, lactate dehydrogenase, ultramicro atpase, and citrate synthase was detected by the corresponding kits. Finally, a BCA protein quantitation kit was used to measure the protein concentration in the lung homogenate. Three samples from each group were analyzed in parallel. The mouse lung S9 fraction was incubated in 0.1 mol/l pH 7.4 potassium phosphate buffer with a total volume of 200 μl, containing the mouse lung S9 fraction (final protein concentration: 5 g/l) and the CYP probe substrate midazolam (5 μmol/l). After incubation in a 37°C water bath for 5 min, NADPH solution was added (final concentration: 1 mmol/l) and incubated for 5 min to start the reaction and then incubated at 37°C for another 60 min. After incubation, the samples were immediately put on ice. The reaction was stopped by adding the precipitant containing the internal standard (methanol:acetonitrile = 1:1). Finally, a BCA protein quantitation kit was used to measure the protein concentration in the lung homogenate. Three samples from each group were analyzed in parallel. Bronchoalveolar lavage fluid (BALF) was collected according to the traditional method: the distal end of the trachea was ligated, the venous indwelling needle was inserted into the trachea, 0.5 ml of BALF was lavaged with 2 ml syringe, the lung tissues were gently massaged to collect the BALF, repeated five times, and LDH enzyme activity in each group was detected by the LDH kit.
Extraction of mitochondria and measurement of ATPase levels in the lung
After the mice were sacrificed, the lungs were removed, rinsed with normal saline for two to three times, and wiped with filter paper to remove any remaining blood. The lung tissues were homogenized in 0.9% normal saline at a ratio of 1:10 (w/v), and the mitochondria were obtained by differential centrifugation [23]. Protein concentrations in the mitochondria were measured using a BCA protein quantitative kit, and the mitochondrial ATPase and ATP content in lung cells was measured using an ultrafine ATPase and ATP content kit.
Determination of 1-hydroxymidazolam, DIOB, and amino acids contents
The chromatographic conditions for detecting 1-hydroxymidazolam were as follows: A-water (0.1% formic acid), d-acetonitrile; gradient elution procedure: 0–0.5 min, 30% D; 0.5–1.5 min, 30–95% D; 1.5–2.5 min, 95–95% D; 2.5–3.5 min, 95–70% D; 3.5–3.6 min, 70–30% D, 3.6–6.0 min, 30% D, analysis time 0–6 min, injection volume 5 μl, flow rate 0.3 ml/min. The chromatographic conditions for detecting DIOB were as follows: A-water (0.1% formic acid), d-acetonitrile. Gradient elution procedure: 0–0.5 min, 30% D; 0.5–1.5 min, 30–60% D; 1.5–2.0 min, 60–90% D; 2.0–3.0 min, 90–90% D; 3.0–3.5 min, 90–30% D, 3.5–5.5 min, 30% D, analysis time 0–5.5 min, injection volume 5 μl, flow rate 0.3 ml/min. The chromatographic column conditions used for both substances were as follows: Thermo Hypersil Gold C18: 3 μm, 2.1 × 100 mm, column temperature 30°C, and the temperature of the automatic sampler was maintained at 4°C. Both 1-hydroxymidazolam (RPM) and DIOB (SIM) were detected by the ESI source under positive ion mode. Spray voltage: 3000 V; evaporation temperature: 350°C; sheath gas: 40 Arb; auxiliary gas: 10 Arb; capillary temperature: 320°C; S-lens RF: 80. For 1-hydroxymidazolam: 342.0804/324.06836, propranolol (IS): 260.16451/116.10709, DIOB: 345.13326, propranolol (IS): 260.16451. Amino acid contents were determined as described previously [24].
Statistical analysis
Metaboanalyst 4.0 was used for PCA, PLS-DA, and topological analysis. Pathways with an Impact value higher than 1.0 were considered to be major metabolic pathways affecting pulmonary function and plasma metabolism that were altered in response to treatment with DIOB. Data were analyzed using SPSS16.0 software, and the experimental data were expressed as mean ± standard deviation (SD). One-way ANOVA was used to analyze the differences between the experimental groups, and Tukey’s test was used to analyze the differences between the control and experimental groups. *P < 0.05, **P < 0.01.
Results and Discussion
Effects of DIOB dose on lung physiology and pathology
After 28 days of DIOB administration, compared with the control group, the mice that received different doses of DIOB had significantly higher body weight, but the lung weight and viscera coefficients decreased with the dose (Table 1). The blood biochemical indices (ALT, BUN, GLU, TG, and CHE) in the experimental groups also showed significant changes (Table 2). Pathology assessment of the lung sections showed that, when the dose reached 60 mg/kg, bronchial epithelial hyperplasia appeared in the lungs (Fig. 1). LDH in lung lavage fluid increased with the increase of administration dose, which also indicated that DIOB had a toxic effect on the lung (Fig. S2). Taken together, these results show that DIOB affects the normal physiological state of the lung in a dose-dependent manner after 28 days of administration. Therefore, we carried out metabonomics and molecular biology analyses to determine the molecular mechanism underlying these effects.
Table 1.
Effect of different doses of DIOB on the body weight and viscera coefficient of lung in mice
| Group | Body weight (g) | Lung weight (g) | Lung weight index (%) |
|---|---|---|---|
| Control | 36.20 ± 1.32 | 0.26 ± 0.02 | 0.72 ± 0.05 |
| 10 mg/kg | 39.40 ± 3.11 | 0.25 ± 0.07 | 0.63 ± 0.00 |
| 30 mg/kg | 39.07 ± 3.28 | 0.23 ± 0.03 | 0.59 ± 0.06 |
| 60 mg/kg | 41.47 ± 2.29 | 0.23 ± 0.04 | 0.55 ± 0.09 |
| 10 mg/kg, P value | 0.0010** | 0.0242* | 0.0930 |
| 30 mg/kg, P value | 0.0017** | 0.0022** | 0.0002** |
| 60 mg/kg, P value | 0.0000** | 0.0030** | 0.0000** |
Data are the mean ± SEM (n = 15). Statistical analysis was performed by one-way Anova with Tukey’s test for comparisons between groups.
* P < 0.05.
* * P < 0.01.
Table 2.
Effect of DIOB on biochemical indices in mice
| Biochemical indices | Control | 10 mg/kg | 30 mg/kg | 60 mg/kg |
|---|---|---|---|---|
| ALT (IU/l) | 35.7 ± 4.1 | 59.3 ± 4.3** | 53.7 ± 19.3** | 52.3 ± 5.0** |
| TP (g/l) | 57.5 ± 2.4 | 55.9 ± 3.1 | 61.9 ± 4.9 | 55.0 ± 3.3 |
| CREA (μmol/l) | 18.7 ± 1.9 | 24.9 ± 1.7 | 19.0 ± 8.0 | 21.0 ± 5.6 |
| CHOl (mmol/l) | 2.4 ± 0.1 | 1.3 ± 0.1* | 2.9 ± 1.2 | 1.9 ± 0.3 |
| BUN (mmol/l) | 3.4 ± 0.1 | 4.7 ± 0.1* | 6.9 ± 1.1** | 5.0 ± 0.2* |
| GLU (mmol/l) | 14.1 ± 0.8 | 4.5 ± 0.2** | 4.5 ± 1.2** | 2.9 ± 0.3** |
| TG (mmol/l) | 1.5 ± 0.0 | 0.5 ± 0.1** | 1.7 ± 0.5 | 0.3 ± 0.0** |
| CHE (U/l) | 197.8 ± 33.0 | 223.8 ± 40.3 | 5562.1 ± 1733.1** | 263.8 ± 15.2* |
Data are the mean ± SEM (n = 15). Statistical analysis was performed by one-way Anova with Tukey’s test for comparisons between groups.
* P < 0.05.
* * P < 0.01.
Figure 1 .
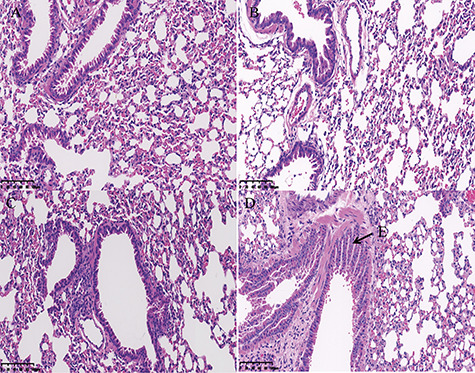
Histopathological analyses of the mouse lung. (A) Control group, (B) 10 mg/kg DIOB, (C) 30 mg/kg DIOB, and (D) 60 mg/kg DIOB. (E) bronchial epithelial hyperplasia appeared in the lungs.
Metabonomic analysis
The Statistical Analysis module in Metaboanalyst 4.0 was used to calculate PCA and PLS-DA. The PCA (Fig. 2A) and PLS-DA (Fig. 2B) results demonstrated a complete separation between the lung data for the control group and the experimental groups. The model quality parameters were as follows: accuracy = 0.9250, R2 = 0.9820, and Q2 = 0.8238. The PCA (Fig. 2C) and PLS-DA (Fig. 2D) results also demonstrated a complete separation of the control group from the experimental groups for the plasma data. The model quality parameters were as follows: accuracy = 1.0000, R2 = 0.9917, and Q2 = 0.9566. The differences between the metabolites in each group were analyzed by PLS-DA, and endogenous substances with VIP values >1 were selected for further analysis of metabolic pathways in the lung and plasma affected by DIOB. Table 3 shows that there were 42 endogenous metabolites with VIP values >1 in the lung, of which 26 exhibited an increase, while the other 16 exhibited a decrease. Table 4 shows that there were 42 endogenous metabolites with VIP values >1 in the plasma: 18 increased, and 24 decreased. The results indicate that DIOB affects the metabolism and secretion of endogenous factors, significantly changing their levels in mouse lungs and plasma.
Figure 2 .
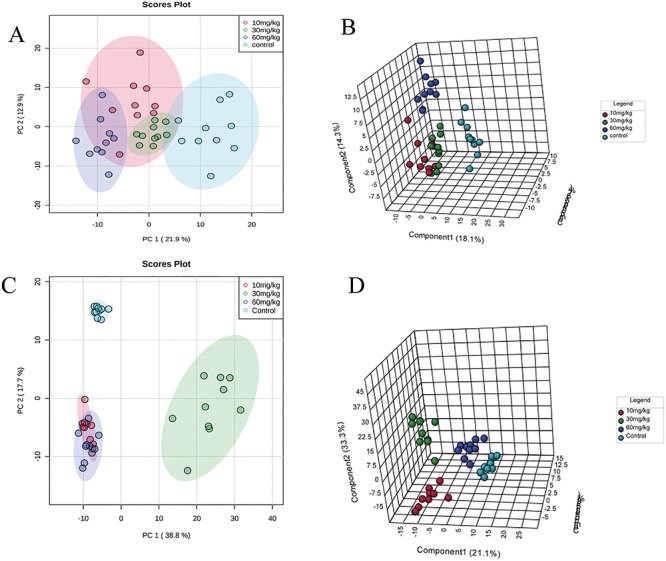
Metabonomics analysis of lung and plasma samples from mice in the control and DIOB groups. (A) PCA score plots for comprehensive metabonomics data for lung samples. (B) PLS-DA models of metabonomics data for lung samples. (C) PCA score plots for comprehensive metabonomics data for plasma samples. (D) PLS-DA models of metabonomics data for plasma samples.
Table 3.
The average change of main metabolites (VIP value >1) in lung (mean ± SD)
| No. | Metabolites | % Average changes, 10 mg/kg | % Average changes, 30 mg/kg | % Average changes, 60 mg/kg |
|---|---|---|---|---|
| 1 | PC[20:1(11Z)/14:1(9Z)] | 122.41 ± 23.14↑ | 112.74 ± 18.67↑ | 156.54 ± 31.14↑ |
| 2 | PC[16:1(9Z)/20:3(8Z,11Z,14Z)] | 64.42 ± 6.08↓ | 59.09 ± 6.84↓ | 53.87 ± 7.63↓ |
| 3 | SM[d18:0/16:1(9Z)] | 83.39 ± 11.81↓ | 96.84 ± 8.72↓ | 65.34 ± 10.92↓ |
| 4 | PC[18:0/20:4(8Z,11Z,14Z,17Z)] | 64.99 ± 15.42↓ | 73.68 ± 7.40↓ | 48.20 ± 9.17↓ |
| 5 | Phytosphingosine | 87.01 ± 20.70↓ | 50.35 ± 12.61↓ | 45.33 ± 7.77↓ |
| 6 | PC[14:1(9Z)/20:0] | 105.88 ± 25.26↑ | 120.00 ± 8.23↑ | 80.19 ± 13.99↓ |
| 7 | Lactic acid | 214.69 ± 63.81↑ | 173.45 ± 31.15↑ | 201.44 ± 40.37↑ |
| 8 | Histamine | 63.62 ± 8.03↓ | 46.91 ± 5.58↓ | 46.93 ± 10.11↓ |
| 9 | LysoPC(18:0) | 162.99 ± 29.53↑ | 100.79 ± 17.50↑ | 170.53 ± 43.44↑ |
| 10 | LysoPC[18:1(11Z)] | 207.14 ± 40.64↑ | 156.08 ± 34.80↑ | 231.09 ± 43.5↑ |
| 11 | SM(d18:1/16:0) | 86.83 ± 7.70↓ | 96.01 ± 8.85↓ | 69.04 ± 14.51↓ |
| 12 | Docosahexaenoic acid | 143.97 ± 39.01↑ | 161.16 ± 28.44↑ | 218.9 ± 63.45↑ |
| 13 | SM[d18:0/24:1(15Z)] | 317.71 ± 18.79↑ | 352.37 ± 67.38↑ | 296.53 ± 70.23↑ |
| 14 | PC(14:0/P-18:0) | 217.20 ± 61.90↓ | 176.48 ± 10.32↑ | 243.88 ± 60.32↑ |
| 15 | LysoPC[16:1(9Z)] | 227.78 ± 61.45↑ | 160.84 ± 44.37↑ | 196.67 ± 39.64↑ |
| 16 | LysoPC[18:2(9Z,12Z)] | 229.44 ± 50.97↑ | 135.62 ± 41.88↑ | 198.96 ± 66.93↑ |
| 17 | PG(18:0/16:0) | 89.65 ± 5.43↓ | 102.6 ± 29.15↑ | 200.59 ± 50.93↑ |
| 18 | PC[o-16:1(9Z)/20:4(8Z,11Z,14Z,17Z)] | 64.83 ± 15.27↓ | 60.2 ± 19.12↓ | 52.64 ± 13.87↓ |
| 19 | PC[18:1(9Z)/20:4(5Z,8Z,11Z,14Z)] | 76.35 ± 8.96↓ | 67.00 ± 8.35↓ | 63.71 ± 12.35↓ |
| 20 | PC[16:1(9Z)/22:2(13Z,16Z)] | 127.84 ± 33.44↑ | 73.50 ± 11.90↓ | 64.90 ± 8.60↓ |
| 21 | l-carnitine | 109.61 ± 8.39↑ | 119.20 ± 16.59↑ | 118.33 ± 14.12↑ |
| 22 | SM(d18:1/24:0) | 428.84 ± 28.16↑ | 413.41 ± 31.87↑ | 407.33 ± 90.98↑ |
| 23 | Propenoylcarnitine | 21.38 ± 4.56↓ | 2.76 ± 0.72↓ | 2.54 ± 0.89↓ |
| 24 | Sphinganine | 46.56 ± 12.36↑ | 86.41 ± 17.83↓ | 109.88 ± 22.21↑ |
| 25 | Arachidonic acid | 164.56 ± 35.14↑ | 90.72 ± 22.16↓ | 125.84 ± 33.24↑ |
| 26 | PC[20:3(5Z,8Z,11Z)/14:1(9Z)] | 162.39 ± 30.84↑ | 185.99 ± 30.45↑ | 154.29 ± 43.61↑ |
| 27 | LysoPC[20:4(8Z,11Z,14Z,17Z)] | 133.35 ± 26.42↑ | 112.65 ± 36.49↑ | 161.52 ± 39.55↑ |
| 28 | PC[16:1(9Z)/22:5(7Z,10Z,13Z,16Z,19Z)] | 84.05 ± 19.04↓ | 66.84 ± 9.92↓ | 78.33 ± 15.94↓ |
| 29 | 12-HETE | 74.98 ± 1.66↓ | 76.80 ± 17.64↓ | 128.13 ± 32.8↑ |
| 30 | LysoPC(14:0) | 249.72 ± 68.53↑ | 206.31 ± 52.14↑ | 317.53 ± 89.88↑ |
| 31 | Niacinamide | 146.58 ± 37.05↑ | 120.25 ± 12.88↑ | 124.45 ± 22.07↑ |
| 32 | N-methyl-d-aspartic acid | 89.67 ± 13.89↓ | 106.14 ± 26.89↑ | 119.7 ± 18.55↑ |
| 33 | l-acetylcarnitine | 112.43 ± 26.22↑ | 109.93 ± 17.26↑ | 127.89 ± 31.78↑ |
| 34 | Taurine | 115.61 ± 18.47↑ | 121.90 ± 12.61↑ | 119.81 ± 6.15↑ |
| 35 | l-leucine | 92.93 ± 13.64↓ | 90.38 ± 13.83↓ | 91.68 ± 16.80↓ |
| 36 | LysoPC(17:0) | 180.87 ± 25.70↑ | 118.86 ± 24.62↑ | 186.41 ± 43.12↑ |
| 37 | SM(d18:1/22:0) | 209.1 ± 39.69↑ | 191.68 ± 40.37↑ | 156.75 ± 37.87↑ |
| 38 | PC[20:0/20:4(5Z,8Z,11Z,14Z)] | 291.73 ± 76.84↑ | 204.73 ± 35.84↑ | 273.71 ± 63.40↑ |
| 39 | l-arginine | 71.37 ± 12.83↓ | 66.17 ± 12.53↓ | 63.50 ± 14.41↓ |
| 40 | Neuraminic acid | 80.06 ± 20.59↓ | 155.99 ± 41.13↑ | 133.34 ± 30.80↑ |
| 41 | PC[o-16:0/22:6(4Z,7Z,10Z,13Z,16Z,19Z)] | 58.49 ± 10.57↓ | 64.31 ± 7.79↓ | 63.01 ± 4.35↓ |
| 42 | Cer[d18:1/24:1(15Z)] | 119.42 ± 27.98↑ | 22.21 ± 2.15↓ | 28.86 ± 3.86↓ |
Arrow indicates significantly up-regulated or down-regulated metabolites in the DIOB different dose groups compared with the control.
Table 4.
The average change of main metabolites (VIP value >1) in plasma (mean ± SD)
| No. | Metabolites | % Average changes, 10 mg/kg | % Average changes, 30 mg/kg | % Average changes, 60 mg/kg |
|---|---|---|---|---|
| 1 | PC[14:1(9Z)/20:0] | 90.99 ± 19.98↓ | 202.95 ± 49.43↑ | 212.62 ± 37.10↑ |
| 2 | PC[16:1(9Z)/22:5(7Z,10Z,13Z,16Z,19Z)] | 35.96 ± 4.58↓ | 99.59 ± 18.20↓ | 37.74 ± 5.46↓ |
| 3 | PC[18:1(9Z)/20:4(5Z,8Z,11Z,14Z)] | 61.59 ± 5.37↓ | 83.08 ± 17.73↓ | 52.15 ± 3.14↓ |
| 4 | l-carnitine | 36.80 ± 2.12↓ | 35.74 ± 5.29↓ | 32.39 ± 3.45↓ |
| 5 | PC[20:3(5Z,8Z,11Z)/20:3(5Z,8Z,11Z)] | 13.97 ± 0.97↓ | 77.24 ± 17.09↓ | 55.93 ± 14.82↓ |
| 6 | l-valine | 87.43 ± 4.84↓ | 38.66 ± 4.50↓ | 68.19 ± 1.65↓ |
| 7 | SM[d18:0/16:1(9Z)] | 73.49 ± 7.75↓ | 63.54 ± 8.75↓ | 74.44 ± 9.53↓ |
| 8 | PC[20:3(5Z,8Z,11Z)/14:1(9Z)] | 16.91 ± 1.83↓ | 6.56 ± 2.38↓ | 10.28 ± 1.51↓ |
| 9 | PC[16:1(9Z)/20:3(8Z,11Z,14Z)] | 86.83 ± 10.03↓ | 65.18 ± 14.85↓ | 88.10 ± 6.09↓ |
| 10 | LysoPC(14:0) | 67.12 ± 11.71↓ | 76.56 ± 33.72↓ | 19.30 ± 5.82↓ |
| 11 | Docosahexaenoic acid | 46.57 ± 7.28↓ | 425.4 ± 66.56↑ | 106.23 ± 19.66↑ |
| 12 | Cholic acid | 4871.4 ± 509.27↑ | 709.8 ± 1503.56↑ | 4648.14 ± 1699.45↑ |
| 13 | Oleic acid | 106.73 ± 20.12↑ | 417.24 ± 111.27↑ | 146.15 ± 28.03↑ |
| 14 | PC[14:0/22:1(13Z)] | 15054.58 ± 14400.63↑ | 15370.75 ± 28426.62↑ | 12256.19 ± 13963.40↑ |
| 15 | PC[18:0/20:4(8Z,11Z,14Z,17Z)] | 17.14 ± 1.59↓ | 80.62 ± 12.89↓ | 30.81 ± 8.45↓ |
| 16 | Linoleic acid | 160.09 ± 26.4↑ | 295.48 ± 75.73↑ | 133.95 ± 39.47↑ |
| 17 | Palmitic acid | 89.95 ± 17.99↓ | 376.72 ± 102.83↑ | 159.53 ± 37.67↑ |
| 18 | LysoPC(20:0) | 98.97 ± 10.53↓ | 501.82 ± 130.07↑ | 94.28 ± 13.19↓ |
| 19 | 11Z-Octadecenylcarnitine | 301.44 ± 71.04↑ | 254.51 ± 83.4↑ | 449.70 ± 87.18↑ |
| 20 | l-proline | 84.07 ± 5.60↓ | 86.52 ± 6.16↓ | 54.71 ± 3.70↓ |
| 21 | Arachidonic acid | 183.05 ± 28.51↑ | 353.75 ± 93.24↑ | 111.35 ± 15.99↑ |
| 22 | Glycocholic acid | 194.70 ± 49.14↑ | 237.84 ± 22.78↑ | 628.22 ± 114.08↑ |
| 23 | Cis-4-hydroxyproline | 87.55 ± 19.47↓ | 59.95 ± 14.71↓ | 60.70 ± 17.31↓ |
| 24 | d-glucose | 44.45 ± 5.34↓ | 37.63 ± 6.68↓ | 29.80 ± 3.63↓ |
| 25 | LysoPC[20:1(11Z)] | 104.25 ± 13.25↑ | 373.97 ± 85.24↑ | 97.65 ± 13.54↓ |
| 26 | N-methyl-d-aspartate | 74.94 ± 8.76↓ | 64.52 ± 12.44↓ | 45.89 ± 9.86↓ |
| 27 | PC[o-18:0/20:4(8Z,11Z,14Z,17Z)] | 102.30 ± 25.30↑ | 80.00 ± 17.60↓ | 243.31 ± 25.92↑ |
| 28 | l-tryptophan | 138.33 ± 11.79↑ | 127.79 ± 13.69↑ | 178.06 ± 28.69↑ |
| 29 | PC[o-16:1(9Z)/20:4(8Z,11Z,14Z,17Z)] | 147.04 ± 24.51↑ | 83.22 ± 7.35↓ | 262.51 ± 46.73↑ |
| 30 | 12-HETE | 81.38 ± 15.25↓ | 755.47 ± 212.94↑ | 333.37 ± 98.41↑ |
| 31 | 8,11,14-Eicosatrienoic acid | 78.19 ± 14.85↓ | 793.00 ± 197.24↑ | 85.77 ± 12.73↓ |
| 32 | PC[20:0/20:4(5Z,8Z,11Z,14Z)] | 131.64 ± 27.96↑ | 118.53 ± 21.23↑ | 239.25 ± 25.89↑ |
| 33 | SM(d18:1/14:0) | 34.24 ± 5.82↓ | 60.67 ± 11.04↓ | 43.31 ± 6.75↓ |
| 34 | LysoPC(17:0) | 102.49 ± 14.44↑ | 220.28 ± 33.95↑ | 70.37 ± 15.89↓ |
| 35 | Creatine | 133.46 ± 6.96↑ | 46.03 ± 5.75↓ | 144.68 ± 6.00↑ |
| 36 | PC[14:0/18:1(9Z)] | 49.07 ± 9.93↓ | 62.25 ± 7.09↓ | 60.63 ± 10.23↓ |
| 37 | LysoPC[20:2(11Z,14Z)] | 92.16 ± 9.87↓ | 290.21 ± 86.27↑ | 27.23 ± 6.96↓ |
| 38 | LysoPC(P-18:0) | 95.28 ± 12.7↓ | 210.82 ± 42.67↑ | 113.39 ± 15.33↑ |
| 39 | PC[18:2(9Z,12Z)/18:4(6Z,9Z,12Z,15Z)] | 11.44 ± 2.81↑ | 25.30 ± 5.88↓ | 14.15 ± 2.73↓ |
| 40 | PC[o-20:1(11Z)/20:4(8Z,11Z,14Z,17Z)] | 116.70 ± 22.87↑ | 128.41 ± 29.63↑ | 366.95 ± 71.33↑ |
| 41 | l-arginine | 83.39 ± 5.84↓ | 72.93 ± 7.37↓ | 59.55 ± 5.39↓ |
| 42 | Propionylcarnitine | 32.36 ± 1.76↓ | 51.74 ± 7.70↓ | 30.75 ± 2.51↓ |
Arrow indicates significantly up-regulated or down-regulated metabolites in the DIOB different dose groups compared with the control.
Metaboanalyst 4.0 analysis showed that DIOB affects nine main endogenous factor-related metabolic pathways in the lung as indicated by impact values >0.1 (Fig. 3A). The main pathways that were influenced by DIOB administration included taurine and hypotaurine metabolism, sphingolipid metabolism, valine, leucine, and isoleucine biosynthesis, arachidonic acid metabolism, and nicotinate and nicotinamide metabolism. The Metaboanalyst 4.0 analysis results shown in Fig. 3B indicated that DIOB affects six main plasma endogenous factor-related metabolic pathways as indicated by impact values >0.1, including linoleic acid metabolism, valine, leucine, and isoleucine biosynthesis, arachidonic acid metabolism, and glycerophospholipid metabolism. The above results demonstrate that DIOB mainly affects the synthesis and metabolism of amino acids and fatty acids in the lungs and plasma of mice at 28 days after administration, which leads to changes in the levels of endogenous factors in the lungs and plasma.
Figure 3 .

Effects of DIOB on major metabolic pathways in the mouse lung and plasma. (A) Metabolic pathways of lung mainly affected by DIOB: a. taurine and hypotaurine metabolism, b. sphingolipid metabolism, c. valine, leucine, and isoleucine biosynthesis, d. arachidonic acid metabolism, e. nicotinate and nicotinamide metabolism, f. histidine metabolism, g. glycerophospholipid metabolism, h. alanine, aspartate, and glutamate metabolism, and i. arginine and proline metabolism. (B) Metabolic pathways of plasma mainly affected by DIOB: 1. linoleic acid metabolism, 2. valine, leucine, and isoleucine biosynthesis, 3. arachidonic acid metabolism, 4. glycerophospholipid metabolism, 5. arginine and proline metabolism, and 6. tryptophan metabolism.
Effects of DIOB on fatty acid metabolism in the lung and plasma
As shown in Fig. 3A, DIOB affects the metabolism of lipids in the lungs, mainly by affecting three metabolic pathways: sphingolipid metabolism, arachidonic acid metabolism, and glycerophospholipid metabolism. The metabolomics data showed that, compared with the control group, the proportions of medium- and long-chain free fatty acids in the plasma increased with the DIOB dose in the experimental groups (Tables 4 and S4). Many studies have shown that high free fatty acid levels are associated with the occurrence and development of metabolic syndrome, atherosclerosis, acute coronary syndrome, and other diseases [25–28], and increased levels of serum free fatty acids play a significant role in the occurrence of cardiovascular diseases. There are abundant blood vessels and connective tissues in the lung, which makes this organ susceptible to microvascular disease. The results suggested that the DIOB-induced increase in long-chain free fatty acids in the plasma had a negative effect on the lung. Compared with the control group, the proportion of most long-chain free fatty acids in the lungs decreased with increasing DIOB dose (Table S4), while the proportion of docosahexaenoic acid and arachidonic acid increased. In addition, the proportion of lysophosphatidylcholine increased with the increasing DIOB dose, while the proportion of lecithin showed a downward trend (Table 3). It has been reported that Pla2 releases lysophospholipids and unsaturated fatty acids (mostly arachidonic acid) by hydrolyzing ester bonds on cell membranes [29], and indeed, we found that Pla2 activity and mRNA expression levels in the lungs increased with DIOB dose in the experimental groups compared with the control group (Table 5 and Fig. 4A). This may explain the increase in the ratio of lysophospholipids to arachidonic acid in lung cells. Previous studies have shown that lysophosphatidylcholine has a strong surface activity and can induce the rupture of red blood cells and other cell membranes and cause cell necrosis [30] and that arachidonic acid induces the release of pro-inflammatory factors by promoting the enzyme-mediated synthesis of eicosanoids [31, 32]. As shown in Table 5, the level of IL-1β, a cytokine that activates lung injury, was elevated in the experimental groups compared with the control group. These results suggested that high free fatty acid levels in the plasma and excessive lysophosphatidylcholine and arachidonic acid in the lung may cause lung inflammation. If the tissue is damaged, infected, inflamed, or subjected to local ischemia, increased lactate content can be observed [33]. Compared with the control group, the proportion of lactic acid in the lung cells in the experimental groups increased with the dose (Table 3), which is another indication that DIOB may cause lung inflammation. Taken together, these results indicated that 28 days of DIOB administration resulted in an excessive lipid content in the plasma and lung, which may have caused the inflammatory reaction observed in the lung.
Table 5.
Effect of DIOB on lung enzyme activities in mice
| Enzymes | Control | 10 mg/kg | 30 mg/kg | 60 mg/kg |
|---|---|---|---|---|
| IL-1β (ng/g) | 16.61 ± 1.38 | 25.47 ± 1.22** | 23.73 ± 2.50** | 22.80 ± 1.92** |
| LDH (U/g) | 117.62 ± 15.49 | 136.97 ± 11.20 | 155.49 ± 13.67* | 159.00 ± 7.56* |
| ACS (ng/ml) | 12.52 ± 0.22 | 11.99 ± 0.05 | 11.84 ± 0.28 | 10.83 ± 0.36* |
| ALT (U/g) | 7.54 ± 0.21 | 8.14 ± 0.83 | 9.25 ± 2.34 | 10.14 ± 1.44 |
| AST (U/g) | 7.29 ± 1.06 | 8.17 ± 1.14 | 8.77 ± 0.61 | 9.07 ± 1.00 |
| PDH (ng/ml) | 5.38 ± 0.33 | 5.03 ± 1.24 | 4.66 ± 0.42 | 4.57 ± 0.33* |
| PLA2 (ng/ml) | 13.73 ± 0.86 | 16.81 ± 1.07* | 18.10 ± 1.88** | 18.31 ± 0.98** |
| CS (U/mg) | 2.87 ± 0.34 | 3.09 ± 0.33 | 4.15 ± 1.01 | 4.35 ± 0.22** |
Data are the mean ± SEM (n = 3). Statistical analysis was performed by one-way Anova with Tukey’s test for comparisons between groups.
* P < 0.05.
* * P < 0.01.
Figure 4 .
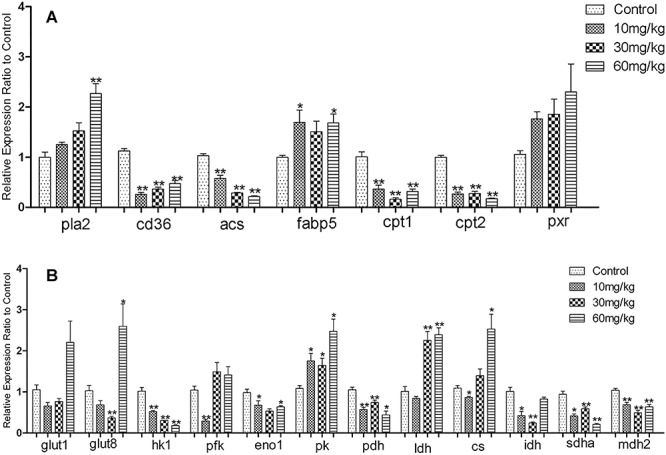
(A) Effects of DIOB dose on the fatty acid metabolism-related genes. (B) Effects of DIOB dose on the glucose metabolism- and TCA cycle-related genes.*P < 0.05 and **P < 0.01 indicate statistically significant differences compared with the enzyme expression in vehicle-treated mice.
Further analysis of the fatty acid metabolism pathway demonstrated that the mRNA expression level of Cd36, which catalyzes long-chain fatty acid cell entry, decreased in the DIOB groups compared with the control group (Fig. 4A). Cd36 plays an important role in long-chain fatty acid transport and catalyzes long-chain fatty acids to enter cells [34–36]. DIOB-mediated inhibition of Cd36 expression could explain the decreased proportion of some long-chain free fatty acids in the lungs of mice. When long-chain fatty acids enter the cytosol, ACS mediates their transformation into acyl-CoA. As shown in Fig. 4A and Table 5, compared with the control group, acs mRNA expression and enzyme activity in the lung decreased with increasing DIOB dose, indicating that DIOB can reduce fatty acid activation in the lung cells and acyl-CoA production after 28 days of administration. However, fatty acid coenzyme A requires the carrier protein Fabp5 to be transferred to the mitochondria for oxidation. It has been reported that fatty acid oxidation intensity depends on the Fabp content in the cytoplasm [37, 38]. As shown in Fig. 4A, compared with the control group, Fabp5 mRNA expression levels increased slightly with increasing DIOB dosage in the treatment groups. However, mRNA expression levels of Cpt1 and Cpt2, which can only be oxidized by transfer of acyl-carnitine into the mitochondria, decreased significantly with increasing dosage (Fig. 4A). Cpt1 is required for acyl carnitine to enter the mitochondria [39], and Cpt1 is the key enzyme in fatty acid β-oxidation, which plays an important role in regulating the entire fatty acid oxidation process [40]. Our data suggest that DIOB reduces the rate of long-chain acyl-CoA oxidation and decomposition by inhibiting Cpt1 and Cpt2 activity and suppresses fatty acid β-oxidation, thus hindering normal ATP production and affecting normal physiological lung function. This may be the root cause of the elevated long-chain free fatty acid levels observed in the plasma.
Effects of DIOB on glycometabolism in the lung and plasma
The lung contains a large amount of blood vessels and connective tissue, which makes this organ particularly susceptible to microvascular disease. Nonenzymatic glycosylation can inhibit collagen degradation, cause hyperplasia of the connective tissue, increase the collagen and elastin content in the lung interstitium, and widen the alveolar septum. It can also degrade the lung function in such a way as to decrease the elastic retraction of lung tissue, inducing dysfunction of pulmonary capillaries and causing abnormalities in the active substances on the pulmonary surface. Compared with the control group, the biochemical data show a decreasing trend in blood glucose levels in the experimental groups. Table 4 shows that the proportion of glucose in the plasma of the experimental groups also decreased. However, compared with the control group, the proportions of glucose in the lungs in mice from the different DIOB dose groups were 87.7 ± 6.4, 98.1 ± 8.9, and 113.7 ± 12.5% (from low to high), indicating that, at a dose of 60 mg/kg, the glucose content in the lung increases but is not caused by excessive glucose in the plasma. The molecular biology results demonstrated that, in mice that received 60 mg/kg DIOB, the mRNA expression levels of Glut1 and Glut8, which are responsible for glucose transport into lung cells, increased significantly compared with the control group, indicating that the increased glucose content in the lung was caused by increased expression levels of glucose transporters, resulting in an increase in glucose uptake. We further found that, compared with the control group, the mRNA expression level of hexokinase, which regulates phosphorylation of glucose to 6-phosphoglucose, was decreased in the lungs of mice from the experimental groups. Compared with the control group, the proportions of 6-phosphate glucose in the lungs of mice receiving DIOB decreased by 86.2 ± 9.7, 76.6 ± 8.1, and 70.8 ± 11.4% (from low to high). These results are consistent with the lung glucose level results described above. At the same time, the mRNA expression level of phosphofructokinase, which is phosphorylated by fructose-6-phosphate to generate fructose-1, 6-diphosphate, increased (Fig. 4B); this further explains the reduced proportion of glucose-6-phosphate in the experimental groups. Phosphoenolpyruvate is the intermediate product of glycolysis and glycogenesis. Compared with the control group, the mRNA expression of enolase, which catalyzes dehydration of 2-phosphoglycerate to produce phosphoenolpyruvate, decreased in the lungs of mice in the experimental groups, while that of pyruvate kinase, which catalyzes formation of pyruvate by phosphoenolpyruvate, increased. This reaction is the last step of glycolysis, which is an irreversible reaction that releases a large amount of ATP, indicating that DIOB could increase ATP production by activating the last step of glycolysis, thereby providing sufficient pyruvate for anaerobic glycolysis and the TCA cycle. Table S6 shows that, compared with the control group, the proportions of pyruvate in the experimental groups increased. Fig. 4B and Table 5 show that the mRNA expression and enzyme activity of pyruvate dehydrogenase, which converts pyruvate to generate acetyl CoA, exhibited a decreasing trend, which further explains the elevated pyruvate levels observed in the experimental groups. From Fig. 4B and Table 5, we can see that, compared with the control group, the ldh enzyme activity and mRNA expression in the lungs of mice in the experimental increased, indicating that DIOB can promote anaerobic glycolysis in the lungs. Table 3 also shows that, compared with the control group, the level of lactic acid in the lungs in the experimental groups showed an increasing trend, and the results from the two analyses were consistent. In conclusion, after 28 days of administration, DIOB affects glycolysis in mouse lungs. DIOB promotes the last step of glycolysis and anaerobic glycolysis, thereby providing sufficient ATP for normal physiological lung function, thus compensating for the reduced energy supply due to inhibition of fatty acid β-oxidation.
Effect of DIOB on mitochondrial energy metabolism in the lung
The mitochondria are an important hub for energy metabolism in eukaryotes and are the main site for ATP production by oxidative phosphorylation in cells and are highly sensitive to various kinds of damage [41, 42]. The results described above demonstrated that DIOB can inhibit the β-oxidation and glycolysis of long-chain fatty acids in mouse lungs, meaning that there is an insufficient supply of acetyl coenzyme A, the precursor for citric acid synthesis. However, compared with the control group, Cs mRNA expression and the enzyme activity in the lungs of mice in the experimental group increased significantly (Fig. 4B and Table 5). As illustrated in Table S5, when mice were treated with 10–30 mg/kg of DIOB, the proportion of citric acid in the lung cells decreased with increasing dosage. Only when the dose reached 60 mg/kg was the proportion of citric acid higher than that in the control group. The proportion of citric acid in the plasma of the mice in the experimental groups decreased by 84.9 ± 10.3, 88.8 ± 12.6, and 98.8 ± 9.5% (from low to high), indicating that the increased proportion of citric acid in the high-dose group did not come from the plasma. DIOB can increase the production of citric acid by enhancing the activity of citrate synthase. Fig. 4B showed that, compared with the control group, isocitrate dehydrogenase mRNA expression decreased with increasing DIOB dosage, which also explains the elevated citric acid levels. As shown in Table S6, the proportion of α-ketoglutarate in the lung cells increased with increasing DIOB dosage, compared with the control. However, the inhibition of isocitrate dehydrogenase indicates that the increased α-ketoglutarate proportion did not come from the TCA cycle. The results show that glycogen amino acids were converted into glutamic acid, which was then deaminated to form α-ketoglutarate that entered the TCA cycle. As shown in Table 6, compared with the control group, the content of glycogen amino acids (histidine, arginine, and proline) decreased with increasing DIOB dosage, while the proportion and content of glutamic acid increased, which explains the increased proportion of α-ketoglutarate in the lung cells. Meanwhile, we found that the mRNA expression of succinic acid dehydrogenase and malic acid dehydrogenase decreased with increasing DIOB dosage. Tables 3 and S5 show that, compared with the control group, the proportion of the corresponding TCA cycle products generated from succinic acid in the lung cells of the experimental groups increased, which is consistent with the observed inhibition of succinic acid dehydrogenase and malic acid dehydrogenase expression. Succinic acid dehydrogenase and malic acid dehydrogenase are the two key enzymes involved in the TCA cycle, and succinic acid dehydrogenase is a marker of mitochondrial function. Its activity can be used as an important indicator to evaluate the activity of the TCA cycle [43]. Thus, our results indicate that DIOB inhibits the TCA cycle in the lung cell mitochondria.
Table 6.
The changes of amino acid concentration in lung under the influence of different doses of DIOB
| Compound (μmol/g) | Control | 10 (mg/kg) | 30 (mg/kg) | 60 (mg/kg) |
|---|---|---|---|---|
| d-glutamic acid | 1865.5 ± 319.9 | 3039.9 ± 445.2* | 4274.1 ± 428.6** | 4153.8 ± 480.5** |
| l-leucine | 493.2 ± 47.8 | 469.7 ± 49.9 | 384.6 ± 27.3 | 439.6 ± 54.1 |
| l-proline | 437.8 ± 46.4 | 423.2 ± 70.6 | 324.7 ± 19.7** | 293.7 ± 32.5** |
| Taurine | 4517.7 ± 382.4 | 5494.0 ± 386.9* | 5285.9 ± 272.8* | 4723.7 ± 207.7 |
| l-arginine | 250.4 ± 46.8 | 236.8 ± 51.0 | 193.9 ± 61.0* | 185.0 ± 78.5** |
| l-histidine | 107.9 ± 26.0 | 93.7 ± 16.4 | 93.6 ± 12.1 | 78.5 ± 30.0** |
Values are presented as mean ± SD (n = 5). Statistical analysis was performed by one-way Anova with Tukey’s test for comparisons between groups.
* P < 0.05.
* * P < 0.01.
ATPase is an enzyme that hydrolyzes ATP, thereby providing energy for life activities, and plays a vital role in metabolism. Na+-K+-ATPase and Ca2+-Mg2+-ATPase play an important role in maintaining normal intracellular ion concentrations and are closely associated with cell energy utilization and production [44]. Compared with the control group, Na+-K+-ATPase, Ca2+-Mg2+-ATPase, and total ATPase activity in the cytoplasm and mitochondria of lung cells decreased with increasing DIOB dosage, while the content of ATP increased with increasing DIOB dosage (Table 7). This indicated that DIOB could reduce Na+-K+-ATPase, Ca2+-Mg2+-ATPase, and total ATPase in the mitochondria of lung cells, leading to disordered ion transport across the mitochondrial membrane, affecting the rate of ATP utilization and, ultimately, increasing ATP content. Although our earlier results demonstrated that DIOB inhibited fatty acid β-oxidation and the TCA cycle, leading to decreased ATP production, the missing ATP could be supplied by the final step of glycolysis and anaerobic glycolysis. There was no significant difference in the increase in ATP content in pulmonary mitochondria, which also indicated the overall balance of ATP supply in pulmonary mitochondria. But the decrease in mitochondrial ATP utilization led to a deficiency in the energy required for the normal physiological activities of the lung, as many functions of the lung tissues are energy-consuming and require a substantial energy supply. Disordered energy metabolism affects various physiological lung functions, which may be the root cause of the pulmonary toxicity caused by DIOB. In summary, after 28 days of administration, DIOB blocked the TCA cycle in lung mitochondria, reduced ATPase activity in the mitochondria, destroyed mitochondrial ion balance, and reduced utilization of mitochondrial ATP, thereby leading to pathological changes in the lung.
Table 7.
Effects of DIBO on Na+-K+-ATPase, Ca2+-Mg2+-ATPase, total ATPase activities, and ATP content in mitochondria
| Group | Na+-K+-ATPase (U/g) | Ca2+-Mg2+-ATPase (U/g) | ATPase (U/g) | ATP (μmol/g) |
|---|---|---|---|---|
| Control | 385.48 ± 40.96 | 139.19 ± 6.80 | 271.74 ± 44.93 | 64.79 ± 12.41 |
| 10 mg/kg | 333.49 ± 38.02 | 79.95 ± 7.69** | 220.51 ± 48.50 | 80.71 ± 9.90 |
| 30 mg/kg | 262.52 ± 50.41* | 57.89 ± 15.89** | 71.20 ± 15.02** | 85.34 ± 9.50 |
| 60 mg/kg | 253.48 ± 17.36** | 36.04 ± 5.57** | 173.44 ± 11.65* | 76.74 ± 11.61 |
Data are the mean ± SEM (n = 3). Statistical analysis was performed by one-way Anova with Tukey’s test for comparisons between groups.
* P < 0.05.
* * P < 0.01.
Effect of DIOB on cyp3a13 activity in the lung
The literature shows that there is a correlation between PXR activation and cyp3a11 enzyme induction [45–47]. As shown in Figs S3A and B, compared with the control group, mRNA expression levels of PXR, as well as cyp3a13 mRNA expression and enzyme activity in the lung cells, was increased in the experimental groups. As shown in Table S6, DIOB remained in the lung, but not the plasma, after 24 hours of administration; however, it accumulated in the plasma but not in the lungs, which indirectly verifies the induction of cyp3a13 activity by DIOB. Previous studies have shown that DIOB is mainly metabolized by CYP3A [48] and that DIOB toxicity increases primarily through metabolic activation [49, 50]. Thus, the pathological changes observed in the lungs when the DIOB dose was 60 mg/kg show that DIOB induced lung toxicity by increasing its own metabolism by cyp3a13. In conclusion, the pathological changes seen in the lungs of the mice in the experimental groups were related to the increased plasma levels of long-chain free fatty acids and endogenous metabolites related to the inflammatory response, and the induction of cyp3a13 activation by DIOB also contributes to lung toxicity.
Conclusion
On the basis of metabonomics and other methods, we found that DIOB caused pathological changes in the lung, indicating that DIOB could cause lung toxicity. These findings provide important new information regarding the mechanism of DIOB-induced lung toxicity. First, our metabonomic analysis showed that DIOB affects the levels of various endogenous factors related to lung and plasma metabolism; second, we identified an internal correlation between the DIOB-induced changes in the lung and plasma metabolic pathways using the metabolic pathway maps we constructed; and third, using molecular biology and other techniques to assess the changes in endogenous factor levels, we determined that the pulmonary toxicity caused by DIOB was due to the presence of high levels of free fatty acids in the mouse plasma. The levels of endogenous metabolites related to the inflammatory response were significantly increased in the lungs of mice in the experimental groups. At a molecular level, DIOB induces pulmonary toxicity by inhibiting fatty acid oxidation and the TCA cycle in the lung and by partially inhibiting glycolysis. However, to compensate for the inadequate ATP supply, DIOB can promote the last step of glycolysis and anaerobic glycolysis in the lung cells of mice, causing changes in the lung metabolic function that lead to lung toxicity (Fig. 5). DIOB also induced cyp3a13 activity in the mouse lungs, resulting in greater toxicity at higher doses, thus damaging lung cells and causing toxic effects.
Figure 5 .
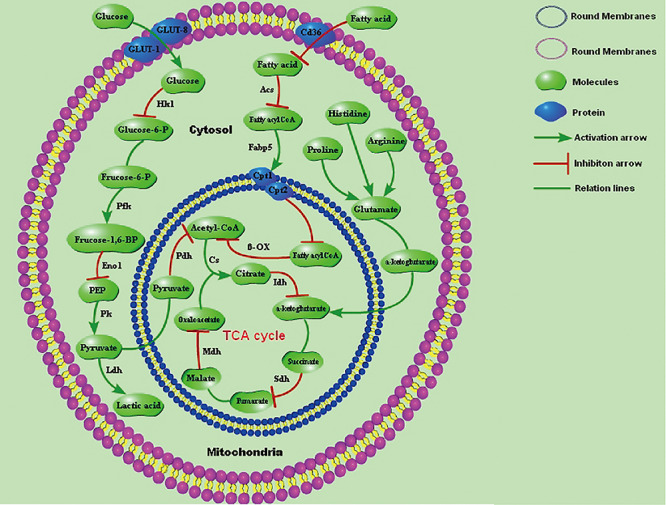
Effect of DIOB on the lung-related metabolic pathways in mice.
Supplementary Material
Contributor Information
Hainan Ji, Institute of Chemicals Safety, Chinese Academy of Inspection and Quarantine, No. 11 Rong Hua middle road, Economic-Technological Development Area, 100176 Beijing, China.
Chang Liu, The Institute of Medicinal Plant Development, Chinese Academy of Medical Sciences, No. 151 malianwa North Road, Haidian District, 100193 Beijing, China.
Na Tong, Center for Food Evaluation, State Administration for Market Regulation, Building 15, area 11, 188 South Fourth Ring Road West, Fengtai District, 100070 Beijing, China.
Naining Song, Institute of Chemicals Safety, Chinese Academy of Inspection and Quarantine, No. 11 Rong Hua middle road, Economic-Technological Development Area, 100176 Beijing, China.
Baoliang Xu, Institute of Chemicals Safety, Chinese Academy of Inspection and Quarantine, No. 11 Rong Hua middle road, Economic-Technological Development Area, 100176 Beijing, China.
Chan Zhao, Institute of Chemicals Safety, Chinese Academy of Inspection and Quarantine, No. 11 Rong Hua middle road, Economic-Technological Development Area, 100176 Beijing, China.
Haishan Li, Institute of Chemicals Safety, Chinese Academy of Inspection and Quarantine, No. 11 Rong Hua middle road, Economic-Technological Development Area, 100176 Beijing, China.
Guolin Shen, Institute of Chemicals Safety, Chinese Academy of Inspection and Quarantine, No. 11 Rong Hua middle road, Economic-Technological Development Area, 100176 Beijing, China.
Hua Li, Beijing Institute of Pharmacology\remvoliss and Toxicology, No. 27 Taiping Road, Haidian District, 100850 Beijing, China.
Funding
This work was supported by grants from the Basic Research Fund for Central Public Interest Institutes (No. 2017JK042, No. 2018JK021, No. 2018JK023), The National Key Research and Development Program of China (2017YFF0211201).
Conflict of Interest
The authors declare no conflict of interest. The funders had no role in the design of the study; in the collection, analyses, or interpretation of data; in the writing of the manuscript, or in the decision to publish the results.
Reference
- 1. Zhang HM, Yuan JY. Advances in pharmacology and toxicology of Rhizoma coptidis. Herald Med 2009;28:490–2. [Google Scholar]
- 2. Zhang JP, Gao W, Gao HY. The study progress of Dioscorea bulbifera L. Mod Chin Med 2008;10:34–7. [Google Scholar]
- 3. Rego T de S, Ash Lda S, Pessoa L, et al. The intake of yam (Dioscorea bulbifera Li nn) attenuated the hyperglycemia and the bone fragility in female diabetic rats. Nutr Hosp 2014;29:370–5. [DOI] [PubMed] [Google Scholar]
- 4. Ghosh S, More P, Derle A, et al. Diosgenin from Dioscorea bulbifera: novel hit for treatment of type II diabetes mellitus with inhibitory activity against alpha-amylase and alpha glucosidas. PLoS One 2014;9:e106039. [DOI] [PMC free article] [PubMed] [Google Scholar]
- 5. Murray RDH, Jorge ZD, Khan NH, et al. Diosbulbin D and 8-epidiosbulbin E acetate, norclerodane diterpenoids from Dioscorea bulbifera tubers. Phytochemistry 1984;23:623–5. [Google Scholar]
- 6. Yang R, Bai Q, Zhang J, et al. The altered liver micro RNA profile in hepatotoxicity induced by rhizome Dioscorea bulbifera in mice. Hum Exp Toxicol 2017;36:823–32. [DOI] [PubMed] [Google Scholar]
- 7. Wang JM, Cui DP, Cui Y. Research progress in chemical components, pharmacological actions and toxicity of diterpene lactones isolated from Dioscoreae bulbifera L. Rhizome. China J Chin Med 2011;26:1319–21. [Google Scholar]
- 8. Niu CW, Lu B, Ji LL, et al. Study on diosbulbin B-induced acute liver injury in mice and its mechanism. Chin J Chin Mater Med 2014;39:1290–2. [Google Scholar]
- 9. Lin HW, Zhang G, Zhang HB, et al. Research progress of Huangyaozi. Chin Tradit Herb Drug 2002;33:175–7. [Google Scholar]
- 10. Xu YF, Yang HY, Yuan M, et al. Comparison of pharmacokinetics and tissue distribution of diosbulbin B in rats after intragastric administration of compound diosbulbin B and ethanol extract from Dioscorea bulbifera L. Chin J Pharmacol Toxicol 2018;32:72–8. [Google Scholar]
- 11. Davis WA, Knuiman M, Kendall P, et al. Glycemic exposure is associated with reduced pulmonary function in type 2 diabetes: the Fremantle diabetes study. Diabetes Care 2004;27:752–7. [DOI] [PubMed] [Google Scholar]
- 12. Lawlor DA, Ebrahim S, Smith GD. Associations of measures of lung function with insulin resistance and type 2 diabetes: findings from the British Women's heart and health study. Diabetologia 2004;47:195–203. [DOI] [PubMed] [Google Scholar]
- 13. Yeh HC, Punjabi NM, Wang NY, et al. Vital capacity as a predictor of incident type 2 diabetes: the atherosclerosis risk in communities study. Diabetes Care 2005;28:1472–9. [DOI] [PubMed] [Google Scholar]
- 14. Engstrom G, Wbllmer R, Valind S, et al. Blood pressure increase between 55 and 68 years of age is inversely related to lung function: longitudinal results from the cohort study men born in 1914. J Hypertens 2001;19:1203–8. [DOI] [PubMed] [Google Scholar]
- 15. Engstrom G, Hedblad B, Nilsson P, et al. Lung function, insulin resistance and incidence of cardiovascular disease: a longitudinal cohort study. J Intern Med 2003;253:574–81. [DOI] [PubMed] [Google Scholar]
- 16. Cheng F. A report of 8 cases of toxotoxic hepatitis. Jiangsu J Tradit Chin Med 1995;16:297. [Google Scholar]
- 17. Wu CX. Liver damage caused by Huangyaozi: a case report. Lishizhen Med Mat Medica Res 2000;11:186. [Google Scholar]
- 18. Zhou HM. Report on 3 cases of toxic hepatitis caused by Hashimoto's thyroid. Shandong J Tradit Chin Med 1989;8:29. [Google Scholar]
- 19. Miu ZQ. Report of 11 cases of toxic hepatitis caused by Huang Du. Zhejiang Med J 1980;2:30. [Google Scholar]
- 20. Gao WN, Yang QS, Liu JS. Determination of the content of Diosbulbin B placed in different years of Dioscorea bulbifera. Guangzhou Chem Industry 2015;43:130–2. [Google Scholar]
- 21. Reagan-Shaw S, Niha M, Ahmad N. Dose translation from animal to human studies revisited. FASEB J 2008;22:659–61. [DOI] [PubMed] [Google Scholar]
- 22. Zhou L, Zhang W, Chen H, et al. Short-term effects of tributyl phosphate exposure on the metabolism of liver and susceptibility to hepatic encephalopathy in male mice. Sci Total Environ 2017;603–604:77–85. [DOI] [PubMed] [Google Scholar]
- 23. Baines CP, Zhang J, Wang GW, et al. Mitochondrial PKCepsilon and MAPK form signaling modules in the murine heart: enhanced mitoehondrial PK Cepsilon-MAPK interactions and differential MAPK activation in PKC epsilon-induced cardioprotection. Circ Res 2002;90:390–7. [DOI] [PubMed] [Google Scholar]
- 24. Cui Y, Han JY, Ren J, et al. Untargeted LC-MS-based metabonomics revealed that aristolochic acid I induces testicular toxicity by inhibiting amino acids metabolism, glucose metabolism, β-oxidation of fatty acids and the TCA cycle in male mice. Toxicol Appl Pharmacol 2019;373:26–38. [DOI] [PubMed] [Google Scholar]
- 25. Figard PH, Hejlik DP, Kaduce TL, et al. Free fatty acid release from endothelial cells. J Lipid Res 1986;7:771–80. [PubMed] [Google Scholar]
- 26. Steinberg HO, Tarshoby M, Monestel R, et al. Elevated circulating free fatty acid levels impair endothelium-dependent vasodilation. J Clin Invest 1997;100:1230–9. [DOI] [PMC free article] [PubMed] [Google Scholar]
- 27. Tripathy D, Mohanty P, Dhindsa S, et al. Elevation of free fatty acids induces inflammation and impairs vascular reactivity in healthy subjects. Diabetes 2003;52:2882–7. [DOI] [PubMed] [Google Scholar]
- 28. Chinen I, Shimabukuro M, Yamakawa K, et al. Vascular lipotoxicity: endothelial dysfunction via fatty-acid-induced reactive oxygen species overproduction in obese Zucker diabetic fatty rats. Endocrinology 2007;148:160–5. [DOI] [PubMed] [Google Scholar]
- 29. Jia HT. Biochemistry, 3th edn. Bei Jing: Peking University Medical Press Medical Education, 2005, 216. [Google Scholar]
- 30. Deng CL, Chen GM, Yu GK. The role of cytokines in liver fibrosis. J Chongqing Medical University 1998;23:101. [Google Scholar]
- 31. Six DA, Dennis EA. The expanding superfamily of phosphoipase A(2) enzymes: classification and characterization. Biochim Biophys Acta 2000;1448:1–19. [DOI] [PubMed] [Google Scholar]
- 32. Evans JH, Spencer DM, Zweifach A, et al. Intracellular calcium signals regulating cytosolic phospholipase A(2) translocation to internal. J Biol Chem 2001;276:30150–60. [DOI] [PubMed] [Google Scholar]
- 33. Jensen JC, Buresh C, Norton JA. Lactic acidosis increases tumor necrosis factor secretion and transcription in vitro. J Surg Res 1990;49:350–3. [DOI] [PubMed] [Google Scholar]
- 34. Ibrahimi A, Bonen A, Blinn WD, et al. Muscle-specific over-expression of FAT/CD36 enhances fatty acid oxidation by contracting muscle, reduces plasma triglycerides and fatty acids, and increases plasma glucose and insulin. J Biol Chem 1999;274:26761–6. [DOI] [PubMed] [Google Scholar]
- 35. Holloway GP, Luiken JJ, Glatz JF, et al. Contribution of FAT/CD36 to the regulation of skeletal muscle fatty acid oxidation: an overview. Acta Physiol 2008;194:293–309. [DOI] [PubMed] [Google Scholar]
- 36. Hamilton JA, Kamp F. How are free fatty acids transported in membranes. Diabetes 1999;48:2255–69. [DOI] [PubMed] [Google Scholar]
- 37. Glatz JFC, et al. Intracellular transport of lipids. Mol Cell Biochem 1989;88:37. [DOI] [PubMed] [Google Scholar]
- 38. Peeters RA, et al. Does fatty acid-binding protein play a role in fatty acid transport? Mol Cell Biochem 1989;88:45. [DOI] [PubMed] [Google Scholar]
- 39. Reddy JK, Hashimoto T. Peroxisomal beta-oxidation and peroxisome proliferator-activated receptor alpha: an adaptive metabolic system. Annu Rev Nutr 2001;21:193–230. [DOI] [PubMed] [Google Scholar]
- 40. Kim JY, Hickner RC, Cortright RL, et al. Lipid oxidation is reduced in obese human skeletal muscle. Am J Physiol Endocrinol Metab 2000;279:1039–44. [DOI] [PubMed] [Google Scholar]
- 41. Kitazawa M, Wagner JR, Kirby ML, et al. Oxidative stress and mitochondrial-mediated apoptosis in dopaminergic cells exposed to methylcyclopentadienyl manganese tricarbonyl. J Pharmacol Exp Ther 2002;302:26–35. [DOI] [PubMed] [Google Scholar]
- 42. Li HK, Xu LP, Joseph CD, et al. Role of mitochondrial cytochrome c in cocaine-induced apoptosis in rat testes. Urology 2003;61:646–50. [DOI] [PubMed] [Google Scholar]
- 43. Li J, Wu YS. On the binding of succinate dehydrogenase to mitochondrial inner membrane. J Biochem Biophys 1976;8:137–49. [Google Scholar]
- 44. Liu YM, Wang XF, Ma JW. Active change of CaN in artery smooth muscle celland Na+-K+-ATPase in myocardic with spontaneous hypertension. J Hebei North University (Medical Edition) 2005;22:10–2. [Google Scholar]
- 45. Pascussi JM, Gerbal-Chaloin S, Drocourt L. The expression of CYP2B6, CYP2C9 and CYP3A4 genes:a tangle of networks of nuclear and steroid receptors. Biochim Biophys Acta 2003;1619:243–53. [DOI] [PubMed] [Google Scholar]
- 46. Faucette SR, Sueyoshi T, Smith CM, et al. Differential regulation of hepatic CYP2B6 and CYP3A4 genes by constitutive androstane receptor but not pregnane X receptor. Pharmacol Exp Ther 2006;317:1200–9. [DOI] [PubMed] [Google Scholar]
- 47. Duniec-Dmuchowski Z, Ellis E, Strom SC, et al. Regulation of CYP3A4 and CYP2B6 expression by liver X receptor agonists. Biochem Pharmacol 2007;74:1535–40. [DOI] [PMC free article] [PubMed] [Google Scholar]
- 48. Xu YF. Study on in vivo and in vitro metabolism and pharmacokinetics of active constituents in Dioscorea bulbifera L Master's thesis. Academy of Military Sciences, 2018, 79. [Google Scholar]
- 49. Jiang JZ, Yang BH, Ji LL, et al. Metabolic-induced cytotoxicity of diosbulbin B in CYP3A4-expressing cells. Toxicol In Vitr 2017;38:59–66. [DOI] [PubMed] [Google Scholar]
- 50. Wang K, Lin D, Guo X, et al. Chemical identity of interaction of protein with reactive metabolite of Diosbulbin B in vitro and in vivo. Toxins (Basel) 2017;9:E249. [DOI] [PMC free article] [PubMed] [Google Scholar]
Associated Data
This section collects any data citations, data availability statements, or supplementary materials included in this article.