

Abstract
Glycolysis and fatty acid (FA) synthesis directs the production of energy-carrying molecules and building blocks necessary to support cell growth, although the absolute requirement of these metabolic pathways must be deeply investigated. Here, we used Drosophila genetics and focus on the TOR (Target of Rapamycin) signaling network that controls cell growth and homeostasis. In mammals, mTOR (mechanistic-TOR) is present in two distinct complexes, mTORC1 and mTORC2; the former directly responds to amino acids and energy levels, whereas the latter sustains insulin-like-peptide (Ilp) response. The TORC1 and Ilp signaling branches can be independently modulated in most Drosophila tissues. We show that TORC1 and Ilp-dependent overgrowth can operate independently in fat cells and that ubiquitous over-activation of TORC1 or Ilp signaling affects basal metabolism, supporting the use of Drosophila as a powerful model to study the link between growth and metabolism. We show that cell-autonomous restriction of glycolysis or FA synthesis in fat cells retrains overgrowth dependent on Ilp signaling but not TORC1 signaling. Additionally, the mutation of FASN (Fatty acid synthase) results in a drop in TORC1 but not Ilp signaling, whereas, at the cell-autonomous level, this mutation affects none of these signals in fat cells. These findings thus reveal differential metabolic sensitivity of TORC1- and Ilp-dependent growth and suggest that cell-autonomous metabolic defects might elicit local compensatory pathways. Conversely, enzyme knockdown in the whole organism results in animal death. Importantly, our study weakens the use of single inhibitors to fight mTOR-related diseases and strengthens the use of drug combination and selective tissue-targeting.
Keywords: fatty acid synthesis, glycolysis, cell-autonomous effect, homeostasis
Introduction
The mTOR (mechanistic Target of Rapamycin) regulatory network orchestrates organismal growth in response to growth factor signaling and nutritional status (Laplante and Sabatini 2012; Howell et al. 2013; Lamming and Sabatini 2013; Shimobayashi and Hall 2014; Caron et al. 2015; Saxton and Sabatini 2017; Mossmann et al. 2018). Activation of this network promotes basal cellular functions, thereby providing building blocks to sustain cellular growth. However, despite a plethora of studies on the mTOR signaling network, the requirement of basal metabolism—glycolysis and fatty acid (FA) synthesis—for cell growth has not been systematically investigated. The Drosophila model provides a powerful genetic system to address these issues (Ugur et al. 2016), since both the intermediates of this signaling network and the basal metabolic pathways are conserved in the fruit fly (Montagne et al. 2001; Hay and Sonenberg 2004; Padmanabha and Baker 2014; Antikainen et al. 2017; Wangler et al. 2017; Lehmann 2018).
The mTOR protein kinase is present in two distinct complexes, mTORC1 and mTORC2, which comprise raptor and rictor, respectively (Kim et al. 2002; Sarbassov et al. 2005). ATP and amino acid levels control the recruitment of an mTORC1 homodimer at the lysosomal membrane in the vicinity of the small GTPase Rheb (Ras homolog enriched in brain) (Goberdhan et al. 2009; Ma and Blenis 2009; Dibble and Manning 2013; Groenewoud and Zwartkruis 2013; Montagne 2016). Rheb stimulates mTORC1 activity (Yang et al. 2017), which in turn regulates several downstream targets. S6Kinase1 (S6K1) is one such kinase, sequentially activated through the phosphorylation of its T389 and T229 residues by mTORC1 and by PDK1 (Phosphoinositide-dependent protein kinase 1), respectively (Montagne and Thomas 2004; Magnuson et al. 2012). Rheb activation of mTORC1 is repressed by the tumor suppressor TSC (Tuberous sclerosis complex) that comprises subunits TSC1 and TSC2 (Radimerski et al. 2002a; Garami et al. 2003; Inoki et al. 2003a; Dibble et al. 2012). The integrity of mTORC2 is required to sustain the downstream insulin-signaling response (Sarbassov et al. 2005). Binding of insulin-like-peptides (Ilps) to their cognate receptors results in recruitment of class I PI3K (Phosphoinositide 3-kinase) to the membrane. PI3K phosphorylates inositol lipids to phosphatidylinositol-3,4,5-triphosphate (PIP3) (Engelman et al. 2006; Haeusler et al. 2018), while the tumor suppressor PTEN counteracts this process (Cully et al. 2006; Goberdhan et al. 2009). PIP3 constitutes a membrane docking site for the protein kinase Akt whose activity requires the subsequent phosphorylation of its S473 and T308 residues by mTORC2 and PDK1, respectively (Lien et al. 2017).
Constitutive activation of mTORC1 in mouse embryonic fibroblasts represses the tricarboxylic acid (TCA) cycle and stimulates anaerobic glycolysis and biosynthesis of FAs and cholesterol (Duvel et al. 2010). Conversely, adipose-specific knockout of raptor to impede mTORC1 formation, results in enhanced uncoupling of mitochondrial activity (Polak et al. 2008). The increased lipogenesis observed in mTORC1 stimulated cells depends on the cofactor Lipin 1 and on an SREBP (Sterol responsive element binding-protein) family member (Duvel et al. 2010; Peterson et al. 2011). Congruently, TSC2 mutant cells become addicted to glucose as a result of mTORC1 hyperactivity (Inoki et al. 2003b) and, in the context of mTORC1 inhibition, promote glutamine anaplerosis (Choo et al. 2010; Csibi et al. 2013, 2014). Ilp signaling also impinges on basal metabolism. Intracellular activation of Akt increases ATP levels (Hahn-Windgassen et al. 2005; Robey and Hay 2009) through the stimulation of GLUT4-mediated glucose uptake (Jaldin-Fincati et al. 2017) and the enhancement of the expression and activity of glycolytic enzymes (Gottlob et al. 2001; Houddane et al. 2017). Akt also dampens glucose production by suppressing PEPCK (gluconeogenesis), glucose-6-phosphatase (glycogenolysis), and the glycogen synthesis repressor GSK3 (Nakae et al. 2001; McManus et al. 2005). In addition, Akt promotes mitochondrial metabolism and oxidative phosphorylations (Gottlob et al. 2001; Majewski et al. 2004). Conversely, hepatic knockout of the mTORC2 specific-subunit rictor results in constitutive gluconeogenesis and impaired glycolysis and lipogenesis (Hagiwara et al. 2012; Yuan et al. 2012). Taken together, these studies strongly emphasize the role of mTOR in metabolic-related diseases and in adjusting metabolism to the nutritional and energy status (Mossmann et al. 2018).
Despite a plethora of studies, the net requirement of these metabolic changes to sustain overgrowth induced by over-activation of mTOR signaling has not been formally addressed. This signaling network is conserved in Drosophila (hereafter called as TOR), providing a powerful genetic system to address these issues. In the present study, we investigated the requirement of glycolysis and FA synthesis for the cellular growth induced by hyperactivation of TORC1 signaling and Ilp response in Drosophila. Consistent with previous studies (Radimerski et al. 2002a, 2002b; Dong and Pan 2004; Montagne et al. 2010; Pallares-Cartes et al. 2012), we show that TORC1- and Ilp-dependent overgrowth can be independently modulated in the Drosophila fat body (FB), the organ that fulfills hepatic and adipose functions (Padmanabha and Baker 2014; Antikainen et al. 2017; Lehmann 2018). We show that ubiquitous over-activation of TORC1 or Ilp signaling affects basal metabolism and that metabolic restriction at the organismal level has dramatic consequences on animal survival, but minor effect at the cell-autonomous level. This suggests that within an organism, alternative strategies may operate to compensate local metabolic defects. Finally, at the cell-autonomous level, metabolic restriction can partially restrain overgrowth dependent on hyperactivation of Ilp signaling but not TORC1 signaling, indicating that the potential compensatory metabolic pathways do not fully operate in the context of Ilp-signaling stimulation.
Materials and methods
Genetics and fly handling
Fly strains: P[w[+mC]=tubP-GAL80]LL10, P[ry[+t7.2]=neoFRT]40A, daughterless(da)-gal4, tub-gal80ts, UAS-Dcr-2 from BDSC (bdsc.indiana.edu); hs-flp, tub-gal4, UAS-nls-GFP/FM7, FASN1-2 (Garrido et al. 2015); TorΔP (Zhang et al. 2000); Tor2L1, Tor2L19, and PTEN- (Oldham et al. 2000); EP(UAS)-Rheb (Stocker et al. 2003); inducible interfering RNA (UAS-RNAi) lines from NIG (shigen.nig.ac.jp/fly/nigfly) to PTEN (5671R-2), from VDRC (stockcenter.vdrc.at) to FASN1 (29349), PFK1 (3017), PK (49533) PDH (40410), LDH (31192) (Dietzl et al. 2007). To generate MARCM clones in a Minute background, the FRT40/P(arm-LacZ w+) chromosome (Bohni et al. 1999) was recombined with the P[w[+mC]=tubP-GAL80]LL10, P[ry[+t7.2]=neoFRT]40A chromosome (Lee and Luo 2001). Standard media: agar (1 g), polenta (6 g), and yeast (4 g) for 100 ml. Lipid- (beySD) and sugar-complemented media were as described (Garrido et al. 2015). FASN1-2 mutant larvae were collected at L1 hatching on grape juice plates following the lack of a GFP-labeled balancer and transferred to fresh tubes. Prepupae were collected once a day to evaluate developmental delay and to measure bodyweight and size.
Molecular biology and Biochemistry
RNAi-knockdown efficacy (Supplementary Figure S1): UAS-Dcr-2;da-gal4,tub-gal80ts females mated with UAS-RNAi males were let to lay eggs overnight. tubes were kept at 19°C for 2 days, then transferred at 29°C; 2 days later, larvae of roughly the same size were collected for quantitative PCR as described (Parvy et al. 2012). For western blotting, protein extracts were prepared as described and antibodies were previously described for dS6K and phospho-S6 (Montagne et al. 2010; Romero-Pozuelo et al. 2017) or commercially provided for phospho-dS6K, Akt, and ERK (Cell signaling 9209, 9272, 4054, 4695, 4370).
For metabolic measurements, tubes containing 24-h egg collection were maintained at 29°C to strengthen the gal4/UAS effect. Larvae were selected prior to L2/L3 transition and transferred on either a standard diet or a 20%-sucrose supplemented diet (20%-SSD). Collection of prepupae and metabolic measurements were performed as described (Garrido et al. 2015). For protein and triacylglycerol (TAG) measurements, prepupae were weighted and crushed in 400 µl PBT (PBS, 0.1% Triton X-100) and centrifuged for 5 mn at 12,000 rpm. For proteins, 10 µl of extract mixed with 1 ml of 5×-diluted reagent (Bio-Rad Protein Assay Kit) were incubated 15 mn in dark at room temperature; OD was measured at 595 ηm. For TAGs, 20 µl of extract mixed with 500 µl of reagent (Kit STANBIO Triglyceride LiquiColor) were incubated 15 mn at 37°C; OD was measured at 500 ηm. For trehalose and glycogen, prepupae were crushed in 350 µl Na2 (0.25 M) (PBS 0.1% Triton X-100). After 2-h incubation at 65°C, 700 µl of Na Acetate (0.3 M) and 130 µl of Acetic acid (1.7 M) were added and tubes were centrifuged for 10 mn at 12,000 rpm. For each sample, three sets of 20 µl of extract were incubated overnight at 37°C, two of them contained 1 U/ml of either Trehalase or Amyloglucosidase (SIGMA). Next, all samples mixed with 500 µl of glucose oxidase [Thermo Electron, GLUCOSE (GDO-POD)] were incubated 20 mn at 37°C; OD was measured at 510 ηm. The net concentration of trehalose and glycogen was obtained by subtracting the concentration values of the extracts without enzyme.
Clonal analysis
MARCM clones (Lee and Luo 2001) were generated from 6- to 7-h egg collections heat-shocked for 65 mn at 38°C. FB of late L3 feeding larvae were dissected, fixed, and labeled with Phalloidin (membranes) and DAPI (nuclei) as described (Garrido et al. 2015). Image was acquired on a Leica SP8 confocal laser-scanning microscope. Cell size calculation has been performed as described (Garrido et al. 2015) from at least eight larvae per genotype, containing a few MARCM clones surrounded by control cells. Because of an extremely low ratio of larvae that fully develop and harbor mitotic clones, the mean values were calculated from several experiments that could not be performed at the same time, but over a long period. Therefore, for the graphs of cell size measurement (Supplementary Figures S2, A and C, Figures 5M and 7M), values are reused when they correspond to the same genotype and conditions, allowing direct comparison between experiments.
Figure 5.

Cell-autonomous requirement of glycolysis for Ilp- but not TORC1-dependent overgrowth. (A–G) MARCM clones labeled by GFP (green) in the FB of L3 larvae. Nuclei were labeled with DAPI (silver) and membranes with phalloidin (red). Genotypes of MARCM clones are: PFK1-RNAi (A), PK-RNAi (B), LDH-RNAi (C), PDH-RNAi (D), Rheb+,PFK1-RNAi (E), Rheb+,PK-RNAi (F), Rheb+,LDH-RNAi (G), Rheb+,PDH-RNAi (H), PTEN−/−;PFK1-RNAi (I), PTEN−/−;PK-RNAi (J), PTEN−/−;PDH-RNAi (K), and PTEN−/−;PDH-RNAi (L). Scale bars: 50 μm. (M) Relative size of clonal cells corresponding to the clones shown in (A–L), and in Figure 1A for control (Co).
Figure 7.
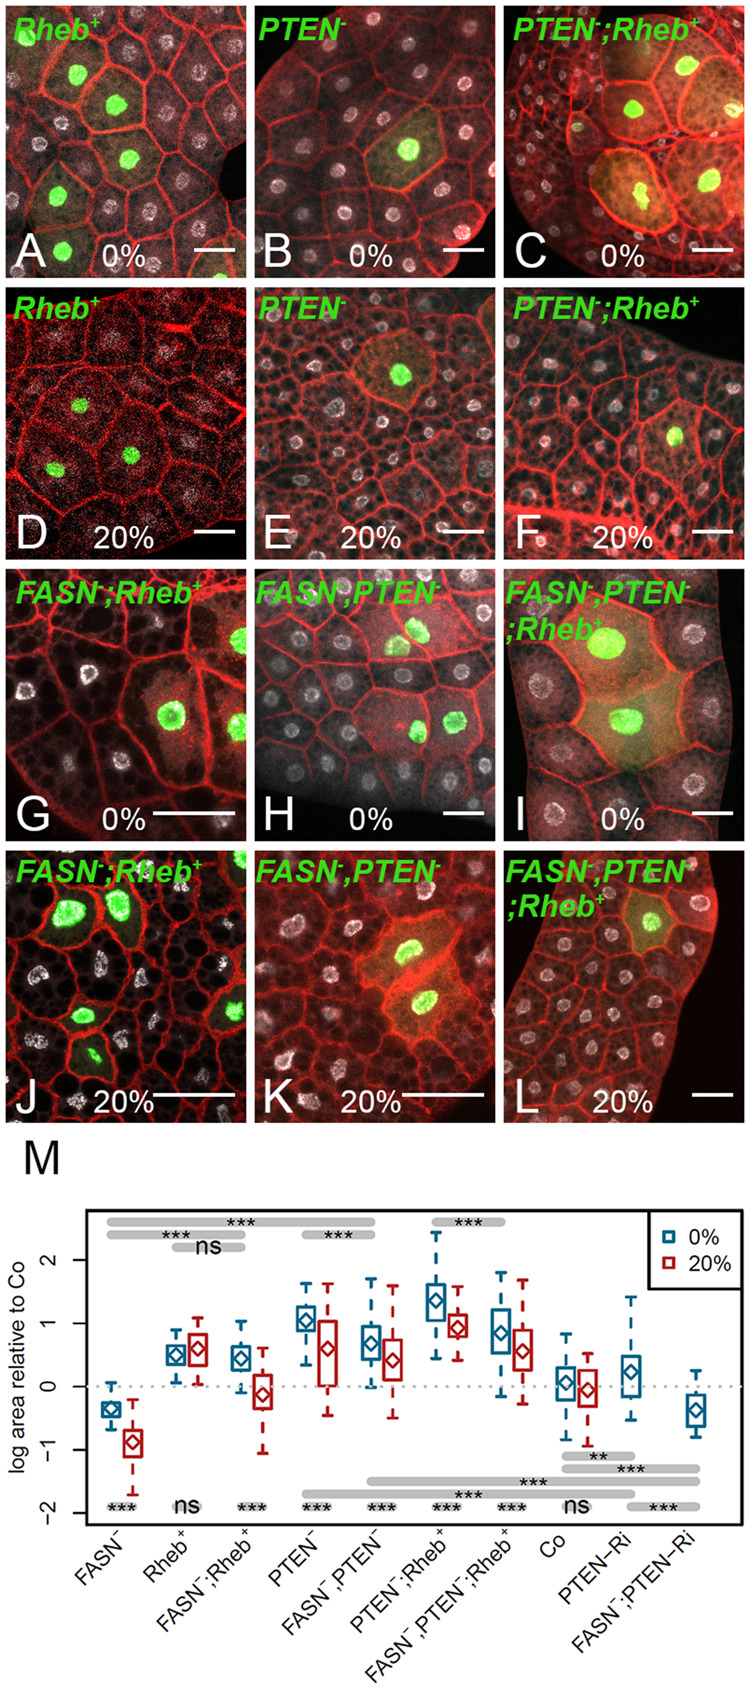
Cell-autonomous requirement of FASN activity for Ilp- but not TORC1-dependent overgrowth. (A–L) MARCM clones labeled by GFP (green) in the FB of L3 larvae fed either a standard (A–C, G–I) or a 20%-SSD (D–F, J–L). Nuclei were labeled with DAPI (silver) and membranes with phalloidin (red). Genotypes of MARCM clones are: Rheb+ (A, D), PTEN−/− (B, E) PTEN−/−,Rheb+ (C, F), FASN1-2;Rheb+ (G, J) FASN1-2, PTEN−/− (H, K), and the FASN1-2, PTEN−/−;Rheb+ (I, L). Scale bars: 50 μm. (M) Relative size of clonal cells corresponding to the clones shown in (A–L) and in Supplementary Figure S5, A–D for FASN1-2 and PTEN-RNAi clones and in Figure 1A for control (Co).
Data availability
Fly stocks and reagents are available upon request. Supplementary materials include Supplementary Figures S1–S5, statistical analysis (methods and Supplementary Tables S1–S7) and supdata/script files.
Supplementary material is available at figshare DOI: https://doi.org/10.25386/genetics.13238312.
Results
TORC1 and Ilp signaling independency in the FB
To investigate the relationship between TORC1- and Ilp-dependent overgrowth in the FB, we generated somatic clones either over-expressing Rheb (Rheb+) (Stocker et al. 2003) or PTEN homozygous mutants (PTEN−/−) (Oldham et al. 2000). The precursors of FB cells divide in the embryo; during larval life, the differentiated cells do not divide but endoreplicate their DNA content to reach a giant size (Edgar and Orr-Weaver 2001). Therefore, to precisely evaluate the effect on cell growth, somatic recombinations were induced during embryogenesis at the stage of proliferation of the FB cell precursors and the resulting MARCM clones were analyzed in the FB of late feeding L3 larvae, prior to the wandering stage that precedes metamorphosis entry. In accordance with previous studies manipulating Ilp and TOR signaling in FB cells (Britton et al. 2002; Scott et al. 2004), both PTEN−/− and Rheb+ clonal cells were bigger than the surrounding control cells and this cell size effect was dramatically increased in PTEN−/−; Rheb+ combined clones (Figure 1, A–D and Supplementary Figure S2A). We next analyzed this growth increase in the context of previously reported Tor mutations, the TorΔP deletion (Zhang et al. 2006), and the Tor2L1 and Tor2L19 alleles that result in a kinase inactive and in a short truncated protein, respectively (Oldham et al. 2000). Given that we could not find mutant clones, which were likely eliminated by cell competition, we generated somatic clones in a Minute background to slow down the growth of the surrounding control cells. In these conditions, any of the Tor mutant cells exhibited a dramatic size reduction (Figure 1, G, J, and M, Supplementary Figure S2C) and this phenotype was dominant in Rheb+ combined clonal cells (Supplementary Figure S2C and compare Figure 1, E to H, K and N). In contrast, TorΔP and Tor2L19 but not Tor2L1 exhibited a clear dominant phenotype over the PTEN−/− mutation; the size of TorΔP, PTEN−/− and Tor2L19, PTEN−/− clonal cells was dramatically reduced (Supplementary Figure S2C and compare Figure 1, F to L and O), whereas Tor2L1, PTEN−/− clonal cells were bigger than the surrounding cells (Figure 1I) and tend to be relatively bigger than control clonal cells (Supplementary Figure S2, B and C). These findings indicate that the Tor2L1 mutation restrains TORC1- but not Ilp-dependent overgrowth, whereas TorΔP and Tor2L19 affects both.
Figure 1.
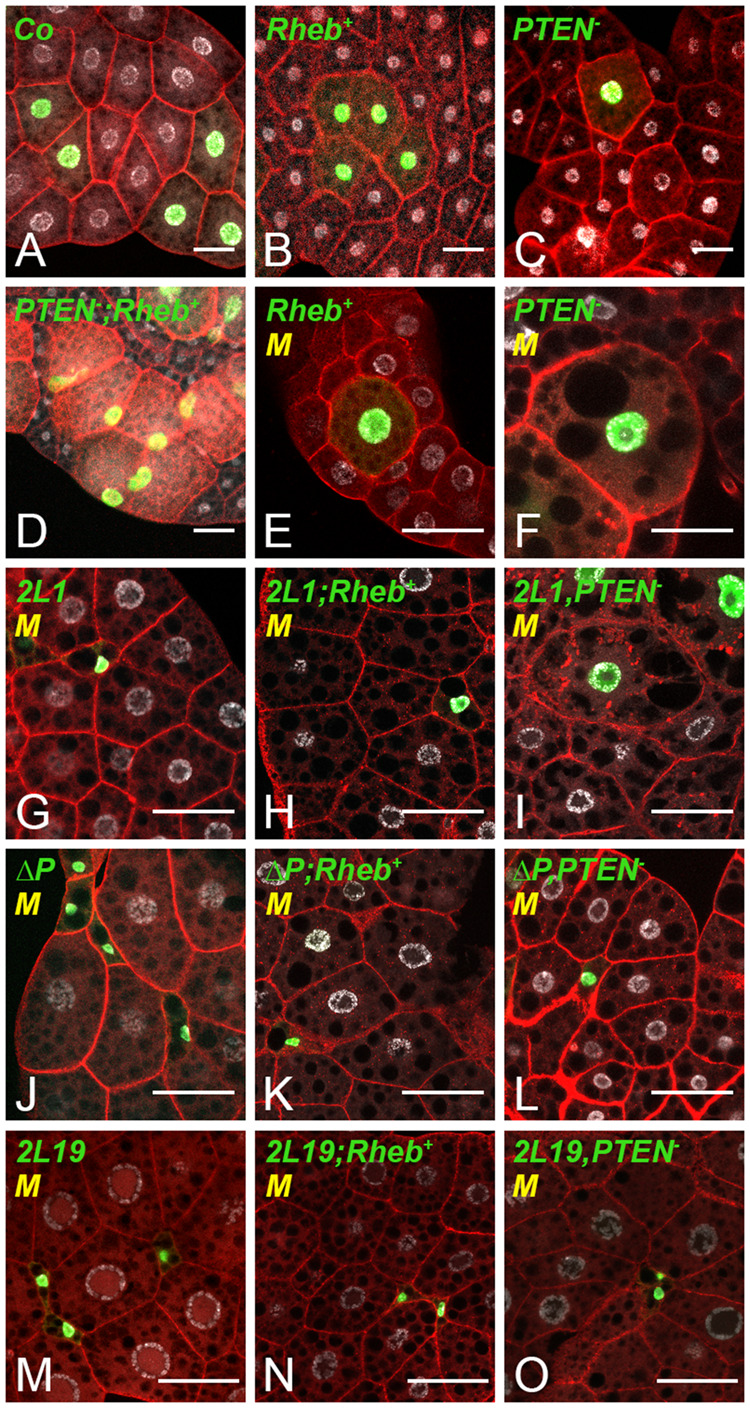
TORC1- and Ilp-dependent growth in FB cells. MARCM clones labeled by GFP (green) in the FB of L3 larvae. Nuclei were labeled with DAPI (silver) and membranes with phalloidin (red). Control (A), Rheb+ (B), PTEN−/− (C) and PTEN−/−;Rheb+ (D) clones were generated in a wild-type background. Rheb+ (E), PTEN−/− (F), Tor2L1 (G) Tor2L1, Rheb+ (H) Tor2L1, PTEN−/− (I), TorΔP (J), TorΔP, Rheb+ (K), TorΔP, PTEN−/− (L) Tor2L19 (M) Tor2L19, Rheb+ (N), and Tor2L19, PTEN−/− (O), clones were generated in a Minute (M) background. Scale bars: 50 μm.
Next, we used phospho-specific antibodies in immunostaining assays to analyze the phosphorylation of Akt (P-Akt) and of the dS6K target, ribosomal protein rpS6 (P-S6). The P-Akt intracellular signal was increased in PTEN−/− clones, absent in TorΔP and Tor2L19 clones, but not affected in Tor2L1 clones (Figure 2, A–D). Staining with the rpS6 phospho-specific antibody revealed a patchy signal, with only a subset of cells expressing the P-S6 signal in the FB (Figure 2, E–H), a pattern previously described in the wing imaginal disc (Romero-Pozuelo et al. 2017). Therefore, to evaluate TORC1 activity, we measured the ratio of P-S6 positive cells among the population of GFP+ clonal cells. About half of the control clones were P-S6 positive (Figure 2, E and M), whereas most of the Tor2L1, Tor2L19, and TorΔP clones were P-S6 negative (Figure 2, F–H and M). Importantly, almost all the Rheb+ clones were P-S6 positive (Figure 2, I and M), whereas the ratio of P-S6 positive cells was slightly but not significantly increased in the PTEN−/− clones (Figure 2, J and M). Taken together, these findings reveal that the Tor2L1 mutation affects only TORC1, whereas the TorΔP and Tor2L19 mutations affect both signaling branches and support the notion that Ilp- and TORC1-dependent overgrowth can be independently modulated in FB cells.
Figure 2.

TORC1 and Ilp signaling activity in FB cells. (A–J) MARCM clones labeled by GFP (green) in the FB of L3 larvae. Clones were generated in a wild type (A, E, I, J, K, L) or a Minute (B, C, D, F, G, H) background and nuclei were labeled with DAPI (silver). FB tissues with PTEN−/− (A), Tor2L1 (B), TorΔP (C), Tor2L19 (D), and FASN1-2 (K) clones were stained with a phospho-AKT antibody. FB tissues with control (E), Tor2L1 (F), TorΔP (G), Tor2L19 (H) Rheb+ (I), PTEN−/− (J), and FASN1-2 (L) clones were stained with a phospho-S6 antibody. Scale bars: 50 μm. (M) Percentage of P-S6 positive clones with respect to the total number of MARCM clones for control, FASN1-2, PTEN−/−, Rheb+, Tor2L1, TorΔP, and Tor2L19 genotypes.
Activating TORC1 or Ilp signaling impacts basal metabolism
To evaluate how TORC1 and Ilp affect basal metabolism in Drosophila, we analyzed various metabolites in whole animals that express the ubiquitous da-gal4 driver to direct Rheb overexpression (Rheb++) or PTEN knockdown (PTEN-RNAi). Larvae were fed either a standard or a 20%-SSD and 0–5 h prepupae were collected, as this is a convenient phase to stage the animals after the feeding period. When fed a standard diet, a high rate of lethality was observed for Rheb++ and PTEN-RNAi larvae, although a sufficient number of prepupae could be recovered. Given that none of the Rheb++ and PTEN-RNAi larvae fed a 20%-SSD reached the prepupal stage, larvae were first fed a standard diet and transferred onto a 20%-SSD at the L2/L3 molting transition. In this way, we could recover a few prepupae for metabolic measurements. For both males and females fed a standard diet, the bodyweight of Rheb++ and PTEN-RNAi prepupae was roughly similar to that of controls (Figure 3, A and B). Conversely, providing a 20%-SSD resulted in a drop of the prepupal weight of control animals that was significantly compensated in Rheb++ and PTEN-RNAi prepupae (Figure 3, A and B).
Figure 3.

Enhanced TORC1 or Ilp signaling affects larval metabolism. (A, B) Bodyweight of female (A) and male (B) prepupae formed from larvae fed either a standard (0%) or a 20%-SSD (20%) as from the L2/L3 transition. (C–F) Measurement of total protein (C), TAG (D), glycogen (E), and trehalose (F) levels in prepupae fed either a standard or a 20%-SSD. Prepupae used in these measurements were the F1 progeny from da-gal4;UAS-Dcr-2 females mated to either control (Co), EP(UAS)-Rheb (Rheb++), or UAS-PTEN-RNAi (PTEN-Ri) males.
Next, we measured the total amounts of protein, TAG, glycogen, and trehalose—the most abundant circulating sugar in Drosophila. Although protein levels did not vary in PTEN-RNAi and Rheb++ animals fed a standard diet, a mild but significant increase was observed in PTEN-RNAi animals fed a 20%-SSD (Figure 3C). TAG levels were strongly increased in animals fed a 20%-SSD (Figure 3D). When fed a standard diet, TAG levels did not vary in PTEN-RNAi and Rheb++ animals, whereas, when fed a 20%-SSD, they were strongly increased in PTEN-RNAi animals (Figure 3D). Feeding larvae a 20%-SSD resulted in a moderate increase in glycogen and trehalose levels in control prepupae (Figure 3, E and F). In Rheb++ and, in lower extent, in PTEN-RNAi prepupae, glycogen levels were significantly lower than those measured in controls (Figure 3E). Finally, trehalose levels were strongly decreased in both Rheb++ and PTEN-RNAi prepupae fed either a standard or a 20%-SSD as compared to control (Figure 3F). Taken together, these findings suggest that a ubiquitous increased activity of either TORC1 or Ilp signaling provokes an apparent increase in sugar consumption. This metabolic rate is correlated with a relative increase in bodyweight for larvae fed a 20%-SSD, but not for those fed a standard diet. We previously observed that increasing dietary sucrose induced a reduction in food intake (Garrido et al. 2015) that may account for the bodyweight reduction of control animals. Potentially, food intake could be less affected in Rheb++ and PTEN-RNAi animals, thereby leading to a compensatory effect on bodyweight. Measuring food intake in Rheb++ or PTEN-RNAi larvae was not applicable since most of them die during larval stage and thus, terminate feeding earlier. In sum, our data indicate that basal metabolism is altered in the few Rheb++ or PTEN-RNAi larvae that survive and further suggests that in most cases stronger metabolic disruption may happen, resulting in lethal homeostatic defects.
Knocking-down glycolysis at the whole body level
To determine whether the basal energy metabolism affected TORC1 and/or Ilp signaling, we ubiquitously expressed RNAis against phosphofructokinase1 (PFK1-RNAi), pyruvate kinase (PK-RNAi) pyruvate dehydrogenase (PDH-RNAi), and lactate dehydrogenase (LDH-RNAi). PFK1 catalyzes the third glycolytic reaction to form fructose 1,6-bisphophate; PK catalyzes the final glycolytic reaction to form pyruvate; PDH directs the mitochondrial fate of pyruvate, whereas LDH directs its anaerobic fate (Figure 4A). When directed with the ubiquitous da-gal4 driver, PK-RNAi provoked early larval lethality, PFK1-RNAi and PDH-RNAi provoked larval lethality at L2 or L3 stages, whereas LDH-RNAi induced a semi-lethal phenotype at larval or pupal stages (Figure 4B).
Figure 4.

Glycolysis knockdown in whole organisms. (A) Scheme of basal metabolism. Glucose and trehalose enter glycolysis as glucose-6P, whereas fructose follows a distinct pathway to triose-P. Enzymes investigated in the present study are marked in red. (B) Phenotype of ubiquitous RNAi-knockdown of PFK1, PK, LDH, and PDH. Flies were left to lay eggs overnight either at 29°C (column 0 h) or at 19°C and transferred to 29°C the day after (column 24 h); then development proceeded at 29°C (i.e. the temperature that inactivates Gal80). (C) Western blot analysis of total (top) or phosphorylated (mid) dS6K (left) or Akt (right) proteins; tubulin (bottom) was used as a loading control. Protein extracts were prepared with late L2 larvae either control (Co), or expressing RNAi against the indicated metabolic enzymes. (D) Survival at 29°C of male (top) and female (bottom) control flies or flies expressing RNAi against the indicated metabolic enzymes as from adult eclosion.
Next, we monitored the phosphorylation of the Drosophila S6Kinase (dS6K), Akt, and ERK. To circumvent the early lethality, the activity of the da-gal4 driver was blocked until early L1 stage using the thermo-sensitive Gal4 inhibitor, Gal80ts, then, RNAi expression was induced by a temperature shift at 29°C; protein extracts were prepared 2 days later using late L2 larvae. At this stage, the larvae were still viable, although those expressing PK-RNAi did not undergo L2/L3 transition and eventually died (Figure 4B). Western blotting revealed that RNAi-knockdown of PFK1 or LDH did not affect phosphorylation of dS6K, Akt, or ERK (Figure 4C, Supplementary Figure S3, A–F). In contrast, knockdown of PK or PDH decreased dS6K phosphorylation, whereas PK- but not PDH-knockdown mildly decreased Akt phosphorylation (Figure 4C, Supplementary Figure S3, A–D). Unexpectedly, knockdown of PK and LDH, and in lower extent knockdown of PFK and PDH, increased the amounts of total ERK protein with minor effects on its phosphorylation rate (Figure 4C, Supplementary Figure S3, E and F). These results indicate that ubiquitous knockdown of aerobic glycolysis specifically affects TORC1 signaling.
To evaluate the requirement of glycolysis for adult survival, RNAi-knockdown was induced by temperature shift to 29°C in newly emerged flies and lethality was counted every second day. In both males and females, PK and PFK1 knockdown provoked lethality between 10 and 14 days after temperature shift (Figure 4D). Knockdown of PDH and LDH also induced adult lethality, although not as soon as PK and PFK1 knockdown (Figure 4D). As a comparison, to evaluate the consequence of disrupting FA synthesis, we knocked-down FASN1 (Figure 4A) in adults; about a quarter of FASN1-RNAi flies died between 10 and 14 days, while the others survived nearly as well as control flies (FASN1i in Figure 4D). Taken together, these data indicate that glycolysis is essential for both larval development and adult survival.
Cell-autonomous requirement of glycolysis for Ilp- but not TORC1-dependent overgrowth
To investigate the requirement of glycolysis to sustain cell-autonomous overgrowth dependent on Ilp- and TORC1-signaling, PFK1-RNAi, PK-RNAi, PDH-RNAi and LDH-RNAi were induced in PTEN−/− or Rheb+ clones. Except a moderate effect of PK-RNAi, clones expressing RNAi against these metabolic enzymes did not significantly affect the growth of FB cells (Figure 5, A–D and M). In combined clones, none of the RNAi affected the growth of Rheb+ clones (Figure 5, E–H and M). In contrast, the size of PTEN−/− clones was significantly decreased when co-expressing RNAi against any of these metabolic enzymes (Figure 5, I–M). These findings indicate that both aerobic and anaerobic glycolysis are required to sustain cell-autonomous overgrowth dependent on Ilp signaling. In contrast, reducing glycolysis does not counteract cell-autonomous overgrowth dependent on TORC1 signaling.
Linking FA synthesis to TORC1 and Ilp signaling
Since glycolysis and FA synthesis are tightly connected metabolic pathways (Garrido et al. 2015), we investigated whether the deficiency of the latter affects Ilp or TORC1 signaling. The Drosophila genome encodes three FASN genes, FASN1 is ubiquitously expressed but not FASN2 or FASN3 (Parvy et al. 2012; Chung et al. 2014; Wicker-Thomas et al. 2015). The deletion of the FASN1 and FASN2 tandem (FASNΔ24-23 deletion, hereafter called FASN1-2) results in a lethal phenotype that can be rescued by feeding larvae a lipid-complemented diet (beySD) (Garrido et al. 2015; Wicker-Thomas et al. 2015). However, beySD-rescued FASN1-2 mutant larvae exhibited a developmental delay to enter metamorphosis (Figure 6A). Furthermore, when beySD-rescued FASN1-2 mutant larvae were transferred at the L2/L3 larval transition onto a 10% sucrose-supplemented-beySD, only a few of them completed the third larval stage and, after an extreme developmental delay, entered metamorphosis (Figure 6A). Delay in development can be due to a default in ecdysone production that results in giant pupae (Parvy et al. 2014) or to impaired TOR signaling that results in reduced body growth (Montagne et al. 1999; Oldham et al. 2000). Measurements of prepupal weight revealed that FASN1-2 mutant prepupae exhibited a severe reduction in bodyweight and body size, whether or not they were supplemented with sucrose (Figure 6B, Supplementary Figure S4), suggesting a defect in TOR signaling. Therefore, we analyzed the phosphorylation of the Drosophila S6Kinase (dS6K) and Akt in protein extracts of late feeding L3 larvae. Western blotting revealed that the dS6K protein resolved in several bands in FASN1-2 extracts, whereas Akt protein was unchanged (Figure 6C, Supplementary Figure S3, G and I). These results suggest that dS6K but not Akt might be degraded in the FASN1-2 mutant background. In addition, dS6K phosphorylation decreased in FASN1-2 extracts and became barely detectable when FASN1-2 larvae were fed a sucrose-supplemented-beySD (Figure 6C, Supplementary Figure S3H). Conversely, the phosphorylation of Akt was unaffected in larvae fed a beySD, although it was slightly decreased in larvae fed a sucrose-supplemented-beySD (Figure 6C, Supplementary Figure S3J). This finding contrasts with our previous observation showing that FB explants of FASN1-2 mutant larvae were hypersensitive to insulin (Garrido et al. 2015). However, FASN1-2 mutants also exhibited a decrease in food intake (Garrido et al. 2015), which might induce a systemic suppression of dS6K phosphorylation, while FB explant was cultured in nutrient media supplemented with insulin. Therefore, to determine whether FASN mutation affects TOR signaling at the cell-autonomous level, we analyzed P-S6 and P-Akt in FASN1-2 mutant clones in the FB. As for control clones, about half of the FASN1-2 clonal cells were P-S6 positive (Figure 2, L and M). Furthermore, no effect on P-Akt was observed in FASN1-2 clonal cells (Figure 2K). In summary, these findings reveal that disrupting FA synthesis does not significantly affect TORC1 and Ilp signaling at the cell-autonomous level, although it seems to impinge on TORC1 signaling when inhibited in the whole animal whether directly or indirectly.
Figure 6.

FASN1-2 mutation affects developmental growth and TORC1 signaling. (A) Developmental duration from egg laying to metamorphosis onset of w1118 control (Co) and FASN1-2 (FASN) larvae fed either a beySD (0%) or a 10% sucrose-supplemented-beySD as from the L2/L3 transition (10%); n: total number of larvae collected for each condition. Each condition and genotype significantly differ from each other, either by final frequency or dynamic of pupariation (Supplementary Table S6). (B) Prepupal weight of females (left) and males (right) as listed in 6A; the numbers of weighted prepupae are indicated above each sample. (C) Western blot analysis of (from top to bottom) total dS6K, phosphorylated dS6K, total Akt, phosphorylated Akt and total tubulin as a loading control. Protein extracts were prepared from feeding L3 larvae prior to the wandering stage as listed in 6A. For each condition, at least 30 larvae were used to prepare protein extracts.
Cell-autonomous requirement of FA synthesis for Ilp- but not TORC1-dependent overgrowth
To determine, whether FA synthesis is required at the cell-autonomous level to sustain TORC1- and/or Ilp-dependent growth, we analyzed FASN1-2 clones while enhancing either TORC1 or Ilp signaling in FB cells. We previously reported (Garrido et al. 2015) that FASN1-2 clonal cells in the FB were slightly reduced in size and that this effect was dramatically increased in larvae fed a 20%-SSD (Supplementary Figure S5, A and B, Figure 7M). Therefore, we generated PTEN−/− and Rheb+ clones combined or not with the FASN1-2 mutation and analyzed them in the FB of larvae fed either a standard diet or a 20%-SSD. As compared to the standard diet, feeding larvae a 20%-SSD had no effect on the size of Rheb+ clonal cells, but significantly reduced the size of PTEN−/− and of PTEN−/−;Rheb+ clonal cells (Figure 7, A–F and M). Furthermore, when combined with the FASN1-2 mutation, PTEN−/− but not Rheb+ clones were significantly reduced in size (Figure 7, G, H and M). The FASN1-2 mutation also provoked a severe size reduction of PTEN−/−,Rheb+ clones (Figure 7, I and M). Moreover, as compared to the standard diet, feeding larvae a 20%-SSD induced a significant size reduction of FASN1-2;Rheb+, FASN1-2,PTEN−/− and FASN1-2,PTEN−/−;Rheb+ clonal cells (Figure 7, J–L and M). Of note, except for the FASN1-2;Rheb+ clonal cells in larvae fed a 20%-SSD that exhibited a size roughly identical to that of the surrounding control cells (Figure 7J), the cell size was always bigger than the controls (Figure 7M). These findings indicate that, in larvae fed a standard diet, FA synthesis is at least in part required to sustain over-growth induced by Ilp, but not TORC1. Nonetheless, the metabolic dependency of Ilp-induced overgrowth might be a consequence of the stronger phenotype of PTEN−/− clones, which could be more sensitive to metabolic restriction than the one of Rheb+ clones. To challenge such an unspecific effect, we made use of PTEN-RNAi that diminish but do not abolish its expression. In this setting, the size of PTEN-RNAi clonal cells was significantly higher than the one of control clones, but not as much as the one of Rheb+ clonal cells (Figure 7M, Supplementary Figure S5C). Importantly, the size of PTEN-RNAi clonal cells was significantly diminished when combine to the FASN deficiency (Figure 7M, Supplementary Figure S5D), which excludes a strength-phenotype-dependent effect. In conclusion, overgrown cells generated by Ilp over-activation have limited homeostatic abilities to adjust to metabolic restriction, whereas TORC1 activated cells at least in part maintain these abilities.
Discussion
In this study, we have investigated the functional links between the glycolysis/FA synthesis axis and TORC1- or Ilp-dependent growth in Drosophila. Consistent with previous studies (Radimerski et al. 2002a, 2002b; Dong and Pan 2004; Montagne et al. 2010; Pallares-Cartes et al. 2012), we show that TORC1- and Ilp-dependent overgrowth can be independently modulated in the Drosophila FB. TORC1, once recruited at the lysosomal membrane, is activated by Rheb to phosphorylate downstream targets (Montagne 2016). TORC2, which comprises rictor, resides in the Ilp signaling cascade to phosphorylate the S505 residue in the hydrophobic motif (HM) of Akt. However, a study on a Drosophila rictor mutant reported that S505 phosphorylation by TORC2 was not required to sustain Akt-dependent growth and proposed that TORC2 plays as a rheostat for this process (Hietakangas and Cohen 2007). Here, we provide evidence that the previously described Tor2L1 mutation, which likely results in a kinase-inactive protein (Oldham et al. 2000), affects TORC1 but not Ilp-dependent overgrowth, whereas both overgrowth processes are suppressed by the TorΔP or Tor2L19 mutations that likely represent null mutants. Surprisingly, we observe that the S505 residue in the Akt HM is still phosphorylated in Tor2L1, but not TorΔP and Tor2L19 mutant clones. Taken together, these findings reveal that the TOR protein, but not its kinase activity, is required for Akt HM phosphorylation and for Ilp-dependent overgrowth through a molecular mechanism that remains to be elucidated.
Intriguingly, our study reveals apparent contradictory effects between perturbations at the whole body and cell-autonomous levels. At the organismal level, knockdowns of glycolytic enzymes to mimic drug treatment with a systemic inhibitor result in animal death. Knockdown of PDH suppresses dS6K but not Akt phosphorylation suggesting that aerobic glycolysis is crucial for TORC1 signaling. These observations contrast with mammalian studies showing that mTORC1 stimulation promotes anaerobic glycolysis (Duvel et al. 2010), whereas Akt activation promotes aerobic glycolysis (Gottlob et al. 2001). Furthermore, at the cell-autonomous level, repression of either aerobic or anaerobic glycolysis partly restrains Ilp- but not TORC1-dependent overgrowth of FB cells. Taken together, these findings confirm the existence of tight connections between TOR signaling and basal metabolism, although the cell-autonomous effects suggest that this connection integrates interactions operating between neighboring cells or organs. In addition, the growth defect of beySD-rescued FASN null mutants might result from the decrease in TORC1 activity, suggesting that TORC1 but not Ilp signaling relies on FA synthesis. However, at the cell-autonomous level, the deficiency of FASN restrains Ilp- but not TORC1-dependent overgrowth in FB cells. These apparent contradictory findings suggest that the growth defect and the reduction of TORC1 activity in FASN mutants are not due to the addition of cell-autonomous effects but potentially to a systemic regulation, as for instance, Ilp secretion by neurosecretory cells (Rulifson et al. 2002). Alternatively, considering that TORC1 directly responds to nutrients (Oldham et al. 2000), the drop of TORC1 activity may be a consequence of feeding, consistent with the decrease in food uptake previously reported in FASN1-2 mutants (Garrido et al. 2015). Congruently, a study on the transcription factor Mondo, which stimulates glycolysis and FA synthesis in response to dietary sugar (Mattila et al. 2015; Richards et al. 2017), suggests the existence of a FASN-dependent control of food intake (Sassu et al. 2012). Finally, the drop of TORC1 activity observed in FASN1-2 mutants may be a consequence of malonyl-CoA accumulation, since mTOR malonylation has been reported to inhibit mTORC1- but not Ilp/mTORC2-dependent activity (Bruning et al. 2018). Whether TOR malonylation and the subsequent decrease in TORC1 activity may also occur in Drosophila should be investigated in the future.
Our study reveals that over-activation of mTORC1 and of Ilp signaling, results in a decrease in glycogen stores and in circulating trehalose, suggesting that activation of either signaling branch enhances glucose consumption to sustain cell growth. However, the activation of neither mTORC1 nor Ilp signaling induces an increase in bodyweight. Ubiquitous activation of TORC1 or Ilp signaling is likely to promote the growth of most cells, but might concurrently perturb endocrine signals dampening overall growth. For instance, previous studies reported that activation of Ilp signaling within the ecdysone-secreting gland, results in a systemic decrease in body growth (Caldwell et al. 2005; Colombani et al. 2005; Mirth 2005). Of note, we observed that larvae fed a 20%-SSD result in pupae with reduced bodyweight, an effect that is partially suppressed when either TORC1 or Ilp signaling is over-activated. The fact that the overall bodyweight of these animals is maintained within a range likely compatible with organismal survival contrasts with the observed high rate of lethality. The decrease in glycogen and trehalose suggests that in these animals, each cell tends to increase its basal metabolism evoking an egoist behavior that might perturb the equilibrium between cell-autonomous and systemic regulation. Thus, in a stressful situation, as when animals are fed a 20%-SSD, the need of a tight adjustment to an unbalanced diet might enhance the distortion between cell-autonomous effects and systemic regulation, resulting in animal death.
A plethora of studies in mammalian cells indicate that mTOR activation directs metabolism toward glucose consumption, storage, and anabolism (Gottlob et al. 2001; Inoki et al. 2003b; Hahn-Windgassen et al. 2005; Duvel et al. 2010; Peterson et al. 2011; Houddane et al. 2017; Jaldin-Fincati et al. 2017; Wipperman et al. 2019). Our study suggests that in the Drosophila larvae, TOR promotes glucose consumption, but an increase in TAG levels is observed only for larvae fed a 20%-SSD when Ilp signaling is ubiquitously over-activated. However, at the cell-autonomous level, we observe that inhibition of glycolysis or FA synthesis restrains neither larval FB cell growth nor overgrowth induced by TORC1 stimulation in these cells. These findings counteract the idea that mTORC1 potentiates a glycolysis/FA synthesis axis (Duvel et al. 2010) to sustain cell growth. To overcome the lack of glycolytic products and of membrane lipids, these cells may benefit of a transfer from neighboring cells and/or might favor alternative metabolic pathways, including glutamine catabolism to feed TCA anaplerosis, which has been shown to be a crucial pathway in mTORC1-stimulated mammalian cells (Choo et al. 2010; Csibi et al. 2013, 2014). Nonetheless, such compensatory processes do not fully operate to sustain Ilp-dependent overgrowth, potentially because these cells might be more sensitive to homeostasis perturbations or because the modulation of Ilp signaling would be required for these compensatory processes.
As a coordinator of growth and metabolism, mTOR plays a central role in tumor development (Dowling et al. 2010; Harachi et al. 2018; Mossmann et al. 2018; Tian et al. 2019). PTEN, the tumor suppressor that counteracts PI3K activity downstream of the Ilp receptor, is deficient in several human cancers (Cully et al. 2006). Mutation of TSC1 or TSC2, which results in mTORC1 hyperactivation, is associated with benign tumors but also with brain, kidney, and lung destructive diseases (Henske et al. 2016). To investigate the role of mTOR regarding tumor development, a recent study reported the generation of liver-specific double knockout mice for TSC1 and PTEN (Guri et al. 2017). These mice develop hepatic steatosis that eventually progresses to hepatocellular carcinoma. Both processes are suppressed in mice fed the mTORC1/2 inhibitors INK128, but not the mTORC1 inhibitor rapamycin, supporting an Ilp/mTORC2 specific effect. The combination of inhibitors against mTOR and metabolism is currently under clinical investigation to fight cancers (Mossmann et al. 2018). Importantly, our study reveals that ubiquitous inhibition of basal metabolism produces dramatic effects during development, while at the cell-autonomous level, it only moderates growth induced by over-activation of Ilp/TORC2 signaling. Therefore, the use of drug therapy to fight cancer must be taken with caution, in particular if organismal development is not complete and most efforts should be made to selectively target sick tissues.
Acknowledgments
We wish to thank D. Petit for preparing the fly media, H. Stocker for fly stocks, A. Teleman for the phospho-S6 antibody, M. Gettings for editing the manuscript, and the NIG and VDRC stock centers for RNAi fly strains.
J.M. designed the experiments; M.D., D.G., M.P., T.R., and J.M. performed the experiments; M.D., D.G., A.L.R., and J.M. analyzed the results; and J.M. wrote the manuscript.
Funding
We wish to thank the French government for fellowship to M.D. (MENRT 2015-155) and D.G. (MRT 2011-78), the Fondation pour la Recherche Médicale for fellowship to D.G. (FDT201 4093 0800), the Fondation ARC for grant support to J.M. (projet ARC 1555286), and the Ligue de Recherche contre le Cancer for grant support to J.M. (M27218).
Conflicts of interest
The authors declare no conflict of interest.
Literature cited
- Antikainen H, Driscoll M, Haspel G, Dobrowolski R. 2017. TOR-mediated regulation of metabolism in aging. Aging Cell. 16:1219–1233. [DOI] [PMC free article] [PubMed] [Google Scholar]
- Bohni R, Riesgo-Escovar J, Oldham S, Brogiolo W, Stocker H, et al. 1999. Autonomous control of cell and organ size by CHICO, a Drosophila homolog of vertebrate IRS1-4. Cell. 97:865–875. [DOI] [PubMed] [Google Scholar]
- Britton JS, Lockwood WK, Li L, Cohen SM, Edgar BA. 2002. Drosophila's insulin/PI3-kinase pathway coordinates cellular metabolism with nutritional conditions. Dev Cell. 2:239–249. [DOI] [PubMed] [Google Scholar]
- Bruning U, Morales-Rodriguez F, Kalucka J, Goveia J, Taverna F, et al. 2018. Impairment of angiogenesis by fatty acid synthase inhibition involves mTOR malonylation. Cell Metab. 28:866–880.e15. [DOI] [PMC free article] [PubMed] [Google Scholar]
- Caldwell PE, Walkiewicz M, Stern M. 2005. Ras activity in the Drosophila prothoracic gland regulates body size and developmental rate via ecdysone release. Curr Biol. 15:1785–1795. [DOI] [PubMed] [Google Scholar]
- Caron A, Richard D, Laplante M. 2015. The roles of mTOR complexes in lipid metabolism. Annu Rev Nutr. 35:321–348. [DOI] [PubMed] [Google Scholar]
- Choo AY, Kim SG, Vander Heiden MG, Mahoney SJ, Vu H, et al. 2010. Glucose addiction of TSC null cells is caused by failed mTORC1-dependent balancing of metabolic demand with supply. Mol Cell. 38:487–499. [DOI] [PMC free article] [PubMed] [Google Scholar]
- Chung H, Loehlin DW, Dufour HD, Vaccarro K, Millar JG, et al. 2014. A single gene affects both ecological divergence and mate choice in Drosophila. Science. 343:1148–1151. [DOI] [PubMed] [Google Scholar]
- Colombani J, Bianchini L, Layalle S, Pondeville E, Dauphin-Villemant C, et al. 2005. Antagonistic actions of ecdysone and insulins determine final size in Drosophila. Science. 310:667–670. [DOI] [PubMed] [Google Scholar]
- Csibi A, Fendt SM, Li C, Poulogiannis G, Choo AY, et al. 2013. The mTORC1 pathway stimulates glutamine metabolism and cell proliferation by repressing SIRT4. Cell. 153:840–854. [DOI] [PMC free article] [PubMed] [Google Scholar]
- Csibi A, Lee G, Yoon SO, Tong H, Ilter D, et al. 2014. The mTORC1/S6K1 pathway regulates glutamine metabolism through the eIF4B-dependent control of c-Myc translation. Curr Biol. 24:2274–2280. [DOI] [PMC free article] [PubMed] [Google Scholar] [Retracted]
- Cully M, You H, Levine AJ, Mak TW. 2006. Beyond PTEN mutations: the PI3K pathway as an integrator of multiple inputs during tumorigenesis. Nat Rev Cancer. 6:184–192. [DOI] [PubMed] [Google Scholar]
- Dibble CC, Elis W, Menon S, Qin W, Klekota J, et al. 2012. TBC1D7 is a third subunit of the TSC1-TSC2 complex upstream of mTORC1. Mol Cell. 47:535–546. [DOI] [PMC free article] [PubMed] [Google Scholar]
- Dibble CC, Manning BD. 2013. Signal integration by mTORC1 coordinates nutrient input with biosynthetic output. Nat Cell Biol. 15:555–564. [DOI] [PMC free article] [PubMed] [Google Scholar]
- Dietzl G, Chen D, Schnorrer F, Su KC, Barinova Y, et al. 2007. A genome-wide transgenic RNAi library for conditional gene inactivation in Drosophila. Nature. 448:151–156. [DOI] [PubMed] [Google Scholar]
- Dong J, Pan D. 2004. Tsc2 is not a critical target of Akt during normal Drosophila development. Genes Dev. 18:2479–2484. [DOI] [PMC free article] [PubMed] [Google Scholar]
- Dowling RJ, Topisirovic I, Fonseca BD, Sonenberg N. 2010. Dissecting the role of mTOR: lessons from mTOR inhibitors. Biochim Biophys Acta. 1804:433–439. [DOI] [PubMed] [Google Scholar]
- Duvel K, Yecies JL, Menon S, Raman P, Lipovsky AI, et al. 2010. Activation of a metabolic gene regulatory network downstream of mTOR complex 1. Mol Cell. 39:171–183. [DOI] [PMC free article] [PubMed] [Google Scholar]
- Edgar BA, Orr-Weaver TL. 2001. Endoreplication cell cycles: more for less. Cell. 105:297–306. [DOI] [PubMed] [Google Scholar]
- Engelman JA, Luo J, Cantley LC. 2006. The evolution of phosphatidylinositol 3-kinases as regulators of growth and metabolism. Nat Rev Genet. 7:606–619. [DOI] [PubMed] [Google Scholar]
- Garami A, Zwartkruis FJ, Nobukuni T, Joaquin M, Roccio M, et al. 2003. Insulin activation of Rheb, a mediator of mTOR/S6K/4E-BP signaling, is inhibited by TSC1 and 2. Mol Cell. 11:1457–1466. [DOI] [PubMed] [Google Scholar]
- Garrido D, Rubin T, Poidevin M, Maroni B, Rouzic AL, et al. 2015. Fatty acid synthase cooperates with glyoxalase 1 to protect against sugar toxicity. PLoS Genet. 11:e1004995. [DOI] [PMC free article] [PubMed] [Google Scholar]
- Goberdhan DC, Ogmundsdottir MH, Kazi S, Reynolds B, Visvalingam SM, et al. 2009. Amino acid sensing and mTOR regulation: inside or out? Biochem Soc Trans. 37:248–252. [DOI] [PMC free article] [PubMed] [Google Scholar]
- Gottlob K, Majewski N, Kennedy S, Kandel E, Robey RB, et al. 2001. Inhibition of early apoptotic events by Akt/PKB is dependent on the first committed step of glycolysis and mitochondrial hexokinase. Genes Dev. 15:1406–1418. [DOI] [PMC free article] [PubMed] [Google Scholar]
- Groenewoud MJ, Zwartkruis FJ. 2013. Rheb and mammalian target of rapamycin in mitochondrial homeostasis. Open Biol. 3:130185. [DOI] [PMC free article] [PubMed] [Google Scholar]
- Guri Y, Colombi M, Dazert E, Hindupur SK, Roszik J, et al. 2017. mTORC2 promotes tumorigenesis via lipid synthesis. Cancer Cell. 32:807–823.e12. [DOI] [PubMed] [Google Scholar]
- Haeusler RA, McGraw TE, Accili D. 2018. Biochemical and cellular properties of insulin receptor signalling. Nat Rev Mol Cell Biol. 19:31–44. [DOI] [PMC free article] [PubMed] [Google Scholar]
- Hagiwara A, Cornu M, Cybulski N, Polak P, Betz C, et al. 2012. Hepatic mTORC2 activates glycolysis and lipogenesis through Akt, glucokinase, and SREBP1c. Cell Metab. 15:725–738. [DOI] [PubMed] [Google Scholar]
- Hahn-Windgassen A, Nogueira V, Chen CC, Skeen JE, Sonenberg N, et al. 2005. Akt activates the mammalian target of rapamycin by regulating cellular ATP level and AMPK activity. J Biol Chem. 280:32081–32089. [DOI] [PubMed] [Google Scholar]
- Harachi M Masui K Okamura Y Tsukui R Mischel P, et al. 2018. mTOR Complexes as a Nutrient Sensor for Driving Cancer Progression. IJMS. 19: DOI: .10.3390/ijms19103267. [DOI] [PMC free article] [PubMed] [Google Scholar]
- Hay N, Sonenberg N. 2004. Upstream and downstream of mTOR. Genes Dev. 18:1926–1945. [DOI] [PubMed] [Google Scholar]
- Henske EP, Jóźwiak S, Kingswood JC, Sampson JR, Thiele EA. 2016. Tuberous sclerosis complex. Nat Rev Dis Primers. 2:16035. [DOI] [PubMed] [Google Scholar]
- Hietakangas V, Cohen SM. 2007. Re-evaluating AKT regulation: role of TOR complex 2 in tissue growth. Genes Dev. 21:632–637. [DOI] [PMC free article] [PubMed] [Google Scholar]
- Houddane A, Bultot L, Novellasdemunt L, Johanns M, Gueuning M-A, et al. 2017. Role of Akt/PKB and PFKFB isoenzymes in the control of glycolysis, cell proliferation and protein synthesis in mitogen-stimulated thymocytes. Cell Signal. 34:23–37. [DOI] [PubMed] [Google Scholar]
- Howell JJ, Ricoult SJ, Ben-Sahra I, Manning BD. 2013. A growing role for mTOR in promoting anabolic metabolism. Biochem Soc Trans. 41:906–912. [DOI] [PubMed] [Google Scholar]
- Inoki K, Li Y, Xu T, Guan KL. 2003a. Rheb GTPase is a direct target of TSC2 GAP activity and regulates mTOR signaling. Genes Dev. 17:1829–1834. [DOI] [PMC free article] [PubMed] [Google Scholar]
- Inoki K, Zhu T, Guan KL. 2003b. TSC2 mediates cellular energy response to control cell growth and survival. Cell. 115:577–590. [DOI] [PubMed] [Google Scholar]
- Jaldin-Fincati JR, Pavarotti M, Frendo-Cumbo S, Bilan PJ, Klip A. 2017. Update on GLUT4 vesicle traffic: a cornerstone of insulin action. Trends Endocrinol Metab. 28:597–611. [DOI] [PubMed] [Google Scholar]
- Kim DH, Sarbassov DD, Ali SM, King JE, Latek RR, et al. 2002. mTOR interacts with raptor to form a nutrient-sensitive complex that signals to the cell growth machinery. Cell. 110:163–175. [DOI] [PubMed] [Google Scholar]
- Lamming DW, Sabatini DM. 2013. A central role for mTOR in lipid homeostasis. Cell Metab. 18:465–469. [DOI] [PMC free article] [PubMed] [Google Scholar]
- Laplante M, Sabatini DM. 2012. mTOR signaling in growth control and disease. Cell. 149:274–293. [DOI] [PMC free article] [PubMed] [Google Scholar]
- Lee T, Luo L. 2001. Mosaic analysis with a repressible cell marker (MARCM) for Drosophila neural development. Trends Neurosci. 24:251–254. [DOI] [PubMed] [Google Scholar]
- Lehmann M. 2018. Endocrine and physiological regulation of neutral fat storage in Drosophila. Mol Cell Endocrinol. 461:165–177. [DOI] [PMC free article] [PubMed] [Google Scholar]
- Lien EC, Dibble CC, Toker A. 2017. PI3K signaling in cancer: beyond AKT. Curr Opin Cell Biol. 45:62–71. [DOI] [PMC free article] [PubMed] [Google Scholar]
- Ma XM, Blenis J. 2009. Molecular mechanisms of mTOR-mediated translational control. Nat Rev Mol Cell Biol. 10:307–318. [DOI] [PubMed] [Google Scholar]
- Magnuson B, Ekim B, Fingar DC. 2012. Regulation and function of ribosomal protein S6 kinase (S6K) within mTOR signalling networks. Biochem J. 441:1–21. [DOI] [PubMed] [Google Scholar]
- Majewski N, Nogueira V, Bhaskar P, Coy PE, Skeen JE, et al. 2004. Hexokinase-mitochondria interaction mediated by Akt is required to inhibit apoptosis in the presence or absence of Bax and Bak. Mol Cell. 16:819–830. [DOI] [PubMed] [Google Scholar]
- Mattila J, Havula E, Suominen E, Teesalu M, Surakka I, et al. 2015. Mondo-Mlx mediates organismal sugar sensing through the gli-similar transcription factor sugarbabe. Cell Rep. 13:350–364. [DOI] [PubMed] [Google Scholar]
- McManus EJ, Sakamoto K, Armit LJ, Ronaldson L, Shpiro N, et al. 2005. Role that phosphorylation of GSK3 plays in insulin and Wnt signalling defined by knockin analysis. EMBO J. 24:1571–1583. [DOI] [PMC free article] [PubMed] [Google Scholar]
- Mirth C. 2005. Ecdysteroid control of metamorphosis in the differentiating adult leg structures of Drosophila melanogaster. Dev Biol. 278:163–174. [DOI] [PubMed] [Google Scholar]
- Montagne J. 2016. A wacky bridge to mTORC1 dimerization. Dev Cell. 36:129–130. [DOI] [PubMed] [Google Scholar]
- Montagne J, Lecerf C, Parvy JP, Bennion JM, Radimerski T, et al. 2010. The nuclear receptor DHR3 modulates dS6 kinase-dependent growth in Drosophila. PLoS Genet. 6:e1000937. [DOI] [PMC free article] [PubMed] [Google Scholar]
- Montagne J, Radimerski T, Thomas G. 2001. Insulin signaling: lessons from the Drosophila tuberous sclerosis complex, a tumor suppressor. Sci STKE. 2001:pe36. [DOI] [PubMed] [Google Scholar]
- Montagne J, Stewart MJ, Stocker H, Hafen E, Kozma SC, et al. 1999. Drosophila S6 kinase: a regulator of cell size. Science. 285:2126–2129. [DOI] [PubMed] [Google Scholar]
- Montagne J, Thomas G. 2004. S6K integrates nutrient and mitogen signals to control cell growth. In: Cold Spring Harbor Monograph Series, Hall M, Raff M, Thomas G editors. Cell Growth: Control of Cell Size. Cold Spring Harbor Press. p. 265–298. [Google Scholar]
- Mossmann D, Park S, Hall MN. 2018. mTOR signalling and cellular metabolism are mutual determinants in cancer. Nat Rev Cancer. 18:744–757. [DOI] [PubMed] [Google Scholar]
- Nakae J, Kitamura T, Silver DL, Accili D. 2001. The forkhead transcription factor Foxo1 (Fkhr) confers insulin sensitivity onto glucose-6-phosphatase expression. J Clin Invest. 108:1359–1367. [DOI] [PMC free article] [PubMed] [Google Scholar]
- Oldham S, Montagne J, Radimerski T, Thomas G, Hafen E. 2000. Genetic and biochemical characterization of dTOR, the Drosophila homolog of the target of rapamycin. Genes Dev. 14:2689–2694. [DOI] [PMC free article] [PubMed] [Google Scholar]
- Padmanabha D, Baker KD. 2014. Drosophila gains traction as a repurposed tool to investigate metabolism. Trends Endocrinol Metab. 25:518–527. [DOI] [PubMed] [Google Scholar]
- Pallares-Cartes C, Cakan-Akdogan G, Teleman AA. 2012. Tissue-specific coupling between insulin/IGF and TORC1 signaling via PRAS40 in Drosophila. Dev Cell. 22:172–182. [DOI] [PubMed] [Google Scholar]
- Parvy JP, Napal L, Rubin T, Poidevin M, Perrin L, et al. 2012. Drosophila melanogaster Acetyl-CoA-carboxylase sustains a fatty acid-dependent remote signal to waterproof the respiratory system. PLoS Genet. 8:e1002925. [DOI] [PMC free article] [PubMed] [Google Scholar]
- Parvy JP, Wang P, Garrido D, Maria A, Blais C, et al. 2014. Forward and feedback regulation of cyclic steroid production in Drosophila melanogaster. Development. 141:3955–3965. [DOI] [PubMed] [Google Scholar]
- Peterson TR, Sengupta SS, Harris TE, Carmack AE, Kang SA, et al. 2011. mTOR complex 1 regulates lipin 1 localization to control the SREBP pathway. Cell. 146:408–420. [DOI] [PMC free article] [PubMed] [Google Scholar]
- Polak P, Cybulski N, Feige JN, Auwerx J, Ruegg MA, et al. 2008. Adipose-specific knockout of raptor results in lean mice with enhanced mitochondrial respiration. Cell Metab. 8:399–410. [DOI] [PubMed] [Google Scholar]
- Radimerski T, Montagne J, Hemmings-Mieszczak M, Thomas G. 2002a. Lethality of Drosophila lacking TSC tumor suppressor function rescued by reducing dS6K signaling. Genes Dev. 16:2627–2632. [DOI] [PMC free article] [PubMed] [Google Scholar]
- Radimerski T, Montagne J, Rintelen F, Stocker H, van der Kaay J, et al. 2002b. dS6K-regulated cell growth is dPKB/dPI(3)K-independent, but requires dPDK1. Nat Cell Biol. 4:251–255. [DOI] [PubMed] [Google Scholar]
- Richards P, Ourabah S, Montagne J, Burnol AF, Postic C, et al. 2017. MondoA/ChREBP: the usual suspects of transcriptional glucose sensing; Implication in pathophysiology. Metabolism. 70:133–151. [DOI] [PubMed] [Google Scholar]
- Robey RB, Hay N. 2009. Is Akt the “Warburg kinase”?-Akt-energy metabolism interactions and oncogenesis. Semin Cancer Biol. 19:25–31. [DOI] [PMC free article] [PubMed] [Google Scholar]
- Romero-Pozuelo J, Demetriades C, Schroeder P, Teleman AA. 2017. CycD/Cdk4 and discontinuities in Dpp signaling activate TORC1 in the Drosophila wing disc. Dev Cell. 42:376–387.e5. [DOI] [PubMed] [Google Scholar]
- Rulifson EJ, Kim SK, Nusse R. 2002. Ablation of insulin-producing neurons in flies: growth and diabetic phenotypes. Science. 296:1118–1120. [DOI] [PubMed] [Google Scholar]
- Sarbassov DD, Guertin DA, Ali SM, Sabatini DM. 2005. Phosphorylation and regulation of Akt/PKB by the rictor-mTOR complex. Science. 307:1098–1101. [DOI] [PubMed] [Google Scholar]
- Sassu ED, McDermott JE, Keys BJ, Esmaeili M, Keene AC, et al. 2012. Mio/dChREBP coordinately increases fat mass by regulating lipid synthesis and feeding behavior in Drosophila. Biochem Biophys Res Commun. 426:43–48. [DOI] [PMC free article] [PubMed] [Google Scholar]
- Saxton RA, Sabatini DM. 2017. mTOR signaling in growth, metabolism, and disease. Cell. 168:960–976. [DOI] [PMC free article] [PubMed] [Google Scholar]
- Scott RC, Schuldiner O, Neufeld TP. 2004. Role and regulation of starvation-induced autophagy in the Drosophila fat body. Dev Cell. 7:167–178. [DOI] [PubMed] [Google Scholar]
- Shimobayashi M, Hall MN. 2014. Making new contacts: the mTOR network in metabolism and signalling crosstalk. Nat Rev Mol Cell Biol. 15:155–162. [DOI] [PubMed] [Google Scholar]
- Stocker H, Radimerski T, Schindelholz B, Wittwer F, Belawat P, et al. 2003. Rheb is an essential regulator of S6K in controlling cell growth in Drosophila. Nat Cell Biol. 5:559–565. [DOI] [PubMed] [Google Scholar]
- Tian T, Li X, Zhang J. 2019. mTOR signaling in cancer and mTOR inhibitors in solid tumor targeting therapy. Int J Mol Sci. 20: [DOI] [PMC free article] [PubMed] [Google Scholar]
- Ugur B, Chen K, Bellen HJ. 2016. Drosophila tools and assays for the study of human diseases. Dis Model Mech. 9:235–244. [DOI] [PMC free article] [PubMed] [Google Scholar]
- Wangler MF, Hu Y, Shulman JM. 2017. Drosophila and genome-wide association studies: a review and resource for the functional dissection of human complex traits. Dis Model Mech. 10:77–88. [DOI] [PMC free article] [PubMed] [Google Scholar]
- Wicker-Thomas C, Garrido D, Bontonou G, Napal L, Mazuras N, et al. 2015. Flexible origin of hydrocarbon/pheromone precursors in Drosophila melanogaster. J Lipid Res. 56:2094–2101. [DOI] [PMC free article] [PubMed] [Google Scholar]
- Wipperman MF, Montrose DC, Gotto AM Jr, Hajjar DP. 2019. Mammalian target of rapamycin: a metabolic rheostat for regulating adipose tissue function and cardiovascular health. Am J Pathol. 189:492–501. [DOI] [PMC free article] [PubMed] [Google Scholar]
- Yang H, Jiang X, Li B, Yang HJ, Miller M, et al. 2017. Mechanisms of mTORC1 activation by RHEB and inhibition by PRAS40. Nature. 552:368–373. [DOI] [PMC free article] [PubMed] [Google Scholar]
- Yuan M, Pino E, Wu L, Kacergis M, Soukas AA. 2012. Identification of Akt-independent regulation of hepatic lipogenesis by mammalian target of rapamycin (mTOR) complex 2. J Biol Chem. 287:29579–29588. [DOI] [PMC free article] [PubMed] [Google Scholar]
- Zhang H, Stallock JP, Ng JC, Reinhard C, Neufeld TP. 2000. Regulation of cellular growth by the Drosophila target of rapamycin dTOR. Genes Dev. 14:2712–2724. [DOI] [PMC free article] [PubMed] [Google Scholar]
- Zhang Y, Billington CJ Jr, Pan D, Neufeld TP. 2006. Drosophila target of rapamycin kinase functions as a multimer. Genetics. 172:355–362. [DOI] [PMC free article] [PubMed] [Google Scholar]
Associated Data
This section collects any data citations, data availability statements, or supplementary materials included in this article.
Data Availability Statement
Fly stocks and reagents are available upon request. Supplementary materials include Supplementary Figures S1–S5, statistical analysis (methods and Supplementary Tables S1–S7) and supdata/script files.
Supplementary material is available at figshare DOI: https://doi.org/10.25386/genetics.13238312.