

Abstract
During meiosis, the recombination-initiating DNA double-strand breaks (DSBs) are repaired by crossovers or noncrossovers (gene conversions). While crossovers are easily detectable, noncrossover identification is hampered by the small size of their converted tracts and the necessity of sequence polymorphism. We report identification and characterization of a mouse chromosome-wide set of noncrossovers by next-generation sequencing of 10 mouse intersubspecific chromosome substitution strains. Based on 94 identified noncrossovers, we determined the mean length of a conversion tract to be 32 bp. The spatial chromosome-wide distribution of noncrossovers and crossovers significantly differed, although both sets overlapped the known hotspots of PRDM9-directed histone methylation and DNA DSBs, thus supporting their origin in the standard DSB repair pathway. A significant deficit of noncrossovers descending from asymmetric DSBs proved their proposed adverse effect on meiotic recombination and pointed to sister chromatids as an alternative template for their repair. The finding has implications for the molecular mechanism of hybrid sterility in mice from crosses between closely related Mus musculus musculus and Mus musculus domesticus subspecies.
Keywords: homologous recombination, gene conversion, PRDM9 motif erosion, hybrid sterility, noncrossover-associated GC bias
Introduction
Homologous recombination between paternal and maternal chromosomes and their synapsis are unique features of the meiotic phase of gametogenesis in the majority of sexually reproducing organisms. In humans, mice, and most other mammals, the localization of recombination breakpoints is under the control of PRDM9 histone methyltransferase. The PRDM9 recruits ZCWPW1 histone modification reader (Huang et al. 2020; Wells et al. 2020) to recombination hotspots at allele-specific sites of genomic DNA and its PR/SET domain ensures trimethylation of histone 3 at lysine 4 and lysine 36 (H3K4me3 and H3K36me3) surrounding both sides of the binding motif (Baudat et al. 2010; Myers et al. 2010; Parvanov et al. 2010; Powers et al. 2016). The SPO11 topoisomerase-like protein targets a subset of trimethylated PRDM9 binding sites and generates programmed DNA double-strand breaks (DSBs) (Keeney et al. 1997, 1999). Except for nonhomologous parts of X and Y chromosomes and some structural variants in budding yeast (Goldfarb and Lichten 2010), the DSBs are repaired by homologous recombination using homologous chromatids as templates, either by crossovers (COs) accompanied by the exchange of chromatid arms between homologous chromosomes or by noncrossovers (NCOs, gene conversions) created by unidirectional transfer of genetic information. Conversion tracts, usually longer than in NCOs, also accompany COs (Cole et al. 2010). The COs are under a strong homeostatic control ensuring at least one CO per chromosome arm (obligate COs rule; Cole et al. 2012; Gray and Cohen 2016), a condition necessary for the proper segregation of homologous chromosomes into gametes. In contrast, DSBs repaired by NCOs are indispensable for synapsis of homologous chromosomes, as illustrated by asynapsis in spermatocytes with reduced or absent DSBs due to attenuated or abolished expression of the Spo11 gene (Baudat et al. 2000; Romanienko and Camerini-Otero 2000; Kauppi et al. 2013; Carofiglio et al. 2018). The significance of NCOs for meiotic synapsis of homologous chromosomes is further corroborated by the synapsis failure in meiocytes of mouse subspecific hybrids with a reduced number of repairable (symmetric) DSBs (Bhattacharyya et al. 2013; Davies et al. 2016; Gregorova et al. 2018; Mukaj et al. 2020).
The NCO events are hard to detect because the conversion tracts are rather short, estimated at 86 ± 49 bp in two mouse hotspots (Cole et al. 2014) and 30 and 41 bp in a recent mouse study (Li et al. 2019) or 55–290 bp in humans (Jeffreys and May 2004). Moreover, the NCOs are detectable only when the conversion tracts carry SNPs or short indels distinguishing the paternal from the maternal sequence. Thus, the efficiency of identification of NCOs also depends on the density of these allelic variants.
To identify the NCOs and their chromosome-wide distribution, we took advantage of the panel of C57BL/6J-Chr #PWD/Ph/ForeJ (abbreviated B6.PWD-Chr #) inter-subspecific chromosome substitution strains (also known as consomic strains). Each consomic strain of this panel carries a single chromosome from the donor PWD strain of Mus musculus (hereafter musculus) subspecies on the genetic background of the recipient C57BL/6J strain (abbreviated B6) predominantly of Mus musculus domesticus (hereafter domesticus) origin (Gregorova et al. 2008). The chromosome substitution was carried out by backcrossing individual PWD chromosomes to the B6 strain (Figure 1), which yielded on average 21% of progeny with nonrecombinant PWD chromosome at each generation [see Supplementary Table S1 in Gregorova et al. (2008)]. Only the mice with nonrecombinant PWD chromosome were selected for transfer to the next backcross generation. Because 10 backcrosses were required to create a consomic strain, each completed strain carried a single PWD chromosome ∼10-fold enriched for NCOs but devoid of COs. Thus, the NCOs could be detected directly by sequencing individual consomic strains.
Figure 1.

Scheme of construction of chromosomal substitution strains B6.PWD-Chr #. The donor chromosomes (PWD) were transferred to the recipient inbred strain (B6) by ten consecutive backcrosses. In the final intercross, the consomic chromosome was fixed in homozygous state allowing direct identification of NCOs by sequencing. The example of B6.PWD-Chr 2 is shown here.
Here, we searched for NCOs in 10 consomic strains of the B6.PWD-Chr # panel (Gregorova et al. 2008). Because the musculus and domesticus subspecies diverged roughly 350–500 thousand years ago (Din et al. 1996; Geraldes et al. 2008), their level of genome disparity, one SNP per 130 bp, is comparable to the divergence between the human and chimpanzee (Ideraabdullah et al. 2004). The accumulation of NCOs during the backcrosses and the higher chance to identify them by converted SNPs are the factors that considerably amplified the efficiency of NCO mapping. Moreover, better characterization of NCOs can contribute to the genetic dissection of reproductive isolation between these mouse subspecies, since the difficulties to repair DNA DSBs by homologous recombination and subsequent deficiency of NCOs was proposed to interfere with the meiotic pairing of homologous chromosomes and cause early meiotic arrest in the (PWD × B6)F1 model of hybrid male sterility (Forejt 1996; Forejt et al. 2012; Bhattacharyya et al. 2013; Davies et al. 2016; Gregorova et al. 2018).
Materials and methods
Animals and ethics statement
The animals were maintained at the Institute of Molecular Genetics in Prague, Czech Republic. The project was approved by the Animal Care and Use Committee of the Institute of Molecular Genetics ASCR, protocol No 005/2017. The principles of laboratory animal care, Czech Act No 246/1992 Sb., compatible with EU Council Directive 86/609/EEC and Appendix of the Council of Europe Convention ETS, were observed. The PWD/Ph inbred strain originated from a single pair of wild mice of the musculus subspecies trapped in 1972 in Central Bohemia, Czech Republic (Gregorova and Forejt 2000). The C57BL/6J (B6) inbred strain was purchased from The Jackson Laboratory. The panel of 27 chromosome substitution strains C57BL/6J-Chr #PWD (B6.PWD-Chr #) maintained by the Institute of Molecular Genetics AS CR, Czech Republic, was prepared in our laboratory. Briefly, (PWD × B6)F1 hybrids were backcrossed to B6, and the resulting BC1 generation was genotyped with multiple SSLP markers (from 6 to 10 based on chromosome size) to select a nonrecombinant PWD chromosome. After each backcross generation (N2–N11), the mice (males or females) with a particular nonrecombinant PWD chromosome were selected for further backcross to B6, until the purity of the B6 genetic background reached 99.98% (Gregorova et al. 2008).
All mice were maintained in a 12 h light/12 h dark cycle in a specific pathogen-free barrier facility. The mice had unlimited access to standard rodent diet (ST-1, 3.4% fat, VELAZ) and water. All males were sacrificed at age 40–60 days. The tails of progenitors of chromosomal substitution strains have been archived in an −80°C freezer.
NGS sequencing and genotyping
Partially purified DNA from mouse spleens was isolated by Puregene Core Kit A (QIAGEN 158267) according to the manufacturer’s instructions. Next-generation sequencing was performed in Illumina HiSeq X to obtain paired-end reads of lengths 2 × 150 bp. The sequencing coverage was achieved at least 24× for each of B6.PWD-Chr # (# = 1, 2, 3, 4, 5, 6, 17, 18, 19) consomic, and B6.PWD-Chr-X1.s (Bhattacharyya et al. 2014) subconsomic strains.
The Kapa library preparation protocol was used. The obtained reads were checked for quality by FASTQC. The paired-end reads were aligned to B6 (GRCm38, mm10) reference genome using bwa aligner version 0.7.17, with the default parameters. Subsequently, the reads were used for identification of NCO sites as described below.
Detection and characterization of noncrossover sites
The NCO sites were identified by subsequent filtering steps. The database of the detected PWD-B6 SNPs (Davies et al. 2016) was considered as the starting point. For each PWD-B6 SNP, its genomic position was evaluated in the alignment (.bam) files of consomic B6.PWD-Chr #, PWD (Davies et al. 2016), PWK/PhJ (henceforth PWK), and B6N/J (B6N) strains (Keane et al. 2011) for the presence of B6 or PWD allelic form. To be an NCO candidate site, the genomic position of PWD-B6 SNP was required:
in the consomic strain alignment file, at least 10 reads were required to be called the allelic B6 base, while the proportion of PWD allelic bases was required ≤5% of number of reads with B6 base (based on mm10 reference and the PWD-B6 SNP dataset);
in the PWD strain alignment file, at least 15 reads were required to be called the allelic PWD base, while the proportion of B6 allelic bases ≤5% of number of reads with PWD base;
in the PWK strain alignment file, at least 15 reads were required to be called the allelic PWD base, while the proportion of B6 allelic bases ≤5% of number of reads with PWD base;
in the B6N strain alignment file, at least 15 reads were required to be called the allelic B6 base, while the proportion of PWD allelic bases ≤5% of number of reads with B6 base. The candidate site base coverage was required to be ≤300 for all the strains to avoid duplicated regions. The presence of respective bases in the alignment files was counted with the use of samtools mpileup program (version 1.9).
Three regions of B6 origin of lengths ∼1–3 Mb were found on the background of substituted PWD chromosome 3 (chr3:22181981–25516466), chromosome 4 (chr4:153634374–156356368), and chromosome 19 (chr19:60059033–61330727). Most likely, they resulted from hidden double COs (or single CO on subtelomeric end of Chr 19) that occurred during the preparation of chromosomal substitution strains and as such were excluded from further analyses. Using the NGS data, all candidate NCO sites were manually curated using the IGV genome browser. In the IGV browser, we went through all the detected NCO candidate sites and checked whether the reads were uniquely aligned to the B6 (mm10) reference. Importantly, we explored the PWD-B6 variants surrounding the candidate NCO sites, whether they were converted or not. While all the surrounding SNPs were detected by the filtering pipeline, the pipeline was not designed to detect indels. Thus, all the indels surrounding the candidate PWD-B6 SNPs, either converted or nonconverted, were discovered by manual curation. The manual curation eliminated (10) 10% of candidate sites, in most cases due to a presence of short PWD-B6 indel in the distance <150 bp, leading to artificially differing read alignments of consomic, PWD, PWK, and B6N strains. In other (single) cases, candidate sites were eliminated due to low read mapping quality, or due to another SNP within 10 bp from the candidate site differing between PWD and PWK strains. Other steps of candidate NCO sites validation were performed subsequently and independently, namely Sanger sequencing (100% positive) and overlap with the known sites of recombination (98% positive) detected in previous studies (Davies et al. 2016; Smagulova et al. 2016), as described below.
By our filtering setup, we detected the NCOs overlapping the published PWD-B6 SNPs (Davies et al. 2016). We calculated the conditional detection power, i.e. the probability to detect NCO gene conversions provided it contained at least one SNP, similar to a parallel study (Li et al. 2019). To that end, we simulated hypothetical NCO events in the known H3K4me3 sites in (B6×PWD)F1 hybrids with the probability proportional to the H3K4me3 enrichment. Assuming that they were distributed around the H3K4me3 site center similar to the detected NCOs and considering the NCO gene conversion tract lengths exponentially distributed with the mean of 32 bp, we simulated a dataset of 100 NCO sites. We divided the number of the simulated NCO sites detectable with our filtering setup, i.e. overlapping a PWD-B6 SNP passing the filters, by the number of the simulated NCO sites overlapping any PWD-B6 SNP. The simulating procedure was performed 10,000 times to get the estimate of conditional detection power.
Second, we calculated unconditional detection power, i.e. the probability to detect NCO gene conversions without conditioning on SNP presence. Here, the number of the simulated NCO sites detectable with our filtering setup was divided by the number of all simulated NCO gene conversions. The unconditional detection power was used for estimation of NCO count per meiosis.
In this study, we observed 91 autosomal NCOs, which were accumulated within 10 backcross generations in 9 autosomes representing 51% of autosomal genome. Considering further, we observed NCO events in only one chromatid (out of four in the tetrad) and the estimated unconditional detection power, we estimated the expected amount of NCO events per one meiosis:
Noncrossover site amplification and Sanger sequencing
The DNA from mouse tails was amplified at selected NCO sites (see primer list). Samples were amplified by a BIOER XP Cycler with the program: 95°C for 2 min followed by 40 cycles at 95°C for 10 s, 55°C for 20 s and 72°C for 30 s, and a single step at 72°C for 3 min. Samples showing a single correct size band were treated by ExoSAP-IT enzyme according to the manufacturer’s instructions (Thermofisher Scientific 78201) and sequenced.
Prdm9 exon 12 amplification
DNA was amplified with primers Exon12-L1—TGAGATCTGAGGAAAGTAAGAG and Exon12-R—TGCTGTTGGCTTTCTCATTC using PCR program: 94°C for 5 min and 40 cycles at 94°C for 30 s, 61°C for 1 min, 68°C for 2 min, and a single step at 72°C for 7 min. The PCR products were resolved in 2% agarose gel allowing visual discrimination of B6 from PWD alleles of Prdm9 by their different migration.
Dynamics of NCO gene conversion occurrence
To infer the dynamics of gene conversion during 10 generations of backcrosses, the converted SNPs in NCO sites were additionally sequenced by Sanger sequencing in a step-wise procedure. First, the male parents from BC-10 to BC-6 generations, then the samples from the remaining generations between BC-1, BC-6, and BC-10 were either genotyped, when the closest known generation before was PWD/B6 and the closest generation after was B6/B6, or inferred when the closest known generation before and after were both of the same genotype. The parents from BC-2 to BC-3 that were used to prepare B6.PWD-Chr 2 were not archived.
Overlap of NCOs and COs with DMC1 and H3K4me3 ChIP-seq sites
To determine the overlap of NCO and CO sites with DMC1 hotspots, we used the DMC1 datasets of (B6 × PWD)F1, (PWD × B6)F1, B6, and PWD males from the previous studies (Davies et al. 2016; Smagulova et al. 2016). The datasets differed in the number of detected hotspots between the biological replicates; however, the extra DMC1 hotspots had the lowest heat. The heat of DMC1 sites overlapping between the biological replicates was highly correlated (ρ = 0.92, P < 10−16, for (B6 × PWD)F1). Importantly, the extent of the overlap of autosomal NCO sites with the respective DMC1 datasets differed by only 2%. Furthermore, only the datasets of (Davies et al. 2016) provided the information about the inferred PRDM9 initiation of each DSB and the level of asymmetry. For the X chromosome, which is missing in the dataset of Davies et al. (2016), we used the information on the DMC1 overlap from the datasets of Smagulova et al. (2016). Similarly, the vast majority (98%) of NCOs overlapping either (B6 × PWD)F1 or (PWD × B6)F1 DMC1 sites overlapped each other. The DMC1 sites were considered uniformly of 2001 bp length, consistently with the reported median DMC1 site length (Davies et al. 2016). Because the autosomal COs in this study were detected in the (B6 × PWD)F1 hybrids, we assumed their localization in DMC1 hotspots of the (B6 × PWD)F1 DMC1 dataset. To investigate the presence of H3K4me3 signal in NCO and CO sites of (B6 × PWD)F1, (PWD × B6)F1, and B6 males, we used the published data (Davies et al. 2016). For the comparison of the amount of DMC1 and H3K4me3 signal in NCO and CO sites, we used only the data from the (B6 × PWD)F1 dataset. The H3K4me3 sites were considered uniformly of the 2001 bp length.
Comparison of NCO and CO spatial chromosome-wide distribution
The NCOs were compared to the COs in (B6 × PWD)F1 male meioses generated in this study to control for the genetic background. Next, the NCOs were compared to both male and female COs inferred from the G2:F1 population of the Collaborative Cross (CC) project (Churchill et al. 2004). In both cases, the comparison was performed by a permutation test. The respective CO events were binned into 10 groups according to their relative chromosomal coordinate to give the estimates of the relative proportions of CO events in each bin, which were used to specify the probabilistic distribution. Provided the null hypothesis NCOs do not differ from COs, a dataset of 91 NCO events was simulated from the respective CO distributions. The simulations were performed 10,000 times and the real NCO distribution was compared to the expected NCO distribution. In addition, to compare with the male and female COs from the CC project, the CO distribution based on 50% of male COs and 50% of female COs and CO distribution based on 25% of male COs and 75% of female COs were calculated as two extreme possibilities. This was done to account for the uncertainty of sex in which the NCOs occurred. The more conservative P-value was reported.
Proportion of nonparental NCO, CO, and DSB events as a proxy for the level of asymmetry
We defined the NCO/CO/DSB event as “nonparental,” when found in the DMC1 dataset of (B6 × PWD)F1 hybrid and not in the DMC1 dataset of B6 or PWD parents and B6.Prdm9−/−. The “parental” events were defined as found in the DMC1 dataset of (B6 × PWD)F1 hybrids and also in one of the B6 or PWD DMC1 parental datasets but not in the B6.Prdm9−/− dataset. The events not found in the (B6 × PWD)F1 DMC1 dataset and the events found in the B6.Prdm9−/− DMC1 dataset were excluded from the analysis. We calculated the proportion of nonparental events as a ratio (# of nonparental events)/(# of nonparental or parental events) for both the NCO events and CO events.
The metric of “nonparental” events was used as an alternative to the metric of “asymmetry.” We adopted the definition of “asymmetric hotspots” from (Davies et al. 2016): “Symmetric hotspots were defined as those for which the fraction of informative reads from the B6 chromosome could be computed, and for which this fraction fell in the range 0.2–0.8 (inclusive). Asymmetric hotspots were conversely defined as those whose fraction fell outside this range.” The nonparental sites form a subset of asymmetric sites, as virtually all [99%, aggregated H3K4me3 enrichment measured hereafter in (B6 × PWD)F1] nonparental sites are asymmetric. Conversely, 37% (aggregated H3K4me3 enrichment) of asymmetric sites are nonparental (Supplementary Figure S1).
We opted to compare the proportion of “nonparental” sites instead of the “asymmetric” sites because nonparentality can be defined equally well for the consomics and for the F1 model, while the values of asymmetry (proportion of B6 reads) detected in the (B6 × PWD)F1 model are expected to differ between both models. The reason is that the consomic NCO events were controlled almost exclusively by the B6 PRDM9 allele on the PWD chromosome and that the genomic background of the consomic strain progenitors was a mixture of PWD and B6 genomic segments, gradually becoming purely B6 homozygous (Gregorova et al. 2008). However, based on these model differences, we expected the consomic DSBs on PWD homologue to be more likely asymmetric than (B6 × PWD)F1 DSBs, making the nonparentality models (M1, M2, M3, M4 defined below) more conservative. Furthermore, the direct approach to measure the extent of asymmetry using specific DMC1 and/or H3K4me3 ChiP-seqs in various generations of the consomic line preparation was not possible.
We calculated the expected proportion of nonparental NCO and CO events on the basis of the proportion of nonparental meiotic DSB events in the (B6 × PWD)F1 model (the null model). For the calculation, we accounted for the expected frequencies of the DSB events [approximated by the PWD-homologue attributed DMC1 heat and H3K4me3 enrichment measured in (B6 × PWD)F1 hybrids] by subsampling meiotic DSB events within 10 deciles determined by DMC1 heat and H3K4me3 enrichment of NCO events. The reason for the adjustments was that asymmetric/nonparental sites tend to have higher DMC1 heat and H3K4me3 enrichment and that the DMC1 heat and H3K4me3 enrichment is higher in more frequent DSB/CO/NCO events. Similarly, to compare the nonparental proportions between the NCO, CO, and meiotic DSB events, we used logistic regression models adjusted for DMC1 heat and H3K4me3 enrichment, specifically the heat/enrichment attributed to the PWD homologue. Also for the comparability, we filtered for the NCO/CO/DSB events controlled by the PRDM9B6 allele (M1, M2 models for NCO vs DSB comparison and M3, M4 models for CO vs DSB comparison):
where π(i) = P(i-th event is nonparental given i-th event type and PWD specific heat). While the genome-wide DMC1 enrichment was measured almost exclusively for males in the published studies (Davies et al. 2016; Smagulova et al. 2016), the only study (Brick et al. 2018) allowing a direct sex comparison using the same mouse strain, C57BL/6J, showed almost identical hotspot sites in both sexes with the DMC1 heat being significantly correlated (Spearman’s R2 = 0.33). Thus, the extrapolative usage of male DMC1 heat values makes the used models more conservative.
Note further that all the detected NCO events contain an SNP (by definition), which is a predisposition (though by far not a sufficient one) for a hotspot site to be asymmetric/nonparental. Thus, the dataset of detected NCOs is expected to be slightly more asymmetric, which makes the performed comparison of the observed deficit rather conservative, thus supporting our claim on the observed deficit of nonparental hotspot sites. Finally, to specify the extent of asymmetry, we uniformly used the values from the (B6 × PWD)F1 DMC1 dataset and avoided using the asymmetry values based on H3K4me3, as the enrichment was typically lower than for the DMC1 ChiP-seq, not allowing us to measure the asymmetry so precisely.
Statistics
All statistical tests were performed and figures were plotted using R 3.4.4, the tidyverse package (dplyr, ggplot) (Wickham et al., 2019) in particular. The mean lengths of NCO gene conversions were assumed to follow an exponential distribution according to Li et al. (2019) to provide direct comparability. The composite likelihood of rate parameter λ was estimated using the probabilities that the neighboring SNPs were converted. To obtain the confidence interval (CI) of the mean NCO gene conversion length, a bootstrap procedure was used analogously as in Li et al. (2019). Briefly, the part of the genome (roughly a half of the genome) that was used for NCO detection was fragmented into segments of 10 Mb, altogether 125 segments. Of these segments, 125 were sampled with replacement to calculate the mean NCO length based on the NCO sites present. Ten thousand such bootstrap steps were performed to get the 2.5th and 97.5th percentiles, i.e. the confidence interval.
Other, nonstandard statistical analyses are described in the Materials and methods part above. Uniformly, the permutations tests used to calculate the expected overlap between the genomic features were done using N = 10,000 permutations.
The standard statistical tests used are stated in the Results part.
Data availability
The NGS data are deposited under SRA BioProject number PRJNA564925.
Supplementary material is available at GENETICS online.
Results
Chromosome-wide identification of NCOs
To identify NCOs, we sought the B6 allelic forms of PWD-B6 SNPs in the PWD sequence of individual consomic chromosomes (Figure 2A). Nine B6.PWD-Chr # consomic strains carrying PWD autosomes # 1, 2, 3, 4, 5, 6, 17, 18, 19, and B6.PWD-Chr X.1s subconsomic strain with the proximal part of Chr X of PWD origin (Bhattacharyya et al. 2014) were sequenced (whole genome sequence, WGS, Illumina 2 × 150 bp reads) with the minimal coverage of 24×. The consomic reads were aligned to the B6 reference genome and the resulting WGS were compared to B6N/J, PWD/Ph, and PWK/PhJ strains WGS, in particular, in the known sites of PWD-B6 SNPs (Davies et al. 2016). The PWD/Ph, and PWK/PhJ strains are closely related musculus-derived inbred strains. The sought B6 allelic forms were detected by a filtering procedure leading to a candidate NCO dataset, which was further manually curated and independently validated (see Materials and methods).
Figure 2.

Detection of NCO events. (A) The scheme of NCO detection by comparison of chromosomal substitution strains B6.PWD-Chr# and parental B6 and PWD strains. The NCO site could be covered by 0, 1, or 2 or more SNPs. NCO sites overlapped by 0 SNPs cannot be detected. (B) Localization of NCO events identified on the transferred PWD chromosomes in ten chromosomal substitution strains. The NCO gene conversion with single and multiple converted SNPs are distinguished by color. For the detection of NCOs on chromosome X, the subconsomic B6.PWD-ChrX.2 strain carrying the PWD sequence in the proximal 69.6 Mb was used.
Altogether we detected 91 NCOs in nine consomic autosomes and three NCOs in the proximal 69.6 Mb of Chr X (Figure 2B and Table 1). Sixty-nine percent of NCO gene conversion tracts encompassed one converted SNP; 20% and 11% carried two or more SNPs (or possibly short indels), respectively.
Table 1.
Localization and origin of NCO events
| NCO localization |
DMC1 coloc.a |
NCO localization |
DMC1 coloc.a |
|||||||||||||||||||
|---|---|---|---|---|---|---|---|---|---|---|---|---|---|---|---|---|---|---|---|---|---|---|
| Chr | Start | End | Minb | Maxb | B6 | (PWD× B6)F1 | PWD | B6. Prdm9−/− | Non parentalc | Chr | Start | End | Minb | Maxb | B6 | (PWD× B6)F1 | PWD | B6. Prdm9−/− | Non parentalc | |||
| 1 | 13845860 | 13845929 | 70 | 277 | T | T | F | F | F | 4 | 92481179 | 92481179 | 1 | 596 | F | F | F | F | NA | |||
| 1 | 46907980 | 46907980 | 1 | 419 | T | T | F | F | F | 4 | 125451332 | 125451332 | 1 | 661 | T | T | F | F | F | |||
| 1 | 59359320 | 59359321 | 2 | 692 | T | T | F | F | F | 4 | 142990293 | 142990308 | 16 | 364 | T | T | F | F | F | |||
| 1 | 61872329 | 61872329 | 1 | 69 | T | T | F | F | F | 5 | 6242093 | 6242323 | 231 | 407 | T | T | F | F | F | |||
| 1 | 63879266 | 63879271 | 6 | 117 | F | T | F | F | T | 5 | 20789067 | 20789067 | 1 | 115 | T | T | F | F | F | |||
| 1 | 67960742 | 67963400 | 2659 | 3994 | T | T | F | F | F | 5 | 27852657 | 27852657 | 1 | 338 | T | T | F | F | F | |||
| 1 | 128517316 | 128517318 | 3 | 985 | T | T | F | F | F | 5 | 51691842 | 51691842 | 1 | 92 | T | T | F | F | F | |||
| 1 | 137135844 | 137135844 | 1 | 141 | T | T | F | F | F | 5 | 55484917 | 55484946 | 30 | 278 | T | T | F | F | F | |||
| 1 | 165896307 | 165896311 | 5 | 680 | T | T | F | F | F | 5 | 90775650 | 90775650 | 1 | 61 | T | T | F | F | F | |||
| 1 | 183578162 | 183578162 | 1 | 542 | T | T | F | F | F | 5 | 96571457 | 96571457 | 1 | 94 | T | T | F | F | F | |||
| 2 | 3736957 | 3736957 | 1 | 57 | T | T | F | F | F | 5 | 102062273 | 102062273 | 1 | 190 | T | T | F | F | F | |||
| 2 | 5040747 | 5040747 | 1 | 133 | T | T | F | F | F | 5 | 104084656 | 104084656 | 1 | 340 | T | T | F | F | F | |||
| 2 | 10336587 | 10336592 | 6 | 264 | T | T | F | F | F | 5 | 108572496 | 108572496 | 1 | 441 | T | T | F | F | F | |||
| 2 | 11688991 | 11689010 | 20 | 549 | F | T | F | F | T | 5 | 117528325 | 117528325 | 1 | 380 | T | T | F | F | F | |||
| 2 | 13697711 | 13697711 | 1 | 431 | F | T | T | F | F | 5 | 119304743 | 119304775 | 33 | 110 | T | T | F | F | F | |||
| 2 | 28188305 | 28188305 | 1 | 361 | F | T | F | F | T | 5 | 125695123 | 125695137 | 15 | 211 | T | T | F | F | F | |||
| 2 | 32226478 | 32226493 | 16 | 147 | F | T | T | F | F | 5 | 141144023 | 141144023 | 1 | 246 | T | T | T | F | F | |||
| 2 | 58517611 | 58517618 | 8 | 270 | T | T | F | F | F | 5 | 148185214 | 148185214 | 1 | 54 | F | F | F | F | NA | |||
| 2 | 61489637 | 61489637 | 1 | 643 | T | T | F | F | F | 6 | 18095110 | 18095110 | 1 | 159 | T | T | F | F | F | |||
| 2 | 72241857 | 72241857 | 1 | 462 | T | T | F | F | F | 6 | 36814629 | 36814629 | 1 | 299 | T | T | F | F | F | |||
| 2 | 74937052 | 74937064 | 13 | 384 | T | T | F | F | F | 6 | 39355424 | 39355448 | 25 | 176 | F | T | T | F | F | |||
| 2 | 78357403 | 78357403 | 1 | 50 | T | T | F | F | F | 6 | 101509677 | 101509677 | 1 | 148 | T | T | F | F | F | |||
| 2 | 79679676 | 79679676 | 1 | 330 | T | T | F | F | F | 6 | 103949614 | 103949614 | 1 | 122 | T | T | T | F | F | |||
| 2 | 85528071 | 85528071 | 1 | 131 | T | T | F | F | F | 6 | 115864297 | 115864297 | 1 | 315 | F | T | T | F | F | |||
| 2 | 96760589 | 96760589 | 1 | 169 | T | T | F | F | F | 6 | 128995778 | 128995882 | 105 | 337 | T | T | F | F | F | |||
| 2 | 116516318 | 116516318 | 1 | 126 | F | T | F | F | T | 6 | 134249703 | 134249745 | 43 | 388 | T | T | F | T | Dd | |||
| 2 | 135984537 | 135984537 | 1 | 46 | F | T | F | F | T | 17 | 14350774 | 14350820 | 47 | 587 | T | T | F | F | F | |||
| 2 | 147805390 | 147805390 | 1 | 383 | T | T | F | F | F | 17 | 25991437 | 25991437 | 1 | 162 | F | T | F | F | T | |||
| 2 | 150590002 | 150590002 | 1 | 687 | T | T | F | F | F | 17 | 31984106 | 31984106 | 1 | 113 | F | T | T | F | F | |||
| 2 | 166617293e | 166617524e | 232 | 370 | F | T | F | F | T | 17 | 51576043 | 51576050 | 8 | 491 | F | T | F | F | T | |||
| 3 | 16828944 | 16828944 | 1 | 267 | T | T | F | F | F | 17 | 67796579 | 67796615 | 37 | 97 | F | F | F | F | NA | |||
| 3 | 22128566 | 22128566 | 1 | 378 | T | F | F | F | NA | 17 | 79667734 | 79667734 | 1 | 258 | T | T | T | T | Dd | |||
| 3 | 36830205 | 36830205 | 1 | 492 | T | T | F | F | F | 18 | 4596959 | 4596972 | 14 | 394 | T | T | F | F | F | |||
| 3 | 51188409 | 51188409 | 1 | 182 | T | T | F | F | F | 18 | 28878184 | 28878184 | 1 | 305 | T | F | F | F | NA | |||
| 3 | 65603278 | 65603278 | 1 | 662 | T | T | F | F | F | 18 | 32083435 | 32083435 | 1 | 46 | T | T | F | F | F | |||
| 3 | 65655136 | 65655136 | 1 | 466 | F | T | F | F | T | 18 | 38278002 | 38278002 | 1 | 251 | T | T | F | F | F | |||
| 3 | 69739785 | 69739785 | 1 | 232 | T | T | F | F | F | 18 | 40885813 | 40885839 | 27 | 230 | T | T | F | F | F | |||
| 3 | 85792585 | 85792585 | 1 | 138 | T | T | F | F | F | 18 | 41946723 | 41946739 | 17 | 162 | T | T | F | F | F | |||
| 3 | 95869211 | 95869211 | 1 | 36 | T | T | F | F | F | 18 | 78715451 | 78715451 | 1 | 72 | F | T | F | F | T | |||
| 3 | 107617094 | 107617095 | 2 | 185 | T | T | F | F | F | 19 | 4199635 | 4199635 | 1 | 183 | T | T | F | F | F | |||
| 3 | 130702831 | 130702831 | 1 | 177 | T | T | F | F | F | 19 | 16998839 | 16998847 | 9 | 130 | F | T | F | F | T | |||
| 3 | 136064382 | 136064385 | 4 | 622 | F | T | F | F | T | 19 | 28429944 | 28429944 | 1 | 112 | T | T | F | F | F | |||
| 4 | 6396524 | 6396541 | 18 | 399 | F | T | F | F | T | 19 | 28519574 | 28519585 | 12 | 97 | T | T | F | F | F | |||
| 4 | 10936243 | 10936243 | 1 | 448 | F | T | F | F | T | 19 | 44938647 | 44938648 | 2 | 444 | T | T | F | F | F | |||
| 4 | 49528333 | 49528367 | 35 | 225 | T | T | F | F | F | X | 42581841 | 42581841 | 1 | 239 | T | T | F | F | F | |||
| 4 | 59369670 | 59369670 | 1 | 286 | T | T | F | F | F | X | 52427650 | 52427650 | 1 | 220 | F | T | F | F | T | |||
| 4 | 83240097 | 83240097 | 1 | 260 | F | T | F | F | T | X | 63297750 | 63297750 | 1 | 193 | F | F | F | F | NA | |||
F, false; T, true, NA, not applicable.
DMC1 colocalization; data from Davies et al. (2016) and Smagulova et al. (2016), overlap within ±1000 bp from DMC1 center.
Minimal and Maximal NCO conversion tract lengths.
The nonparental event is defined as found in (B6×PWD)F1 but not in parental B6 nor PWD DMC1 datasets.
Default hotspot; i.e. present in B6.Prdm9−/− DMC1 dataset.
Complex NCO event, see the main text.
The ranges of possible length of each NCO conversion tract (Table 1) were based on the converted and surrounding nonconverted SNPs. The conversion tracts varied in length. For instance, we found 13 tracts necessarily shorter and four tracts necessarily longer than 100 bp (Figure 3). Assuming an exponential distribution, we estimated the mean length of the detected NCO conversion tracts at 32 bp (95% CI 22–39 bp). In addition, a single complex conversion event (1%) on Chr 2 contained two converted SNPs 231 bp apart from each other with two nonconverted SNPs in between. We confirmed by Sanger sequencing of consomic strains progenitors that this complex event more likely resulted from a single meiosis rather than from aggregation of two events in different backcross generations. Thus, the incidence of complex NCO gene conversions was in perfect agreement with recent mouse (Li et al. 2019) and human (Williams et al. 2015) studies, but much lower than 46% or 65% reported in another human study (Halldorsson et al. 2016). A representative subset (48/94) of identified autosomal NCOs was further validated by Sanger sequencing and all of them were confirmed to be true, demonstrating very high specificity of the filtering methods.
Figure 3.

Maximal and minimal possible length of each NCO gene conversion tract. The maximal length is given by the distance of the two nearest nonconverted PWD-B6 SNPs. The minimal length is given by the distance of the most outer converted PWD-B6 SNPs; in 69% cases, the conversion tract contains only one SNP giving a minimal length of 1 bp. The red dashed line is shown to illustrate the minimal and maximal possible gene conversion length concept; 13 tracts are necessarily shorter and four tracts necessarily longer than 100 bp. *The gene conversion with minimal length = 2659 bp and maximal length = 3966 bp is not displayed.
To estimate the probability of false-negative events, we performed a power simulation to show how frequently the NCO events are detected by our approach (see Materials and methods for details). This depended on the lengths of NCO gene conversion events, number of NCO-associated converted SNPs, and the NGS sequencing coverage at the converted sites. The simulation was based on the values obtained in our study, i.e. the average NCO gene conversion length was considered 32 bp with the tracts having exponential distribution; the NCO sites assumed to be solely localized in H3K4me3 sites with their frequency proportional to H3K4me3 signal intensity in (B6 × PWD)F1 hybrids reported earlier (Davies et al. 2016). We performed the simulation 1000 times and found the power of 92% to uncover the NCO provided it overlapped at least one PWD-B6 SNP. Further, extending these results, we estimated on average 280 autosomal NCOs per one meiosis (calculation in Materials and methods), a value comparable to previous estimates (Baudat and de Massy 2007; Cole et al. 2012; Li et al. 2019).
NCOs colocalize with the sites of meiotic DSBs
The meiotic recombination pathway is initiated by activation of PRDM9 binding sites, detectable by chromatin immunoprecipitation of histone 3 trimethylated at lysine 4 and lysine 36 (H3K4me3 and H3K36me3 ChIP-seq) and massively parallel DNA sequencing. About 4700 such sites are activated per leptotene spermatocyte (Baker et al. 2014), but only 250–300 acquire DNA DSBs after being targeted by the SPO11 protein. Hotspots of DNA DSBs can be localized and quantified by sequencing SPO11-covalently bound oligos (Lam et al. 2017) or by ChIP-seq of DMC1 protein-bound DNA recombination intermediates (Smagulova et al. 2011). At kilobase resolution, 96% of the identified NCOs colocalized with the sites of meiotic DMC1 hotspots based on the available data (Davies et al. 2016; Smagulova et al. 2016) on males of one or more of the strains/crosses—B6, PWD, (B6 × PWD)F1, and (PWD × B6)F1 (Table 1). The overlap showed high specificity of our detection approach, since the random overlap of NCOs with the superset of these DSBs sites was only 7%, thus confirming that the detected NCOs were real. As expected, the same 96% of NCO conversion tracts colocalized with the PRDM9-induced H3K4me3 histone modifications (Supplementary Table 1). The high overlap was in good agreement with a previous mouse study of (B6.Prdm9Hum × CAST/EiJ)F2 and F5 generations showing 92% colocalization of Prdm9Hum and Prdm9Cast -directed NCOs with either H3K4me3 or DMC1 hotspots (Li et al. 2019). Age- and sex-dependent variation in NCO rate was reported in an extensive human study showing 45.7-fold over-representation of NCOs over spermatocyte DSB regions in paternal transmissions, in contrast to only 7.1 over-representation in maternal transmission (Halldorsson et al. 2016).
The NCO counts per chromosome correlated well (Pearson’s r = 0.8610, P = 0.0029) with the SPO11 oligo signal (Lange et al. 2016) used as a proxy for the DSB counts (Supplementary Table 2), reflecting their dependence as shown in detail below. Information on the H3K36me3 and SPO11 oligo hotspots is not available for (PWD × B6) and (B6 × PWD)F1 hybrids; nevertheless, in the subset of NCO sites overlapping the DMC1 hotspots of the B6 strain (72%, 68/94), we assessed the overlap with the PRDM9-mediated H3K36me3 hotspots and the overlap with SPO11 sites of programmed DSBs in B6 meiocytes (Lange et al. 2016). NCOs overlapped with H3K36me3 in 79% of cases (all DMC1 sites overlapped H3K36me3 sites in 56% of cases) and NCOs overlapped with SPO11 in 96% of cases (all DMC1 sites overlapped SPO11 sites in 72% of cases). The higher overlap of NCOs with H3K36me3 and SPO11 sites could be explained by the fact that NCOs are typically localized in the stronger intensity DMC1 sites, more likely reflecting higher affinity for SPO11 and H3K36me3. The high overlap of NCOs with the markers of meiotic DSB induction and repair showed that the vast majority of NCOs in mice resulted from the standard meiotic DSB repair pathway. The four DMC1-negative NCO sites, nonoverlapping any DSB site in DMC1 datasets of (B6 × PWD)F1, (PWD × B6)F1, B6, and PWD, were confirmed by Sanger sequencing to be converted.
Identification of PRDM9 binding motifs within NCO sites
We identified the PRDM9 binding motif within an interval 500 bp upstream or downstream of the converted SNP in most of the NCO conversion tracts. When the NCOs were compared with the PRDM9B6 and PRDM9PWD DMC1 hotspot data (Davies et al. 2016; Smagulova et al. 2016), 78% matched with the PRDM9B6 hotspots, 5% with PRDM9PWD, 11% possibly originated from either PRDM9B6 or PRDM9PWD but could not be determined, 2% were default (present in the B6.Prdm9−/− dataset), and 4% of NCOs did not match with any DMC1 hotspot (Supplementary Table 3). The inferred PRDM9 alleles responsible for the identified NCOs (Figure 4) were fully consistent with the Prdm9 genotypes of the particular backcross generation of the emerging consomic strains. While the F1 parents were Prdm9B6/PWD heterozygous, the Prdm9B6/B6 homozygosity was achieved no later than at Backcross 3 in all available lines, with the obvious exception of the B6.PWD-Chr 17 line (Prdm9 is localized on Chr 17, Supplementary Table 4). The number of Backcross generations with the Prdm9B6/PWD or Prdm9B6/B6 genotype corresponded well to the proportion of NCOs initiated by the respective alleles (r = 0.80, P < 0.0001).
Figure 4.
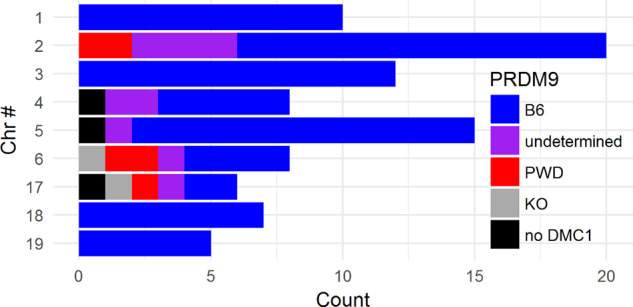
The inferred PRDM9 allele initiating the autosomal DSBs repaired by NCOs. The initiating PRDM9 allele was inferred based on the overlap with parental B6 and PWD strains and the detected PRDM9 binding motif in datasets of (Davies et al. 2016) and (Smagulova et al. 2016).
Chromosome-wide colocalization of NCO and CO events
To compare the localization and properties of NCOs and COs, we genotyped 102 male-derived meioses from a backcross of B6 females and (B6 × PWD)F1 males using MegaMUGA genotyping arrays. We identified 1486 autosomal COs with a median resolution of ∼80 kb based on the neighboring MegaMUGA B6-PWD SNPs. Within the ∼80-kb intervals, 627 (out of 1486, 42%) CO events were found repeatedly (2–13 times) in the same respective interval, showing a presence of active ∼80-kb CO hotspots. For some of the analyses below, we further localized the CO events by leveraging the (B6 × PWD)F1 DMC1 hotspot datasets (Davies et al. 2016; Smagulova et al. 2016). Out of the 1486 CO events, 698 (47%) overlapped a single DMC1 hotspot, leading to a credible dataset of ∼2-kb-defined CO events (hereafter DMC1-unique CO events). Amidst 698 DMC1-unique CO events, we found 281 (40%) of them repeatedly (2–9 times), showing a presence of active ∼2-kb CO hotspots. The COs were highly abundant in the subtelomeric regions and at the 2nd decile of the chromosomal lengths (Figure 5A), in agreement with the nonuniform spatial distribution previously described in male meiosis of mice (Cox et al. 2009; Liu et al. 2014), as well as of humans and other species (Broman et al. 1998; Littrell et al. 2018; Shen et al. 2018). The spatial chromosome-wide distribution of NCOs was significantly different from the CO distribution (P ≤ 0.0109, see Materials and methods), namely, NCO events were deficient in comparison to CO events in the 10th decile of the chromosomal length (Figure 5B, P ≤ 0.0333). To test the significance, the NCOs were compared to two unrelated datasets of COs. First, NCOs were compared to the COs in (B6 × PWD)F1 male meioses detected in this study (P = 0.0029, permutation test) to control for the genetic background. Second, NCOs were compared to a dataset of male and female COs from the G2:F1 population of the Collaborative Cross project (Liu et al. 2014) (P = 0.0109, permutation test, see Materials and methods) to account for the previously described sex differences in the CO distribution. Consistently in both comparisons, the chromosome-wide distribution of CO events in the subtelomeric regions was higher than that of NCOs (P = 0.013 and 0.0333, respectively, permutation test adjusted for multiple testing) and of other chromosome-wide hotspots related to DSB initiation and repair, namely H3K4me3, DMC1, and SPO11-oligos (Davies et al. 2016; Lange et al. 2016; Smagulova et al. 2016). This implies that the resolution of DNA DSBs at the subtelomeric regions is more probable by COs than by NCOs, when compared with the other regions of the genome. A similar conclusion was reached by a single-sperm sequencing study of mouse COs indicating fivefold increased probability of DSB resolution as a CO rather than as NCO toward the telomeric chromosome end (Hinch et al. 2019). Admittedly, the conclusion still needs testing, since NCOs were not underrepresented in subtelomeric regions in two previous mouse and human studies (Halldorsson et al. 2016; Li et al. 2019).
Figure 5.

Histograms of relative chromosomal positions of (A) CO and (B) NCO events. The spatial distributions are significantly different, with a significant deficit of NCO events in comparison to CO events at the 10th decile of relative length. The centromeres are at position 0.00. The COs are from the F1 male meioses and NCOs are from the consomic strains. In both cases, the same parental strains, B6, and PWD, were involved.
To compare the CO and NCO outcomes and their PRDM9 initiation with a kilobase resolution, we focused on a subset of (B6 × PWD)F1 COs whose position determined by the MegaMUGA chip overlapped a single DMC1 (B6 × PWD)F1 hotspot (Davies et al. 2016; Smagulova et al. 2016). We assumed that the respective COs were initiated in the centers of such DMC1 sites. Limiting the DMC1-unique CO sites to those of the inferred PRDM9B6 origin, the COs were found more frequently in the NCO sites than in the sites without detected NCOs (P = 0.0401, Mann–Whitney test), suggesting colocalization of CO and NCO hotspots. A similar conclusion was previously reached in a mouse NCO study (Li et al. 2019).
Higher H3K4me3 and DMC1 hotspot activity in NCO and CO sites
To search for the differences between CO and NCO resolution pathways, we compared histone 3 lysine 4 trimethylation and DMC1 protein abundance at the CO, NCO, and DSB sites. The CO sites were filtered to the above-defined subset of DMC1-unique CO sites. NCO sites were filtered to those overlapping DSB sites (DMC1) in the (B6 × PWD)F1 database. We assumed the localization of CO, NCO, and DSB sites in the center of DMC1 sites and we filtered for the sites initiated by PRDM9B6. The frequency of these filtered NCO and CO events linearly increased with the H3K4me3 enrichment (medians 176 and 203, respectively), compared to general DSB sites (measured in (B6 × PWD)F1 males, median 40, P < 2.2 × 10⁻¹⁶, Kruskal–Wallis test). Similarly, the frequency of NCO and CO events linearly increased with the estimated DMC1 level, with the median values 1.33 and 1.70, respectively, significantly larger (P < 2.2 × 10⁻¹⁶, Kruskal–Wallis test) than in general DSB sites (median 0.46). Approximately 60% of NCO or CO events associated with (B6 × PWD)F1 hotspots were found in 20% of the strongest DMC1 hotspots (Supplementary Figure S2). These findings are comparable to the results obtained with a different combination of the Prdm9 alleles (Li et al. 2019). The slight difference between DMC1 and H3K4me3 heat/enrichment could be explained by different time needed for DSB repair, the second known component of DMC1 level. The COs, DSBs, and NCOs overlapped to a comparable extent with genes (47%, 54%, and 54%, respectively), in particular, with the gene promoters (3%, 3%, and 3%) and exons (3%, 5%, and 6%).
Deficiency of nonparental NCOs supports the DSB repair mechanism of infertility of mouse intersubspecific hybrids
During species evolution, the PRDM9 hotspots are gradually eroded due to the biased gene conversion (BGC) that favors the PRDM9 binding sites with lower affinity (Boulton et al. 1997; Myers et al. 2010; Baker et al. 2015; Tiemann-Boege et al. 2017). In hybrids between the mouse musculus subspecies represented by the PWD mouse strain and domesticus (strain B6), the presence of (partially) erased parental PRDM9 hotspots in one or other subspecies leads to their heterozygosity. The resulting PRDM9 binding site “asymmetry” (Davies et al. 2016) is suggested to explain the previous discovery of hybrid sterility of (PWD × B6)F1 males (Forejt 1996; Forejt et al. 2012; Bhattacharyya et al. 2013; Mukaj et al. 2020). It was hypothesized that the DSBs in asymmetric hotspots are more difficult to repair (Davies et al. 2016) and/or are fixed by the noncanonical sister-chromatid repair (Li et al. 2019). The consequent lack of symmetric sites necessary for recombination between homologs is suggested to explain synaptic defects of homologous chromosomes and male sterility (Mihola et al. 2009; Bhattacharyya et al. 2014; Gregorova et al. 2018; Wang et al. 2018).
If, as proposed, the repair of DSBs by homologous recombination is inhibited by the asymmetry of their initiation, then a lower than expected frequency of NCOs overlapping the asymmetric DMC1 hotspots could be expected. To examine the idea, we utilized the metric of “nonparental” DMC1 sites, also designated as “novel” in Smagulova et al. (2016). These sites are defined as missing in the DMC1 hotspot datasets of the parental B6 and PWD mouse strains but present in their F1 hybrids. Using this approach, we classified all NCO conversion tract sites according to their presence or absence within the B6, PWD, and (B6 × PWD)F1 DMC1 hotspot datasets (Davies et al. 2016) (Supplementary Table 3).
We utilized the “nonparental” metric as an alternative to the “asymmetry” metric from other studies (Davies et al. 2016; Hinch et al. 2019; Li et al. 2019) because it better matched our consomic model. More details on the relation between asymmetric and nonparental sites are given in Supplementary File 1 (Supplementary Text, Materials and methods, and Supplementary Figures S1 and S3).
In accordance with our prediction, lower than expected frequency of NCOs overlapping nonparental DMC1 hotspots was observed. As opposed to 35.3% (adjusted for DMC1 level) of expected nonparental conversion tracts, only 16.9% were actually observed (14 out of 83 Supplementary Table 3, see Materials and methods for details). The observed deficit was statistically significant (P = 0.000678, odds ratio = 0.2448, 95% CI = 0.0994–0.5160), logistic regression adjusted for the homologue-specific DMC1/H3K4me3/heat). In theory, such difference could be explained by an increased tendency towards CO repair in the nonparental sites. However, this alternative is highly unlikely since we found almost an identical (P = 0.8783, Fisher’s exact test) proportion of nonparental CO (17.8%) and NCO (16.9%) sites. Thus, we can conclude that the observed deficiency of nonparental NCOs matched up with the expected difficulties of repair from the homologous chromatid template due to the asymmetry of DSB hotspots.
NCO-associated GC bias
GC-BGC refers to a situation where GC in a conversion tract is transmitted to gametes more often than AT in a conversion tract from GC/AT heterozygotes (Duret and Galtier 2009; Clement and Arndt 2013). In our set of NCO sites, the bases A or T (so-called weakbases, w) were converted to bases C or G (“strong” bases, s) 3.1 times more often than vice versa, showing a GC bias of 76% [P = 3.184 × 10⁻⁸, two-tailed binomial test, #w->s/(#w->s + #s->w) = 87/(87 + 28)]. The observed GC bias is higher than 68% or 69% reported in humans (Williams et al. 2015; Halldorsson et al. 2016). Remarkably, we observed a similar GC bias in both single-SNP NCOs [77%, P = 1.275 × 10⁻⁴, 40/(40 + 12)] and multiple-SNP NCOs (“co-conversions”) [78%, P = 1.171 × 10⁻⁴, 47/(47 + 16)] (Figure 6A). Our findings regarding the observed GC bias, in particular, the GC bias in multiple-SNP NCOs, are in apparent contrast with the observation in a parallel study (Li et al. 2019) where the Prdm9Hum-initiated NCOs were analyzed in detail to see the effect of GC bias in Prdm9-uneroded genome. However, we also observed a “historical” GC bias in our NCO data and corresponding DSB data of others (Davies et al. 2016; Smagulova et al. 2016), suggesting that some of the NCO sites had already been converted earlier during evolution. This can largely explain the presented difference in the extent of GC bias, as described below.
Figure 6.

Genome-wide effects of NCO/CO gene conversions. (A) The observed NCO gene conversion converted the A/T “weak” base into the G/C “strong” base 3.4 times more frequently than vice versa, the “strong” base into the “weak” base. (B) GC bias already present due to historical recombination in (B6 × PWD)F1 hybrids in DMC1 sites15 and surrounding ± 1000 bp. The genome is GC-biased (and Prdm9-eroded) in the autosomes of both PWD and B6 strains. For PRDM9B6, the GC bias is calculated as #w->s/(#w->s + #s->w), where B6 bases are converted away by PWD bases. Reciprocally, for PRDM9PWD, the GC bias is calculated as #w->s/(#w->s + #s->w), where PWD bases are converted away by B6 bases. Each dot represents the average GC bias in the sliding window of 100 bp. (C) The CG bias (shown here for PRDM9B6 and PRDM9PWD) is higher for parental than for nonparental DMC1 sites. The GC bias was calculated analogously as in (B). (D) Histogram of distances of minimal possible NCO tracts from the inferred PRDM9B6 binding motif. NCO gene conversions disrupted the binding motif in 20.6% of cases.
Similarly, as in the identified NCO sites accompanied by gene conversions, we observed a GC bias in the surrounding nonconverted sites, both upstream and downstream from the NCO sites. Furthermore, we observed a GC bias in the known DSB sites (Davies et al. 2016; Smagulova et al. 2016) and their surroundings. As expected, the rate of GC bias decreased with the distance from the Prdm9 binding sites, with no GC bias in ∼500-bp distance (Figure 6B). The observed GC bias is most probably a consequence of historical meiotic gene conversions, similar to that reported in human and mice (Katzman et al. 2011; Clement and Arndt 2013; Pratto et al. 2014; Grey et al. 2017).
In addition, we observed a stronger GC bias for parental (63% for Prdm9B6, Figure 6C) than for nonparental sites (59%), suggesting that the process of gene conversion leading to GC bias lasted longer in evolution in parental sites and thus had affected more sites in the surroundings of the PRDM9 motif. Measured alternatively by the level of asymmetry, we also observed a stronger GC bias for the symmetric sites than for the asymmetric ones, as expected. Simultaneously, we found that there was an excess of PWD-B6 SNPs in the centers (±18 bp) of nonparental DMC1 sites (47.6%) than in the centers of parental DMC1 sites (30.0%). These findings are consistent with the view that the binding motifs of nonparental DMC1 sites were disrupted at early generations in the evolution, the binding sites were not used so frequently or even at all since that moment, and the gene conversions accompanying the repair of meiotic DSB at these sites created a smaller GC bias. Consistently, the parental DMC1 sites are still active in the parental strains and have created a higher GC bias.
To evaluate the GC-bias-building strength of the NCO repair mechanism(s), we adjusted the statistical tests of the observed GC bias for the expected historical GC bias. As an approximation of the historical GC bias, we considered 62.5%, the GC bias in the center of DSB sites in (B6 × PWD)F1 controlled by PRDM9B6, as an expected GC bias (a null model). In single-SNP NCOs, we observed a GC bias 23.1% stronger (95% CI = 1.1–39.9% stronger, P = 0.03187, two-tailed binomial test with P = 0.625) than the expected historical GC bias. The extent of adjusted GC bias [61.2% (=50.0% × 1.231)] was comparable to the previously reported values. Interestingly, the GC bias in multiple-SNP NCOs was only marginally stronger (by 19.4%, 95% CI = 0.7% weaker—35.6% stronger, P = 0.05088, two-tailed binomial test with P = 0.625) than the expected historical GC bias. As such, with the given sample size we could not show a difference from the previous human and mouse studies (Halldorsson et al. 2016; Li et al. 2019). Finally, the identified NCO gene conversions disrupted the PRDM9 motif in 20.6% of cases (Figure 6D), showing perfect agreement with the motif erosion localized in a single A3 hotspot (Cole et al. 2014).
Discussion
In mice, NCOs are the prevalent outcome of the repair of programmed meiotic DSBs, with the NCOs/COs overall ratio 9:1 based on cytological data and sperm typing (Guillon et al. 2005; Baudat and de Massy 2007; Cole et al. 2010; Balcova et al. 2016). Despite their prevalence and assumed functional significance for meiotic synapsis of homologous chromosomes (Romanienko and Camerini-Otero 2000; Guillon et al. 2005; Carofiglio et al. 2018), little is known about their genome-wide distribution and properties. This study, together with a recent report (Li et al. 2019), is the first genome/chromosome-wide study of NCO distribution and characterization in mice. We used whole-genome sequencing to detect and characterize a unique dataset of 94 NCO events in 10 mouse chromosomes using the B6.PWD-Chr # panel of mouse intersubspecific consomic strains. To compare the chromosome-wide distribution and colocalization of NCOs and COs, we identified nearly 1500 CO events resulting from (B6 × PWD)F1 meioses.
Previous studies of individual hotspots in mice and humans determined the average length of CO-associated conversion tracts to be ∼500 bp (Jeffreys and May 2004; Guillon et al. 2005; Cole et al. 2014). The NCO gene conversion tracts were much shorter, 50–300 bp at the mouse Psmb9 hotspot and two hotspots on chromosome 1 (Guillon and de Massy 2002; de Boer et al. 2015) and 55–290 bp at the MHC hotspot in human chromosome 6 (Jeffreys and May 2004). More recently, a human genome-wide study based on Illumina SNP arrays indicated the multiple-SNP NCO gene conversion tract length in the range of 100–1000 bp (Williams et al. 2015), while most NCO events involved only one SNP due to low SNP density. Thus our estimate, 32 bp, based on the screen of 10 mouse chromosomes is much shorter than reported previously for individual hotspots but close to another recent mouse study showing 30 and 41 bp for two different Prdm9 alleles (Li et al. 2019). Another difference from the human studies is an almost complete absence of complex NCO gene conversions in our dataset. Only 1 out of 94 NCO events was a 231 bp long complex conversion interrupted by one nonconverted SNP in contrast to 46% or 65% of complex events found in human studies (Williams et al. 2015; Halldorsson et al. 2016).
Until recently, the studies of NCOs in mice were based on the analysis of individual recombination hotspots (Guillon and de Massy 2002; Ng et al. 2008; Cole et al. 2010, 2014; de Boer et al. 2015). Our finding of 96% colocalization of NCO conversion tracts with DMC1 hotspots confirmed both the origin of NCOs from meiotic DSBs and our efficiency to filter out the false-positive events. Moreover, the almost exclusive occurrence of NCO events within DMC1 hotspots testifies against a significant share of female-specific NCOs in our dataset, since the DMC1 data used for comparison came exclusively from the males, while our identified NCOs were of male and female origin. Indeed, the first study measuring the DMC1 signals in female meiosis (Brick et al. 2018) showed only a negligible sex difference in their recombination hotspots. What differed was the activity of DMC1 hotspots corresponding to the variations in H3K4 trimethylation and affected in males by DNA methylation. The findings by Brick et al. (2018) on the localization of DSBs were recently confirmed and extended to NCOs (Li et al. 2019).
The mechanism responsible for the decision between CO and NCO resolution is largely unknown. Recently, genome-wide studies of NCOs based on single sperm whole-genome sequencing indicated that binding of PRDM9 protein to the uncut template homolog decreases the time necessary for homolog recognition and single-strand DNA invasion and increases the chance to process the recombination intermediate into CO (Hinch et al. 2019; Li et al. 2019). The same studies confirmed the previous findings of nonrandom distribution of COs along chromosomes in male meiosis of mice and humans, showing CO excess in subtelomeric regions and their paucity at the centromeric ends (Broman et al. 1998; Baudat and de Massy 2007; Cox et al. 2009; Liu et al. 2014; de Boer et al. 2015). Our findings of the excess of COs in the subtelomeric regions and in the second decile of chromosomal length in (B6 × PWD) male meiosis and the significant deficit of NCOs in the 10th decile of relative chromosome length are supported by these studies and show that DNA DSBs at the subtelomeric regions are more prone to be resolved as COs relative to NCOs when compared with other parts of the genome.
NCOs are associated with BGC, which results in uneven recovery of each allele in the next generation and can be generated by recombination initiation bias when the PRDM9 binding motif of the recipient haplotype has higher probability to be targeted by SPO11 than the donor (template) haplotype. The mechanism of GC-biased gene conversion (gBGC) can be explained by biased repair of mismatched AT/GC alleles in heteroduplex DNA favoring strong G/C over weak A/T base pairs (Duret and Galtier 2009; Li et al. 2019) or subtle preference of the A/T allele at initiation of recombination (Webb et al. 2008; Li et al. 2019). The meiotic drive in favor of the GC allele (∼68%) was documented in the human genome (Odenthal-Hesse et al. 2014; Arbeithuber et al. 2015; Williams et al. 2015; Halldorsson et al. 2016) and more recently in mice (60–68%) (Li et al. 2019). In this study, a significant GC bias was detected genome-wide in the NCO sites (76%) and in the surrounding nonconverted sites, suggesting the DSB repair activity in the past. The GC bias was gradually decreasing outwards from the DMC1 center, with no bias in the ±500 bp distance, similar to that reported earlier (Clement and Arndt 2013). This fading effect most likely resulted from the historical recombination accompanied by NCO and CO gene conversions, which had migrated from the DSB initiation site. The humanized Prdm9Hum binding sites have no history of erosion in classical (e.g. C57BL/6J) or wild-derived laboratory (e.g. PWD/Ph, CAST/EiJ) mouse genomes and the surrounding regions are not GC-biased. Li et al. (2019) observed the differences between NCO gene conversion tracts initiated by PRDM9Hum (41 bp) and PRDM9Cast (mean = 30 bp) in the genomes of B6 and CAST crosses. Here, we showed the mean conversion tract length of 32 bp, identical to that of PRDM9Cast, for the NCO sites almost exclusively initiated by PRDM9B6. We suggest a possible relationship between the degree of PRDM9 binding site erosion and the length of a gene conversion tract that is not based on the inherent properties of the Prdm9 alleles. Rather, the mean length of conversion tracts could reflect the preceding activity of PRDM9 in the binding site and surrounding regions and consequent GC bias. Such GC-biased regions are significantly more resistant to be converted again, leading to shorter gene conversion lengths. Consequently, this could imply a gradual decrease in time of building the GC bias as the surrounding bases of the PRDM9 binding site become increasingly G/C rich, which limits the tract length.
Asymmetric binding of PRDM9 to allelic sites was identified in several combinations of intersubspecific F1 hybrids (Baker et al. 2015; Davies et al. 2016; Smagulova et al. 2016). It was proposed that excessive asymmetry of DNA DSB hotspots is the key feature of early meiotic arrest in our (PWD × B6)F1 model of hybrid sterility (Davies et al. 2016). Although many aspects of the role of Prdm9 in hybrid sterility remain to be clarified (Paigen and Petkov 2018; Lustyk et al. 2019), new data bring additional support for the DSB asymmetry hypothesis (Gregorova et al. 2018; Wang et al. 2018; Hinch et al. 2019; Li et al. 2019). The repair of asymmetric DSBs can be delayed or aborted, resulting in chromosome breakage and their deficiency in hybrids. The present findings support the idea that nonparental/asymmetric sites are difficult for repair by homologous recombination, thus offering potential implications for the molecular mechanism of Prdm9-controlled hybrid sterility in mice.
Supplementary Material
Acknowledgments
The authors thank Simon Myers and Ran Li (University of Oxford, UK) for sharing, before publishing, the filters to identify true NCOs, and Sarka Takacova for comments.
Funding
This study was supported by the grant from the Ministry of Education, Youth and Sports, LM 2018126 Czech Centre for Phenogenomics (to JF), by the Grant Agency of the Czech Republic Grant Nos. 17-04364S (to EP) and 20-04075S (to JF), and by Charles Univesity Grant Agency Grant No. 435416 (to VG).
Conflicts of interest
None declared.
Literature cited
- Arbeithuber B, Betancourt AJ, Ebner T, Tiemann-Boege I.. 2015. Crossovers are associated with mutation and biased gene conversion at recombination hotspots. Proc Natl Acad Sci USA. 112:2109–2114. [DOI] [PMC free article] [PubMed] [Google Scholar]
- Baker CL, Kajita S, Walker M, Saxl RL, Raghupathy N, et al. 2015. PRDM9 drives evolutionary erosion of hotspots in Mus musculus through haplotype-specific initiation of meiotic recombination. PLoS Genet. 11:e1004916. [DOI] [PMC free article] [PubMed] [Google Scholar]
- Baker CL, Walker M, Kajita S, Petkov PM, Paigen K.. 2014. PRDM9 binding organizes hotspot nucleosomes and limits Holliday junction migration. Genome Res. 24:724–732. [DOI] [PMC free article] [PubMed] [Google Scholar]
- Balcova M, Faltusova B, Gergelits V, Bhattacharyya T, Mihola O, et al. 2016. Hybrid sterility locus on chromosome X controls meiotic recombination rate in mouse. PLoS Genet. e1005906. 12: [DOI] [PMC free article] [PubMed] [Google Scholar]
- Baudat F, Buard J, Grey C, Fledel-Alon A, Ober C, et al. 2010. PRDM9 is a major determinant of meiotic recombination hotspots in humans and mice. Science. 327:836–840. [DOI] [PMC free article] [PubMed] [Google Scholar]
- Baudat F, de Massy B.. 2007. Regulating double-stranded DNA break repair towards crossover or non-crossover during mammalian meiosis. Chromosome Res. 15:565–577. [DOI] [PubMed] [Google Scholar]
- Baudat F, Manova K, Yuen JP, Jasin M, Keeney S.. 2000. Chromosome synapsis defects and sexually dimorphic meiotic progression in mice lacking Spo11. Mol Cell. 6:989–998. [DOI] [PubMed] [Google Scholar]
- Bhattacharyya T, Gregorova S, Mihola O, Anger M, Sebestova J, et al. 2013. Mechanistic basis of infertility of mouse intersubspecific hybrids. Proc Natl Acad Sci USA. 110:E468–E477. [DOI] [PMC free article] [PubMed] [Google Scholar]
- Bhattacharyya T, Reifova R, Gregorova S, Simecek P, Gergelits V, et al. 2014. X chromosome control of meiotic chromosome synapsis in mouse inter-subspecific hybrids. PLoS Genet. 10:e1004088. [DOI] [PMC free article] [PubMed] [Google Scholar]
- Boulton A, Myers RS, Redfield RJ.. 1997. The hotspot conversion paradox and the evolution of meiotic recombination. Proc Natl Acad Sci USA. 94:8058–8063. [DOI] [PMC free article] [PubMed] [Google Scholar]
- Brick K, Thibault-Sennett S, Smagulova F, Lam K-WG, Pu Y, et al. 2018. Extensive sex differences at the initiation of genetic recombination. Nature. 561:338–342. [DOI] [PMC free article] [PubMed] [Google Scholar]
- Broman KW, Murray JC, Sheffield VC, White RL, Weber JL.. 1998. Comprehensive human genetic maps: individual and sex-specific variation in recombination. Am J Hum Genet. 63:861–869. [DOI] [PMC free article] [PubMed] [Google Scholar]
- Carofiglio F, Sleddens-Linkels E, Wassenaar E, Inagaki A, van Cappellen WA, et al. 2018. Repair of exogenous DNA double-strand breaks promotes chromosome synapsis in SPO11-mutant mouse meiocytes, and is altered in the absence of HORMAD1. DNA Repair (Amst). 63:25–38. [DOI] [PubMed] [Google Scholar]
- Churchill GA, Airey DC, Allayee H, Angel JM, Attie AD, et al. ; Complex Trait Consortium. 2004. The Collaborative Cross, a community resource for the genetic analysis of complex traits. Nat Genet. 36:1133–1137. [DOI] [PubMed] [Google Scholar]
- Clement Y, Arndt PF.. 2013. Meiotic recombination strongly influences GC-content evolution in short regions in the mouse genome. Mol Biol Evol. 30:2612–2618. [DOI] [PubMed] [Google Scholar]
- Cole F, Baudat F, Grey C, Keeney S, de Massy B, et al. 2014. Mouse tetrad analysis provides insights into recombination mechanisms and hotspot evolutionary dynamics. Nat Genet. 46:1072–1080. [DOI] [PMC free article] [PubMed] [Google Scholar]
- Cole F, Kauppi L, Lange J, Roig I, Wang R, et al. 2012. Homeostatic control of recombination is implemented progressively in mouse meiosis. Nat Cell Biol. 14:424–430. [DOI] [PMC free article] [PubMed] [Google Scholar]
- Cole F, Keeney S, Jasin M.. 2010. Comprehensive, fine-scale dissection of homologous recombination outcomes at a hot spot in mouse meiosis. Mol Cell. 39:700–710. [DOI] [PMC free article] [PubMed] [Google Scholar]
- Cox A, Ackert-Bicknell CL, Dumont BL, Ding Y, Bell JT, et al. 2009. A new standard genetic map for the laboratory mouse. Genetics. 182:1335–1344. [DOI] [PMC free article] [PubMed] [Google Scholar]
- Davies B, Hatton E, Altemose N, Hussin JG, Pratto F, et al. 2016. Re-engineering the zinc fingers of PRDM9 reverses hybrid sterility in mice. Nature. 530:171–176. [DOI] [PMC free article] [PubMed] [Google Scholar]
- de Boer E, Jasin M, Keeney S.. 2015. Local and sex-specific biases in crossover vs. noncrossover outcomes at meiotic recombination hot spots in mice. Genes Dev. 29:1721–1733. [DOI] [PMC free article] [PubMed] [Google Scholar]
- Din W, Anand R, Boursot P, Darviche D, Dod B, et al. 1996. Origin and radiation of the house mouse: clues from nuclear genes. J Evol Biol. 9:519–539. [Google Scholar]
- Duret L, Galtier N.. 2009. Biased gene conversion and the evolution of mammalian genomic landscapes. Annu Rev Genom Hum Genet. 10:285–311. [DOI] [PubMed] [Google Scholar]
- Forejt J. 1996. Hybrid sterility in the mouse. Trends Genet. 12:412–417. [DOI] [PubMed] [Google Scholar]
- Forejt J, Pialek J, Trachtulec Z.. 2012. Hybrid male sterility genes in the mouse subspecific crosses. In: Macholan M, Baird SJE, Muclinger P, Pialek J, editors. Evolution of the House Mouse. Cambridge, UK: Cambridge University Press. p. 482–503. [Google Scholar]
- Geraldes A, Basset P, Gibson B, Smith KL, Harr B, et al. 2008. Inferring the history of speciation in house mice from autosomal, X-linked, Y-linked and mitochondrial genes. Mol Ecol. 17:5349–5363. [DOI] [PMC free article] [PubMed] [Google Scholar]
- Goldfarb T, Lichten M.. 2010. Frequent and efficient use of the sister chromatid for DNA double-strand break repair during budding yeast meiosis. PLoS Biol. 8:e1000520. [DOI] [PMC free article] [PubMed] [Google Scholar]
- Gray S, Cohen PE.. 2016. Control of meiotic crossovers: from double-strand break formation to designation. Annu Rev Genet. 50:175–210. [DOI] [PMC free article] [PubMed] [Google Scholar]
- Gregorova S, Divina P, Storchova R, Trachtulec Z, Fotopulosova V, et al. 2008. Mouse consomic strains: exploiting genetic divergence between Mus m. musculus and Mus m. domesticus subspecies. Genome Res. 18:509–515. [DOI] [PMC free article] [PubMed] [Google Scholar]
- Gregorova S, Forejt J.. 2000. PWD/Ph and PWK/Ph inbred mouse strains of Mus m. musculus subspecies—a valuable resource of phenotypic variations and genomic polymorphisms. Folia Biol (Praha). 46:31–41. [DOI] [PubMed] [Google Scholar]
- Gregorova S, Gergelits V, Chvatalova I, Bhattacharyya T, Valiskova B, et al. 2018. Modulation of Prdm9-controlled meiotic chromosome asynapsis overrides hybrid sterility in mice. Elife. 7:e34282. doi:34210.37554/eLife.34282. [DOI] [PMC free article] [PubMed] [Google Scholar]
- Grey C, Clement JA, Buard J, Leblanc B, Gut I, et al. 2017. In vivo binding of PRDM9 reveals interactions with noncanonical genomic sites. Genome Res. 27:580–590. [DOI] [PMC free article] [PubMed] [Google Scholar]
- Guillon H, Baudat F, Grey C, Liskay RM, de Massy B.. 2005. Crossover and noncrossover pathways in mouse meiosis. Mol Cell. 20:563–573. [DOI] [PubMed] [Google Scholar]
- Guillon H, de Massy B.. 2002. An initiation site for meiotic crossing-over and gene conversion in the mouse. Nat Genet. 32:296–299. [DOI] [PubMed] [Google Scholar]
- Halldorsson BV, Hardarson MT, Kehr B, Styrkarsdottir U, Gylfason A, et al. 2016. The rate of meiotic gene conversion varies by sex and age. Nat Genet. 48:1377–1384. [DOI] [PMC free article] [PubMed] [Google Scholar]
- Hinch AG, Zhang G, Becker PW, Moralli D, Hinch R, et al. 2019. Factors influencing meiotic recombination revealed by whole-genome sequencing of single sperm. Science. 363:eaau8861. [DOI] [PMC free article] [PubMed] [Google Scholar]
- Huang T, Yuan S, Gao L, Li M, Yu X, et al. 2020. The histone modification reader ZCWPW1 links histone methylation to PRDM9-induced double-strand break repair. Elife. 9:e53459. [DOI] [PMC free article] [PubMed] [Google Scholar]
- Ideraabdullah FY, de la Casa-Esperon E, Bell TA, Detwiler DA, Magnuson T, et al. 2004. Genetic and haplotype diversity among wild-derived mouse inbred strains. Genome Res. 14:1880–1887. [DOI] [PMC free article] [PubMed] [Google Scholar]
- Jeffreys AJ, May CA.. 2004. Intense and highly localized gene conversion activity in human meiotic crossover hot spots. Nat Genet. 36:151–156. [DOI] [PubMed] [Google Scholar]
- Katzman S, Capra JA, Haussler D, Pollard KS.. 2011. Ongoing GC-biased evolution is widespread in the human genome and enriched near recombination hot spots. Genome Biol Evol. 3:614–626. [DOI] [PMC free article] [PubMed] [Google Scholar]
- Kauppi L, Barchi M, Lange J, Baudat F, Jasin M, et al. 2013. Numerical constraints and feedback control of double-strand breaks in mouse meiosis. Genes Dev. 27:873–886. [DOI] [PMC free article] [PubMed] [Google Scholar]
- Keane TM, Goodstadt L, Danecek P, White MA, Wong K, et al. 2011. Mouse genomic variation and its effect on phenotypes and gene regulation. Nature. 477:289–294. [DOI] [PMC free article] [PubMed] [Google Scholar]
- Keeney S, Baudat F, Angeles M, Zhou ZH, Copeland NG, et al. 1999. A mouse homolog of the Saccharomyces cerevisiae meiotic recombination DNA transesterase Spo11p. Genomics. 61:170–182. [DOI] [PubMed] [Google Scholar]
- Keeney S, Giroux CN, Kleckner N.. 1997. Meiosis-specific DNA double-strand breaks are catalyzed by Spo11, a member of a widely conserved protein family. Cell. 88:375–384. [DOI] [PubMed] [Google Scholar]
- Lam I, Mohibullah N, Keeney S.. 2017. Sequencing Spo11 oligonucleotides for mapping meiotic DNA double-strand breaks in yeast. Methods Mol Biol. 1471:51–98. [DOI] [PubMed] [Google Scholar]
- Lange J, Yamada S, Tischfield SE, Pan J, Kim S, et al. 2016. The landscape of mouse meiotic double-strand break formation, processing, and repair. Cell. 167:695–708.e6. [DOI] [PMC free article] [PubMed] [Google Scholar]
- Li R, Bitoun E, Altemose N, Davies RW, Davies B, et al. 2019. A high-resolution map of non-crossover events reveals impacts of genetic diversity on mammalian meiotic recombination. Nat Commun. 10:3900. [DOI] [PMC free article] [PubMed] [Google Scholar]
- Littrell J, Tsaih SW, Baud A, Rastas P, Solberg-Woods L, et al. 2018. A high-resolution genetic map for the laboratory rat. G3 (Bethesda). 3:2241–2248. [DOI] [PMC free article] [PubMed] [Google Scholar]
- Liu EY, Morgan AP, Chesler EJ, Wang W, Churchill GA, et al. 2014. High-resolution sex-specific linkage maps of the mouse reveal polarized distribution of crossovers in male germline. Genetics. 197:91–106. [DOI] [PMC free article] [PubMed] [Google Scholar]
- Lustyk D, Kinsky S, Ullrich KK, Yancoskie M, Kasikova L, et al. 2019. Genomic structure of Hstx2 modifier of Prdm9-dependent hybrid male sterility in mice. Genetics. 213:1047–1063. [DOI] [PMC free article] [PubMed] [Google Scholar]
- Mihola O, Trachtulec Z, Vlcek C, Schimenti JC, Forejt J.. 2009. A mouse speciation gene encodes a meiotic histone H3 methyltransferase. Science. 323:373–375. [DOI] [PubMed] [Google Scholar]
- Mukaj A, Pialek J, Fotopulosova V, Morgan AP, Odenthal-Hesse L, et al. 2020. Prdm9 inter-subspecific interactions in hybrid male sterility of house mouse. Mol Biol Evol.37:3423–3438. [DOI] [PMC free article] [PubMed] [Google Scholar]
- Myers S, Bowden R, Tumian A, Bontrop RE, Freeman C, et al. 2010. Drive against hotspot motifs in primates implicates the PRDM9 gene in meiotic recombination. Science. 327:876–879. [DOI] [PMC free article] [PubMed] [Google Scholar]
- Ng SH, Parvanov E, Petkov PM, Paigen K.. 2008. A quantitative assay for crossover and noncrossover molecular events at individual recombination hotspots in both male and female gametes. Genomics. 92:204–209. [DOI] [PMC free article] [PubMed] [Google Scholar]
- Odenthal-Hesse L, Berg IL, Veselis A, Jeffreys AJ, May CA.. 2014. Transmission distortion affecting human noncrossover but not crossover recombination: a hidden source of meiotic drive. PLoS Genet. 10:e1004106. [DOI] [PMC free article] [PubMed] [Google Scholar]
- Paigen K, Petkov PM.. 2018. PRDM9 and its role in genetic recombination. Trends Genet. 34:291–300. [DOI] [PMC free article] [PubMed] [Google Scholar]
- Parvanov ED, Petkov PM, Paigen K.. 2010. Prdm9 controls activation of mammalian recombination hotspots. Science. 327:835–835. [DOI] [PMC free article] [PubMed] [Google Scholar]
- Powers NR, Parvanov ED, Baker CL, Walker M, Petkov PM, et al. 2016. The meiotic recombination activator PRDM9 trimethylates both H3K36 and H3K4 at recombination hotspots in vivo. PLoS Genet. 12:e1006146. [DOI] [PMC free article] [PubMed] [Google Scholar]
- Pratto F, Brick K, Khil P, Smagulova F, Petukhova GV, et al. 2014. DNA recombination. Recombination initiation maps of individual human genomes. Science. 346:1256442. [DOI] [PMC free article] [PubMed] [Google Scholar]
- Romanienko PJ, Camerini-Otero RD.. 2000. The mouse Spo11 gene is required for meiotic chromosome synapsis. Mol Cell. 6:975–987. [DOI] [PubMed] [Google Scholar]
- Shen B, Jiang J, Seroussi E, Liu GE, Ma L.. 2018. Characterization of recombination features and the genetic basis in multiple cattle breeds. BMC Genomics. 19:304. [DOI] [PMC free article] [PubMed] [Google Scholar]
- Smagulova F, Brick K, Pu YM, Camerini-Otero RD, Petukhova GV.. 2016. The evolutionary turnover of recombination hot spots contributes to speciation in mice. Genes Dev. 30:266–280. [DOI] [PMC free article] [PubMed] [Google Scholar]
- Smagulova F, Gregoretti IV, Brick K, Khil P, Camerini-Otero RD, et al. 2011. Genome-wide analysis reveals novel molecular features of mouse recombination hotspots. Nature. 472:375–378. [DOI] [PMC free article] [PubMed] [Google Scholar]
- Tiemann-Boege I, Schwarz T, Striedner Y, Heissl A.. 2017. The consequences of sequence erosion in the evolution of recombination hotspots. Philos Trans R Soc Lond B Biol Sci. 372: 20160462. [DOI] [PMC free article] [PubMed] [Google Scholar]
- Wang L, Valiskova B, Forejt J.. 2018. Cisplatin-induced DNA double-strand breaks promote meiotic chromosome synapsis in PRDM9-controlled mouse hybrid sterility. Elife. 7:e42511. [DOI] [PMC free article] [PubMed] [Google Scholar]
- Webb AJ, Berg IL, Jeffreys A.. 2008. Sperm cross-over activity in regions of the human genome showing extreme breakdown of marker association. Proc Natl Acad Sci USA. 105:10471–10476. [DOI] [PMC free article] [PubMed] [Google Scholar]
- Wells D, Bitoun E, Moralli D, Zhang G, Hinch A, et al. 2020. ZCWPW1 is recruited to recombination hotspots by PRDM9 and is essential for meiotic double strand break repair. Elife. 9:e53392. [DOI] [PMC free article] [PubMed] [Google Scholar]
- Wickham HAverick MBryan JChang WMcgowan L, et al. 2019. . Welcome to the Tidyverse. JOSS. 4:1686. [Google Scholar]
- Williams AL, Genovese G, Dyer T, Altemose N, Truax K, et al. ; on behalf of the T2D-GENES Consortium. 2015. Non-crossover gene conversions show strong GC bias and unexpected clustering in humans. Elife. 4:e04637. [DOI] [PMC free article] [PubMed] [Google Scholar]
Associated Data
This section collects any data citations, data availability statements, or supplementary materials included in this article.
Supplementary Materials
Data Availability Statement
The NGS data are deposited under SRA BioProject number PRJNA564925.
Supplementary material is available at GENETICS online.