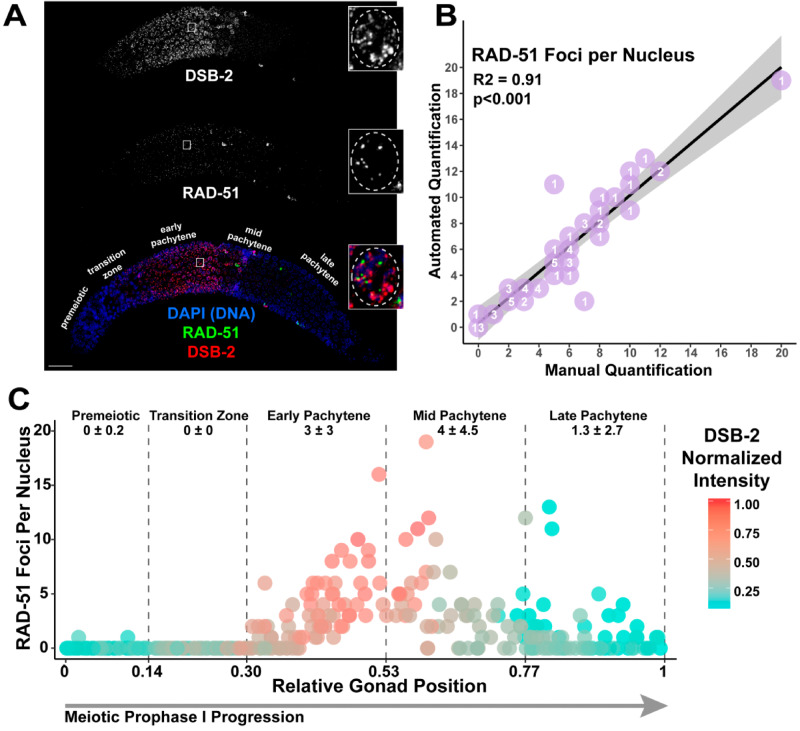
Figure 2.
Gonad Analysis Pipeline enables germline-wide single nucleus assessment of double-strand DNA break (DSB) levels. (A) Immunofluorescence image of a C. elegans hermaphrodite germline stained with DAPI (DNA; blue), DSB-2 (red), and RAD-51 (green). Scale bar represents 20 μm. Inset images display a representative mid-pachytene nucleus with characteristic DSB-2 and RAD-51 staining. The location of inset image within the whole germline image is indicated by a white box on the whole germline image. For clarity, a dashed line is used in the inset image to emphasize the region of the image containing the nucleus of interest. Specific meiotic stages were determined by DNA morphology. (B) Comparison of data from automated quantification of RAD-51 foci associated with individual nuclei to data from manual quantification of RAD-51 foci within those same nuclei analyzed by the automated system (n =70 nuclei derived from three separate germlines). The number listed on each point (purple) indicates the number of nuclei scored with that result. The linear regression line is displayed as a black line, whereas the gray-shaded area represents the 95% confidence interval of this analysis. (C) Visualization of RAD-51 foci counts and DSB-2 normalized mean fluorescence intensity of individual nuclei across gonads (n =2). The RAD-51 foci counts and DSB-2 normalized intensity values of 295 individual nuclei are displayed. DSB-2 mean intensity was normalized within analyzed gonads by the highest recorded DSB-2 mean fluorescence intensity among nuclei. Normalized DSB-2 intensity is indicated with a color gradient from red (highest intensity) to blue (lowest intensity). Vertical dashed lines indicate the average position in which nuclei within each gonad transition between each successive stage of meiotic prophase I (as indicated by text in the figure), determined by DAPI morphology. The deviation between these transition points was <0.01 between the germlines. Numbers below the text demarcating each respective meiotic stage in the germline indicate the mean number of RAD-51 foci ± the standard deviation of RAD-51 foci among nuclei within that region.

