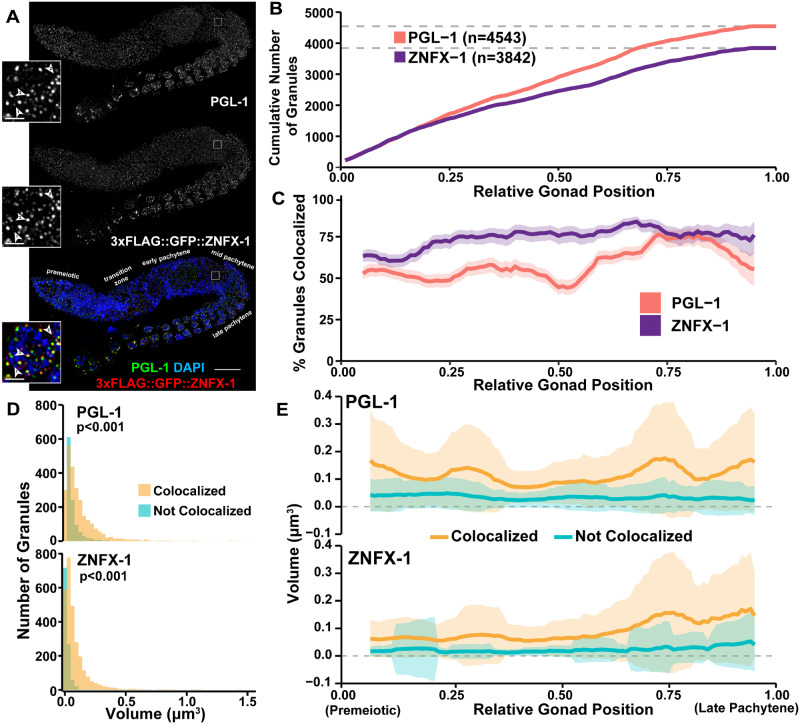
Figure 4.
Assessment of P-granule components across meiotic prophase I. (A) Immunofluorescence image of a C. elegans hermaphrodite germline stained with DAPI (DNA), PGL-1 (green), and 3xFLAG::GFP::ZNFX-1 (red). Specific meiotic stages were determined by DNA morphology. Inset images show a single mid-pachytene nucleus. The location of these inset nuclei within the original whole germline image are indicated by white boxes on the whole gonad images. Numbered arrowheads, respectively, indicate examples of: (1) a PGL-1 focus not colocalized with ZNFX-1, (2) a ZNFX-1 focus not colocalized with PGL-1, and (3) colocalized PGL-1 and ZNFX-1 foci. The scale bar in the whole germline image represents 20 μm, whereas the scale bars in the insets represent 2 μm. (B) Cumulative number of PGL-1 and ZNFX-1 foci identified across the germline. (C) Percent of total PGL-1 and ZNFX-1 foci which are, respectively, colocalized within a sliding window representing 10% of total germline length. Shaded area represents 95% Binomial Confidence Interval. (D) Histograms displaying the distribution of PGL-1 and ZNFX-1 foci volumes, distinguishing between foci colocalized (yellow) or not colocalized (blue) with other respective protein. P values were calculated from comparisons between colocalized and non-colocalized focus volumes by Mann–Whitney U test. (E) Mean volume of PGL-1 and ZNFX-1 foci in a sliding window representing 10% of total germline length, distinguishing between foci which are (yellow) or are not (blue) colocalized. Shaded area represents standard deviation.

