

Abstract
Rationale & Objective:
Hyperuricemia is implicated in the development and progression of chronic kidney disease (CKD). Verinurad is a novel, potent, specific urate reabsorption inhibitor. We evaluated the effects of intensive urate-lowering therapy with verinurad combined with the xanthine oxidase (XO) inhibitor febuxostat on albuminuria in patients with hyperuricemia and type 2 diabetes mellitus (T2DM).
Study Design:
Phase 2, multicenter, prospective, randomized, double-blind, parallel-group, placebo-controlled trial.
Setting & Participants:
Patients aged ≥18 years with hyperuricemia, albuminuria, and T2DM.
Intervention:
Patients randomized 1:1 to verinurad (9 mg) and febuxostat (80 mg) or matched placebo once daily for 24 weeks.
Outcomes:
The primary endpoint was change in urine albumin-to-creatinine ratio (UACR) from baseline after 12 weeks’ treatment. Secondary endpoints included safety and tolerability, and effect on kidney function.
Results:
In total, 60 patients were enrolled (n=32, verinurad and febuxostat; n=28, placebo). Verinurad and febuxostat resulted in reductions in UACR versus placebo at 1, 12, and 24 weeks of −38.6 (90% CI −60.9, −3.6), −39.4% (90% CI −61.8, −3.8) and −49.3% (90% CI −68.2, −19.0), respectively. Treatment with verinurad and febuxostat was associated with reductions in serum urate (sUA) compared with placebo at 12 (−59.6%) and 24 (−63.7%) weeks. No clinically meaningful changes were observed in estimated glomerular filtration rates (eGFR), serum creatinine, or serum cystatin C concentrations. Verinurad and febuxostat were well tolerated.
Limitations:
Sample size and study duration were insufficient to detect changes in eGFR and patients with stage 4 and 5 CKD were excluded.
Conclusions:
Verinurad and febuxostat reduced albuminuria and lowered sUA concentrations in patients with T2DM, albuminuria, and hyperuricemia. The joint impact of verinurad and XO inhibition on renoprotection is being further explored in clinical studies.
Keywords: albuminuria, chronic kidney disease, febuxostat, hyperuricemia, type 2 diabetes, urate lowering, verinurad
Plain language summary:
People with chronic kidney disease and type 2 diabetes are at risk of deteriorating kidney function and progressive chronic kidney disease. Leaking albumin in the urine is an early marker of kidney damage and is associated with further deterioration. In this study, the combination of verinurad and febuxostat reduced the amount of albumin in the urine and uric acid in the blood more than the placebo. The treatment was generally well tolerated, with nausea and dizziness the most common adverse events seen after verinurad and febuxostat treatment. Overall, verinurad and febuxostat may help to protect the kidneys against further decline in people with chronic kidney disease and type 2 diabetes.
Introduction
Type 2 diabetes mellitus (T2DM) remains the leading cause of end-stage renal disease,1 with a global increase in chronic kidney disease (CKD) deaths due to T2DM of 39.5% between 2005 and 2015.2 Despite advances in clinical care, including increased use of renin-angiotensin system (RAS) inhibitors and implementation of evidence-based guidelines, patients with T2DM continue to have high residual risk of progression to CKD and cardiovascular (CV) events, especially those with albuminuria.3 Therefore, lowering albuminuria in patients with T2DM remains a major goal in order to prevent CKD progression and its consequences,4 with albuminuria emerging as a biomarker for CKD progression and a surrogate endpoint for longer term renal outcomes.5, 6
Hyperuricemia, characterized by elevated serum urate (sUA) concentrations, is associated with the presence and development of CKD. It is also an independent predictor for the development of microalbuminuria, with risk greatest for those with the highest concentrations of sUA.7 Furthermore, evidence from clinical trials suggests lowering sUA through xanthine oxidase (XO) inhibition may slow kidney disease progression and reduce major renal and CV events.8–10 Underpinning these clinical observations are experimental animal models, which suggest hyperuricemia induces renal injury through multiple pathways, including oxidative stress, vascular smooth muscle proliferation, endothelial dysfunction, and RAS dysregulation.11–13
Intensive lowering of sUA may improve kidney protection above and beyond existing renal protection strategies by reducing albuminuria and risk of CKD progression. Verinurad is a novel, highly potent, specific urate transporter 1 (URAT1) inhibitor that reduces sUA levels in patients with gout.14, 15 By combining verinurad with febuxostat, a competitive XO inhibitor commonly used to treat hyperuricemia in patients with gout,16 an intensive urate-lowering effect may be achieved, potentially leading to greater kidney protection. Preliminary studies in healthy volunteers have shown that the novel combination of verinurad and febuxostat provides greater reductions in sUA levels than either drug alone,17 with dose-dependent reductions in sUA levels of up to 80% in patients with gout, and little change in urinary urate levels from baseline.18, 19
We hypothesized that an intensive urate-lowering strategy with a combination of verinurad and febuxostat would reduce sUA concentrations and lead to measurable benefits on kidney function. The aim of this trial was to evaluate the impact of this combination on albuminuria in hyperuricemic patients with T2DM, assess any additional effects on renal function, and examine the safety profile of this novel combination.
Methods
Study Design
This was a multicenter, prospective, randomized, double-blind, parallel-group, placebo-controlled trial in hyperuricemic patients with T2DM and albuminuria on standard-of-care treatment (NCT03118739). The primary objective was to assess the effect of verinurad and febuxostat on albuminuria. Secondary objectives included evaluation of kidney function, CV health, and assessment of metabolic effects. The trial was designed and conducted in accordance with the ethical principles originating in the Declaration of Helsinki and in compliance with the International Council for Harmonisation and Good Clinical Practice. Ethical review and approval of the study protocol was provided by the Advarra Institutional Review Board.
Patients were randomized 1:1 to once-daily oral verinurad (9 mg) and febuxostat (80 mg) or matched placebo. Randomization codes were assigned by the investigator sequentially using the AstraZeneca randomization system (AZRand). Patients received treatment for 24 weeks and were evaluated at multiple predefined time points for changes in outcome parameters. Patients were followed up for 4 weeks after treatment had ended to assess the effects of treatment discontinuation.
As previous studies have reported transient elevations in serum creatinine with URAT1 inhibitors,20, 21 strict discontinuation criteria were applied in the event of creatinine elevations at any time during the study. This included serum creatinine elevation ≥ 3.0 x baseline, absolute serum creatinine value ≥ 4.0 mg/dL, or an estimated creatinine clearance (CrCl) value < 25 mL/min.
Study Participants
Adults aged ≥ 18 years with T2DM, sUA concentration ≥ 6.0 mg/dL, an estimated glomerular filtration rate (eGFR) ≥ 30 mL/min/1.73 m2, and a urinary albumin-to-creatinine ratio (UACR) 30–3500 mg/g were eligible for participation. Patients were required to be on a stable dose of a RAS inhibitor (unless contraindicated, not tolerated, unavailable, or considered unsuitable by the investigator) for ≥ 1 month prior to randomization.
Key exclusion criteria were prior treatment with any urate-lowering agents in the 6 months before randomization; uncontrolled hypertension (systolic blood pressure > 180 mmHg); history of gout requiring prophylaxis with non-steroidal anti-inflammatory drugs or colchicine; diagnosis of heart failure (New York Heart Association functional classification Class IV); known hypersensitivity to either study drug; a change in dosage of certain agents which can lower sUA by nonselective mechanisms (losartan, guaifenesin, fenofibrate, or sodium–glucose co-transporter-2 inhibitors) within 2 weeks of randomization or expected dose titration after randomization; and pregnancy, lactation, or plans for pregnancy. A full list can be found in Table S1.
Informed consent was required before study participation. Patients were permitted to withdraw or discontinue from the study for any reason, including patient or physician decision, patients being lost to follow-up, or adverse events (AEs).
Outcomes
The primary endpoint was the change from baseline in UACR within the treatment and placebo arms at 12 weeks, expressed as the ratio of urinary albumin to creatinine ratio. UACR was measured at baseline in both study arms, and at successive predefined time points during the study. For UACR determination, 3 first morning urine void samples were collected at each visit: 2 days before, 1 day before, and on the day of the study visit.
Several secondary endpoints were evaluated. The effects of treatment on kidney function were evaluated from measurement of changes in eGFR, serum cystatin C, and serum creatinine, as were the effects on sUA. To investigate the potential effects of treatment on CV health, markers of CV stress (high-sensitivity troponin I), and inflammation (high-sensitivity C-reactive protein) were measured and compared between arms. Additional analysis explored the impact of treatment on other related biomarkers. Vascular function was assessed by measuring flow-mediated dilatation using a noninvasive device (SmartCuffTM Cordex Systems LLC, Annapolis, MD, USA). The effects of treatment on kidney and heart structure and function were also investigated using magnetic resonance imaging (MRI). Plasma exposure of verinurad and febuxostat was assessed from plasma trough concentrations measured approximately 24 hours post dosing.
Safety and tolerability were assessed from reports of AEs, physical examinations, and changes in vital signs and laboratory parameters.
Statistical Analysis
A placebo-corrected reduction in UACR of 30%, corresponding to a ratio of 0.7 (−0.357 on natural logarithmic scale) was considered to be a clinically meaningful target for this patient population, and a standard deviation (SD) for change in ln(UACR) of 0.8 was assumed based on previous studies.22 It was determined that 27 patients per arm with available UACR data at baseline and at 12 weeks should ensure, with 90% probability, that the observed placebo controlled reduction does not differ from the true, unknown reduction with more than this clinically meaningful effect under the assumed SD. It was therefore planned to enroll 30 patients per treatment arm for 1:1 randomization, in order to ensure the availability of 27 evaluable patients per arm.
A mixed-effects model for repeated measures was used to analyze both primary and secondary efficacy variables for the full analysis set, following intent-to-treat principle. Measurements were taken at baseline, weeks 1, 2, 4, 12, 24 and at follow-up for all primary and secondary efficacy variables. In this analysis, ln(UACR) was the outcome and change in ln(UACR) was the parameter of interest. For the primary outcome, ln(UACR) was the response variable with randomized treatment and visit as fixed, discrete factors, and baseline ln(UACR) and patients as random factors. Treatment-visit interactions were included in the mixed-effects model. Geometric least squares mean (LSM) changes from baseline in ln(UACR) and 95% confidence intervals (CI) were calculated by treatment and by visit at the 0.05 significance level and LSM differences between the treatment arms were calculated with the same mixed-effects model for repeated measures by visit, but presented with 90% CI as prespecified due to the limited sample size.
Standard descriptive statistics were calculated for other variables associated with primary, secondary, and exploratory objectives. Safety data were also presented as standard descriptive statistics by treatment and visit, as well as change from baseline.
Results
In total, 60 patients were enrolled from 19 sites across the United States from May 2017 until January 2018; 32 were randomized to the verinurad and febuxostat group, and 28 to the placebo group (Fig. 1).
Figure 1.
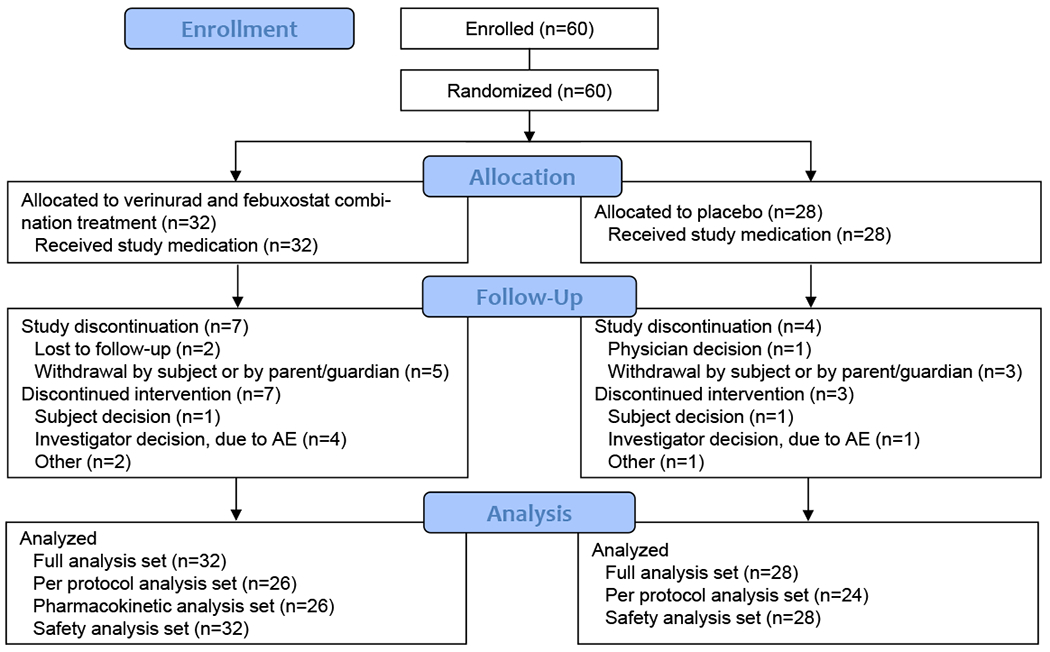
Patient disposition
Baseline demographic and clinical characteristics were generally balanced between the 2 study groups (Table 1); mean age was 61.5 years, 70% were male, and 62% were white. Mean baseline UACR was 459.1 mg/g (SD 824.7) in the verinurad and febuxostat group and 411.6 mg/g (SD 547.8) in the placebo group; overall, 47% of patients had a baseline eGFR < 60 mL/min/1.73 m2. Mean eGFR was 59.2 mL/min/1.73 m2 versus 68.1 mL/min/1.73 m2 in the verinurad and febuxostat, and placebo groups, respectively (Table 2).
Table 1.
Baseline Patient Characteristics
| Verinurad and Febuxostat (n = 32) |
Placebo (n = 28) |
All (N = 60) |
|
|---|---|---|---|
| Sex, n (%) | |||
| Male | 22 (68.8) | 20 (71.4) | 42 (70.0) |
| Female | 10 (31.3) | 8 (28.6) | 18 (30.0) |
| Age at screening, years, mean (SD) | 62.0 (9.5) | 60.9 (12.2) | 61.5 (10.7) |
| Age at randomization, years, n (%) | |||
| < 65 | 16 (50.0) | 17 (60.7) | 33 (55.0) |
| ≥ 65 | 16 (50.0) | 11 (39.3) | 27 (45.0) |
| Race, n (%) | |||
| White | 22 (68.8) | 15 (53.6) | 37 (61.7) |
| Black or African American | 6 (18.8) | 5 (17.9) | 11 (18.3) |
| Asian | 3 (9.4) | 4 (14.3) | 7 (11.7) |
| Native Hawaiian or other Pacific Islander | 1 (3.1) | 0 (0.0) | 1 (1.7) |
| Other | 0 (0.0) | 4 (14.3) | 4 (6.7) |
| Weight, kg, mean (SD) | 93.7 (20.2) | 96.8 (19.6) | 95.1 (19.8) |
| BMI, kg/m2, mean (SD) | 32.0 (5.1) | 33.0 (4.7) | 32.4 (4.9) |
| eGFR, mL/min/1.73m2, n (%) | |||
| < 30 | 2 (6.3) | 1 (3.6) | 3 (5.0) |
| ≥ 30 to < 60 | 16 (50.0) | 9 (32.1) | 25 (41.7) |
| ≥ 60 to < 90 | 9 (28.1) | 12 (42.9) | 21 (35.0) |
| ≥ 90 | 5 (15.6) | 6 (21.4) | 11 (18.3) |
| Prior concomitant medications, n (%) | |||
| Agents acting on the renin-angiotensin system | 25 (78.1) | 25 (89.3) | 50 (83.3) |
| ACE inhibitors | 16 (50.0) | 11 (39.3) | 27 (45.0) |
| Angiotensin II antagonists | 4 (12.5) | 11 (39.3) | 15 (25.0) |
Full analysis set. Abbreviations: BMI, body mass index; eGFR, estimated glomerular filtration rate; NA, not available; SD, standard deviation; UACR, urine albumin-to-creatinine ratio.
Table 2.
Effect of treatment on UACR, sUA and markers of kidney function
| Verinurad and Febuxostat (n=32) |
Placebo (n=28) |
|
|---|---|---|
| UACR, mg/g, mean (SD) | ||
| Baseline | 459.1 (824.7) | 411.6 (547.8) |
| Week 12 | 218.0 (280.7) | 385.3 (484.8) |
| Week 24 | 293.6 (371.5) | 501.8 (734.6) |
| Follow-up | 487.5 (714.1) | 523.5 (597.8) |
| sUA, mg/dL, mean (SD) | ||
| Baseline | 7.5 (1.6) | 7.0 (0.8) |
| Week 12 | 4.1 (2.6) | 7.4 (1.4) |
| Week 24 | 4.1 (3.1) | 7.3 (1.2) |
| Follow-up | 7.5 (1.7) | 7.0 (1.2) |
| eGFR, mL/min/1.73 m2, mean (SD) | ||
| Baseline | 59.2 (25.3) | 68.1 (23.2) |
| Week 12 | 57.7 (21.3) | 64.4 (25.7) |
| Week 24 | 53.7 (19.5) | 67.4 (24.3) |
| Follow-up | 51.1 (16.6) | 68.0 (27.1) |
| Serum creatinine, mg/dL, mean (SD) | ||
| Baseline | 1.40 (0.60) | 1.19 (0.36) |
| Week 12 | 1.35 (0.40) | 1.28 (0.44) |
| Week 24 | 1.43 (0.40) | 1.22 (0.41) |
| Follow-up | 1.47 (0.46) | 1.23 (0.47) |
| Cystatin C, mg/L, mean (SD) | ||
| Baseline | 1.58 (0.53) | 1.31 (0.35) |
| Week 12 | 1.66 (0.53) | 1.35 (0.42) |
| Week 24 | 1.71 (0.54) | 1.37 (0.36) |
| Follow-up | 1.75 (0.58) | 1.46 (0.39) |
Abbreviations: eGFR, estimated glomerular filtration rate; IQR, interquartile range; SD, standard deviation; sUA, serum urate; UACR, urine albumin-to-creatinine ratio.
In the verinurad and febuxostat group, 81.3% and 75.0% of patients completed 12 and 24 weeks of treatment, respectively. In the placebo group, 89.3% of patients completed both 12 and 24 weeks of treatment.
Effect of Verinurad and Febuxostat Therapy on UACR
The study met the primary objective with a reduction in UACR from baseline at 12 weeks for verinurad and febuxostat versus placebo (Table 2; Fig 2). At week 12, the mean percentage change from baseline in UACR was −48.7% (95% CI, −64.8 to −25.1) for verinurad and febuxostat and −15.3% (95% CI, −43.2 to 26.4) for placebo. A difference between the 2 treatment arms was apparent as early as 1 week after starting treatment (mean percent change for verinurad and febuxostat versus placebo: −38.6 [90% CI, −60.9 to −3.6]) and persisted throughout the 24-week study period (Fig 2). At 12 weeks, the primary endpoint assessment, the mean percentage change in UACR for verinurad and febuxostat versus placebo was −39.4% (90% CI, −61.8 to −3.8).
Figure 2.
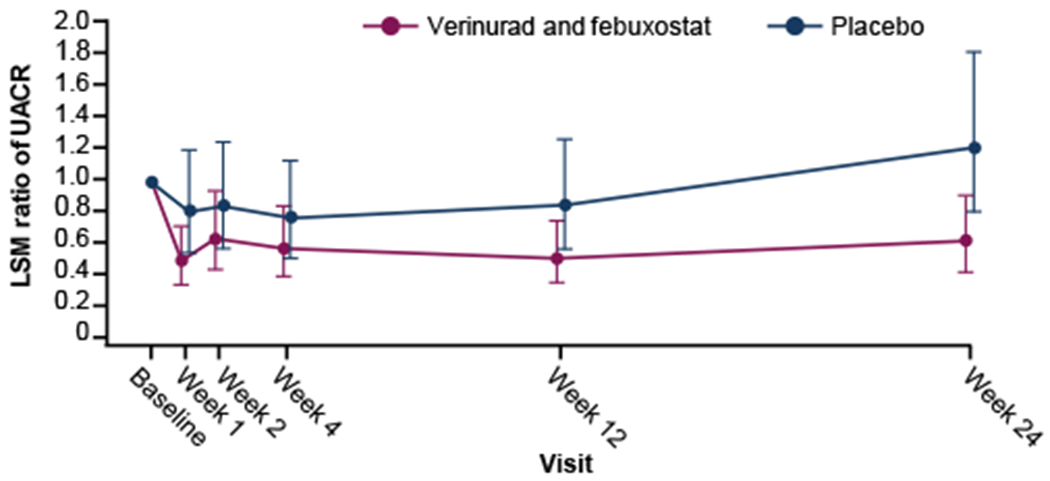
Estimated mean ratio of UACR with 95% confidence intervals by treatment visit. Error bars are 95% confidence intervals. Mixed-effects model for repeated measures with changes from baseline in ln(UACR) as the response variable, randomized treatment, visit, interaction of treatment group and visit as fixed effects, baseline ln(UACR) as a covariate and subject as a random effect. LSM change in ln(UACR) from baseline and the 95% CI of ln(UACR) were exponentiated to yield the least square estimated mean ratio of UACR. Abbreviations: LSM, least squares mean; UACR, urine albumin-to-creatinine ratio
Post hoc changes in UACR at 24 weeks showed similar trends to those recorded at 12 weeks (Table 2; Fig 2; Fig S1). The mean percent change (95% CI) from baseline in UACR was −38.4% (−58.1 to −9.5) for verinurad and febuxostat, and 21.4% (−18.9 to 81.8) for placebo. A difference between verinurad and febuxostat versus placebo of −49.3% (90% CI,−68.2 to −19.0) was observed. The treatment effect with the verinurad and febuxostat combination was consistent with a true pharmacologic effect, as shown by an increase from baseline in UACR at 4 weeks after the end of treatment (mean change in UACR from baseline at follow-up: 184.28 mg/g for verinurad and febuxostat and 71.94 mg/g for placebo).
Effect of Treatment on sUA Levels and Markers of Kidney Function
Reduction in sUA levels from baseline was greater with verinurad and febuxostat compared with placebo at both week 12 and week 24 (Table 2), despite the sample collection scheme being optimized for pharmacokinetic rather than sUA assessment, resulting in underestimation of the effect on sUA. Mean percentage changes from baseline were −56.8% (95% CI, −63.9 to −48.4) and −61.9% (95% CI, −68.3 to −54.3) for the verinurad and febuxostat combination, and 6.9% (95% CI, −11.8 to 29.5) and 4.7% (95% CI, −13.8 to 27.2) for placebo, respectively (Fig 3). Mean percentage changes for verinurad and febuxostat versus placebo at weeks 12 and 24 were −59.6% (90% CI, −67.6 to −49.6) and −63.7% (90% CI, −71.0 to −54.5), respectively.
Figure 3.
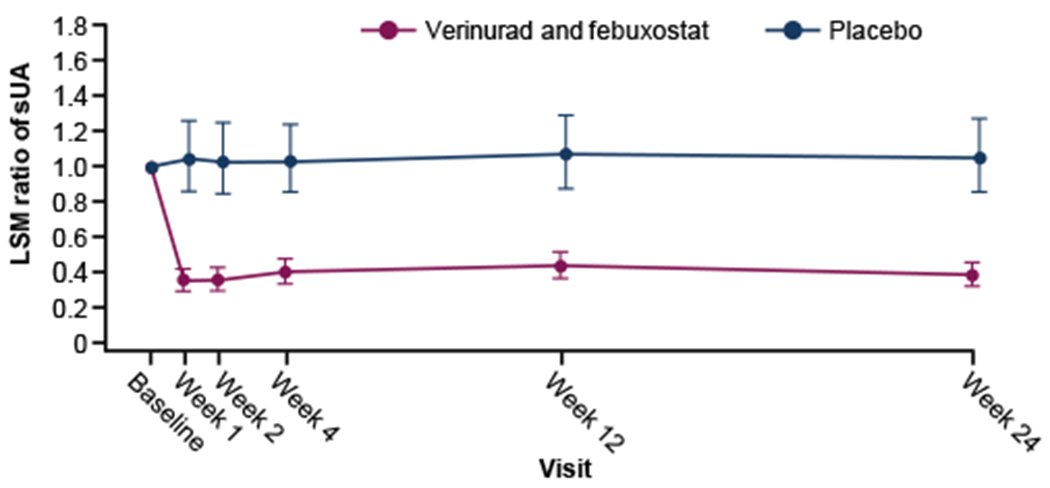
Estimated mean ratio of sUA with 95% confidence intervals by treatment visit. Mixed-effects model for repeated measures with changes from baseline in sUA as the response variable, randomized treatment, visit, interaction of treatment group, visit and baseline sUA as fixed effects, and subject as a random effect. LSM change in ln(sUA) from baseline and the 95% CI of ln(sUA) were exponentiated to yield the least square estimated mean ratio of sUA.
Abbreviations: LSM, least squares mean; sUA, serum urate.
Verinurad and febuxostat had no apparent effect on eGFR versus placebo in patients at the end of treatment (week 24; Table 2; Fig 4).
Figure 4.

Estimated mean ratio of eGFR with 95% confidence intervals by treatment visit. Mixed-effects model for repeated measures with changes from baseline in eGFR as the response variable, randomized treatment, visit, interaction of treatment group, visit and baseline eGFR as fixed effects, and subject as a random effect. LSM change in ln(eGFR) from baseline and the 95% CI of ln(eGFR) were exponentiated to yield the least square estimated mean ratio of sUA.
Abbreviations: eGFR, estimated glomerular filtration rate; LSM, least squares mean.
No pronounced differences between the verinurad and febuxostat, and placebo arms were noted for serum creatinine or cystatin C levels at weeks 12 and 24 (Table 2).
Additional Secondary Outcomes
No meaningful changes were observed for any of the other secondary outcomes. Of note, levels of serum high-sensitivity C-reactive protein and serum high-sensitivity troponin I did not appear to differ notably from baseline or between the 2 treatment groups at weeks 12 or 24 (Table 3). Baseline cardiac MRI findings indicated that patients had better cardiac structure and function across a range of parameters than was expected, leaving limited scope for improvement in these during the study period. No changes from baseline in BOLD MRI measurements of renal oxygenation were detected. No changes in blood pressure from baseline occurred with verinurad and febuxostat treatment.
Table 3.
Effect of treatment on biomarkers and parameters related to inflammation and cardiac health
| Verinurad and Febuxostat (n=32) |
Placebo (n=28) |
|
|---|---|---|
| Serum high-sensitivity C-reactive protein, mg/dL, mean (SD) | ||
| Baseline | 0.41 (0.37) | 0.36 (0.25) |
| Week 12 | 0.68 (1.07) | 0.48 (0.58) |
| Week 24 | 0.41 (0.40) | 0.50 (0.58) |
| Follow-up | 0.42 (0.37) | 1.54 (4.65) |
| Serum high-sensitivity troponin 1, ng/mL, mean (SD) | ||
| Baseline | 0.016 (0.045) | 0.040 (0.152) |
| Week 12 | 0.012 (0.013) | 0.011 (0.012) |
| Week 24 | 0.019 (0.043) | 0.040 (0.102) |
| Follow-up | 0.009 (0.008) | 0.009 (0.009) |
Abbreviations: SD, standard deviation.
Plasma trough concentrations of verinurad and febuxostat remained steady over the course of the study and were similar to those reported in other studies.
Exploratory Outcomes
Flow-mediated vascular dilatation at baseline was comparable between the verinurad and febuxostat (mean 60.4% [SD 28.8]), and placebo (60.6% [SD 30.9]) groups. Mean changes from baseline at weeks 12 and 24 were not notably different: verinurad and febuxostat, 0.8 (95% CI, −10.6 to 12.2) and 0.5 (95% CI, −9.4 to 10.5), respectively; and placebo, −5.9 (95% CI, −17.0 to 5.3) and −5.5 (95% CI, −15.5 to 4.4), respectively.
Modest changes from baseline were observed in both study arms at week 24 for the exploratory urinalysis variables, but these were not considered clinically relevant .The urinary protein/creatinine ratio (mg/g) was numerically lower in the verinurad and febuxostat arm compared to placebo at weeks 12 and 24 (Table S2). Urinary urate concentrations were also lower in the verinurad and febuxostat-treated group compared to placebo during follow-up (Table S2). Similarly, small changes occurred in both study arms at 24 weeks in clinical chemistry biomarkers and were not considered clinically relevant (Table S2).
Safety
Treatment with verinurad and febuxostat was generally well tolerated. Treatment-emergent AEs occurred in 62.5% of verinurad- and febuxostat-treated patients and 46.4% of placebo-treated patients and were mostly mild to moderate in intensity. Serious AEs were reported in 5 (15.6%) patients treated with verinurad and febuxostat, and in 3 (10.7%) treated with placebo. There was a higher incidence of gastrointestinal, and respiratory, thoracic, and mediastinal disorders with verinurad and febuxostat than placebo (18.8% vs 7.1% and 18.8% vs 3.6%, respectively). Diarrhea, dizziness, and nasopharyngitis were reported most frequently by patients who received verinurad and febuxostat (Table 4).
Table 4.
Treatment-Emergent Adverse Events Occurring in ≥2 Patients in Either Treatment Group
| Adverse event, n (%) | Verinurad and Febuxostat (n = 32) |
Placebo (n = 28) |
|---|---|---|
| Diarrhea | 4 (12.5) | 1 (3.6) |
| Dizziness | 3 (9.4) | 0 (0.0) |
| Nasopharyngitis | 2 (6.3) | 1 (3.6) |
| Congestive heart failure | 0 (0.0) | 2 (7.1) |
| Troponin I increased | 0 (0.0) | 2 (7.1) |
Twelve patients in the verinurad and febuxostat group (37.5%) and 6 patients in the placebo group (21.4%) discontinued treatment (study treatment or the study). Reasons for discontinuation included transient changes to CrCl, other AEs, and patient withdrawal from study. Five patients (15.6%) in the verinurad and febuxostat group and 1 patient (3.6%) in the placebo group discontinued treatment due to a treatment-emergent AE, including 4 from the verinurad and febuxostat group who discontinued because of CrCl (< 25 ml/min). In general, CrCl < 25 ml/min, which required treatment discontinuation, was a result of regular daily fluctuation in patients with a reduced baseline value. In addition, more patients in the verinurad and febuxostat group had poorer kidney function with eGFR < 45ml/min/1.73 m2 at baseline, which may have contributed to the discrepancy in discontinuation rates across groups. One patient in the verinurad and febuxostat treatment group discontinued study drug because of nausea and diarrhea. AEs related to laboratory findings occurred in 2 patients in the verinurad and febuxostat group and were in samples drawn pre-dose on dosing day 1; 1 AE was “acute kidney injury” and the other “creatinine renal clearance decreased”. As both were found before treatment start, neither was considered related to verinurad and febuxostat.
No treatment-related serious AEs occurred. Serious cardiac AEs were reported in the placebo group only. Serum creatinine elevations >1.5 x baseline occurred in 2 patients in each treatment arm but resolved by the next visit. No hepatotoxicity concerns were identified. No deaths were reported.
Discussion
This proof-of-concept study showed that treatment with verinurad 9 mg plus febuxostat 80 mg once daily reduced albuminuria in patients with T2DM and hyperuricemia receiving standard-of-care renoprotective treatment and optimal antihypertensive therapy. This intensive urate-lowering strategy led to a 39% reduction in UACR versus placebo after 12 weeks of treatment. Reductions in UACR versus placebo were observed as early as week 1 and seen throughout the 24-week treatment period. The magnitude of reduction in albuminuria achieved with verinurad and febuxostat suggests that this novel therapeutic approach may confer additional renoprotection for patients with T2DM and hyperuricemia beyond existing strategies.
The combination of verinurad and febuxostat was well tolerated, consistent with findings from previous studies of verinurad alone in healthy adult males23 and febuxostat alone in patients with gout.24 A higher number of patients in the verinurad and febuxostat group discontinued treatment compared to the placebo group. The reasons for discontinuation of treatment were several, including nausea and diarrhea, which are commonly reported AEs with febuxostat.24 For two treatment-emergent AEs of acute kidney injury and decreased creatinine renal clearance in patients on the verinurad and febuxostat arm, samples were drawn prior randomization and first drug use on study day 1 and were not considered related to the study drug. It could not be ascertained whether other suspected treatment-related discontinuations constituted a real or spurious treatment effect; this will be assessed in future studies. Measurements of kidney function were closely monitored during treatment, given the potential of URAT1 inhibitors to alter concentrations of uric acid in the tubular lumen.14, 25 No measurable effect of verinurad and febuxostat on serum creatinine or cystatin C concentrations was found.
No effects of verinurad and febuxostat on eGFR were observed; however, the study was not powered to detect changes in eGFR of the magnitude that could be expected in a study of this limited duration. The verinurad- and febuxostat-treated group had lower eGFR values than the placebo-treated group at baseline; however, no notable differences were found between groups in GFR measurements during follow-up. Recent clinical trials have found that urate-lowering therapies, such as allopurinol or febuxostat, slow the rate of decline in eGFR.8–10 However, this has not been observed in all studies.26–29 Differences in clinical trial designs, such as insufficient sample size, heterogeneity in study design, and short follow-up times, may account for these discrepancies.30 Future studies will be required to assess whether verinurad in combination with an XO inhibitor is superior to placebo in preserving kidney function by preventing or slowing eGFR decline.
Albuminuria is the earliest clinical signal of kidney disease in diabetic nephropathy and strategies that reduce albuminuria, such as RAS inhibition, are standard of care.1, 4, 31, 32 Yet, despite receiving maximal tolerated doses of RAS inhibitors, many patients continue to remain at considerable risk of decline in eGFR and progression to kidney failure.33 Novel strategies to lower sUA may confer additional benefits beyond RAS inhibition. There are several biologic mechanisms through which hyperuricemia may induce early kidney injury, including induction of a specific afferent arteriolar vasculopathy, promotion of endothelial dysfunction through nitric oxide inhibition, and activation of the RAS.11–13 Although our exploratory analysis did not reveal improvements in markers of endothelial function or inflammation, the addition of a urate-lowering strategy may inhibit many of these pathways, thereby reducing albuminuria. The identification of and validation of clinical biomarkers to serve as surrogate endpoints for important clinical outcomes in nephrology is of considerable interest to clinicians. Changes in albuminuria and in measured GFR over time are candidate biomarkers that continue to receive significant attention for use in clinical trials in CKD.6 A recent scientific workshop concluded that changes in albuminuria and GFR slope fulfilled the criteria for surrogate endpoints in clinical studies in CKD given their strong relationships with major clinical endpoints in CKD.6 The marked reduction in albuminuria observed in this early phase study provides an important positive signal for kidney protection based on a verinurad-led urate lowering strategy.
This study was not without limitations. The sample size was small, and participation was limited only to patients who had T2DM and albuminuria, thereby preventing extrapolation to the wider CKD population. Sample size was based on the results of studies performed in similar populations.34, 35 As there are few reported studies in this patient population, the standard deviation used to calculate sample size may not reflect the true standard deviation in ln(UACR). In addition, patients with stage 4 or 5 CKD were excluded as URAT1 inhibitors require relatively preserved kidney function for optimal effect. eGFR was utilized instead of measured GFR to determine eligibility for study and to track kidney function over time, with potential for imprecision in measurement. Finally, the effects of verinurad or febuxostat alone were not explored in this study.
In conclusion, an intensive urate-lowering strategy with a combination of verinurad and febuxostat leads to a reduction in albuminuria among patients with T2DM and hyperuricemia receiving standard-of-care RAS inhibition. This effect was independent of blood pressure. This novel approach might confer additional benefits to patients with T2DM beyond the use of existing renoprotective strategies. A larger phase 2b clinical trial (NCT03990363) is ongoing to confirm these findings.
Supplementary Material
Supplementary material
Supplementary Table 1. Study inclusion and exclusion criteria.
Supplementary Table 2. The effect of treatment on kidney and vascular function and on biomarkers related to heart and kidney function.
Abbreviations: N/A, not applicable; SD, standard deviation.
Supplementary Figure 1. Mean percentage change from baseline in UACR at 12 and 24 weeks according to subgroup.
Abbreviations: BMI, body mass index; eGFR, estimated glomerular filtration rate; LSM, least squares mean; UACR, urine albumin-to-creatinine ratio.
Acknowledgments:
The authors would like to thank the patients, their families, all investigators, and the Prosciento Clinical R&D and Pharmapace Inc. staff involved in this study. Medical writing support was provided by Minal Kotecha, PhD, and editorial support, was provided by Bethany King, BSc (Hons), both of Core Medica, London, UK, supported by AstraZeneca according to Good Publication Practice guidelines (Link). The Sponsor was involved in the study design, collection, analysis and interpretation of data, as well as data checking of information provided in the manuscript. However, ultimate responsibility for opinions, conclusions, and data interpretation lies with the authors.
Support:
Development of this manuscript was supported by AstraZeneca.
Funding:
This study was supported by AstraZeneca.
Financial Disclosure:
Dr Stack is supported by grants from the Health Research Board (HRA-2013-PHR-437 and HRA-2014-PHR-685), Midwest Kidney Disease Research and Education Foundation (MKid). He has served as consultant to AstraZeneca, Grünenthal, and Menarini. Dr Erlandsson, Dr Parkinson, Ms Johansson, Dr Dronamraju, and Dr Johnsson are employees of AstraZeneca. Dr Erlandsson, Ms Johansson, and Dr Parkinson hold stock in AstraZeneca. Dr Terkeltaub has served as a consultant to AstraZeneca, Horizon, and Selecta. Dr Terkeltaub’s research is currently supported by the VA Research Service, NIH (AR060772, AR075990) and AstraZeneca.
Footnotes
Trial Registration: NCT03118739
Data Sharing:
Data underlying the findings described in this manuscript may be obtained in accordance with AstraZeneca’s data sharing policy described at https://astrazenecagrouptrials.pharmacm.com/ST/Submission/Disclosure.
References
- 1.Alicic RZ, Rooney MT, Tuttle KR. Diabetic kidney disease: Challenges, progress, and possibilities. Clin J Am Soc Nephrol. 2017;12(12):2032–2045. [DOI] [PMC free article] [PubMed] [Google Scholar]
- 2.GBD 2015 Mortality and Causes of Death Collaborators. Global, regional, and national life expectancy, all-cause mortality, and cause-specific mortality for 249 causes of death, 1980–2015: a systematic analysis for the Global Burden of Disease Study 2015. Lancet. 2016;388(10053):1459–1544. [DOI] [PMC free article] [PubMed] [Google Scholar]
- 3.Saran R, Robinson B, Abbott KC, et al. US Renal Data System 2019 Annual Data Report: Epidemiology of Kidney Disease in the United States. Am J Kidney Dis. 2020;75(1S1):A6–A7. [DOI] [PubMed] [Google Scholar]
- 4.Mora-Fernandez C, Dominguez-Pimentel V, de Fuentes MM, Gorriz JL, Martinez-Castelao A, Navarro-Gonzalez JF. Diabetic kidney disease: from physiology to therapeutics. J Physiol. 2014;592(18):3997–4012. [DOI] [PMC free article] [PubMed] [Google Scholar]
- 5.Coresh J, Heerspink HJL, Sang Y, et al. Change in albuminuria and subsequent risk of end-stage kidney disease: an individual participant-level consortium meta-analysis of observational studies. Lancet Diabetes Endocrinol. 2019;7(2):115–127. [DOI] [PMC free article] [PubMed] [Google Scholar]
- 6.Levey AS, Gansevoort RT, Coresh J, et al. Change in albuminuria and GFR as end points for clinical trials in early stages of CKD: A scientific workshop sponsored by the National Kidney Foundation in collaboration with the US Food and Drug Administration and European Medicines Agency. Am J Kidney Dis. 2020;75:84–104. [DOI] [PubMed] [Google Scholar]
- 7.Chang HY, Lee PH, Lei CC, et al. Hyperuricemia is an independent risk factor for new onset micro-albuminuria in a middle-aged and elderly population: a prospective cohort study in taiwan. PloS One. 2013;8(4):e61450. [DOI] [PMC free article] [PubMed] [Google Scholar]
- 8.Su X, Xu B, Yan B, Qiao X, Wang L. Effects of uric acid-lowering therapy in patients with chronic kidney disease: A meta-analysis. PloS One. 2017;12(11):e0187550. [DOI] [PMC free article] [PubMed] [Google Scholar]
- 9.Goicoechea M, de Vinuesa SG, Verdalles U, et al. Effect of allopurinol in chronic kidney disease progression and cardiovascular risk. Clin J Am Soc Nephrol. 2010;5(8):1388–1393. [DOI] [PMC free article] [PubMed] [Google Scholar]
- 10.Sircar D, Chatterjee S, Waikhom R, et al. Efficacy of febuxostat for slowing the GFR decline in patients with CKD and asymptomatic hyperuricemia: A 6-month, double-blind, randomized, placebo-controlled trial. Am J Kidney Dis. 2015;66(6):945–950. [DOI] [PubMed] [Google Scholar]
- 11.El Ridi R, Tallima H. Physiological functions and pathogenic potential of uric acid: A review. J Adv Res. 2017;8(5):487–493. [DOI] [PMC free article] [PubMed] [Google Scholar]
- 12.Johnson RJ, Nakagawa T, Jalal D, Sanchez-Lozada LG, Kang DH, Ritz E. Uric acid and chronic kidney disease: which is chasing which? Nephrol Dial Transplant. 2013;28(9):2221–2228. [DOI] [PMC free article] [PubMed] [Google Scholar]
- 13.Sanchez-Lozada LG. The pathophysiology of uric acid on renal diseases. Contrib Nephrol. 2018;192:17–24. [DOI] [PubMed] [Google Scholar]
- 14.Tan PK, Liu S, Gunic E, Miner JN. Discovery and characterization of verinurad, a potent and specific inhibitor of URAT1 for the treatment of hyperuricemia and gout. Sci Rep. 2017;7(1):665. [DOI] [PMC free article] [PubMed] [Google Scholar]
- 15.Fitz-Patrick D, Roberson K, Niwa K, et al. Safety and efficacy of verinurad, a selective URAT1 inhibitor, for the treatment of patients with gout and/or asymptomatic hyperuricemia in the United States and Japan: Findings from two phase II trials. Mod Rheumatol. 2018:1–11. [DOI] [PubMed] [Google Scholar]
- 16.Bove M, Cicero AF, Veronesi M, Borghi C. An evidence-based review on urate-lowering treatments: implications for optimal treatment of chronic hyperuricemia. Vasc Health Risk Manag. 2017;13:23–28. [DOI] [PMC free article] [PubMed] [Google Scholar]
- 17.Hall J, Gillen M, Yang X, Shen Z. Pharmacokinetics, pharmacodynamics, and tolerability of concomitant administration of verinurad and febuxostat in healthy male volunteers. Clin Pharmacol Drug Dev. 2019;8(2):179–187. [DOI] [PMC free article] [PubMed] [Google Scholar]
- 18.Fleischmann R, Winkle P, Hall J, et al. Pharmacodynamic and pharmacokinetic effects and safety of verinurad in combination with febuxostat in adults with gout: a phase IIa, open-label study. RMD Open. 2018;4(1):e000647. [DOI] [PMC free article] [PubMed] [Google Scholar]
- 19.Shiramoto M, Liu S, Shen Z, et al. Verinurad combined with febuxostat in Japanese adults with gout or asymptomatic hyperuricaemia: a phase 2a, open-label study. Rheumatology (Oxford). 2018;57(9):1602–1610. [DOI] [PMC free article] [PubMed] [Google Scholar]
- 20.Dalbeth N, Jones G, Terkeltaub R, et al. Lesinurad, a selective uric acid reabsorption inhibitor, in combination with febuxostat in patients with tophaceous gout: Findings of a phase III clinical trial. Arthritis Rheumatol. 2017;69(9):1903–1913. [DOI] [PMC free article] [PubMed] [Google Scholar]
- 21.Tausche AK, Alten R, Dalbeth N, et al. Lesinurad monotherapy in gout patients intolerant to a xanthine oxidase inhibitor: a 6 month phase 3 clinical trial and extension study. Rheumatology (Oxford). 2017;56(12):2170–2178. [DOI] [PubMed] [Google Scholar]
- 22.Heerspink HJL, Greene T, Tighiouart H, et al. Change in albuminuria as a surrogate endpoint for progression of kidney disease: a meta-analysis of treatment effects in randomised clinical trials. Lancet Diabetes Endocrinol. 2019;7(2):128–139. [DOI] [PubMed] [Google Scholar]
- 23.Shen Z, Gillen M, Miner JN, Bucci G, Wilson DM, Hall JW. Pharmacokinetics, pharmacodynamics, and tolerability of verinurad, a selective uric acid reabsorption inhibitor, in healthy adult male subjects. Drug Des Devel Ther. 2017;11:2077–2086. [DOI] [PMC free article] [PubMed] [Google Scholar]
- 24.Waller A, Jordan KM. Use of febuxostat in the management of gout in the United Kingdom. Ther Adv Musculoskelet Dis. 2017;9(2):55–64. [DOI] [PMC free article] [PubMed] [Google Scholar]
- 25.Miner JN, Tan PK, Hyndman D, et al. Lesinurad, a novel, oral compound for gout, acts to decrease serum uric acid through inhibition of urate transporters in the kidney. Arthritis Res Ther. 2016;18(1):214. [DOI] [PMC free article] [PubMed] [Google Scholar]
- 26.Kimura K, Hosoya T, Uchida S, et al. Febuxostat therapy for patients with stage 3 CKD and asymptomatic hyperuricemia: A randomized trial. Am J Kidney Dis. 2018;72(6):798–810. [DOI] [PubMed] [Google Scholar]
- 27.Badve SV, Tiku A, Pascoe E, et al. Effect of Allopurinol on the Progression of CKD: The CKD-FIX Study. ASN Kidney Week 2019. Washington, D.C.2019. [Google Scholar]
- 28.Doria A, Galecki A, Spino C, Mauer M. Preventing Early Renal Loss in Diabetes (PERL) Study: Outcome of a 3-Year Trial of Serum Uric Acid Reduction with Allopurinol. ASN Kidney Week 2019. Washington, DC: 2019. [Google Scholar]
- 29.Saag KG, Whelton A, Becker MA, MacDonald P, Hunt B, Gunawardhana L. Impact of febuxostat on renal function in gout patients with moderate-to-severe renal impairment. Arthritis Rheumatol. 2016;68(8):2035–2043. [DOI] [PubMed] [Google Scholar]
- 30.Sato Y, Feig DI, Stack AG, et al. The case for uric acid-lowering treatment in patients with hyperuricaemia and CKD. Nat Rev Nephrol. 2019;15(12):767–775. [DOI] [PubMed] [Google Scholar]
- 31.Molitch ME, Adler AI, Flyvbjerg A, et al. Diabetic kidney disease: A clinical update from kidney disease: Improving global outcomes. Kidney Int. 2015;87(1):20–30. [DOI] [PMC free article] [PubMed] [Google Scholar]
- 32.Currie G, Delles C. Proteinuria and its relation to cardiovascular disease. Int J Nephrol Renovasc Dis. 2013;7:13–24. [DOI] [PMC free article] [PubMed] [Google Scholar]
- 33.Kim Y, Park CW. New therapeutic agents in diabetic nephropathy. Korean J Intern Med. 2017;32(1):11–25. [DOI] [PMC free article] [PubMed] [Google Scholar]
- 34.Anker SD, Doehner W, Rauchhaus M, et al. Uric acid and survival in chronic heart failure: validation and application in metabolic, functional, and hemodynamic staging. Circulation. 2003;107(15):1991–1997. [DOI] [PubMed] [Google Scholar]
- 35.Parving HH, Persson F, Lewis JB, Lewis EJ, Hollenberg NK, Investigators AS. Aliskiren combined with losartan in type 2 diabetes and nephropathy. N Engl J Med. 2008;358(23):2433–2446. [DOI] [PubMed] [Google Scholar]
Associated Data
This section collects any data citations, data availability statements, or supplementary materials included in this article.
Supplementary Materials
Supplementary material
Supplementary Table 1. Study inclusion and exclusion criteria.
Supplementary Table 2. The effect of treatment on kidney and vascular function and on biomarkers related to heart and kidney function.
Abbreviations: N/A, not applicable; SD, standard deviation.
Supplementary Figure 1. Mean percentage change from baseline in UACR at 12 and 24 weeks according to subgroup.
Abbreviations: BMI, body mass index; eGFR, estimated glomerular filtration rate; LSM, least squares mean; UACR, urine albumin-to-creatinine ratio.