

Abstract
Background:
Survival among children with high-risk solid tumors remains poor. Reprogrammed metabolism promotes tumor growth and may contain therapeutic liabilities. Tumor metabolism has been assessed in adults using intra-operative 13C-glucose infusions. Pediatric tumors differ from adult cancers in their low mutational burden and derivation from embryonic tissues. Here we used 13C infusions to examine tumor metabolism in children, comparing phenotypes among tumor types and between childhood and adult cancers.
Methods:
Patients recruited to study NCT03686566 received an intra-operative infusion of [U-13C]glucose during tumor resection to evaluate central carbon pathways in the tumor, with concurrent metabolomics to provide a broad overview of metabolism. Differential characteristics were determined using multiple comparison tests and mixed effect analyses.
Findings:
We studied 23 tumors from 22 patients. All tumors analyzed by [U-13C]glucose contained labeling in glycolytic and tricarboxylic acid (TCA) cycle intermediates. Labeling in the TCA cycle indicated activity of pyruvate dehydrogenase (PDH) and pyruvate carboxylase (PC), with PDH predominating. Neuroblastomas had high lactate labeling relative to other childhood cancers and lung cancer, and were distinguished by abundant tyrosine catabolites consistent with catecholamine synthesis.
Conclusions:
Intra-operative [U13C]glucose infusions are safe and informative in pediatric cancer. Tumors of various histologies use glycolysis and oxidative metabolism, with subtype-selective differences evident from this small cohort. Expanding this cohort may uncover predictive biomarkers and therapeutic targets from tumor metabolism.
Funding:
N.C.I grants to P.L. (R21CA220090-01A1) and R.J.D. (R35CA22044901); H.H.M.I. funding to R.J.D.; Children’s Clinical Research Advisory Committee funding to K.J.
Keywords: Cancer, metabolism, glucose, isotopes, metabolomics, neuroblastoma, sarcoma
ETOC
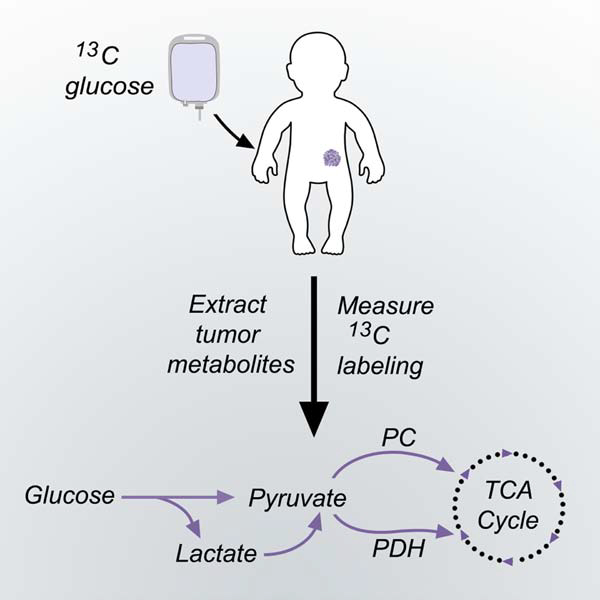
Intra-operative 13C-glucose infusions are safe and informative in pediatric cancer patients, with metabolite labeling revealing glycolysis, glucose oxidation, pyruvate dehydrogenase and pyruvate carboxylase in neuroblastomas, sarcomas and other solid tumors in children. The labeling data also suggest enhanced lactate uptake in neuroblastomas compared to other tumor types.
Graphical Abstract
Introduction
An estimated 11,000 children in the United States under age 15 years are diagnosed annually with cancer. Some 1,100 of these children die from their disease, making cancer the most common disease-related cause of death in children and emphasizing the need for better predictive biomarkers and therapeutic targets 1. The challenges associated with pediatric cancer management are evident in neuroblastoma, the most common abdominal tumor in children. Neuroblastoma is an embryonal tumor of the autonomic nervous system 2,3. It accounts for 7% of all childhood cancers and 15% of childhood cancer deaths 4. Despite intensive therapies including chemotherapy, hematopoietic stem cell transplant and immunotherapy, fewer than 50% of patients survive long-term from the high-risk form of this cancer 5. Similarly poor outcomes are observed in children with other extra-cranial solid tumors, including high-risk categories of bone and soft tissue sarcoma 6,7.
Metabolic reprogramming is a hallmark of cancer that allows malignant cells to convert abundant nutrients into metabolic intermediates needed for bioenergetics, biosynthesis and redox homeostasis, and in some cases contributes to transformation 8,9. Reprogrammed activities can provide a basis for cancer therapy, as indicated most recently by the development of inhibitors against mutant forms of isocitrate dehyrogenase-1 and −2 in acute myelogenous leukemia and other cancers 10–13. Some pediatric cancers have clinically important metabolic dependencies that have been exploited therapeutically. Lymphoblasts from childhood acute lymphoblastic leukemia (ALL) require asparagine for protein synthesis, rendering them sensitive to depletion of the extracellular asparagine pool by L-asparaginase 14. This drug has been a component in chemotherapeutic regimens for pediatric ALL for decades, contributing to the greater than 90% survival in children with this disease 15.
Given the poor outcomes from many solid tumors in children and the potential that metabolic reprogramming might identify new therapeutic targets, a thorough examination of metabolism in these tumors is warranted. To date, most studies on cancer metabolism have focused on adult-onset cancers. A theme emerging from the past decade of research is that cancer metabolism results from a combination of cancer cell-intrinsic features and other factors imposed by the tumor microenvironment 16. Cell-intrinsic factors include the effects of somatically-acquired mutations in tumor suppressors and oncogenes, many of which affect metabolic pathway activity, and the tissue of origin, which affects gene expression patterns and influences the metabolic consequences of oncogenic mutations 17–19. These considerations emphasize the importance of studying metabolism in pediatric solid tumors. They tend to have a low burden of somatic mutations relative to adult cancers, and generally lack mutations in classical oncogenic drivers whose metabolic effects have been extensively characterized in adult cancers 20,21. Furthermore, many pediatric tumors like neuroblastoma are derived from embryonic tissues 22,23. It is unknown whether the embryonic origins of pediatric cancers confer metabolic properties and vulnerabilities distinct from adult cancers.
Several recent studies have used intra-operative infusions with stable isotope-labeled nutrients, particularly 13C-glucose, to assess tumor metabolism in adults. In these studies, 13C-glucose is introduced intravenously just before or during biopsy or resection of the tumor. Tumor import and metabolism of 13C-glucose during the infusion results in labeling of metabolic intermediates in pathways supplied by glucose. The isotopic labeling patterns in metabolites extracted from blood and tumor tissue can then be used to infer aspects of metabolic activity within the tumor. This technique has been applied to human lung cancer 24–27, clear cell renal cell carcinoma 28, glioma and brain metastases 29. Importantly, analyzing metabolism directly in human tumors has identified properties not easily visible in cultured cells. These include the extensive oxidation of glucose and other substrates by human lung cancers and the propensity for some tumors to take up lactate 24,25,27. Lactate uptake was observed to correlate with poor progression-free survival in lung cancer, and blocking lactate transport suppressed metastasis in mice 24,30. These findings indicate that intra-operative infusions with 13C-glucose can identify new, potentially targetable aspects of human cancer metabolism.
Here we used intra-operative 13C-glucose infusions to assess tumor metabolism in children with extra-cranial solid malignancies. We describe the practicalities of using this technique in the pediatric population, including methods to achieve persistent steady-state labeling in the plasma glucose pool and sufficient labeling in tumor metabolites to infer metabolic activity. The resulting analysis allowed us to begin to compare metabolic phenotypes among pediatric tumor subtypes and between pediatric and adult cancers.
Results
Study day procedures and patient demographics.
Fifty-six potentially eligible children were identified between April 2018 and December 2019. The parents of 11 patients declined to participate, and 18 children were not approached due to operational staff and timing challenges or their critical status at presentation. Four children were unable to complete the study-day procedures due to intolerance of IV placement, change in clinical status or other causes. Two patients were infused, but their masses were subsequently classified as benign lesions and are not included in the isotope analyses presented here. We performed 21 [U-13C]glucose infusions to assess malignant lesions. Metabolomics was performed on 19 tumors. Demographic data are shown in Tables 1 and S1. The 21 infusions include a patient who was infused twice, once before and once after chemotherapy (listed as infusions 17 and 18 in Table S1). The median age was 5 years and the age range was 4 months to 19 years. Additional patient information is detailed in Table S1. The tumors included 7 neuroblastomas, 8 sarcomas of varied histologies and 8 other tumors, all but 5 of which were confirmed by pathology after the surgery (Fig. S1). Although some of the analyses below classify the tumors into 3 main groups based on their histological classification, tumors within each group are genetically heterogeneous. For the sarcomas, which constitute a particularly heterogeneous group, individual histologies are identified in the relevant figures and tables.
Table 1:
Demographic and clinical data from participating patients.
| Age at entry | |
| Median (range) years | 5 (<1–19) |
| Sex | |
| Male | 10 |
| Female | 13 |
| Ethnicity | |
| Caucasian | 9 |
| Hispanic | 11 |
| African American | 3 |
| Tumor Types | |
| Neuroblastoma | |
| Neuroblastoma | 4 |
| Ganglioneuroblastoma | 3 |
| Sarcoma | |
| Low grade fibromyxoid sarcoma | 1 |
| Osteosarcoma | 2 |
| Clear cell sarcoma of the kidney | 1 |
| Rhabdomyosarcoma | 3 |
| Synovial Sarcoma | 1 |
| Other | |
| Hepatoblastoma | 2 |
| Pancreatoblastoma | 1 |
| Desmoid tumor | 2 |
| Histiocytoma | 1 |
| Wilms tumor | 1 |
| Benign urethral polyp | 1 |
| Treatment Status | |
| Treatment naïve | 12 |
| Previously treated | 11 |
Establishing weight-based dosing regimens of [U-13C]glucose in children.
[U-13C]glucose was administered according to the weight of the patient via two different dosing regimens (Regimens 1 and 2 in Fig. 1A). In 6 patients infused using Regimen 1, we observed relatively low enrichments in circulating glucose and in metabolites extracted from the tumor (Table S2 and Fig. 1B). We therefore increased both the initial [U-13C]glucose bolus and the rate of [U-13C]glucose infusion (Regimen 2 in Fig. 1A); we previously used a similar modification to improve 13C signal in adult glioma patients 29. Regimen 2 resulted in higher enrichments in plasma glucose, in most patients approaching or exceeding the target enrichment of 0.4 (Fig. 1B, Table S2). Children under 5 years had somewhat lower final plasma enrichments than older children, likely related to higher rates of glucose production in young children 31. Nevertheless, further analysis as explained below revealed acceptable levels of labeling in metabolites extracted from tumor tissue, so subsequent patients were infused using Regimen 2.
Figure 1: Method for intra-operative [U-13C]glucose infusions in children.

(A) Two weight-based regimens for infusion of [U-13C]glucose.
(B) Plasma glucose enrichment levels for pediatric patients on Regimen 1 or Regimen 2.
13C labeling features are relatively stable after human tumor resection.
An important technical consideration in isotope labeling studies is to avoid artifactual changes in labeling caused by delayed quenching of metabolism. Although every effort is made to freeze tumor samples in liquid nitrogen immediately after removing the samples from the patient, the complexity of the surgery, needs of the clinical pathologist, and other issues make delays unavoidable in some patients. We took the opportunity to compare relative metabolite labeling among samples subjected to different periods of neglect prior to freezing in liquid nitrogen. This analysis revealed no reproducible differences in labeling even after 30 minutes outside of the body prior to freezing (Fig. S2A–F). The two samples that spent the longest time outside the body had low labeling in pyruvate, although this was still within the range of labeling values for samples that were frozen immediately. Labeling in other metabolites appeared to be maintained even beyond 30 minutes. These data suggest that 13C labeling in metabolites from central carbon pathways persist for a significant period of time after surgical resection. To validate this finding, we infused [U-13C]glucose into mice bearing SK-N-AS xenografts, a neuroblastoma cell line. After infusing [U-13C]glucose for 3 hours, we removed the tumors, froze one fragment immediately and left the others at room temperature for different time intervals. We then extracted metabolites and compared isotope labeling at each time point (Fig. S2G). Consistent with what we found in patients and what was recently reported in a different study in mice 32, labeling in TCA cycle intermediates was maintained over time.
Pediatric solid tumors use glycolysis and the TCA cycle.
Prominent metabolic fates of 13C downstream of [U-13C]glucose are illustrated in Fig. 2A. In tissues with glycolytic metabolism, 13C is transmitted to glycolytic intermediates including 3-phosphoglycerate (3PG), pyruvate, and lactate. In tissues that oxidize glucose-derived metabolites in the TCA cycle, the label is transmitted to citrate and other intermediates in this pathway. To illustrate the workflow of the study, Fig. 2B–D and 2E–G show data from two patients with neuroblastoma, including pre-surgical imaging and isotope labeling in blood and tumor metabolites. In both cases, the infusions labeled 40% or more of the plasma glucose pool (fractional enrichment 0.4 or higher, Fig. 2C,F). As expected, in addition to labeled glucose, the plasma also contains labeled lactate and pyruvate. These metabolites are produced from glucose in many tissues, with part of the pool secreted into the bloodstream (Fig. 2C,F). Labeling of metabolic intermediates from the tumors is summarized in Fig. 2D,G. The enrichment of each metabolite was normalized to enrichment in the precursor, plasma glucose, at the time of tumor resection. Absolute enrichments for all metabolites are in Table S2. In both tumors, intermediates from glycolysis and the TCA cycle contain 13C (Fig. 2D,G), indicating that both pathways are active in these tumors. The level of label retention is also informative. Patient #1’s tumor displays a progressive dilution of labeling, while Patient #2’s tumor demonstrates increased labeling in lactate relative to the glycolytic intermediates 3PG and pyruvate. High labeling in tumor lactate relative to 3PG (high lactate:3PG labeling ratio) has been ascribed to transport of labeled lactate and/or pyruvate into the tumor 24. In Patient #2, plasma lactate and pyruvate were nearly identically labeled (Fig. 2F), so the high labeling in tumor lactate relative to pyruvate is most consistent with lactate rather than pyruvate import.
Figure 2: 13C labeling in tumor metabolites from two children with neuroblastoma.

(A) Expected labeling of glycolytic and TCA cycle metabolites after infusion with [U-13C]glucose. In this scheme, the two labeled carbons from acetyl-CoA are transferred to citrate positions 1 and 2 and then to positions 4 and 5 of α-KG and carried further around the TCA cycle. Labeled OAA exchanges with labeled aspartate. Further metabolism of labeled OAA into subsequent turns of cycle is not illustrated.
(B) Computed tomography of Patient #1, a 9-year old boy with a non-MYCN-amplified neuroblastoma (red box).
(C) Time-dependent labeling of glucose, lactate and pyruvate in Patient #1’s plasma during the [U-13C]glucose infusion.
(D) Labeling in metabolites extracted from Patient #1’s tumor. Labeling is normalized to the glucose m+6 fraction in plasma at the time of tumor resection.
(E) Computed tomography of Patient #3, a 2-year old girl with a non-MYCN-amplified neuroblastoma (red box).
(F) Time-dependent labeling of glucose, lactate and pyruvate in Patient #3’s plasma during the [U-13C]glucose infusion.
(G) Labeling in metabolites extracted from Patient #3’s tumor. Labeling is normalized to the glucose m+6 fraction in plasma at the time of tumor resection.
Labeling data from the remaining patients followed similar patterns. All tumors from all histological types showed evidence of both glycolysis and TCA cycle metabolism (Fig. 3A,B). The tumors displayed a range of labeling in each metabolite (Table S2). In the seven neuroblastomas, labeling in lactate exceeded labeling in 3PG (Fig. 3A). This was not the case for the rest of the tumors, either considered as single group (Fig. 3A), or when considering the eight sarcomas together as a separate group (Fig. 3B). Although sarcomas also had high labeling in lactate, this did not exceed the high level of average 3PG labeling in these tumors. The data suggest that the labeled lactate in neuroblastomas arises at least partially from lactate uptake from the plasma, but that the labeled lactate in sarcomas arises mostly from glycolysis within the tissue.
Figure 3: Metabolite labeling reveals evidence of metabolic differences between neuroblastoma and other tumor types.

(A) Fractional enrichment of metabolites extracted from all pediatric tumors in the cohort. Labeling is normalized to the glucose m+6 fraction in plasma at the time of tumor resection. The bar indicates that in neuroblastomas, relative labeling in lactate is higher than relative labeling in 3PG.
(B) Fractional enrichment of metabolites extracted from all pediatric tumors in the cohort. These data are the same as in panel (A), but sarcomas are considered as a separate group. The bar indicates the difference in relative lactate labeling between neuroblastoma and other non-sarcoma tumors.
(C) Fractional enrichment in tumor lactate, normalized to plasma glucose m+6, in pediatric tumors, adult NSCLC and adult ccRCC. NSCLC and ccRCC data include previously-reported patients 24,28 and are displayed here for the purposes of comparing to the new data from pediatric cancers.
(D) Lactate m+3/3PG m+3 labeling ratios in the tumors displayed in (C).
(E) Summary of labeling surrogates for PC activity (citrate m+3/pyruvate m+3 ratio) and PDH activity (citrate m+2/pyruvate m+3 ratio) for all pediatric tumors subjected to [U-13C]glucose infusion.
(F) Comparison of PC and PDH labeling surrogates in different pediatric tumor types.
Abbreviations: Low grade fibromyxoid sarcoma (LGF), osteosarcoma (OS), clear cell sarcoma of the kidney (CCS), rhabdomyosarcoma (RMS), synovial sarcoma (SS).
We further analyzed labeling in the pediatric tumors by comparing them to tumors from adults with NSCLC and clear cell renal cell carcinoma (ccRCC) subjected to similar intra-operative [U-13C]glucose infusions. Normalizing labeling in tumor lactate to plasma glucose, neuroblastomas had the highest average ratio among the tumor types; the difference between neuroblastomas and NSCLC was statistically significant (Fig. 3C). The average lactate:3PG labeling ratio was higher in neuroblastomas than NSCLC, but the difference did not reach statistical significance in this small cohort (Fig. 3D). Despite the known genetic heterogeneity among sarcomas, these tumors had fairly consistent lactate:3PG labeling ratios.
The lactate:3PG labeling ratio correlates with expression of Monocarboxylate Transporter-1 (MCT1) in human NSCLC and patient-derived melanoma xenografts 24,30. However, in the pediatric tumors we analyzed, both MCT1 and MCT4 were broadly expressed, and did not appear to be any more abundant in neuroblastomas (Fig. S3A). We also examined the lactate dehydrogenase isoforms LDHA and LDHB and observed that neuroblastomas tended to have higher LDHB expression than the other tumors (Fig. S3A). This may be relevant to lactate metabolism by the tumors, because although both LDHA and LDHB interconvert lactate and pyruvate, tissues with extensive lactate oxidation (e.g. the heart) express LDHB 33,34.
We also examined labeling in serine and glycine, two amino acids derived from 3PG, in the pediatric tumors. Both metabolites displayed low but detectable labeling in all the tumor types (Fig. S3B,C). It is unclear from this low level of labeling whether these amino acids were synthesized by the tumors or imported from the bloodstream.
Evidence for both pyruvate dehydrogenase and pyruvate carboxylase activity in pediatric solid tumors.
Carbon from glucose enters the TCA cycle via pyruvate. Two enzymatic reactions convert pyruvate into metabolites that enter the TCA cycle: pyruvate dehydrogenase (PDH), which decarboxylates pyruvate to produce acetyl-CoA (Fig. 2A), and pyruvate carboxylase (PC), which carboxylates pyruvate and converts it into oxaloacetate (Fig. S3D). Because PDH delivers two pyruvate-derived carbons to the TCA cycle while carboxylation of pyruvate delivers three, examination of particular labeled forms of TCA cycle intermediates provides information about the dominant route of carbon entry into the cycle from pyruvate.
Citrate m+2 relative to pyruvate m+3 labeling is a surrogate for PDH-dependent entry of pyruvate to the TCA cycle, whereas citrate m+3 relative to pyruvate m+3 is a surrogate for pyruvate carboxylation (see illustrations in Fig. 2A and S3D). Both m+2 and m+3 forms of citrate and other TCA cycle intermediates were apparent in the tumors, consistent with activity of both PDH and PC (Table S2). However, across the entire cohort, the citrate m+2/pyruvate m+3 ratio exceeded the citrate m+3/pyruvate m+3 ratio (Fig. 3E). This finding indicates that entry of carbon from pyruvate into the TCA cycle is predominantly by PDH rather than PC, as was also reported in human NSCLC 27. Additionally in both malate and aspartate, m+2 labeling exceeded m+3 labeling (i.e. m+2/m+3 ratios exceeded 1), also consistent with carbon entry into the TCA cycle occurring predominantly via PDH (Fig. S3E). None of these ratios were significantly different between neuroblastomas and other pediatric tumors in our cohort (Fig. 3F, S3E).
We further analyzed neuroblastoma metabolism based on histological, clinical, and risk stratification criteria (Fig. S4A–D). These cohorts were very small, including only a single neuroblastoma with MYCN amplification. Interestingly, we analyzed three neuroblastomas that had been treated with chemotherapy prior to the infusion, and observed no differences in labeling of glycolytic or TCA cycle intermediates compared to treatment-naive neuroblastomas (Fig. S4C). Details on exposure to therapy prior to the infusion are in Table S1. Three of the neuroblastomas were histologically classified as ganglioneuroblastoma. These tumors displayed lower 3PG enrichment relative to the four neuroblastomas, leading to higher lactate:3PG labeling ratios (Fig S4E,F).
Neuroblastomas display enhanced gene expression and metabolites related to catecholamine synthesis.
Samples from 19 patients with sufficient tissue were subjected to metabolomic analysis (Table S1). A supervised analysis of metabolomic features revealed good segregation of neuroblastoma from other tumor types (Fig. 4A), indicating that some metabolites differ significantly between neuroblastomas and other tumors; an unsupervised analysis did not segregate the tumor types (Fig. S4G). Metabolites from several pathways, including pyrimidine metabolism, catecholamine metabolism and others, were altered in the neuroblastomas (Table S3). Sixty-five metabolites with variable importance in the projection (VIP) scores exceeding 1.0 from the supervised analysis were used in metabolite set enrichment analysis (MSEA), which clusters metabolites into 33 pathways annotated by the KEGG database (Table S4). The catecholamine neurotransmitters dopamine and L-DOPA were among the metabolites that best discriminated the neuroblastomas from other tumors, and both were elevated in neuroblastomas (Fig. 4B). Other catecholamines, including 3,4-dihydroxyphenylethyleneglycol (a metabolite of noradrenaline) and 3-methoxytyramine (a metabolite of dopamine), were also elevated (Fig. 4B, Table S3). These metabolic features are consistent with the known ability of neuroblastomas to synthesize catecholamines and other neurotransmitters. Dopamine, L-DOPA and norepinephrine, as well as homovanillic acid and vanillylmandelic acid (HVA and VMA) that are used as diagnostic markers for neuroblastoma and other catecholamine-secreting tumors, are derived from the amino acid tyrosine. Tyrosine metabolism follows two pathways, one that converts tyrosine to acetoacetate and fumarate for energy metabolism, largely in the liver, and another that produces neurotransmitters starting with the hydroxylation of tyrosine to L-DOPA (Fig. 4C). We analyzed expression of the enzymes from these two branched pathways using published RNA-sequencing databases. Genes encoding the catecholamine synthesis enzymes were markedly over-expressed in neuroblastoma relative to all other pediatric cancers analyzed, with expression levels similar to adult pheochromocytomas and paragangliomas, which also produce catecholamines (Fig. 4D,E). In contrast, enzymes from the pathway of tyrosine degradation to fumarate and acetoacetate were not over-expressed in neuroblastoma (Fig. 4E). Western blot analysis of protein extracted from tumors in our cohort confirmed elevated expression of enzymes from the catecholamine synthesis pathway in neuroblastomas, whereas enzymes in the tyrosine degradation pathway were expressed in other tumors as well (Fig. 4F).
Figure 4: Metabolomic features differentiate neuroblastomas from other pediatric tumors.

(A) Partial least squares discriminant analysis (PLS-DA) on metabolomics data from neuroblastomas and other pediatric tumors.
(B) Volcano plot demonstrating metabolomic differences between neuroblastomas and other pediatric tumors. Several catecholamine-related metabolites accumulated in the neuroblastomas are indicated in red.
(C) Metabolism of tyrosine to fumarate and acetoacetate or into catecholamine synthesis.
(D) Volcano plot demonstrating gene expression differences between neuroblastomas and other tumors. Tumors used in this analysis include those shown in (E). Genes encoding several enzymes of catecholamine synthesis are indicated in red.
(E) Expression of genes involved in tyrosine catabolism and catecholamine synthesis in neuroblastomas and several other forms of cancer. ****p<0.0001, compared to neuroblastoma.
(F) Western blot demonstrating expression of tyrosine hydroxylase, dopamine β-hydroxylase, 4-hydroxyphenylpyruvate dioxygenase and homogentisate oxidase in neuroblastomas compared to other pediatric cancers. The blot contains protein from 6 neuroblastomas, 5 sarcomas and 3 other tumors.
Abbreviations: DOPA, dihydroxyphenylalanine; TH, tyrosine hydroxylase; DDC, DOPA decarboxylase; DBH, dopamine b-hydroxylase; HPD, 4-hydroxyphenylpyruvate dioxygenase; HGD, homogentisate oxidase; FAH, fumarylacetoacetate hydrolase; AML, acute myelogenous leukemia; ALL, acute lymphocytic leukemia; TCGA-SARC, The Cancer Genome Atlas - Sarcomas; TCGA-PCPG, The Cancer Genome Atlas - Pheochromocytoma and Paraganglioma.
Discussion
Direct analysis of metabolism in human tumors in vivo may provide mechanistic insights into how these tumors subvert cellular metabolic programs to grow. They may also uncover liabilities upon which to develop therapeutic strategies, or biomarkers that predict clinical outcomes or sensitivity to therapy. In vivo, intra-operative isotope tracing with 13C-labeled nutrients is an informative means to assess some aspects of tumor metabolism, particularly central pathways such as glycolysis and the TCA cycle. To date, this technique has been used to characterize nutrient utilization in several forms of adult cancer. Here we demonstrate that isotope tracing is safe and informative in solid tumors in children, including neuroblastomas, sarcomas and others. We provide technical guidance about delivering [U-13C]glucose to children as young as 4 months. We find evidence of glycolysis and TCA cycle activity in all tumor types, with high levels of lactate labeling and abundance of catecholamine metabolites differentiating neuroblastomas from the other tumor types in our cohort.
Several studies in preclinical models have reported that some oncogenic drivers regulate metabolism in pediatric solid tumors. For example, the EWS-FLI1 fusion oncogene in Ewing sarcoma regulates serine biosynthesis and induces dependence on this pathway 35–37, and cell lines from neuroblastomas with genomic amplification of MYCN display addiction to glutamine catabolism 38. Some metabolic properties of cultured cancer cell lines have been demonstrated to translate to human tumors 39, but analyzing tumor metabolism in patients as we describe here provides direct evidence for metabolic activities at work in the native tumor microenvironment. In the current study, metabolites extracted from pediatric solid tumors of various types contained abundant 13C labeling in TCA cycle intermediates. The pattern of labeling is best explained by oxidative function of the TCA cycle within the tumors; i.e., 13C-pyruvate derived from the infused 13C-glucose supplies the TCA cycle in the tumors through PDH, PC and other enzymes of the cycle. We cannot rule out the possibility that labeling of TCA cycle metabolism also occurs in stromal and immune cells within the tumor, but data from preclinical models unequivocally demonstrate the function of PDH, PC and other aspects of mitochondrial metabolism within cancer cells in vivo 40,41. Glycolytic activity within the tumors we studied further emphasize that tumors can use glycolysis and oxidative metabolism in the TCA cycle concurrently, as described in previous studies 25,27. Mitochondrial substrate oxidation in these tumors could have therapeutic implications, as blockade of mitochondrial oxidative phosphorylation has shown antitumor efficacy in preclinical models of neuroblastoma 42 and has advanced to clinical trials in other forms of cancer.
Metabolic studies in adult cancers often focus on identifying differences between the tumor and the adjacent non-malignant tissue, for example comparing lung tumor tissue to the adjacent lung available from surgical resections 43. This type of comparison is difficult in pediatric tumors where healthy tissue is often unavailable for analysis, and because the embryonic origin of many of these tumors makes it difficult to identify a proper control tissue for comparison. However a few studies have sought to identify metabolic differences among pediatric solid tumors arising from different embryonic tissues. Applying high-resolution 1H magic angle spinning to analyze tumor samples from neuroblastoma, medulloblastoma and retinoblastoma revealed distinct metabolic signatures in each tumor type 44,45. We broadly profiled over 200 metabolites and detected the expected overabundance of catecholamine-related metabolites, which correlated with increased expression of enzymes in this pathway, in neuroblastomas. Urinary catecholamines are commonly measured in the clinical evaluation of neuroblastoma, and over 75% of patients have elevated catecholamines at presentation 46. Expanding our neuroblastoma cohort may allow us to use metabolomics, isotope tracing and gene expression analysis to identify pathways that contribute to cancer progression in patients with high-risk disease.
We also observed differences in 13C labeling between neuroblastomas and the other tumor types. The neuroblastomas tended to have high labeling in lactate relative to glucose in the plasma. Lactate labeling in tumors occurs through multiple pathways, including conversion of 13C-glucose to 13C-lactate via glycolysis within the tumor, or metabolism of 13C-glucose in other tissues, followed by secretion of 13C-pyruvate and 13C-lactate into the bloodstream and uptake of those metabolites by the tumor. Our data suggest that transport of 13C-lactate from the blood is responsible for at least part of the lactate labeling in neuroblastomas. This conclusion is based on high 13C labeling in lactate relative to 3PG (Fig. 3A,B, S4F), as previously reported in some NSCLSs 24,27. In mice, blocking MCT1 in cancer cells reduces the tumor’s lactate:3PG labeling ratio, indicating that lactate uptake by cancer cells can contribute to lactate labeling in tumors 24,30. Lactate labeling was almost identical between neuroblastomas and sarcomas in our cohort (Fig. 3B). However, unlike the neuroblastomas, the sarcomas had relatively balanced labeling between 3PG and lactate. Because we do not detect labeled 3PG in the circulation, 13C-3PG is most likely generated from 13C-glucose within the tumor via glycolysis. The overall pattern therefore suggests that in sarcomas, glycolysis within the tumor more substantially contributes to 13C-lactate than in neuroblastomas. A similar pattern was observed in human ccRCC, where loss of the tumor suppressor VHL enhances glycolysis and suppresses PDH 28. This is reflected by the fact that sarcomas and ccRCCs generally have lactate:3PG labeling ratios close to 1.0, while most neuroblastomas had higher ratios (Fig. 3D). Importantly, caution must be used when interpreting these data, because other processes may also contribute to excess labeling in lactate relative to 3PG, thus driving up the labeling ratio. These processes, which are not mutually exclusive with lactate uptake, could include pathways that dilute 3PG labeling by delivering unlabeled carbon to glycolysis. We also cannot rule out the possibility that neuroblastomas contain a 3PG pool that does not participate in glycolysis within the tumor; i.e. it does not become labeled by 13C-glucose and does not contribute to 13C-lactate. Because extraction of metabolites from these tumors results in the mixing of all pools together, a metabolically inactive 3PG pool could result in high lactate labeling relative to 3PG, even if the lactate arose from glycolysis in the tumor.
Further analysis of lactate metabolism and other pathways will be aided by disease-relevant mouse models of pediatric cancer. A recent analysis of patient-derived xenografts emphasized the preservation of histological and molecular features from human to mouse 47. These models may provide opportunities to complement the human infusions, which have several practical limitations despite their utility in characterizing tumor metabolism. The overall paucity of pediatric cancer patients limits accrual at any single center. Furthermore, we have noted trepidation to enroll children in optional studies with no direct benefit to the patient; it is perhaps reasonable to expect that these issues might be more difficult to overcome in pediatric cancer than in the adult cancers we have studied. Other practical considerations include the cost and availability of sufficient quantities of sterile, pyrogen-free 13C-labeled materials to perform human infusions, and the sometimes unpredictable nature of surgical procedures impacting the timing of tissue sampling and abundance of material for analysis. Reliable mouse models of pediatric cancer will provide experimentally tractable systems to analyze tumor metabolism, hopefully informing future clinical research.
In conclusion, this study demonstrates that intra-operative infusions with [U-13C]glucose are well-tolerated and informative in pediatric cancer. Future studies will expand this initial cohort to validate the phenotypes reported here, identify new ones, and determine which aspects of tumor metabolism correlate with aggressive tumor biology. Our study also suggests that it will be possible to use 13C infusions to observe how metabolism evolves as cancer progresses. Ten of the tumors we analyzed here were exposed to chemotherapy prior to the infusion. This contrasts with published studies in adult cancers, where the vast majority of tumors reported to date were treatment-naive. A comparison of neuroblastomas before and after therapy did not reveal major differences in 13C labeling. It will be interesting to perform this type of analysis in a larger cohort and to perform longitudinal sampling of the same patient. Longitudinal studies would more directly assess the effect of chemotherapy on tumor metabolism, and might uncover metabolic changes that accompany acquired therapy resistance in highly intractable childhood cancers.
Limitations of study.
Because our cohort is relatively small and comprised of diverse tumor types, we are limited in our ability to detect metabolic differences among clinically important tumor subsets. This includes particular subsets of neuroblastoma defined by differences in response to therapy, recurrence and overall survival. Expanding our neuroblastoma cohort should allow us to test whether high-risk, intermediate-risk and low-risk neuroblastomas are metabolically distinct. Technical limitations of the study include the fact that our isotope tracing method detects the carbon contribution of glucose to metabolite pools rather than determining quantitative flux values, and reports average metabolite abundance and enrichment from a complex fragment of tissue rather than determining the particular contributions of different cell types within the tissue. Finally, the current study is observational rather than interventional, so we do not know whether any pathways detected in these tumors reflect targetable liabilities. Future work in disease-relevant mouse models should help determine which of these pathways promote cancer progression.
STAR Methods:
Resource Availability
Lead contact -
Further information and requests for resources and reagents should be directed to and will be fulfilled by the Lead Contact, Ralph J. DeBerardinis. (Ralph.DeBerardinis@UTSouthwestern.edu).
Materials availability-
This study did not generate new unique reagents.
Data and code availability –
This study did not generate new codes.
Experimental Model and Subject Details
Human Subjects.
Children identified by oncologists or surgeons at our institution were consecutively enrolled on a protocol approved by the UT Southwestern institutional review board (IRB), STU 052018–100, after parental consent and assent of the patient (required for children ages 10–17 years) were obtained. Eligibility criteria included children and young adults through the age of 26 years with extra-cranial solid tumors who were undergoing a biopsy or tumor resection for a known or suspected malignancy. Children were excluded if they had poorly-controlled diabetes or any other medical condition that prevented the administration of glucose.
Animal Studies.
All procedures were approved by UT Southwestern’s Institutional Animal Care and Use Committee in accordance with the Guide for the Care and Use of Laboratory Animals. Healthy female NSG mice were xenografted at 8–10 weeks of age. All mice were housed in pathogen free conditions prior to use. Prior to the described studies, mice were monitored regularly and determined to be healthy by the veterinary staff.
Cell Lines.
Cell lines were confirmed to be mycoplasma free using the e-Myco kit (Boca Scientific). The SK-N-AS neuroblastoma cell line was purchased from ATCC (CRL-2137™).
Method Details
Patient infusions with [U-13C]glucose.
On the day of surgery, sterile and pyrogen-free glucose labeled in all six carbons with 13C ([U-13C]glucose) obtained from Cambridge Isotope Laboratories was dissolved in sterile water at the clinical investigational pharmacy. Two weight-based dosing regimens, Regimen 1 and Regimen 2, were used (see Figure 1A). After the first 6 patients infused according to Regimen 1 were observed to have low enrichment in plasma glucose, Regimen 2 was used for the rest of the patients (see Results for additional details). A peripheral intravenous line (IV) was placed for the infusion, which was typically initiated 3 hours prior to the estimated time of tumor resection. Twenty-five percent of the total planned [U-13C]glucose was delivered as a 10-minute bolus, while the remaining 75% was administered as a continuous infusion until tumor samples were obtained. Additional [U-13C]glucose was administered at the same rate if the procedure exceeded 3 hours. Blood glucose levels were monitored by point of care testing and/or IV blood draws approximately every 30 minutes during the procedure until the tumor was removed. These samples were later used to determine 13C enrichment in glucose and other metabolites. The samples were stored on ice until the procedure was complete, after which they were centrifuged to separate the plasma, which was frozen and stored at −80°C. After tumor samples were obtained for diagnostic needs, a research sample was frozen in liquid nitrogen and stored at −80°C. Tumor histology was determined by a clinical pathologist, and another pathologist reviewed the research sample to ensure that viable tumor tissue was present in the sample.
Mouse xenografts and infusions.
Cells were suspended in RPMI, mixed 1:1 with Matrigel (Becton Dickinson), then 1×10⁶ cells were injected subcutaneously into the flanks of mice. Infusions were performed when the tumors were 1.2–1.8 cm in diameter. 25 gauge catheters were placed in the lateral tail vein of non-fasted mice under anesthesia. Isotope infusions were started immediately after the tail veil catheter was placed and continued for 3 hours. The dose [U-13C]glucose was prepared as 2.48g/kg dissolved in 750μl saline, and delivered as a bolus 125μl/min (1 min) followed by a continuous infusion at a rate of 2.5μl/min for 3 hours. Animals were euthanized at the end of the infusion and the tumors were harvested and cut into 4 equal pieces. One piece was flash frozen in liquid nitrogen immediately and the others were frozen after 5, 30 or 60 mins. Tumors were kept in a petri dish at room temperature until frozen.
Gas Chromatography-Mass Spectrometry Analysis.
Plasma samples were thawed on ice, then 100μL of each sample was added to 1ml of 80% methanol for extraction. Frozen tumor samples of about 20mg were added to 1ml of 80% methanol and homogenized. All samples were subjected to 3 freeze-thaw cycles followed by centrifugation at 13,000rpm for 5 minutes. The supernatant was dried down using a vacuum concentrator and resuspended in 40μL of 10mg/ml methoxyamine in pyridine. These samples were transferred to autoinjector vials and heated at 70°C for 15 minutes. 70μL of tert-butyldimethylsilyl (TBDMS) was then added and the samples were briefly vortexed and heated for another 60 minutes at 70°C. Aliquots of 1μL were analyzed on an Agilent 7890A gas chromatograph coupled to an Agilent 5975C mass selective detector. The data were then corrected for natural abundance to determine mass isotopologue distributions for informative metabolites.
Liquid-Chromatography Mass Spectrometry.
Additional tumor fragments were analyzed for metabolomics. Samples weighing about 20mg were homogenized in 300μL of 80% acetonitrile (ACN), after which they were subjected to 3 freeze-thaw cycles, vortexed, and normalized by their protein content to 100μg/μL for further analysis. These samples were dried down in a vacuum concentrator, then resuspended in 100μL of 0.1% formic acid. The samples were analyzed on an Agilent 1290 UHPLC liquid chromatography system coupled to a 6550 iFunnel Q-TOF mass spectrometer. All the metabolites in Table S3 were assigned by generating an in-house library of every metabolite on the list. Pure standards were purchased and analyzed using the same parameters that were employed in these metabolomics experiments. In addition, quality control standards containing mixtures of metabolites were injected along with the experimental samples to provide in-run validation of retention times, accurate masses and fragmentation.
Histology and molecular analysis.
All histological analyses were conducted by surgical pathologists blinded to the results of the metabolic study. Standard gross and microscopic examinations were performed on the resected tissue from each patient. Immunohistochemical (IHC) staining utilizing a Dako Omnis platform was performed on select slides with appropriately reactive controls. In certain cases, karyotyping was performed on cultured cells from fresh tumor tissue and fluorescence in situ hybridization (FISH) was performed on formalin-fixed paraffin-embedded tissue. Mutational analysis was performed in a clinical laboratory when dictated per standard of care.
Gene expression analysis.
mRNA abundance of enzymes involved in tyrosine metabolism was obtained through searching publicly available TCGA (https://portal.gdc.cancer.gov) and TARGET (https://ocg.cancer.gov/programs/target/data-matrix) datasets.
Quantification and statistical analysis.
In each analysis, tumors from different patients were tested in multiple independent experiments performed on different days. Prior to analyzing the statistical significance of differences among tumors, we tested whether the data were normally distributed and whether variance was similar among tumor groups. To test for normal distribution, we performed the Shapiro-Wilk test when 3≤n<20 or the D’Agostino Omnibus test when n≥20. To test if variability significantly differed among tumors, we performed F-tests (for experiments with two groups) or Levene’s median tests (for more than two groups). When the data significantly deviated from normality (p<0.01) or variability significantly differed among groups (p<0.05), we log2-transformed the data and tested again for normality and variability. Fold change data were always log2-transformed. If the transformed data no longer significantly deviated from normality and equal variability, we performed parametric tests on the transformed data. If the transformed data still significantly deviated from normality or equal variability, we performed non-parametric tests on the non-transformed data. Statistical tests were two-sided, where applicable. To assess the statistical significance of a difference between two groups, we used Student’s t-tests (when a parametric test was appropriate), Mann-Whitney tests (when a non-parametric test was appropriate), or Wilcoxon signed rank tests (when data were paired and a non-parametric test was appropriate). To assess the statistical significance of differences between more than two groups, we used one-way ANOVAs (when a parametric test was appropriate) followed by Tukey’s multiple comparisons adjustment. To assess the statistical significance of differences between repeated measures data, we used repeated measures two-way ANOVAs (when a parametric test was appropriate and there were no missing data points) or mixed-effects analyses (when a parametric test was appropriate and there were missing data points) followed by Tukey’s, Sidak’s, or Dunnett’s multiple comparisons adjustment. All statistical analyses were performed with Graphpad Prism 8.3.0 or R 3.5.1 with the stats, fBasics, and car packages. All data represent mean ± standard deviation. Samples sizes were not pre-determined based on statistical power calculations but were based on our experience with these assays. No data were excluded.
Additional Resources
Clinical trial information -
Patients were enrolled in the study “Pediatric Solid Tumor Metabolism [A Prospective Study Exploring Metabolism of Solid Tumors in Pediatrics],” registered as NCT03686566.
https://clinicaltrials.gov/ct2/show/NCT03686566?term=NCT03686566&draw=2&rank=1
Supplementary Material
Table S2: Isotopologue data from [U-13C]glucose infusions. (Related to Figures 1–3). The data include mass isotopologues for plasma glucose at the time of tumor sampling, and mass isotopologues from glucose-derived metabolites extracted from the tumors.
Table S3: Metabolomic data. (Related to Figure 4). Data are from metabolites extracted from 19 tumors. The log10 p-values and log2 fold changes between neuroblastomas and all other tumors used to derive the volcano plot in Fig. 4B are also shown.
Table S4: Metabolite Set Enrichment Analysis (MSEA) (Related to Figure 4). Enrichment of metabolic pathways between neuroblastomas versus other pediatric tumors. 65 significantly different metabolites (determined by Variable Importance in the Projection score >1) were used to perform metabolite set enrichment analysis (MSEA), which clusters metabolites into 33 pathways annotated by the KEGG database.
KEY RESOURCES TABLE.
| REAGENT or RESOURCE | SOURCE | IDENTIFIER |
|---|---|---|
| Antibodies | ||
| MCT1 | Thermo Fisher | Cat# MA5-18288; RRID: AB_2539662 |
| MCT4 | Santa Cruz | Cat# 50329; RRID: AB_2189333 |
| LDHA | Cell Signaling | Cat# C4B5; RRID: AB_2066887 |
| LDHB | Novus | Cat# 3EP1565Y RRID: AB_1109158 |
| B-Actin | Sigma-Aldrich | Cat# A3854; RRID: AB_262011 |
| Tyrosine Hydroxylase | Novus | Cat# NB300-109; RRID: AB_10077691 |
| Dopamine B-Hydroxylase | Abcam | Cat# ab209487 |
| Homogentisate dioxygenase (HGD) | Abcam | Cat# ab225926 |
| 4-hydroxyphenylpyruvate dioxygenase (HPD) | Abcam | Cat# ab133515 |
| Bacterial and Virus Strains | ||
| None | ||
| Biological Samples | ||
| Blood Samples | This study | N/A |
| Tumor Tissue | This study | N/A |
| Chemicals, Peptides, and Recombinant Proteins | ||
| [U-13C]Glucose | Cambridge Isotope Laboratories | Cat#CLM-1396-MPT-PK |
| Methoxyamine | Sigma | 226904 |
| Methanol, LC/MS Grade | Fisher Scientific | A456-4 |
| Acetonitrile, LC/MS Grade | Fisher Scientific | A9554 |
| Pyridine | Sigma Aldrich | 270407 |
| TBDMS | Sigma Aldrich | 394882 |
| Critical Commercial Assays | ||
| None | ||
| Deposited Data | ||
| None | ||
| Experimental Models: Cell Lines | ||
| SK-N-AS | ATCC | Cat# CRL-2137 RRID:CVCL_1700 |
| Experimental Models: Organisms/Strains | ||
| NSG female Mice | UTSW Breeding Core | NSG Mice |
| Oligonucleotides | ||
| None | ||
| Recombinant DNA | ||
| None | ||
| Software and Algorithms | ||
| Metaboanalyst | McGill | www.metaboanalyst.ca |
| The Cancer Genome Atlas | NIH | https://cancergenome.nih.gov |
| Therapeutically Applicable Research To Generate Effective Treatments | NIH | https://ocg.cancer.gov/programs/target/data-matrix |
Highlights.
13C infusions were used to study tumor metabolism in children as young as 4 months
Pediatric tumors of several types use glycolysis and the citric acid cycle in vivo
Neuroblastomas have high lactate labeling suggesting import from the blood
Neuroblastomas have abundant metabolites related to catecholamine synthesis
Context and Significance.
Cancer remains a leading cause of childhood mortality, highlighting the need for better treatments. Altered tumor metabolism can provide predictive value and therapeutic opportunities, but metabolism has not been thoroughly examined in primary pediatric cancers. In this study, intra-operative 13C-glucose infusions and metabolomic profiling were performed across multiple solid extracranial pediatric malignancies. In addition to demonstrating that these studies are safe in children, this study reports that pediatric tumors use glycolysis and the citric acid cycle to metabolize glucose in vivo. Moreover, subtype-specific changes are identified, including subtle differences in glucose handling between tumor types and elevated metabolites related to catecholamine synthesis in neuroblastoma. This study highlights the power of in vivo analysis to characterize tumor metabolism in children.
Acknowledgments:
We thank all the patients who participated in the study, and their families. We also thank our colleagues in general surgery, orthopedic surgery, interventional radiology and investigational pharmacy. Jessica Sudderth provided assistance in isotope enrichment measurements and feedback on the manuscript. The work was funded by grants from the N.C.I. to P.J. L. (R21CA220090-01A1); R.J.D. (R35CA22044901); and B.F. (K99CA237724). R.J.D. is also funded by the Howard Hughes Medical Institute, the 1 Million 4 Anna Foundation and the Robert L. Moody, Sr. Faculty Scholar Award. K.J. is funded by an award from the Children’s Clinical Research Advisory Committee. A.T. was supported by the Leopoldina Fellowship (LPDS 2016-16) from the German National Academy of Sciences and the Fritz Thyssen Foundation.
Footnotes
Declaration of Interests: R.J.D. is an advisor for Agios Pharmaceuticals and Vida Ventures.
Publisher's Disclaimer: This is a PDF file of an unedited manuscript that has been accepted for publication. As a service to our customers we are providing this early version of the manuscript. The manuscript will undergo copyediting, typesetting, and review of the resulting proof before it is published in its final form. Please note that during the production process errors may be discovered which could affect the content, and all legal disclaimers that apply to the journal pertain.
References:
- 1.Society, A.C. (2020). Cancer Facts & Figures 2020. https://www.cancer.org/cancer/cancer-in-children/key-statistics.html#references.
- 2.Matthay KK, Maris JM, Schleiermacher G, Nakagawara A, Mackall CL, Diller L, and Weiss WA (2016). Neuroblastoma . Nat Rev Dis Primers 2, 16078. [DOI] [PubMed] [Google Scholar]
- 3.Maris JM (2010). Recent advances in neuroblastoma. The New England journal of medicine 362, 2202–2211. [DOI] [PMC free article] [PubMed] [Google Scholar]
- 4.Park JR, and Bagatell R (2016). Chapter 24 - Neuroblastoma. In Lanzkowsky’s Manual of Pediatric Hematology and Oncology (Sixth Edition), Lanzkowsky P, Lipton JM, and Fish JD, eds. (Academic Press; ), pp. 473–490. [Google Scholar]
- 5.Pinto NR, Applebaum MA, Volchenboum SL, Matthay KK, London WB, Ambros PF, Nakagawara A, Berthold F, Schleiermacher G, Park JR, et al. (2015). Advances in Risk Classification and Treatment Strategies for Neuroblastoma. Journal of clinical oncology : official journal of the American Society of Clinical Oncology 33, 3008–17. [DOI] [PMC free article] [PubMed] [Google Scholar]
- 6.Sangkhathat S (2015). Current management of pediatric soft tissue sarcomas. World J Clin Pediatr 4, 94–105. [DOI] [PMC free article] [PubMed] [Google Scholar]
- 7.Smith MA, Altekruse SF, Adamson PC, Reaman GH, and Seibel NL (2014). Declining childhood and adolescent cancer mortality. Cancer 120, 2497–2506. [DOI] [PMC free article] [PubMed] [Google Scholar]
- 8.Hanahan D, and Weinberg RA (2011). Hallmarks of cancer: the next generation. Cell 144, 646–74. [DOI] [PubMed] [Google Scholar]
- 9.DeBerardinis RJ, and Chandel NS (2016). Fundamentals of cancer metabolism. Sci Adv 2, e1600200. [DOI] [PMC free article] [PubMed] [Google Scholar]
- 10.Yan H, Parsons DW, Jin G, McLendon R, Rasheed BA, Yuan W, Kos I, Batinic-Haberle I, Jones S, Riggins GJ, et al. (2009). IDH1 and IDH2 mutations in gliomas. The New England journal of medicine 360, 765–73. [DOI] [PMC free article] [PubMed] [Google Scholar]
- 11.Figueroa ME, Abdel-Wahab O, Lu C, Ward PS, Patel J, Shih A, Li Y, Bhagwat N, Vasanthakumar A, Fernandez HF, et al. (2010). Leukemic IDH1 and IDH2 mutations result in a hypermethylation phenotype, disrupt TET2 function, and impair hematopoietic differentiation. Cancer Cell 18, 553–67. [DOI] [PMC free article] [PubMed] [Google Scholar]
- 12.Golub D, Iyengar N, Dogra S, Wong T, Bready D, Tang K, Modrek AS, and Placantonakis DG (2019). Mutant Isocitrate Dehydrogenase Inhibitors as Targeted Cancer Therapeutics. Front Oncol 9, 417–417. [DOI] [PMC free article] [PubMed] [Google Scholar]
- 13.Popovici-Muller J, Lemieux RM, Artin E, Saunders JO, Salituro FG, Travins J, Cianchetta G, Cai Z, Zhou D, Cui D, et al. (2018). Discovery of AG-120 (Ivosidenib): A First-in-Class Mutant IDH1 Inhibitor for the Treatment of IDH1 Mutant Cancers. ACS medicinal chemistry letters 9, 300–305. [DOI] [PMC free article] [PubMed] [Google Scholar]
- 14.Clavell LA, Gelber RD, Cohen HJ, Hitchcock-Bryan S, Cassady JR, Tarbell NJ, Blattner SR, Tantravahi R, Leavitt P, and Sallan SE (1986). Four-agent induction and intensive asparaginase therapy for treatment of childhood acute lymphoblastic leukemia. The New England journal of medicine 315, 657–63. [DOI] [PubMed] [Google Scholar]
- 15.Egler RA, Ahuja SP, and Matloub Y (2016). L-asparaginase in the treatment of patients with acute lymphoblastic leukemia. J Pharmacol Pharmacother 7, 62–71. [DOI] [PMC free article] [PubMed] [Google Scholar]
- 16.Kim J, and DeBerardinis RJ (2019). Mechanisms and Implications of Metabolic Heterogeneity in Cancer. Cell Metab 30, 434–446. [DOI] [PMC free article] [PubMed] [Google Scholar]
- 17.Yuneva MO, Fan TW, Allen TD, Higashi RM, Ferraris DV, Tsukamoto T, Mates JM, Alonso FJ, Wang C, Seo Y, et al. (2012). The metabolic profile of tumors depends on both the responsible genetic lesion and tissue type. Cell Metab 15, 157–70. [DOI] [PMC free article] [PubMed] [Google Scholar]
- 18.Faubert B, Solmonson A, and DeBerardinis RJ (2020). Metabolic reprogramming and cancer progression. Science 368, eaaw5473. [DOI] [PMC free article] [PubMed] [Google Scholar]
- 19.Hu J, Locasale JW, Bielas JH, O’Sullivan J, Sheahan K, Cantley LC, Vander Heiden MG, and Vitkup D (2013). Heterogeneity of tumor-induced gene expression changes in the human metabolic network. Nat Biotechnol 31, 522–9. [DOI] [PMC free article] [PubMed] [Google Scholar]
- 20.Pugh TJ, Morozova O, Attiyeh EF, Asgharzadeh S, Wei JS, Auclair D, Carter SL, Cibulskis K, Hanna M, Kiezun A, et al. (2013). The genetic landscape of high-risk neuroblastoma. Nat Genet 45, 279–84. [DOI] [PMC free article] [PubMed] [Google Scholar]
- 21.Chalmers ZR, Connelly CF, Fabrizio D, Gay L, Ali SM, Ennis R, Schrock A, Campbell B, Shlien A, Chmielecki J, et al. (2017). Analysis of 100,000 human cancer genomes reveals the landscape of tumor mutational burden. Genome Med 9, 34. [DOI] [PMC free article] [PubMed] [Google Scholar]
- 22.Federico S, Brennan R, and Dyer MA (2011). Childhood cancer and developmental biology a crucial partnership. Curr Top Dev Biol 94, 1–13. [DOI] [PMC free article] [PubMed] [Google Scholar]
- 23.Cheung NK, and Dyer MA (2013). Neuroblastoma: developmental biology, cancer genomics and immunotherapy. Nat Rev Cancer 13, 397–411. [DOI] [PMC free article] [PubMed] [Google Scholar]
- 24.Faubert B, Li KY, Cai L, Hensley CT, Kim J, Zacharias LG, Yang C, Do QN, Doucette S, Burguete D, et al. (2017). Lactate Metabolism in Human Lung Tumors. Cell 171, 358–371.e9. [DOI] [PMC free article] [PubMed] [Google Scholar]
- 25.Fan TWM, Lane AN, Higashi RM, Farag MA, Gao H, Bousamra M, and Miller DM (2009). Altered regulation of metabolic pathways in human lung cancer discerned by (13)C stable isotope-resolved metabolomics (SIRM). Mol Cancer 8, 41–41. [DOI] [PMC free article] [PubMed] [Google Scholar]
- 26.Sellers K, Fox MP, Bousamra M II, Slone SP, Higashi RM, Miller DM, Wang Y, Yan J, Yuneva MO, Deshpande R, et al. (February 2). Pyruvate carboxylase is critical for non-small-cell lung cancer proliferation. The Journal of Clinical Investigation 125, 687–698. [DOI] [PMC free article] [PubMed] [Google Scholar]
- 27.Hensley CT, Faubert B, Yuan Q, Lev-Cohain N, Jin E, Kim J, Jiang L, Ko B, Skelton R, Loudat L, et al. (2016). Metabolic Heterogeneity in Human Lung Tumors. Cell 164, 681–694. [DOI] [PMC free article] [PubMed] [Google Scholar]
- 28.Courtney KD, Bezwada D, Mashimo T, Pichumani K, Vemireddy V, Funk AM, Wimberly J, McNeil SS, Kapur P, Lotan Y, et al. (2018). Isotope Tracing of Human Clear Cell Renal Cell Carcinomas Demonstrates Suppressed Glucose Oxidation In Vivo. Cell metabolism 28, 793–800.e2. [DOI] [PMC free article] [PubMed] [Google Scholar]
- 29.Maher EA, Marin-Valencia I, Bachoo RM, Mashimo T, Raisanen J, Hatanpaa KJ, Jindal A, Jeffrey FM, Choi C, Madden C, et al. (2012). Metabolism of [U-13 C]glucose in human brain tumors in vivo. NMR Biomed 25, 1234–44. [DOI] [PMC free article] [PubMed] [Google Scholar]
- 30.Tasdogan A, Faubert B, Ramesh V, Ubellacker JM, Shen B, Solmonson A, Murphy MM, Gu Z, Gu W, Martin M, et al. (2020). Metabolic heterogeneity confers differences in melanoma metastatic potential. Nature 577, 115–120. [DOI] [PMC free article] [PubMed] [Google Scholar]
- 31.Bier DM, Leake RD, Haymond MW, Arnold KJ, Gruenke LD, Sperling MA, and Kipnis DM (1977). Measurement of “true” glucose production rates in infancy and childhood with 6,6-dideuteroglucose. Diabetes 26, 1016–23. [DOI] [PubMed] [Google Scholar]
- 32.Lau AN, Li Z, Danai LV, Westermark AM, Darnell AM, Ferreira R, Gocheva V, Sivanand S, Lien EC, Sapp KM, et al. (2020). Dissecting cell-type-specific metabolism in pancreatic ductal adenocarcinoma. Elife 9. [DOI] [PMC free article] [PubMed] [Google Scholar]
- 33.Markert CL, Shaklee JB, and Whitt GS (1975). Evolution of a gene. Multiple genes for LDH isozymes provide a model of the evolution of gene structure, function and regulation. Science 189, 102–14. [DOI] [PubMed] [Google Scholar]
- 34.Chatham JC, Des Rosiers C, and Forder JR (2001). Evidence of separate pathways for lactate uptake and release by the perfused rat heart. Am J Physiol Endocrinol Metab 281, E794–802. [DOI] [PubMed] [Google Scholar]
- 35.Svoboda LK, Teh SSK, Sud S, Kerk S, Zebolsky A, Treichel S, Thomas D, Halbrook CJ, Lee HJ, Kremer D, et al. (2018). Menin regulates the serine biosynthetic pathway in Ewing sarcoma. J Pathol 245, 324–336. [DOI] [PMC free article] [PubMed] [Google Scholar]
- 36.Issaq SH, Mendoza A, Kidner R, Rosales TI, Duveau DY, Heske CM, Rohde JM, Boxer MB, Thomas CJ, DeBerardinis RJ, et al. (2020). EWS-FLI1-regulated serine synthesis and exogenous serine are necessary for Ewing sarcoma cellular proliferation and tumor growth. Mol Cancer Ther. [DOI] [PMC free article] [PubMed] [Google Scholar]
- 37.Tanner JM, Bensard C, Wei P, Krah NM, Schell JC, Gardiner J, Schiffman J, Lessnick SL, and Rutter J (2017). EWS/FLI is a Master Regulator of Metabolic Reprogramming in Ewing Sarcoma. Mol Cancer Res 15, 1517–1530. [DOI] [PMC free article] [PubMed] [Google Scholar]
- 38.Qing G, Li B, Vu A, Skuli N, Walton ZE, Liu X, Mayes PA, Wise DR, Thompson CB, Maris JM, et al. (2012). ATF4 regulates MYC-mediated neuroblastoma cell death upon glutamine deprivation. Cancer Cell 22, 631–44. [DOI] [PMC free article] [PubMed] [Google Scholar]
- 39.Chen P-H, Cai L, Huffman K, Yang C, Kim J, Faubert B, Boroughs L, Ko B, Sudderth J, McMillan EA, et al. (2019). Metabolic Diversity in Human Non-Small Cell Lung Cancer Cells. Molecular Cell 76, 838–851.e5. [DOI] [PMC free article] [PubMed] [Google Scholar]
- 40.Davidson SM, Papagiannakopoulos T, Olenchock BA, Heyman JE, Keibler MA, Luengo A, Bauer MR, Jha AK, O’Brien JP, Pierce KA, et al. (2016). Environment Impacts the Metabolic Dependencies of Ras-Driven Non-Small Cell Lung Cancer. Cell Metab 23, 517–28. [DOI] [PMC free article] [PubMed] [Google Scholar]
- 41.Weinberg F, Hamanaka R, Wheaton WW, Weinberg S, Joseph J, Lopez M, Kalyanaraman B, Mutlu GM, Budinger GR, and Chandel NS (2010). Mitochondrial metabolism and ROS generation are essential for Kras-mediated tumorigenicity. Proc Natl Acad Sci U S A 107, 8788–93. [DOI] [PMC free article] [PubMed] [Google Scholar]
- 42.Molina JR, Sun Y, Protopopova M, Gera S, Bandi M, Bristow C, McAfoos T, Morlacchi P, Ackroyd J, Agip AA, et al. (2018). An inhibitor of oxidative phosphorylation exploits cancer vulnerability. Nat Med 24, 1036–1046. [DOI] [PubMed] [Google Scholar]
- 43.Kim J, Hu Z, Cai L, Li K, Choi E, Faubert B, Bezwada D, Rodriguez-Canales J, Villalobos P, Lin Y-F, et al. (2017). CPS1 maintains pyrimidine pools and DNA synthesis in KRAS/LKB1-mutant lung cancer cells. Nature 546, 168–172. [DOI] [PMC free article] [PubMed] [Google Scholar]
- 44.Wilson M, Davies NP, Brundler MA, McConville C, Grundy RG, and Peet AC (2009). High resolution magic angle spinning 1H NMR of childhood brain and nervous system tumours. Mol Cancer 8, 6. [DOI] [PMC free article] [PubMed] [Google Scholar]
- 45.Kohe SE, Bennett CD, Gill SK, Wilson M, McConville C, and Peet AC (2018). Metabolic profiling of the three neural derived embryonal pediatric tumors retinoblastoma, neuroblastoma and medulloblastoma, identifies distinct metabolic profiles. Oncotarget 9, 11336–11351. [DOI] [PMC free article] [PubMed] [Google Scholar]
- 46.LaBrosse EH, Comoy E, Bohuon C, Zucker JM, and Schweisguth O (1976). Catecholamine metabolism in neuroblastoma. Journal of the National Cancer Institute 57, 633–8. [DOI] [PubMed] [Google Scholar]
- 47.Rokita JL, Rathi KS, Cardenas MF, Upton KA, Jayaseelan J, Cross KL, Pfeil J, Egolf LE, Way GP, Farrel A, et al. (2019). Genomic Profiling of Childhood Tumor Patient-Derived Xenograft Models to Enable Rational Clinical Trial Design. Cell Rep 29, 1675–1689 e9. [DOI] [PMC free article] [PubMed] [Google Scholar]
Associated Data
This section collects any data citations, data availability statements, or supplementary materials included in this article.
Supplementary Materials
Table S2: Isotopologue data from [U-13C]glucose infusions. (Related to Figures 1–3). The data include mass isotopologues for plasma glucose at the time of tumor sampling, and mass isotopologues from glucose-derived metabolites extracted from the tumors.
Table S3: Metabolomic data. (Related to Figure 4). Data are from metabolites extracted from 19 tumors. The log10 p-values and log2 fold changes between neuroblastomas and all other tumors used to derive the volcano plot in Fig. 4B are also shown.
Table S4: Metabolite Set Enrichment Analysis (MSEA) (Related to Figure 4). Enrichment of metabolic pathways between neuroblastomas versus other pediatric tumors. 65 significantly different metabolites (determined by Variable Importance in the Projection score >1) were used to perform metabolite set enrichment analysis (MSEA), which clusters metabolites into 33 pathways annotated by the KEGG database.
Data Availability Statement
This study did not generate new codes.