

Abstract
Objective
Myasthenia gravis (MG) is an autoimmune disease caused by autoantibodies against neuromuscular junctions. Myasthenic crisis (MC) represents the most severe state of MG with high in‐hospital mortality. We aimed to identify immune signatures using in‐depth profiling in MC, and to assess the correlations between immune biomarkers with clinical severity longitudinally.
Methods
We studied 181 participants including 57 healthy controls, 96 patients with MG who never experienced crisis and 28 MC patients from December 2018 through June 2020. Follow‐up visits occurred prospectively from crisis to 6 months off‐mechanical ventilation. The frequencies of 20 CD4+ T subpopulations and 18 serum cytokines were associated with clinical scores using correlations and principal component analysis.
Results
Patients in crisis exhibited a proinflammatory CD4+T response with elevated Th1 (P = 0.026), and Th17 cells (P = 0.032); decreased T follicular helper 2 (Tfh2) cells (P < 0.001), Tnaive in Tfh cells (P < 0.001), ICOS−Tfh cells (P = 0.017), and T central memory in Tfh (P = 0.022) compared with controls, and increased frequencies of Tregs (P = 0.026) and Tfh17 (P = 0.045) compared with non‐crisis MG. Cytokine cascade was identified in crisis including the ones associated with Th1 (IL‐1β/2/12p70/18/27/IFN‐γ/TNF‐α), Th2 (IL‐4/5/13), Th17 (IL‐6/17A/21/22/23/GM‐CSF), Th9 (IL‐9), and Treg (IL‐10). Longitudinally, seven immune biomarkers including Tregs, IL‐2/4/17A/IFN‐γ/TNF‐α/GM‐CSF had significant correlations with MG‐activities of daily living score.
Interpretation
Vigorous inflammatory CD4+ T signatures were identified in MC and are associated with clinical severity. Future research is needed to explore its potential candidacy for therapeutic intervention and predicting impending crisis.
Introduction
Myasthenia gravis (MG) is an autoimmune disease that is characterized by fatigable weakness in extraocular, bulbar, limb, and axial muscles with a prevalence of 40–180 per million people worldwide. 1 , 2 The disease generally begins with ocular symptom and extends to other muscles in 80% of patients. 3 , 4 Rapid worsening dysphagia and respiratory failure indicate myasthenic crisis (MC), which is a potentially life‐threatening complication requiring ventilatory support. MC occurs in approximately 15–20% of MG patients in their lifetime. 5 The incidence of post‐thymectomy MC is 11.5–18.2% and the in‐hospital mortality rate is 10–12%. 6 , 7 , 8 , 9 , 10 Thus patients in crisis represent the most serious clinical condition of MG and potentially undergo a vigorous autoimmune process. 11 Given the devastating nature of the MC state, prognostic immune biomarkers would be especially valuable for predicting disease severity and providing insights for the development of therapies, as well as monitoring therapy efficacy.
Immune dysregulation in MG including autoantibodies production, imbalance among CD4+ T subsets such as Th1, Th2, Th17, and T regulatory (Treg) cells, and the involvement of CD8+ cells and antigen‐presenting cells. 12 Autoantibodies against the acetylcholine receptor (AChR), muscle‐specific kinase (MuSK), and lipoprotein‐related protein 4 are well established as sensitive and specific diagnostic biomarkers. 13 , 14 , 15 However, there is no correlation between antibody titer and the disease activity.
Notably, peripheral CD4+ T lymphocytes play important roles in the immunopathogenesis process in MG, as evidenced by the presence of autoreactive CD4+ T subsets with elevated IL‐17, IFN‐r, and GM‐CSF, 16 , 17 , 18 as well as upregulated follicular T helper (Tfh) cells. 19 , 20 In particular, the immune profile of patients in crisis remained poorly understood. Thus, comprehensive and dynamic profiling of peripheral CD4+ T lymphocyte and cytokines in MC may facilitate the understanding of the immunological process and provide promising candidates for disease biomarkers and targets for therapeutic development.
Herein, we hypothesized that peripheral CD4+ T immune responses have correlations with the disease severity of MG, with activated CD4+ T cells and proinflammatory cytokines dominating the process of MC. We also hypothesized that associations would be detected between inflammatory biomarkers and the clinical severity after MC. In this study, peripheral blood mononuclear cells and serum were obtained from MG patients in or after the crisis longitudinally, and correlations were assessed among the peripheral CD4+ T and cytokine profiles with clinical MG scores.
Patients and Methods
Study subjects
A total of 181 participants were recruited in our study. Twenty‐eight consecutive patients in crisis (also classified as Myasthenia Gravis Foundation of America Class V, MGFA V) with mechanical ventilation (MV) were prospectively recruited from five neurological intensive care units (NICUs) or neurologically associated interdisciplinary intensive care units (ICUs) in North, West and General campus of Huashan Hospital Fudan University, Shanghai. Multiple visits for clinical evaluations and sampling were achieved in crisis (at the first 3 days with ventilatory support, n = 28), at 1 week (n = 24), 1 month (n = 18), 2 months (n = 13), 3 months (n = 13) and 6 months off‐ventilation (n = 15). A cohort of 96 generalized MG patients with the MGFA Class II–IV who had never had a crisis was included from the neuromuscular clinic or neurological department of Huashan Hospital for comparative analysis. All participants were aged 18 years or older and recruited from 1 December 2018, through 4 June 2020. All participants met the inclusion criteria as follows: (1) clinical history and signs of fluctuating weakness and fatigability; (2) seropositivity for AChR/MuSK antibodies; and (3) if negative for the tested antibodies, positive repetitive nerve stimulation (RNS) at low frequency (2–5 Hz) is required. 21 , 22 Participants were excluded if the RNS had over 100% increase after high‐frequency stimulation or R2 repeats, to differentiate from lambert‐Eaton syndrome and congenital MG. The MG participants were excluded if they had the concurrence of fever when sampling. Healthy controls, enrolled through the hospital, were excluded if they had a previous diagnosis of neuroimmune diseases or systemic autoimmune disorders or any fever or sickness at the time of blood sampling.
Clinical assessment
Each participant had been evaluated by MG‐activities of daily living (MG‐ADL) scale and MG Quality of Life 15 (QoL‐15) questionnaire. MGFA‐quantitative MG test (MGFA‐QMG), and MG manual muscle test (MMT) were evaluated by experienced MG specialists.
Laboratory testing and data acquisition
Serum antibody testing
Serum antibodies were measured against AChR and MuSK using Enzyme‐linked immunosorbent assays (ELISA, Euroimmun, Lübeck, Germany). The serums from participants were obtained and firstly sent for anti‐AChR antibody testing. If the result was negative, the anti‐MuSK antibody was subsequently tested. The optical density was read at 450 nm within 30 min of adding the stop solution. The result was presented as antibody titers using four Parameter‐Logistics fitting method to calculate the concentration. The cut‐off threshold for anti‐AChR and MuSK antibodies are 0.50 nmol/L and 0.4 U/mL.
Flow cytometry immunophenotyping of cell subsets
Blood samples were drawn from each participant into tubes containing EDTA and sent immediately for flow cytometry analysis. A 300 μL aliquot of whole blood was incubated with a cocktail of titrated, monoclonal, fluorochrome‐labeled antibodies in the dark for 20 min at 20°C. Then whole blood was lysed twice with red blood cell lysing buffer (TIANGEN, Beijing, China) by centrifugation at 350g for 5 min at 20°C, followed by two washes with phosphate buffer saline and re‐suspension in fluorescence activating cell sorter buffer. Cell phenotyping was performed using Attune NxT Flow Cytometer (Thermo Fisher Scientific, Waltham, MA, USA) and analyzed by Flowjo VX Software (Flowjo, LLC (BD life sciences, Franklin Lakes, NJ, US)). CD4+ T‐cell profiling was performed using a cell‐surface protocol according to previous studies. 23 , 24 , 25 Briefly, we first gated CD3+CD4+ T cells and CD3+CD4− T cells, and at least 100,000 events were acquired per sample in the lymphocyte gate. Then the frequency of CD4+ T subsets was identified as follows: Tnaive: CD27+CD45RA+; T central memory (TCM): CD27+CD45RA−; T effect memory (TEM): CD27−CD45RA−; T effect memory‐ra (TEMRA): CD27−CD45RA+; Th1: CXCR3+CCR6−; Th2: CXCR3−CCR6−; Th9: CCR4−CCR6+; Th17: CXCR3−CCR6+; Th17/1: CXCR3+CCR6+; Tfh: CXCR5+; ICOS+Tfh: ICOS+CXCR5+; ICOS−Tfh: ICOS−CXCR5+; Tfh1: CXCR5+CXCR3+CCR6−; Tfh2: CXCR5+CXCR3− CCR6−; Tfh17: CXCR5+CXCR3−CCR6+; Tnaive in Tfh: CXCR5+CD27−CD45RA+; Tfh central memory (TCM in Tfh): CXCR5+CD27+ CD45RA−; Tfh effect memory (TEM in Tfh): CXCR5+CD27−CD45RA−; Tfh effect memory‐ra (TEMRA in Tfh): CXCR5+CD27−CD45RA+; Treg: CD25hi CD127dim.
Serum cytokines analysis
Serum was isolated by centrifugation at 1690 g for 15 min at 20°C, subsequently followed by the preservation at −80°C. CD4+ T‐cell‐related cytokines were measured using a ProcartaPlex™ Multiplex panel (Thermo Fisher, EPX180‐12165‐901) according to the product instructions including IL‐1β, IL‐2, IL‐4, IL‐5, IL‐6, IL‐9, IL‐10, IL‐12p70, IL‐13, IL‐17A, IL‐18, IL‐21, IL‐22, IL‐23, IL‐27, IFN‐γ, TNF‐α, and GM‐CSF. The cytokine concentrations were calculated using the standard curve generated by the five‐parameter logistic regression method. In samples with undetectable cytokines, the values of the detection limit were used for analysis.
Statistical analysis
Descriptive statistics were presented as means ± SD for continuous variables; frequency and proportions for categorical variables. For lymphocyte subsets, the proportions less than 0.05% were not taken into statistical analysis. Multiple subgroup comparisons were analyzed using one‐way ANOVA, Kruskal–Wallis, or Cochran‐Mantel‐Haensel test. A correlation matrix was generated to analyze pairwise correlations among all variables derived from the MC cohort using Spearman's method. A multivariate regression model aiming to adjust confounders including gender and age was used to measure the effect of each variable on the MG‐ADL score. Principle component analysis (PCA) was used to explore the inter‐relationships among variables derived from the MC cohort in terms of patients at distinct phases. All procedures with multiple comparisons were adjusted by the Hochberg method. We considered a two‐tailed adjusted P < 0.05 as statistically significant. Data analysis was done using Stata 14.0, GraphPad Prism 7.0 software, (GraphPad Software, LLC, San Diego, CA, USA) and R software 4.0.2.
Results
Demographics and clinical characteristics
One hundred and eighty‐one participants took part in the study. Of these, 124 patients had MG (72 women [58.1%] and 52 men [41.9%]; mean [SD] age, 48.6 [16.0] years) and 57 participants were healthy controls (28 women [49.1%] and 29 men [50.9%], mean [SD] age, 48.9 [14.1] years). MG patients included 28 patients experienced MC (MC cohort), and 96 non‐crisis MG with no experience of manifest crisis (Non‐MC cohort) according to the 2016 AAN international consensus guidance (Table 1). 26 There was no gender difference in patients recruited and 25 cases (89.3%) in the MC cohort provided multiple clinical samples. The median age at sampling was not significantly different among MC cohort (mean [SD] age, 52.5 [16.4] years), Non‐MC cohort (mean [SD] age, 47.3 [15.3] years), and healthy controls (mean [SD] age, 48.9 [14.1] years).
Table 1.
Population demographics and clinical findings of the study population.
| Characteristic | MG (n = 124) | Healthy controls (n = 57) | |
|---|---|---|---|
| MC cohort (n = 28) | Non‐crisis MG cohort (n = 96) | ||
| Age, mean (SD), y | 52.5 (16.4) | 47.3 (15.3) | 48.9 (14.1) |
| Sex, No. (%) | |||
| Male | 14 (50.0) | 38 (39.6) | 29 (50.88) |
| Female | 14 (50.0) | 58 (60.42) | 28 (49.12) |
| MGFA Class at first sampling No. (%) | |||
| II | 0 (0) | 65 (67.7) | NA |
| III | 0 (0) | 26 (27.1) | NA |
| IV | 0 (0) | 5 (5.2) | NA |
| V | 28 (100) | 0 (0) | NA |
| Immunosuppressants therapy, No. (%) | 28 (100)*** | 35 (36.5) | NA |
| Thymoma concurrence, No. (%) | |||
| Thymoma associated | 19 (67.9)*** | 25 (26.0) | NA |
| No thymoma | 9 (32.1) | 71 (74.0) | NA |
| Preceding events for crisis, No. (%) | |||
| Post‐operative myasthenic crisis | 11 (39.3) | NA | NA |
| Upper respiratory infection | 6 (21.4) | NA | NA |
| Diarrhea | 1 (3.6) | NA | NA |
| Over‐exercise | 3 (10.7) | NA | NA |
| Rapid drug escalation | 2 (7.1) | NA | NA |
| Unknown triggers | 5 (17.9) | NA | NA |
| Antibody, No. (%), mean (SD),nmol/L | |||
| Anti‐AChR Ab | 25 (89.3), 9.9 (5.5) | 90 (93.8), 7.9 (6.2) | NA |
| Anti‐MuSK Ab | 2 (7.1), 2.1 (2.6) | 3 (3.1), 4.3 (6.6) | NA |
| Seronegative | 1 (3.6) | 3 (3.1) | NA |
| Immunotherapy at sampling, No. (%) | |||
| Glucocorticoids | 28 (100)*** | 24 (25) | NA |
| High dose | 10 (35.7)** | 0 (0) | NA |
| Low dose with gradual escalation | 18 (64.3)** | 24 (100) | NA |
| Immunoglobulin | 28 (100)*** | 5 (13.8) | NA |
| Azathioprine | 1 (3.6) | 14 (14.6) | NA |
| Tacrolimus | 5 (17.9) | 21 (21.9) | NA |
| Mycophenolate mofetil | 0 (0) | 1 (1.0) | NA |
| Rituximab | 0 (0) | 5 (5.2) | NA |
| No immunotherapy | 0 (0)*** | 72 (75) | NA |
MG, myasthenia gravis; MC, myasthenic crisis; MGFA, Myasthenia Gravis Foundation of America; AchR, acetylcholine receptor; MuSK, muscle‐specific kinase.
P < 0.01.
P < 0.001.
The clinical classifications at first sampling in the MC cohort were MGFA class V (28/28, 100%). The Non‐MC cohort was mainly comprised of MGFA class II (65/96, 67.7%) and class III (26/96, 27.1%) at sampling. A high prevalence of thymoma concurrence was apparent in the MC cohort (19/28, 67.9%) compared with that in the Non‐MC group (25/96, 26.0%, P < 0.001). For the preceding events for the crisis, 11 patients developed post‐operative crisis, six with precipitating upper respiratory infection, one with diarrhea, three with over‐exercise, two with rapid drug escalation, and five patients with unknown triggers. MC cohort had a significantly higher prevalence of immunosuppressants treatment (28/28, 100%) in comparison to the Non‐MC cohort (24/96, 25%, P < 0.001). All participants in crisis had been treated with glucocorticoids and intravenous immunoglobulin.
Regarding the laboratory data, in the MC cohort, 25 patients were anti‐AChR antibody‐positive (89.3%, mean [SD] nmol/L, 9.9 [5.5] nmol/L), two patients were anti‐MUSK antibody‐positive, and one was seronegative. In the Non‐MC cohort, 90 patients were anti‐AChR antibody‐positive (93.8%, mean [SD] nmol/L, 7.9 [6.2] nmol/L), three patients were anti‐MUSK antibody positive, and three were seronegative.
Immune T‐cell kinetics and cytokines in MC
CD3+CD4+ and CD3+CD4− T cells were identified using flow cytometry analysis in peripheral blood samples (Fig. 1). In comparison to the Non‐MC cohort (n = 96) and healthy controls (n = 57), all lymphocytes significantly decreased in MC cohort (n = 28) (0.21 × 10⁶ vs. 0.45 × 10⁶/mL, P < 0.001 and 0.21 × 10⁶ vs. 0.59 × 10⁶/mL, P < 0.001, respectively). The relative number of CD3+CD4+ cells were significantly decreased in crisis in comparison to non‐crisis MG and healthy controls (0.05 × 10⁶ vs. 0.15 × 10⁶/mL, P < 0.001 and 0.05 × 10⁶ vs. 0.23 × 10⁶/mL, P < 0.001). Besides, the relative number of CD3+CD4− cells were decreased in crisis in comparison to non‐crisis MG and healthy controls (0.06 × 10⁶ vs. 0.13 × 10⁶/mL, P < 0.001 and 0.06 × 10⁶ vs. 0.19 × 10⁶/mL, P = 0.0013). By further gating on CD3+CD4+ T cells, we performed an in‐depth immune profiling of 20 subpopulations (Table 2). Patients in crisis exhibited an activated inflammatory state with increased proportions of Th1 cells (11.76% vs. 8.51%, P = 0.026), and Th17 cells (16.17% vs. 12.83%, P = 0.032); decreased Tfh2 cells (3.56% vs. 6.35%, P < 0.001), Tnaive in Tfh cells (1.45% vs. 3.01%, P < 0.001), ICOS−Tfh cells (11.68% vs. 15.69%, P = 0.017), and TCM in Tfh cells (12.86% vs. 16.77%, P = 0.022) compared with healthy controls. In particular, elevated frequencies of Treg (8.21% vs. 6.94%, P = 0.026) and Tfh17 cells (6.91% vs. 5.31%, P = 0.045) were revealed in patients with crisis compared with those in non‐crisis. There were no significant differences among other CD3+CD4+ T subpopulations.
Figure 1.
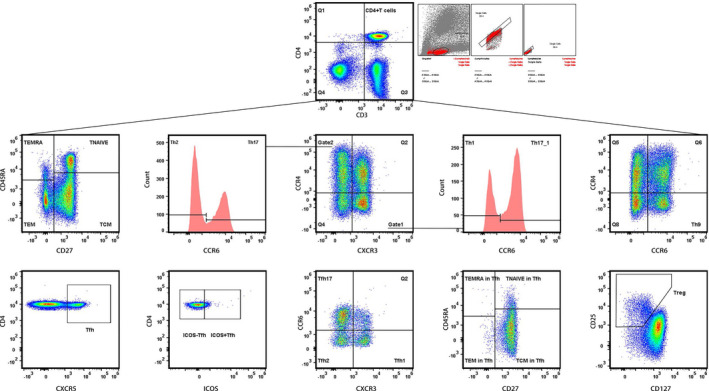
Gating Strategy for peripheral CD4+T subpopulations. CD27 and CD45RA were used to gate naïve T, T central memory (TCM), T effect memory (TEM), and T effect memory‐ra (TEMRA). CXCR3, CCR4, and CCR6 were used to gate Th1, Th2, Th9, Th17, and Th17/1. CXCR5 was used to gate Tfh; CD25 and CD127 were used to gate Treg.
Table 2.
Peripheral CD4+ T lymphocytes and cytokines of study participants.
| T subtype (% in CD4+T) | Cytokines (pg/mL) | Crisis (mean) | Non‐crisis (mean) | Healthy controls (mean) | Crisis versus non‐crisis | Crisis versus healthy controls | Non‐crisis versus healthy controls | ||||||
|---|---|---|---|---|---|---|---|---|---|---|---|---|---|
| Difference (95% CI) | P sig | P adj | Difference (95% CI) | P sig | P adj | Difference (95% CI) | P sig | P adj | |||||
| Th1 | 11.76 | 10.31 | 8.51 | ‐3.37 to 6.27 | – | 0.21 | −1.63 to 8.14 | > | 0.026 | −1.22 to 4.82 | – | 0.12 | |
| IL‐1β | 3.79 | 1.63 | 2.15 | 0.66 to 3.66 | >>> | <0.001 | 0.01 to 3.26 | >> | 0.0078 | −1.33 to 0.29 | – | 0.3 | |
| IL‐2 | 25.42 | 11.73 | 15.05 | 3.59 to 23.8 | >>> | <0.001 | −0.63 to 21.37 | >> | 0.0063 | −9 to 2.35 | – | 0.51 | |
| IL‐12p70 | 0.34 | 0.2 | 0.36 | 0.01 to 0.29 | >> | 0.0019 | −0.19 to 0.16 | – | 0.38 | −0.29 to −0.04 | < | 0.018 | |
| IL‐18 | 14.96 | 8.63 | 7.39 | 0.28 to 12.4 | >> | 0.0061 | 1.3 to 13.84 | >> | 0.0041 | −1.9 to 4.36 | – | 0.83 | |
| IL‐27 | 6.82 | 1.83 | 2.2 | 2.34 to 7.64 | >>> | <0.001 | 1.9 to 7.35 | > | 0.011 | −1.21 to 0.47 | – | 0.063 | |
| IFN‐γ | 9.91 | 6.45 | 10.07 | −0.6 to 7.53 | >> | 0.0011 | −5.26 to 4.94 | – | 0.34 | −7.3 to 0.05 | << | 0.0036 | |
| TNF‐α | 3.17 | 2.27 | 1.59 | −0.42 to 2.21 | – | 0.065 | 0.25 to 2.91 | >> | 0.0083 | −0.05 to 1.41 | – | 0.12 | |
| Th2 | 18.7 | 21.22 | 18.5 | −10.64 to 5.61 | – | 0.23 | −8.22 to 8.63 | – | 0.99 | −3.69 to 9.13 | – | 0.13 | |
| IL‐4 | 22.9 | 9.38 | 14.09 | 4.47 to 22.55 | >>> | <0.001 | −1.18 to 18.8 | – | 0.058 | −9.86 to 0.46 | < | 0.023 | |
| IL‐5 | 3.02 | 1.2 | 1.35 | 0.63 to 3.01 | >>> | <0.001 | 0.42 to 2.92 | > | 0.016 | −0.67 to 0.38 | – | 0.25 | |
| IL‐13 | 2.14 | 0.78 | 0.95 | 0.5 to 2.21 | >>> | <0.001 | 0.29 to 2.09 | > | 0.033 | −0.53 to 0.2 | – | 0.14 | |
| Th17 | 16.17 | 13.87 | 12.83 | −4.3 to 8.9 | – | 0.14 | −3.51 to 10.2 | > | 0.032 | −3.29 to 5.38 | – | 0.27 | |
| IL‐6 | 7.54 | 1.5 | 1.18 | 3.12 to 8.96 | >>> | <0.001 | 3.43 to 9.28 | >>> | <0.001 | −0.2 to 0.83 | – | 0.5 | |
| IL‐17A | 7.26 | 2.47 | 2.85 | 1.95 to 7.63 | >>> | <0.001 | 1.46 to 7.36 | >>> | <0.001 | −1.48 to 0.71 | – | 0.85 | |
| IL‐21 | 3.12 | 3.18 | 2.76 | −1.45 to 1.32 | < | 0.017 | −1.15 to 1.88 | – | 0.3 | −0.74 to 1.58 | – | 0.15 | |
| IL‐22 | 19.67 | 10.12 | 16.27 | 1.66 to 17.43 | >>> | <0.001 | −5.93 to 12.73 | – | 0.18 | −12.05 to −0.24 | << | 0.0054 | |
| IL‐23 | 3.02 | 1.56 | 2.85 | 0.25 to 2.67 | > | 0.019 | −1.33 to 1.67 | – | 0.78 | −2.31 to −0.28 | << | 0.0087 | |
| GM‐CSF | 34.49 | 14.62 | 21.77 | 6.23 to 33.51 | >>> | <0.001 | −2.41 to 27.87 | > | 0.04 | −15.13 to 0.85 | – | 0.16 | |
| Treg | 8.21 | 6.94 | 7.06 | −2.13 to 4.66 | > | 0.026 | −2.46 to 4.75 | – | 0.058 | −2.43 to 2.2 | – | 0.54 | |
| IL‐10 | 1.56 | 0.57 | 0.44 | 0.38 to 1.61 | >>> | <0.001 | 0.5 to 1.74 | >>> | <0.001 | −0.06 to 0.32 | – | 0.66 | |
| Th9 | 12.67 | 9.7 | 10.22 | −2.1 to 8.05 | – | 0.27 | −2.94 to 7.84 | – | 0.62 | −3.81 to 2.76 | – | 0.53 | |
| IL‐9 | 5.83 | 2.23 | 3.24 | 1.3 to 5.89 | >>> | <0.001 | 0.1 to 5.08 | – | 0.13 | −2.2 to 0.19 | << | 0.0052 | |
| Tnaive | 22.63 | 28.5 | 28.28 | −16.14 to 4.4 | – | 0.073 | −16.95 to 5.65 | – | 0.068 | −9.13 to 9.57 | – | 0.97 | |
| TCM | 49.52 | 50.14 | 49.41 | −21.82 to 20.59 | – | 0.76 | −22.61 to 22.84 | – | 0.5 | −15.64 to 17.1 | – | 0.49 | |
| TEM | 24.43 | 16.53 | 16.87 | −1.89 to 17.69 | – | 0.065 | −2.66 to 17.78 | – | 0.065 | −5.85 to 5.18 | – | 0.96 | |
| TEMRA | 3.41 | 4.83 | 5.45 | −3.03 to 0.19 | – | 0.64 | −3.96 to −0.12 | – | 0.87 | −2.34 to 1.11 | – | 0.46 | |
| Th17/1 | 7.44 | 6.56 | 5.33 | −2.17 to 3.94 | – | 0.75 | −0.97 to 5.2 | – | 0.084 | −0.68 to 3.13 | > | 0.025 | |
| Tfh | 15.37 | 16.42 | 18.11 | −7.62 to 5.52 | – | 0.48 | −10.12 to 4.64 | – | 0.076 | −7.42 to 4.05 | – | 0.13 | |
| ICOS + Tfh | 2.95 | 3.16 | 4.13 | −1.61 to 1.2 | – | 0.97 | −3.13 to 0.77 | – | 0.066 | −2.62 to 0.68 | < | 0.048 | |
| ICOS‐Tfh | 11.68 | 11.81 | 15.69 | −5.62 to 5.36 | – | 0.69 | −11.52 to 3.51 | < | 0.017 | −10.11 to 2.36 | <<< | <0.001 | |
| Tfh1 | 2.83 | 3.78 | 3.24 | −2.23 to 0.35 | – | 0.097 | −1.75 to 0.94 | – | 0.55 | −0.59 to 1.67 | – | 0.23 | |
| Tfh2 | 3.56 | 4.63 | 6.35 | −2.68 to 0.55 | – | 0.074 | −4.89 to −0.67 | <<< | <0.001 | −3.61 to 0.17 | <<< | <0.001 | |
| Tfh17 | 6.91 | 5.31 | 6.76 | −1.17 to 4.37 | > | 0.045 | −2.95 to 3.26 | – | 0.85 | −3.5 to 0.61 | << | 0.002 | |
| Tnaive in Tfh | 1.45 | 2.07 | 3.01 | −1.37 to 0.13 | – | 0.27 | −2.82 to −0.31 | <<< | <0.001 | −2.13 to 0.24 | <<< | <0.001 | |
| TCM in Tfh | 12.86 | 12.93 | 16.77 | −6.11 to 5.96 | – | 0.89 | −12.04 to 4.22 | < | 0.022 | −10.53 to 2.86 | << | 0.0029 | |
| TEM in Tfh | 0.44 | 0.12 | 0.19 | 0.14 to 0.51 | – | 0.084 | 0.05 to 0.45 | – | 0.35 | −0.15 to 0 | << | 0.0023 | |
| TEMRA in Tfh | ≤0.05 | ≤0.05 | 0.051 | 0.000 to 0.043 | – | 0.39 | −0.030 to 0.025 | – | 0.011 | −0.04 to −0.01 | – | <0.001 | |
P sig, P value significant; P adj, P adjusted; “–”, no significant difference; “>” and “<”, P < 0.05; “>>” and “<<”, P < 0.01; “>>>” and “<<<”, P < 0.001; TCM, T central memory; TEM, T effect memory. We considered the P value of lymphocyte subsets as non‐significant due to the small proportion (<0.05%).
Cytokine multiplex immunoassay revealed pan‐elevation of clustered cytokines including the ones associated with Th1 (IL‐1β, IL‐2, IL‐12p70, IL‐18, IL‐27, IFN‐γ, TNF‐α), Th2 (IL‐4, IL‐5, IL‐13), Th17 (IL‐6, IL‐17A, IL‐21, IL‐22, IL‐23, GM‐CSF), Treg (IL‐10), and Th9 (IL‐9) in MG patients with crisis compared with that in controls and MG in non‐crisis (Table 2). In crisis, cytokines were increased over twofold than non‐crisis, including Th1‐associated molecules IL‐1β (3.79 vs. 1.63 pg/mL, 95% CI: 0.66–3.66 pg/mL, P < 0.001), IL‐2 (25.42 vs. 11.73 pg/mL, 95% CI: 3.59–23.8 pg/mL, P < 0.001) and IL‐27 (6.82 vs. 1.83 pg/mL, 95% CI: 2.34–7.64 pg/mL, P < 0.001), Th2‐associated cytokines IL‐4 (22.9 vs. 9.38 pg/mL, 95% CI: 4.47–22.55 pg/mL, P < 0.001), IL‐5 (3.02 vs. 1.2 pg/mL, 95% CI: 0.63–3.01 pg/mL, P < 0.001), and IL‐13 (2.14 vs. 0.78 pg/mL, 95% CI: 0.5–2.21 pg/mL, P < 0.001), Th17‐associated molecules IL‐6 (7.54 vs. 1.5 pg/mL, 95% CI: 3.12–8.96 pg/mL, P < 0.001), IL‐17A (7.26 vs. 2.47 pg/mL, 95% CI: 1.95–7.63 pg/mL, P < 0.001) and GM‐CSF (34.49 vs. 14.62 pg/mL, 95% CI: 6.23–33.51 pg/mL, P < 0.001), as well as Tregs‐associated IL‐10 (1.56 vs. 0.57 pg/mL, 95% CI: 0.38–1.61 pg/mL, P < 0.001). In comparison to the cytokines measured in healthy controls, we detected eight cytokines with over twofold increase in crisis including Th1‐associated IL‐18 (14.96 vs. 7.39 pg/mL, 95% CI: 1.3–13.84 pg/mL, P = 0.0041), IL‐27 (6.82 vs. 2.2 pg/mL, 95% CI: 1.9–7.35 pg/mL, P = 0.011), and TNF‐α (3.17 vs. 1.59 pg/mL, 95% CI: 0.25–2.91 pg/mL, P = 0.0083), Th2‐associated IL‐5 (3.02 vs. 1.35 pg/mL, 95% CI: 0.42–2.92 pg/mL, P = 0.016) and IL‐13 (2.14 vs. 0.95 pg/mL, 95% CI: 0.29–2.09 pg/mL, P = 0.033), Th17‐associated IL‐6 (7.54 vs. 1.18 pg/mL, 95% CI: 3.43–9.28 pg/mL, P < 0.001), IL‐17A (7.26 vs. 2.85 pg/mL, 95% CI: 1.46–7.36 pg/mL, P < 0.001), and Tregs‐associated IL‐10 (1.56 vs. 0.44 pg/mL, 95% CI: 0.5–1.74 pg/mL, P < 0.001).
Dynamic peripheral CD4+ T profile from MC to remission
Longitudinal follow‐up of peripheral CD4+ T profile and cytokines in patients after the crisis revealed a dynamic and variable alteration (Fig. 2). Consistently decreased frequencies of CD4+ T cells were revealed at multiple visits. An activated TEM and Th1 subpopulations were identified continuously from the time of crisis to 6 months off‐ventilation. Additionally, we found continually decreased frequencies of Tfh, Tfh2, Tnaive in Tfh, TCM in Tfh, TEM in Tfh, TEMRA in Tfh, and Treg cells. Multiple measurements of cytokines revealed a concordant trend among the ones associated with Th1 (IL‐2, TNF‐α), Th2 (IL‐2, IL‐4, IL‐5, IL‐6, IL‐13, IL‐27), Th9 (IL‐9), and Th17 (IL‐6, IL‐17A, GM‐CSF), with significant elevation at crisis followed by a marked decrement within 1‐week off‐ventilation.
Figure 2.
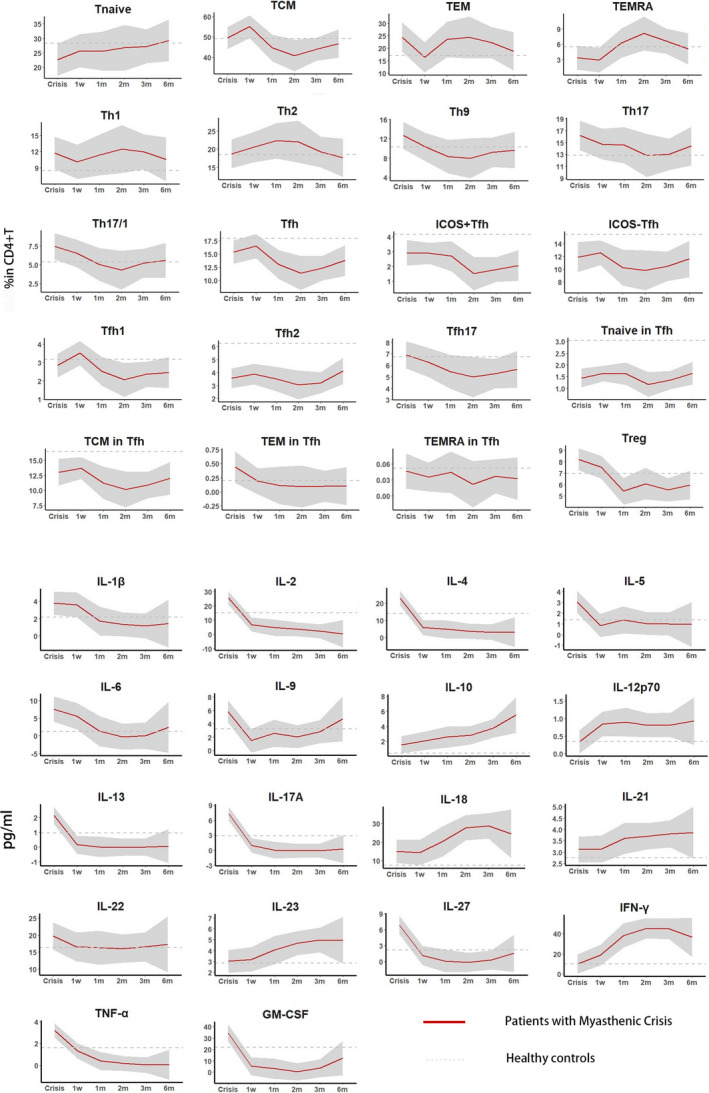
Longitudinal analysis of peripheral CD4+T and cytokine profile in MC cohort. We measured peripheral immune response in crisis (n = 28), at 1 week (n = 24)/1 month (n = 18)/2 months (n = 13)/3 months (n = 13)/6 months off‐ventilation (n = 15) in patients with MC. MC, myasthenic crisis.
Paired comparisons between the CD4+ T profile in crisis and that in 6 months off‐ventilation revealed significant reductions in frequencies of Tregs (P = 0.017) and Tfh17 (P = 0.009), as well as in concentrations of serum IL‐2 (P = 0.002), IL‐4 (P = 0.001), IL‐13 (P = 0.028), and IL‐17A (P = 0.001). Additionally, an elevation in serum IFN‐γ concentration was also noted (P = 0.0039) in 6 months off‐ventilation (Table 3).
Table 3.
Paired comparison between peripheral CD4+ T profile from patients in crisis state and that at 6 months off‐ventilation.
| T subsets (% in CD4+T) | Cytokines (pg/mL) | Crisis (mean) | 6 months off‐ventilation (mean) | Crisis versus 6 months off‐ventilation | ||
|---|---|---|---|---|---|---|
| Difference (95% CI) | P sig | P adj | ||||
| Th1 | 10.68 | 10.59 | −5.17 to 5.35 | – | 0.972 | |
| IL‐1β | 4.90 | 1.42 | −0.97 to 7.92 | – | 0.096 | |
| IL‐2 | 36.25 | 0.01 | 21.91 to 50.56 | >> | 0.002 | |
| IL‐12p70 | 0.48 | 1.02 | −1.59 to 0.50 | – | 0.221 | |
| IL‐18 | 18.62 | 24.06 | −14.55 to 3.67 | – | 0.173 | |
| IL‐27 | 6.32 | 1.71 | −3.63 to 12.85 | – | 0.195 | |
| IFN‐γ | 13.66 | 38.62 | −47.84 to −2.08 | < | 0.039 | |
| TNF‐α | 2.92 | 0.01 | −0.663 to 6.49 | – | 0.087 | |
| Th2 | 16.95 | 17.81 | −5.97 to 4.23 | – | 0.721 | |
| IL‐4 | 35.91 | 3.77 | 23.15 to 41.13 | >> | 0.001 | |
| IL‐5 | 4.14 | 0.82 | −1.19 to 7.84 | – | 0.111 | |
| IL‐13 | 2.22 | 0.06 | −0.38 to 3.93 | > | 0.028 | |
| Th17 | 17.45 | 14.36 | −1.6 to 7.76 | – | 0.178 | |
| IL‐6 | 5.77 | 2.42 | −5.24 to 11.93 | – | 0.34 | |
| IL‐17A | 10.68 | 0.17 | 7.21 to 13.80 | >> | 0.001 | |
| IL‐21 | 2.93 | 3.94 | −2.10 to 0.07 | – | 0.06 | |
| IL‐22 | 17.89 | 16.63 | −7.00 to 9.55 | – | 0.69 | |
| IL‐23 | 2.65 | 4.91 | −6.50 to 1.98 | – | 0.21 | |
| GM‐CSF | 53.24 | 24.06 | −9.87 to 87.47 | – | 0.091 | |
| Treg | 7.52 | 5.91 | 0.33 to 2.89 | > | 0.017 | |
| IL‐10 | 1.96 | 6.07 | −14.46 to 6.23 | – | 0.331 | |
| Th9 | 14.32 | 9.53 | 0.16 to 9.75 | – | 0.057 | |
| IL‐9 | 7.52 | 5.56 | −9.79 to 13.71 | – | 0.668 | |
| Tnaive | 23.4 | 30.56 | −18.66 to 4.34 | – | 0.202 | |
| TCM | 49.46 | 46.53 | −9.42 to 15.29 | – | 0.617 | |
| TEM | 24.22 | 17.88 | −6.28 to 18.97 | – | 0.297 | |
| TEMRA | 2.91 | 5.03 | −4.61 to 0.37 | – | 0.089 | |
| Th17/1 | 7.06 | 5.47 | 0.79 to 3.97 | – | 0.174 | |
| Tfh | 16.19 | 13.65 | 0.77 to 5.84 | – | 0.122 | |
| ICOS + Tfh | 2.40 | 2.30 | −1.97 to 2.15 | – | 0.92 | |
| ICOS‐Tfh | 12.72 | 12.44 | −3.15 to 3.73 | – | 0.852 | |
| Tfh1 | 2.35 | 2.41 | −0.88 to 0.77 | – | 0.891 | |
| Tfh2 | 3.98 | 4.13 | −1.5 to 1.2 | – | 0.815 | |
| Tfh17 | 8.18 | 5.63 | −0.73 to 4.35 | >> | 0.009 | |
| Tnaive in Tfh | 1.45 | 1.79 | −1.39 to 0.73 | – | 0.488 | |
| TCM in Tfh | 12.89 | 12.99 | −5.42 to 5.24 | – | 0.969 | |
| TEM in Tfh | 0.85 | 0.06 | −0.92 to 2.50 | – | 0.316 | |
| TEMRA in Tfh | 0.11 | 0.0047 | −0.044 to 0.249 | – | 0.144 | |
P sig, P value significant; P adj: P adjusted; “–”, no significant difference; “>” and “<”, P < 0.05; “>>” and “<<”, P < 0.01; “>>>” and “<<<”, P < 0.001; TCM, T central memory; TEM, T effect memory. We considered the P value of lymphocyte subsets as non‐significant due to the small proportion (<0.05%).
Correlations of CD4+ T subpopulations and cytokines with clinical MG scores
We assessed the correlations among all clinical scores and biomarkers derived from MC cohort. It revealed significant three correlations of IFN‐γ (r = −0.529, P < 0.001), TNF‐α (r = 0.493, P < 0.001), and IL‐17A (r = 0.492, P < 0.001) with MG‐ADL score, four significant correlations of IFN‐γ (r = −0.602, P < 0.001), TNF‐α (r = 0.479, P = 0.005), IL‐18 (r = −0.482, P = 0.004), and IL‐17A (r = 0.500, P = 0.002) with MGFA‐QMG, and two significant correlations of IFN‐γ (r = −0.558, P < 0.001) and IL‐18 (r = −0.478, P = 0.006) with MG‐MMT. Significant correlations (P < 0.05) revealed by univariate analysis are illustrated in Figure 3A.
Figure 3.
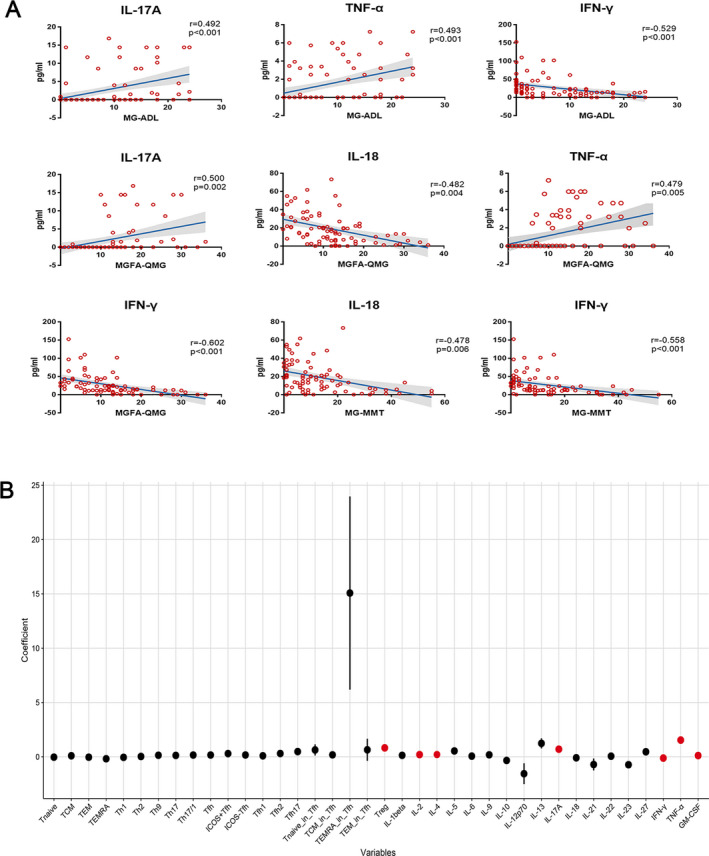
Nine significant correlations were revealed by analysis between the CD4+ T lymphocytes and cytokines with MG clinical scores (A). After multiple testing correction, regression coefficient of each variable was depicted by black dots (no significance) and red dots (significance). Seven biomarkers including Tregs, IL‐2/4/17A/IFN‐γ/TNF‐α/GM‐CSF had significant correlations with MG‐ADL scale (B). MG, myasthenia gravis; MG‐ADL, MG‐activities of daily living.
After adjusting for sex and age and particularly focusing on the most commonly used questionnaire in MG trials, MG‐ADL, 27 we identified seven significant correlations in the proportions of Tregs (95% CI: 0.599–1.052%, P < 0.001), or in the levels of cytokines IL‐2 (95% CI: 0.153–0.25 pg/mL, P < 0.001), IL‐4 (95% CI: 0.152–0.264 pg/mL, P < 0.001), IL‐17A (95% CI: 0.548–0.856 pg/mL, P < 0.001), IFN‐γ (95% CI: −0.144 to −0.087 pg/mL, P < 0.001), TNF‐α (95% CI: 1.191–1.887 pg/mL, P < 0.001), and GM‐CSF (95% CI: 0.083–0.148 pg/mL, P = 0.032) with MG‐ADL. Regression Coefficients of each variable derived from the longitudinal data are depicted with black dots (no significance) and red dots (significance) (Fig. 3B, Table 4).
Table 4.
Multivariate analysis among CD4+ T cells, cytokines, and MG‐ADL score after adjustment of gender and age.
| Variable | Coefficient | Up | Down | P | P adjust |
|---|---|---|---|---|---|
| Tnaive | −0.032 | 0.013 | −0.077 | 0.474 | 0.778 |
| TCM | 0.096 | 0.14 | 0.052 | 0.033 | 0.778 |
| TEM | −0.035 | 0.008 | −0.079 | 0.414 | 0.778 |
| TEMRA | −0.178 | −0.058 | −0.298 | 0.141 | 0.778 |
| Th1 | −0.049 | 0.036 | −0.134 | 0.566 | 0.778 |
| Th2 | 0.032 | 0.094 | −0.031 | 0.612 | 0.778 |
| Th9 | 0.142 | 0.231 | 0.053 | 0.113 | 0.778 |
| Th17 | 0.128 | 0.224 | 0.032 | 0.185 | 0.778 |
| Th17/1 | 0.162 | 0.306 | 0.018 | 0.263 | 0.778 |
| Tfh | 0.164 | 0.27 | 0.058 | 0.125 | 0.778 |
| ICOS + Tfh | 0.295 | 0.643 | −0.052 | 0.397 | 0.778 |
| ICOS‐Tfh | 0.168 | 0.283 | 0.053 | 0.146 | 0.778 |
| Tfh1 | 0.093 | 0.425 | −0.238 | 0.778 | 0.778 |
| Tfh2 | 0.302 | 0.629 | −0.025 | 0.357 | 0.778 |
| Tfh17 | 0.48 | 0.693 | 0.266 | 0.026 | 0.728 |
| Tnaive in Tfh | 0.633 | 1.147 | 0.118 | 0.222 | 0.778 |
| TCM in Tfh | 0.181 | 0.302 | 0.06 | 0.139 | 0.778 |
| TEMRA in Tfh | 15.077 | 23.971 | 6.184 | 0.093 | 0.778 |
| TEM in Tfh | 0.645 | 1.665 | −0.375 | 0.529 | 0.778 |
| Treg | 0.825 | 1.052 | 0.599 | 0 | 0 |
| IL‐1β | 0.135 | 0.358 | −0.088 | 0.547 | 0.778 |
| IL‐2 | 0.201 | 0.25 | 0.153 | 0 | 0 |
| IL‐4 | 0.208 | 0.264 | 0.152 | 0 | 0 |
| IL‐5 | 0.54 | 0.83 | 0.25 | 0.066 | 0.778 |
| IL‐6 | 0.064 | 0.149 | −0.021 | 0.454 | 0.778 |
| IL‐9 | 0.183 | 0.364 | 0.003 | 0.312 | 0.778 |
| IL‐10 | −0.333 | −0.057 | −0.61 | 0.231 | 0.778 |
| IL‐12p70 | −1.556 | −0.594 | −2.517 | 0.109 | 0.778 |
| IL‐13 | 1.238 | 1.705 | 0.771 | 0.01 | 0.3 |
| IL‐17A | 0.702 | 0.856 | 0.548 | 0 | 0 |
| IL‐18 | −0.09 | −0.043 | −0.136 | 0.059 | 0.778 |
| IL‐21 | −0.707 | −0.157 | −1.257 | 0.202 | 0.778 |
| IL‐22 | 0.058 | 0.136 | −0.021 | 0.463 | 0.778 |
| IL‐23 | −0.727 | −0.438 | −1.017 | 0.014 | 0.406 |
| IL‐27 | 0.462 | 0.607 | 0.317 | 0.002 | 0.062 |
| IFN‐γ | −0.116 | −0.087 | −0.144 | 0 | 0 |
| TNF‐α | 1.539 | 1.887 | 1.191 | 0 | 0 |
| GM‐CSF | 0.115 | 0.148 | 0.083 | 0.001 | 0.032 |
Immune biomarkers with significant changes were marked in red. MG‐ADL, MG‐activities of daily living; TCM, T central memory; TEM, T effect memory; TEMRA, T effect memory‐ra.
We then evaluated whether peripheral CD4+ T, cytokine profile, and clinical scores dynamically changed in patients after the crisis. We plotted the individual variables of the MC cohort by multiple visits using PCA. The plots revealed a distinguished clustering pattern in crisis from that in the other five time points (1 week, 1 month, 2 months, 3 months, 6 months off‐ventilation) (Fig. 4).
Figure 4.
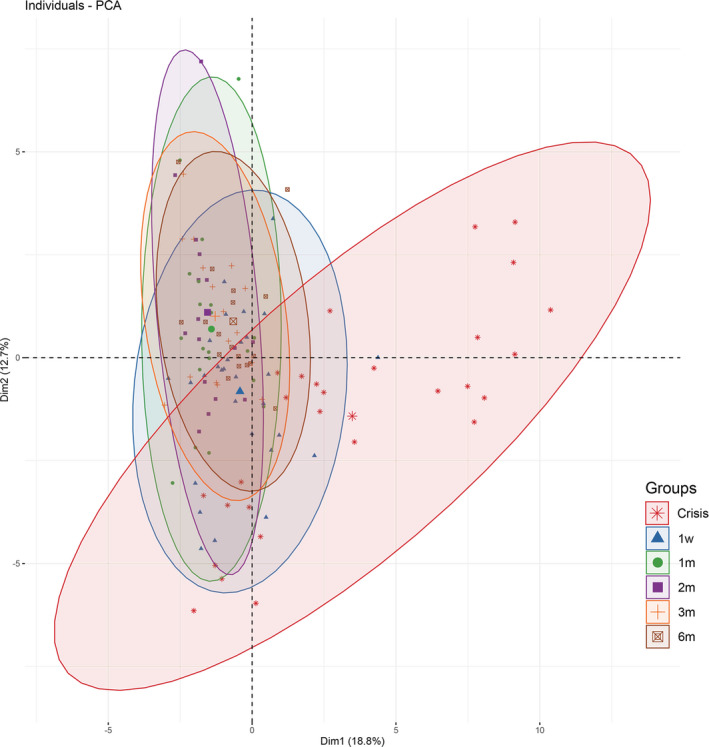
A PCA analysis of the correlations among peripheral CD4+ T cells, cytokine profile, and clinical scores at different phases from crisis to 6 months off‐ventilation. Clinical scores evaluated in this cohort included MG‐ADL, MG‐QoL15, MGFA‐QMG, and MG‐MMT. Positive correlated variables point to the same side of the plots, and vice versa. The orthogonal axes of Dim1 and Dim2 represent variation differences among all variables. A skewed distribution derived from the crisis cohort represented a distinct clustering pattern from that at other phases. PCA, principle component analysis; MG‐ADL, MG‐activities of daily living; QoL‐15, MG Quality of Life 15; MGFA‐QMG, MGFA‐quantitative MG test; MG‐MMT, MG manual muscle test.
Discussion
Cross‐sectional studies had proven the dominating role of proinflammatory CD4+ T cells in MG, however, the in‐depth phenotyping and immune dynamics remained unclear. Besides, the heterogeneity in peripheral T‐cell‐mediated autoimmunity exists in MG patients with distinct clinical severity and course, in particular at the most severe stage of MC, making it an attractive target for precision therapeutics. Currently, there are very few studies regarding the potential novel biomarkers for MG. In this study, we longitudinally investigated 20 CD4+ T subpopulations and 18 cytokines using in‐depth immune profiling in a cohort of patients experienced MC. With the high‐throughput evaluation of serum biomarkers, we identified a distinguished pattern in crisis with highly elevated proinflammatory CD4+ T subsets and cytokine cascade. This study also identified Tregs, IL‐2, IL‐4, IL‐17A, IFN‐γ, TNF‐α, and GM‐CSF as potential biomarker candidates for monitoring MG.
From peripheral CD4+ T profile in MC, a re‐balancing immune phenomenon was of note with a trend toward the inflammatory state. The numbers of all lymphocytes were significantly lower in MG with/without crisis compared with controls, supporting the effects of immunosuppressants therapy in high proportions of patients. In addition, patients in crisis had increased Tregs, which were considered to be critical in the maintenance of peripheral immune tolerance and can be promoted by intravenous immunoglobulin therapy during the crisis. 28 Apart from the elevated Tregs, a cluster of proinflammatory cytokines as well as increased frequencies of Tfh17 were demonstrated. A vigorous inflammatory response from a relatively small amount of T cells could represent the consequence of immune battling. Located in the lymphoid follicles, Tfh cells are a cluster of unique CD4+ T‐cell subsets that are essential for initiation and maintenance of the germinal follicle (GCs), thus playing important roles in affinity maturation of the antibodies and development of long‐lived humoral immunity in MG. 29 Our findings highlighted an inquiry in Tfh17 cells and their functions in association with the status of crisis in a larger cohort. Additionally, longitudinal follow‐ups of cytokines revealed a significant elevation in crisis followed by a marked decrement within 1‐week off‐ventilation, indicating a “time‐window” for rescue immune therapy in MC patients to reduce the in‐hospital mortality and intensive care unit monitoring.
During T‐cell differentiation, a network of cytokines and related molecules play a pivotal role. Although the exact mechanisms remain unknown, Th2‐related cytokines such as IL‐2, IL‐4, IL‐5, and IL‐6 can stimulate plasma cells and B cells, thus facilitating antibody secretion. 30 Additionally, IL‐6 facilitates the differentiation of CD4+ T cells into Th17 cells. IL‐17A, IL‐22, and GM‐CSF are mainly derived from Th17 cells and involved in recruiting more inflammatory cells. 31 Previous studies of anti‐IL‐17 antibodies in treating psoriasis revealed a marked efficacy, however, it was not sufficient to change the clinical endpoint. 32 Relatively speaking, IL‐6 is involved in multiple pathways of adaptive immunity with context‐dependent pro and anti‐inflammatory properties. As an IL‐6 receptor inhibitor, Tocilizumab blocks the IL‐6‐mediated signal transduction. It is utilized to treat autoimmune disorders such as giant cell arteritis, systemic sclerosis, and neuromyelitis Optica Spectrum Disorder. 33 , 34 , 35 A therapeutic rationale for targeting multiple proinflammatory cell lineages and/or related cytokines requires future investigation for the patients in crisis.
Longitudinally speaking, in the prospective MC cohort, a coordinated upregulation of Th1, Th17, and TEM subsets, as well as a downregulation in most T follicular cells and Tregs were identified. This finding is in concordance with the principles of CD4+ T‐cell differentiation. 36 Apart from the cytokine cascade in crisis, significant correlations in Th1‐, Th2‐, and Th17‐related cytokines with clinical scores were identified in accordance with a re‐balancing mechanism in peripheral T‐cell lineages. Of note, Th1‐related (IL‐12p70, IL‐18, and IFN‐γ) and Th17‐related cytokines (IL‐21 and IL‐23) were persistently elevated after 1‐week off‐ventilation in follow‐ups, among which IL‐18 level manifested negative correlations with clinical scores.
It is an unexpected finding that IFN‐γ was elevated in 6 months off‐ventilation. It is probably due to the anti‐inflammatory properties of IFN‐γ. 37 , 38 Evidence has been accumulated in recent years that supports the concept of a dual role IFN‐γ in inflammation. These include induction of anti‐inflammatory cytokine production, activation of apoptosis, and interference with the signal transduction machinery by induction of suppressors of cytokine signaling. To be noticed, Th2‐related cytokines, IL‐4 and IL‐13, were significantly decreased in 6 months off‐ventilation, which were previously characterized as the inducers in pathogenic antibody production. 39 , 40
There are some limitations in our study. First, this study is mainly correlative. Although we revealed a dynamic alteration of distinct CD4+ T lymphocytes and cytokines at different stages in or after the MC, the causations between them are not clear. The impact of the combinations of thymoma, different immunosuppressants on the peripheral immune profile is not well‐controlled. Second, due to the heterogeneity of MG participants including thymoma concurrent, different antibody profile, and immune therapy regimens, we have many confounders in analyzing the immune biomarkers in subgroups. Third, we introduced some selection bias by recruiting and stratifying patients, since patients referred to our diagnostic center were chosen from each referring hospital. The majority of patients had immunosuppressants treatment and harbored decreased CD4+ T‐cell counts. Fourth, the duration of this longitudinal observation just extended to 6 months after coming off MV. Many CD4+ T subsets and cytokines may exhibit a late response but still strong correlations with the clinical severity. Therefore our results represent short‐term peripheral immune dynamics in MC. In addition, a prospective cohort study of peripheral immune profile in generalized MG patients covered from the disease onset to the impeding or manifest crisis will give more information about the pre‐crisis state. The reliability of the methodology of using fresh blood specimens for flow cytometry analysis in this study requires further testing in the multicenter analysis.
In conclusion, we have demonstrated active proinflammatory peripheral CD4+ T subsets and cytokine cascade in patients in crisis using in‐depth immune profiling. Significant correlations between Treg subsets, Th1‐, Th2‐, and Th17‐related cytokines and clinical scores were revealed. Thus, immune profiling‐based biomarker development and precision therapeutic applications are to be further investigated in patients with MC.
Conflict of Interests
None declared.
Ethics Approval
The study was approved by the institutional review board of General Huashan hospital Fudan University (2016‐271). Written informed consent was obtained from each study participant before sample collection. All study procedures were performed in accordance with the principles of Good Clinical Practice and the Declaration of Helsinki.
Provenance and Peer Review
Not commissioned; externally peer reviewed.
Supporting information
Table S1. Cross‐sectional comparisons of CD4+ T‐cell subpopulations and cytokines between thymoma‐associated MC versus non‐MC GMG.
Table S2. Cross‐sectional comparisons of CD4+ T‐cell subpopulations and cytokines between non‐thymoma‐associated MC versus non‐MC GMG.
Table S3. Comparisons of immune biomarkers in thymoma‐associated versus non‐thymoma‐associated MC, and thymoma‐associated versus non‐thymoma‐associated non‐MC GMG patients.
Table S4. Comparisons of immune biomarkers between MC patients and non‐MC GMG patients with immunosuppressants.
Table S5. Paired comparisons between the immune biomarkers between healthy controls and that in MC cohort from crisis state, 1‐week/1‐month/2‐months/3‐months/6‐months off‐ventilation.
Acknowledgments
We thank all participants recruited in this study. We also want to thank Xiaoyang Li, MD, Department of Neurology, University of North Carolina, who assisted with the editing. Ming Chu, School of Basic Medical Sciences, Peking University, and Baoguo Xiao, Institute of Neurology, Fudan University, provided scientific advising. They were not compensated for this work.
Funding Information
This work was supported by financial grants from the National Key Research and Development Program of China (No. 2016YFC0901504), the National Natural Science Foundation of China (No. 81870988 and 81901279), and Shanghai Municipal Science and Technology Major Project (No. 2018SHZDZX03) and ZJLab.
Funding Statement
This work was funded by Science and Technology Commission of Shanghai Municipality grant 2018SHZDZX03; National Natural Science Foundation of China grants 81870988 and 81901279; National Key Research and Development Program of China grant 2016YFC0901504; ZJLab grant .
Contributor Information
Sheng Chen, Email: chensheng0039@fjmu.edu.cn.
Chongbo Zhao, Email: zhao_chongbo@fudan.edu.cn.
Data availability statement
Data are available upon reasonable request to the corresponding author.
REFERENCES
- 1. Andersen JB, Engeland A, Owe JF, Gilhus NE. Myasthenia gravis requiring pyridostigmine treatment in a national population cohort. Eur J Neurol 2010;17:1445–1450. [DOI] [PubMed] [Google Scholar]
- 2. Carr AS, Cardwell CR, McCarron PO, McConville J. A systematic review of population based epidemiological studies in myasthenia gravis. BMC Neurol 2010;10:46. [DOI] [PMC free article] [PubMed] [Google Scholar]
- 3. Gilhus NE. Myasthenia gravis. N Engl J Med 2016;375:2570–2581. [DOI] [PubMed] [Google Scholar]
- 4. Berrih‐Aknin S, Frenkian‐Cuvelier M, Eymard B. Diagnostic and clinical classification of autoimmune myasthenia gravis. J Autoimmun 2014;48–49:143–148. [DOI] [PubMed] [Google Scholar]
- 5. Ahmed S, Kirmani JF, Janjua N, et al. An update on Myasthenic Crisis. Curr Treat Options Neurol 2005;7:129–141. [DOI] [PubMed] [Google Scholar]
- 6. Watanabe A, Watanabe T, Obama T, et al. Prognostic factors for myasthenic crisis after transsternal thymectomy in patients with myasthenia gravis. J Thorac Cardiovasc Surg 2004;127:868–876. [DOI] [PubMed] [Google Scholar]
- 7. Ando T, Omasa M, Kondo T, et al. Predictive factors of myasthenic crisis after extended thymectomy for patients with myasthenia gravis. Eur J Cardiothorac Surg 2015;48:705–709. [DOI] [PubMed] [Google Scholar]
- 8. Juel VC. Myasthenia gravis: management of myasthenic crisis and perioperative care. Semin Neurol 2004;24:75–81. [DOI] [PubMed] [Google Scholar]
- 9. Lv Z, Zhong H, Huan X, et al. Predictive score for in‐hospital mortality of myasthenic crisis: a retrospective Chinese cohort study. Eur Neurol 2019;81:287–293. [DOI] [PubMed] [Google Scholar]
- 10. Neumann B, Angstwurm K, Mergenthaler P, et al. Myasthenic crisis demanding mechanical ventilation: a multicenter analysis of 250 cases. Neurology 2020;94:e299–e313. [DOI] [PubMed] [Google Scholar]
- 11. Kirmani JF, Yahia AM, Qureshi AI. Myasthenic crisis. Curr Treat Options Neurol 2004;6:3–15. [DOI] [PubMed] [Google Scholar]
- 12. Nakano S, Engel AG. Myasthenia gravis: quantitative immunocytochemical analysis of inflammatory cells and detection of complement membrane attack complex at the end‐plate in 30 patients. Neurology 1993;43:1167–1172. [DOI] [PubMed] [Google Scholar]
- 13. Meriggioli MN, Sanders DB. Autoimmune myasthenia gravis: emerging clinical and biological heterogeneity. Lancet Neurol 2009;8:475–490. [DOI] [PMC free article] [PubMed] [Google Scholar]
- 14. Gilhus NE. Myasthenia and the neuromuscular junction. Curr Opin Neurol 2012;25:523–529. [DOI] [PubMed] [Google Scholar]
- 15. Gilhus NE, Verschuuren JJ. Myasthenia gravis: subgroup classification and therapeutic strategies. Lancet Neurol 2015;14:1023–1036. [DOI] [PubMed] [Google Scholar]
- 16. Cao Y, Amezquita RA, Kleinstein SH, et al. Autoreactive T cells from patients with myasthenia gravis are characterized by elevated IL‐17, IFN‐gamma, and GM‐CSF and diminished IL‐10 production. J Immunol 2016;196:2075–2084. [DOI] [PMC free article] [PubMed] [Google Scholar]
- 17. Liu XF, Wang RQ, Hu B, et al. MiR‐15a contributes abnormal immune response in myasthenia gravis by targeting CXCL10. Clin Immunol 2016;164:106–113. [DOI] [PubMed] [Google Scholar]
- 18. Luo M, Liu X, Meng H, et al. IFNA‐AS1 regulates CD4(+) T cell activation in myasthenia gravis though HLA‐DRB1. Clin Immunol 2017;183:121–131. [DOI] [PubMed] [Google Scholar]
- 19. Cui YZ, Qu SY, Chang LL, et al. Enhancement of T follicular helper cell‐mediated humoral immunity reponses during development of experimental autoimmune myasthenia gravis. Neurosci Bull 2019;35:507–518. [DOI] [PMC free article] [PubMed] [Google Scholar]
- 20. Zhang CJ, Gong Y, Zhu W, et al. Augmentation of circulating follicular helper T cells and their impact on autoreactive B cells in myasthenia gravis. J Immunol 2016;197:2610–2617. [DOI] [PubMed] [Google Scholar]
- 21. Mantegazza R, Cavalcante P. Diagnosis and treatment of myasthenia gravis. Curr Opin Rheumatol 2019;31:623–633. [DOI] [PubMed] [Google Scholar]
- 22. Patil SA, Bokoliya SC, Nagappa M, Taly AB. Diagnosis of myasthenia gravis: comparison of anti‐nicotinic acetyl choline receptor antibodies, repetitive nerve stimulation and Neostigmine tests at a tertiary neuro care centre in India, a ten year study. J Neuroimmunol 2016;292:81–84. [DOI] [PubMed] [Google Scholar]
- 23. Mahnke YD, Beddall MH, Roederer M. OMIP‐017: human CD4(+) helper T‐cell subsets including follicular helper cells. Cytometry A 2013;83:439–440. [DOI] [PMC free article] [PubMed] [Google Scholar]
- 24. Maecker HT, McCoy JP, Nussenblatt R. Standardizing immunophenotyping for the human immunology project. Nat Rev Immunol 2012;12:191–200. [DOI] [PMC free article] [PubMed] [Google Scholar]
- 25. van Langelaar J, van der Vuurst de Vries RM, Janssen M, et al. T helper 17.1 cells associate with multiple sclerosis disease activity: perspectives for early intervention. Brain 2018;141:1334–1349. [DOI] [PubMed] [Google Scholar]
- 26. Sanders DB, Wolfe GI, Benatar M, et al. International consensus guidance for management of myasthenia gravis: executive summary. Neurology 2016;87:419–425. [DOI] [PMC free article] [PubMed] [Google Scholar]
- 27. de Meel RHP, Raadsheer WF, van Zwet EW, et al. Sensitivity of MG‐ADL for generalized weakness in myasthenia gravis. Eur J Neurol 2019;26:947–950. [DOI] [PMC free article] [PubMed] [Google Scholar]
- 28. Zhang G, Wang Q, Song Y, et al. Intravenous immunoglobulin promotes the proliferation of CD4+CD25+ Foxp3+ regulatory T cells and the cytokines secretion in patients with Guillain‐Barré syndrome in vitro. J Neuroimmunol 2019;336:577042. [DOI] [PubMed] [Google Scholar]
- 29. Wang L, Zhang Y, Zhu M, et al. Effects of follicular helper T cells and inflammatory cytokines on myasthenia gravis. Curr Mol Med 2019;19:739–745. [DOI] [PubMed] [Google Scholar]
- 30. Jego G, Bataille R, Pellat‐Deceunynck C. Interleukin‐6 is a growth factor for nonmalignant human plasmablasts. Blood 2001;97:1817–1822. [DOI] [PubMed] [Google Scholar]
- 31. Yasuda K, Takeuchi Y, Hirota K. The pathogenicity of Th17 cells in autoimmune diseases. Semin Immunopathol 2019;41:283–297. [DOI] [PubMed] [Google Scholar]
- 32. Ly K, Smith MP, Thibodeaux Q, et al. Anti IL‐17 in psoriasis. Expert Rev Clin Immunol 2019;15:1185–1194. [DOI] [PubMed] [Google Scholar]
- 33. Stone JH, Tuckwell K, Dimonaco S, et al. Trial of tocilizumab in giant‐cell arteritis. N Engl J Med 2017;377:317–328. [DOI] [PubMed] [Google Scholar]
- 34. Khanna D, Denton CP, Lin CJF, et al. Safety and efficacy of subcutaneous tocilizumab in systemic sclerosis: results from the open‐label period of a phase II randomised controlled trial (faSScinate). Ann Rheum Dis 2018;77:212–220. [DOI] [PMC free article] [PubMed] [Google Scholar]
- 35. Zhang C, Zhang M, Qiu W, et al. Safety and efficacy of tocilizumab versus azathioprine in highly relapsing neuromyelitis optica spectrum disorder (TANGO): an open‐label, multicentre, randomised, phase 2 trial. Lancet Neurol 2020;19:391–401. [DOI] [PMC free article] [PubMed] [Google Scholar]
- 36. Crotty S. T follicular helper cell differentiation, function, and roles in disease. Immunity 2014;41:529–542. [DOI] [PMC free article] [PubMed] [Google Scholar]
- 37. Mühl H, Pfeilschifter J. Anti‐inflammatory properties of pro‐inflammatory interferon‐gamma. Int Immunopharmacol 2003;3:1247–1255. [DOI] [PubMed] [Google Scholar]
- 38. Miller NM, Wang J, Tan Y, Dittel BN. Anti‐inflammatory mechanisms of IFN‐γ studied in experimental autoimmune encephalomyelitis reveal neutrophils as a potential target in multiple sclerosis. Front Neurosci 2015;9:287. [DOI] [PMC free article] [PubMed] [Google Scholar]
- 39. Fang H, Li Q, Wang G. The role of T cells in pemphigus vulgaris and bullous pemphigoid. Autoimmun Rev 2020;19:102661. [DOI] [PubMed] [Google Scholar]
- 40. Higashioka K, Kikushige Y, Ayano M, et al. Generation of a novel CD30+ B cell subset producing GM‐CSF and its possible link to the pathogenesis of systemic sclerosis. Clin Exp Immunol 2020;201:233–243. [DOI] [PMC free article] [PubMed] [Google Scholar]
Associated Data
This section collects any data citations, data availability statements, or supplementary materials included in this article.
Supplementary Materials
Table S1. Cross‐sectional comparisons of CD4+ T‐cell subpopulations and cytokines between thymoma‐associated MC versus non‐MC GMG.
Table S2. Cross‐sectional comparisons of CD4+ T‐cell subpopulations and cytokines between non‐thymoma‐associated MC versus non‐MC GMG.
Table S3. Comparisons of immune biomarkers in thymoma‐associated versus non‐thymoma‐associated MC, and thymoma‐associated versus non‐thymoma‐associated non‐MC GMG patients.
Table S4. Comparisons of immune biomarkers between MC patients and non‐MC GMG patients with immunosuppressants.
Table S5. Paired comparisons between the immune biomarkers between healthy controls and that in MC cohort from crisis state, 1‐week/1‐month/2‐months/3‐months/6‐months off‐ventilation.
Data Availability Statement
Data are available upon reasonable request to the corresponding author.