

Abstract
Objective
To evaluate whether the control status of type 2 diabetes mellitus (DM) influences the progression of Parkinson’s disease (PD).
Methods
We conducted a prospective cohort study from March 2009 to August 2020. Patients at baseline were categorized into DM and non‐DM groups, and those with DM were further classified into the well and poorly controlled DM groups based on the 7.0% of glycated hemoglobin (HbA1C) levels. Multivariate Cox proportional hazards regression models were used to explore the predictors for PD‐related outcomes by hazard ratios (HRs) and 95% confidence intervals (CIs).
Results
Of the 379 patients enrolled, 49 (12.9%) had DM, and 22 of DM (44.9%) were poorly controlled. The adjusted HRs were 2.060 (95% CI 1.165‐3.641) for United Rating Scale (UPDRS) III score increased ≥14 in the poorly controlled‐DM group, and 1.066 (95% CI 0.572‐1.986) in the well‐controlled DM group, relative to the non‐DM group (p trend = 0.025), after adjusting for sex, age, age of onset, body mass index, and UPDRS III and Montreal Cognitive Assessment (MoCA) scores at baseline. The adjusted HRs were 2.079 (95% CI 1.212‐3.566) for reaching Hoehn & Yahr stage ≥3 in the poorly controlled DM group, and 0.879 (95% CI 0.413‐1.871) in the well‐controlled DM group, compared with the non‐DM group (p trend = 0.021). Time to death or time to MoCA 3‐point decrease were not significantly different among the three groups.
Interpretation
Poorly controlled DM is an independent risk factor contributing to motor progression in PD. Our study highlights the importance of adequate control of diabetes in PD.
Keywords: Parkinson’s disease, HbA1C, survival, prognosis, motor progression
Introduction
The association between Parkinson’s disease (PD) and type 2 diabetes mellitus (DM) has been disclosed in recent years. The two conditions often coexist, 1 and impaired glucose tolerance is frequently observed in patients with PD. 1 , 2
DM is associated with an increased risk of suffering from PD. Pooled evidence based on population‐based cohort studies suggests that patients with DM have an average 38% higher risk of developing PD. 3 Furthermore, DM in PD patients is associated with more severe motor disability, less response to dopaminergic drugs, 1 , 4 more severe axial motor symptoms, 5 and cognitive impairment. 6 , 7 A case‐control study 8 also observed that patients with comorbid DM developed motor complications on average 12 months earlier in PD, independent of medications or other disease‐related factors.
To date, the effect of DM on the progression of PD is still largely unknown. In the older normal population, DM is reported as a risk factor for progression of parkinsonism‐like signs. 9 In PD, although some researchers have studied the prognostic value of early onset of DM, they mainly defined DM by the measurement of fasting and postprandial blood glucose. Compared with blood glucose, glycated hemoglobin (HbA1C) is a more stable index that can reflect the cumulative glycemic history of the preceding 2 to 3 months. HbA1C provides a reliable measure of chronic hyperglycemia and relates well to the risk of developing long‐term diabetes complications.
Elevated HbA1C levels have been reported as an independent risk factor for the prognosis of neurodegenerative disorders such as amyotrophic lateral sclerosis. 10 However, the association between HbA1C levels and disease progression in PD remains unknown. Therefore, in the present study, we aimed to examine the impact of HbA1C levels on motor deterioration, cognitive decline, and survival in a cohort of Chinese PD patients.
Patients and methods
Standard protocol approvals, registrations, and patient consents
The current study was permitted by the Ethics Committee of Sichuan University West China Hospital. All participants provided written informed consent.
Study participants
Initially, 4518 PD patients who met the Unified Kingdom PD Society Brain Bank clinical diagnostic criteria for PD 11 were seen and registered in the Department of Neurology, Sichuan University West China Hospital, between March 2009 and August 2019 (Figure 1). The clinical diagnosis of PD was also determined by the MDS version of clinical diagnostic criteria for PD 12 before we performed the statistical analysis.
Figure 1.
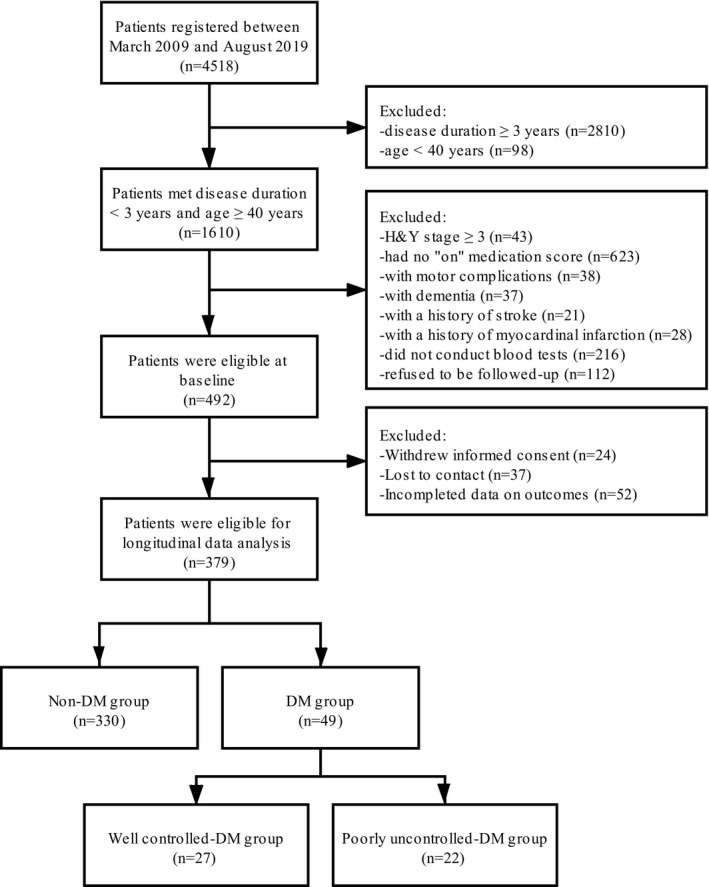
A flow diagram of the study population.
Participants were invited to follow‐up (n = 492) if they 1) had Hoehn and Yahr (H&Y) stage <3 and assessed UPDRS III at off‐medication, 2) were older than 40 years, 3) had a PD duration of <3 years, 4) reported no motor complications, dementia, stroke, and myocardial infarction, and 5) performed blood test for screening diabetes. All participants were followed up at least once (range 1‐10), with an interval of at least one year. During follow‐up, 24 patients withdrew informed consent, 37 lost contact, and 52 had broken data. Finally, the remaining 379 patients were included for data analysis (Figure 1).
Definition of DM
Type 2 DM was defined as a past medical history of DM with or without the use of hypoglycemic agents, or serum HbA1C levels of ≥6.5% (48 mmol/mol) at the time of PD enrollment according to the WHO suggestion. 13 Past medical history data were obtained from patients and their relatives or extracted by patients’ medical records, when available. The serum HbA1C levels were examined in the clinical laboratory of Sichuan University West China Hospital. Enrolled participants were classified as patients with and without DM (DM group vs. non‐DM group). Patients with poorly controlled DM were defined as serum HbA1c levels of ≥7.0% (53 mmol/mol). 14 On the contrary, patients with serum HbA1c levels of <7.0% were classified into the well‐controlled DM group.
Clinical assessments
At baseline, a standardized assessment for all patients was completed by trained neurologists in our movement disorder center. Demographic and clinical data including sex, age, height, body mass index (BMI), age of onset, disease duration, years of schooling, and therapeutic schedule were collected. The levodopa equivalent daily dosage (LEDD) was calculated using previously published criteria. 15
The Unified PD Rating Scale (UPDRS) part III 16 and H&Y stage 17 were applied to evaluate the motor severity. During follow‐up, patients were asked to withhold their antiparkinsonian medications for at least 12h before motor assessment. For patients who were not assessed at off medication state (n = 82, 21.6%), we estimated an off‐score by adding the difference value of the study population’s mean off‐score and mean on‐score to the patient’s on‐score. 18
The Chinese version of the Non‐Motor Symptoms Scale (NMSS) 19 was used to assess the non‐motor symptoms (NMS). Cognitive function was assessed by the Montreal Cognitive Assessment (MoCA) 20 and the Frontal Assessment Battery (FAB), 21 with lower scores indicating poor cognition. The depressive symptom was assessed by the Hamilton Depression Rating Scale (HDRS) (24 items), 22 and the anxious symptom was assessed by the Hamilton Anxiety Rating Scale (HARS). 23
Clinical endpoints
Survival
Continuous survival surveillance was performed by an active annual follow‐up for patients and their family members until August 1, 2020, which indicated approximately 11 years after our study began (2009) and 14 years after the patients were firstly diagnosed (2006). Time to death was defined as the interval in years from the onset of PD to the follow‐up visits in which the patients had either the PD‐related (33/51, 64.7%) or non‐PD‐related (18/51, 35.3%) death.
Motor decline
An increase of 2.5‐5.2 points in the UPDRS III was considered a clinically significant difference. 24 In this study, we defined fast motor progression as an at least 14‐point increase in the UPDRS III (mean 3.5‐point per year) based on the mean follow‐up period of 4.0 ± 2.4 years. Time to such event was defined as the interval in years from baseline to the time in which a 14‐point increase was first monitored. Conversion to H&Y stage ≥3 was set as an additional outcome of motor progression. Time to reach such a milestone was defined as the interval in years from the onset of PD to the time in which the patient firstly scored ≥3 in the H&Y stage.
Cognitive decline
Cognitive decline was defined as a >3‐point decrease in the MoCA. Time to cognitive decline was defined as the interval in years from baseline to the time in which a 3‐point decrease was first recorded.
Statistical analyses
Frequencies and descriptive statistics were used to summarize the clinical characteristics of samples. Baseline data were reported as percentages for categorical variables and mean ± standard deviation (SD) for continuous variables.
The Student’s t‐test and Chi‐square test were performed to compare the continuous and categorical variables between DM and non‐DM groups, respectively. For overall comparisons among non‐DM, well‐controlled DM, and poorly controlled DM groups, analysis of variance (ANOVA) was used. Once statistically significance was detected in overall comparisons, pairwise comparisons were further conducted using the Student t‐test or Chi‐square test. The Bonferroni correction method was used to adjust the p values and exclude the potential false‐positive rate incurred by multiple comparisons. In this method, p < 0.0167 (0.05/3) were considered as significantly different.
The Kaplan‐Meier survival curves were plotted and the log‐rank tests were used. The univariate and multivariate Cox proportional hazards models were used to estimate the hazard ratios (HRs) and examine 95% confidence intervals (CIs). In the multivariate model, sex, age, age of onset, BMI, and UPDRS III and MoCA scores at baseline were adjusted.
Statistical analyses were executed by SPSS version 22.0 and R version 4.0.2 and p values < 0.05 (two‐tailed) were set as statistically significant.
Data availability
Data are available upon request to the corresponding authors.
Results
Baseline data
A total of 379 patients (214 men and 165 women) were included in the study. At baseline, 49 (12.9%) of the cohort had DM, and 22 (44.9%) of DM were poorly controlled. Among the 49 patients with DM, 43 (87.8%) were previously diagnosed and 6 (12.2%) were newly diagnosed at enrollment based on blood HbA1C levels ≥6.5%. Of the six PD patients with newly diagnosed DM, 2 (33.3%) were poorly controlled.
The mean age of the included patients at enrollment was 62.1 ± 11.0 years, with mean age of onset of 60.5 ± 11.0 years and mean disease duration of 1.6 ± 0.8 years. At baseline, the mean UPDRS III score was 25.9 ± 11.1, and the mean LEDD was 210.7 ± 204.7 mg/d.
Comparisons of baseline characteristics between groups
At baseline, patients in DM group were significantly older (p < 0.001), with older age of onset (p < 0.001), higher BMI (p = 0.017), and lower FAB (p = 0.019) and MoCA (p = 0.029) scores than those in non‐DM group (Table 1). The overall comparisons indicated that age (p < 0.001), age of onset (p < 0.001), BMI (p = 0.044), FAB score (p = 0.015), and MoCA score (p = 0.004) were significantly different among non‐DM, well‐controlled DM, and poorly controlled DM groups (Table 1). The subsequent pairwise comparisons indicated that patients with poorly controlled DM had significantly older age (p = 0.010), older age of onset (p = 0.009), and lower FAB (p = 0.015) and MoCA (p = 0.004) scores than those without DM, and patients with well‐controlled DM had significantly younger age (p = 0.008) and age of onset (p = 0.019) than those without DM (Table 1). The baseline characteristics between patients with poorly and well‐controlled DM were not significantly different (Table 1).
Table 1.
Comparisons of baseline characteristics between PD patients with and without DM.
|
Without DM (N = 330) |
With DM | p value | |||||||
|---|---|---|---|---|---|---|---|---|---|
|
Total (N = 49) |
Well controlled (N = 27) |
Poorly controlled (N = 22) |
p1 | p2 | p3 | p4 | p5 | ||
| Sex, male | 185(56.1%) | 29(59.2%) | 14(51.9%) | 15(68.2%) | 0.681 | 0.476 | 0.672 | 0.266 | 0.247 |
| Age | 61.2 ± 11.0 | 68.0 ± 9.0 | 67.7 ± 8.5 | 68.3 ± 9.7 | <0.001* | <0.001* | 0.008* | 0.010* | 1.000 |
| Age of PD onset | 59.6 ± 11.0 | 66.2 ± 9.0 | 65.9 ± 8.6 | 66.7 ± 9.5 | <0.001* | <0.001* | 0.019* | 0.009* | 1.000 |
| PD duration | 1.6 ± 0.8 | 1.7 ± 0.8 | 1.9 ± 0.9 | 1.6 ± 0.8 | 0.454 | 0.296 | 0.483 | 1.000 | 0.514 |
| Education | 9.9 ± 4.4 | 9.9 ± 4.6 | 11.0 ± 4.3 | 8.5 ± 4.6 | 0.925 | 0.685 | 0.478 | 0.143 | 0.044 |
| BMI | 22.8 ± 3.0 | 23.8 ± 2.7 | 24.1 ± 2.7 | 23.5 ± 2.6 | 0.017* | 0.044 | 0.066 | 0.739 | 1.000 |
| UPDRS III | 25.7 ± 11.0 | 27.6 ± 12.2 | 26.0 ± 12.6 | 29.6 ± 11.7 | 0.254 | 0.274 | 1.000 | 0.323 | 0.768 |
| H&Y | 2.0 ± 0.4 | 2.0 ± 0.4 | 2.0 ± 0.5 | 2.0 ± 0.5 | 0.837 | 0.926 | 1.000 | 1.000 | 1.000 |
| LEDD | 210.7 ± 205.4 | 210.7 ± 201.4 | 190.7 ± 198.1 | 232.1 ± 212.0 | 0.999 | 0.752 | 1.000 | 1.000 | 1.000 |
| Levodopa | 182(55.2%) | 30(61.2%) | 15(55.6%) | 15(55.6%) | 0.424 | 0.491 | 0.968 | 0.233 | 0.367 |
| Dopamine agonist | 98(29.7%) | 11(22.5%) | 7(25.9%) | 4(18.2%) | 0.296 | 0.485 | 0.679 | 0.249 | 0.518 |
| Pramipexole | 52(15.8%) | 6(12.2%) | 4(14.8%) | 2(9.1%) | |||||
| Piribedil | 41(12.4%) | 4(8.2%) | 2(7.4%) | 2(9.1%) | |||||
| Ropinirole | 3(0.9%) | 1(2.0%) | 1(3.7%) | 0 | |||||
| Rotigotine | 2(0.6%) | 0 | 0 | 0 | |||||
| Hypoglycemic agents | 0 | 29(59.2%) | 18(66.7%) | 11(50.0%) | ‐ | ‐ | ‐ | ‐ | 0.238 |
| FAB | 15.6 ± 2.5 | 14.7 ± 3.0 | 15.3 ± 3.2 | 14.1 ± 2.8 | 0.019* | 0.016* | 1.000 | 0.015* | 0.291 |
| MoCA | 23.9 ± 4.5 | 22.2 ± 5.3 | 23.4 ± 5.1 | 20.6 ± 5.2 | 0.029* | 0.005* | 1.000 | 0.004* | 0.110 |
| HDRS | 9.4 ± 8.0 | 10.0 ± 7.7 | 10.4 ± 9.5 | 9.4 ± 4.8 | 0.607 | 0.790 | 1.000 | 1.000 | 1.000 |
| HARS | 6.9 ± 6.0 | 7.3 ± 6.9 | 7.8 ± 8.2 | 6.8 ± 5.0 | 0.676 | 0.780 | 1.000 | 1.000 | 1.000 |
| NMSS | 34.9 ± 29.9 | 40.6 ± 35.9 | 41.8 ± 42.1 | 39.2 ± 29.1 | 0.224 | 0.457 | 1.000 | 0.706 | 1.000 |
PD, Parkinson’s disease; DM, diabetes mellitus; BMI, body mass index; UPDRS, Unified Parkinson’s disease Rating Scale; H&Y stage, Hoehn and Yahr stage; LEDD, Levodopa Equivalent Daily Doses; FAB, Frontal Assessment Battery; MoCA, Montreal Cognitive Assessment; HDRS, Hamilton Depression Rating Scale; HARS, Hamilton Anxiety Rating Scale; NMSS, Non‐Motor Symptoms Scale.
p1: DM group vs. non‐DM group.
p2: non‐DM group vs. well‐controlled DM group vs. poorly controlled DM group.
p3: non‐DM group vs. well‐controlled DM group.
p4: non‐DM group vs. poorly controlled DM group..
p5: well‐controlled DM group vs. poorly controlled DM group.
Significant difference.
Clinical outcomes
Of the 379 patients, 51 died (13.5%), with a mean time to death or censoring of 6.2 ± 2.5 years. For participants with follow‐up data on motor assessments, 154 (40.6%) reported an increase of ≥14‐point in the UPDRS III after mean 4.0 ± 2.4 years of follow‐up, and 118 (31.1%) reached the H&Y stage ≥3 after mean disease duration of 5.3 ± 2.3 years. In addition, 133 (35.1%) patients had a decrease of >3‐point in the MoCA after mean of 4.0 ± 2.4 years of follow‐up. The mean increased scores in the UPDRS III and MoCA were 8.5 ± 10.5 and 0.9 ± 3.2, respectively.
Among the 49 patients with DM, 29 (59.2%) were under treatment of hypoglycemic agents at baseline and the number increased to 41 (83.7%) during follow‐up. Eighteen (36.7%) patients with DM had both baseline and follow‐up tests on HbA1C. Of the 18 patients with DM, 9 (50%) were poorly controlled at baseline, and 2 of them (22.2%) were controlled during follow‐up; 9 (50%) patients were well controlled at baseline, and 2 of them lost to control during follow‐up.
Diabetes and the progression of PD
Kaplan‐Meier curves indicated that patients with DM showed a significantly shorter survival time (p = 0.047) and faster time to reach H&Y stage ≥3 (p = 0.030) than those without DM (Figure 2). The multivariable Cox model indicated that DM had no association with the PD outcomes after adjusting sex, age, age of onset, BMI, and UPDRS III and MoCA scores at baseline (Table 2).
Figure 2.
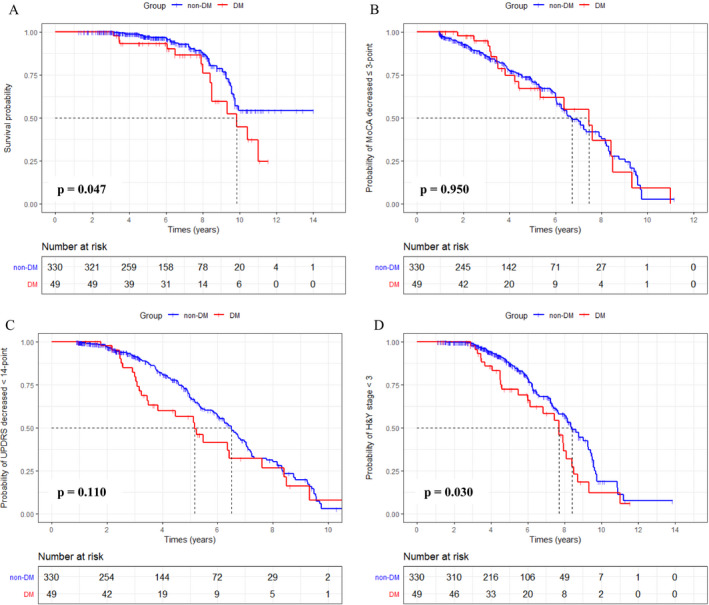
Kaplan‐Meier curve for each clinical outcome between DM and non‐DM groups. (A) Patients with DM had a significantly shorter survival time than those without DM (p = 0.047). (B) Time to MoCA decreased >3‐point was not significantly different between PD patients with and without DM (p = 0.950). (C) Time to UPDRS III increased ≥14‐point was not significantly different between PD patients with and without DM (p = 0.110). (D) Patients with DM had a significantly faster time to H&Y stage ≥3 than those without DM (p = 0.030).
Table 2.
Hazard ratios (HRs) and 95% confidence intervals (CIs) for each clinical outcome in PD.
| Univariate | Multivariate | |||
|---|---|---|---|---|
| HR (95% CI) | p value | HR (95% CI) | p value | |
| Without DM vs. With DM | ||||
| Death | 1.852 (0.998‐3.435) | 0.051 | 0.960 (0.480‐1.919) | 0.908 |
| UPDRS‐III increased ≥14‐point | 1.396 (0.919‐2.121) | 0.118 | 1.464 (0.944‐2.274) | 0.089 |
| H&Y stage converted to ≥3 | 1.613 (1.041‐2.500) | 0.033* | 1.475 (0.929‐2.342) | 0.099 |
| MoCA decreased >3‐point | 0.977 (0.592‐1.610) | 0.926 | 0.949 (0.563‐1.600) | 0.845 |
| Without DM vs. Well‐controlled DM vs. Poorly controlled DM | ||||
| Death | p for trend = 0.754 | |||
| Without DM vs. Well‐controlled DM | 0.973 (0.346‐2.737) | 0.985 | 0.617 (0.206‐1.845) | 0.388 |
| Without DM vs. Poorly controlled DM | 3.180 (1.615‐6.273) | 0.003* | 1.247 (0.565‐2.752) | 0.584 |
| UPDRS‐III increased ≥14‐point | p trend = 0.025* | |||
| Without DM vs. Well‐controlled DM | 1.035 (0.568‐1.886) | 0.911 | 1.066 (0.572‐1.986) | 0.841 |
| Without DM vs. Poorly controlled DM | 1.915 (1.117‐3.283) | 0.018* | 2.060 (1.165‐3.641) | 0.013* |
| H&Y stage converted to ≥ | p trend = 0.021* | |||
| Without DM vs. Well‐controlled DM | 0.849 (0.408‐1.767) | 0.661 | 0.879 (0.413‐1.871) | 0.737 |
| Without DM vs. Poorly controlled DM | 2.629 (1.575‐4.387) | <0.001* | 2.079 (1.212‐3.566) | 0.008* |
| MoCA decreased >3‐point | p trend = 0.959 | |||
| Without DM vs. Well‐controlled DM | 0.817 (0.410‐1.626) | 0.564 | 0.810 (0.396‐1.657) | 0.564 |
| Without DM vs. Poorly controlled DM | 1.205 (0.610‐2.382) | 0.591 | 1.137 (0.558‐2.315) | 0.724 |
PD, Parkinson’s disease; DM, diabetes mellitus; UPDRS, Unified Parkinson’s disease Rating Scale; H&Y stage, Hoehn and Yahr stage; MoCA, Montreal Cognitive Assessment; HR, hazard ratio.
In the multivariate model, sex, age, age of onset, BMI, UPDRS III score, and MoCA score at baseline were adjusted.
Significant difference.
Diabetes control status and the progression of PD
Kaplan‐Meier curves indicated that time to death and time to H&Y stage 3 were significantly different among the three groups (p = 0.007 and p < 0.001, respectively) (Figure 3). No significant differences were observed in time to UPDRS III ≥14‐point increase or time to MoCA >3‐point decrease (Figure 3).
Figure 3.

Kaplan‐Meier curve for each clinical outcome among non‐DM, well controlled‐DM, and poorly controlled‐DM groups at baseline. (A) Survival time was significantly different among the three groups (p = 0.007). Pairwise comparisons: non‐DM group vs. poorly controlled DM group (p = 0.002); non‐DM group vs. well controlled‐DM group (p = 0.980); and poorly controlled‐DM group vs. well‐controlled DM group (p = 0.049). (B) Time to reach MoCA decreased >3‐point was not significantly different among the three groups (p = 0.730). Pairwise comparisons: non‐DM group vs. poorly controlled DM group (p = 0.570); non‐DM group vs. well‐controlled DM group (p = 0.570); and poorly controlled‐DM group vs. well controlled‐DM group (p = 0.650). (C) Time to UPDRS III ≥14‐point increase was not significantly different among the three groups (p = 0.055). Pairwise comparisons: non‐DM group vs. poorly controlled‐DM group (p = 0.013); non‐DM group vs. well‐controlled DM group (p = 0.900); and poorly controlled DM group vs. well‐controlled DM group (p = 0.300). (D) Time to H&Y stage 3 was significantly different among the three groups (p < 0.001). Pairwise comparisons: non‐DM group vs. poorly controlled DM group (p < 0.001), non‐DM group vs. well‐controlled DM group (p = 0.660), and poorly controlled DM group vs. well‐controlled DM group (p = 0.023).
In the multivariable Cox model, the adjusted HRs were 2.060 (95% CI 1.165‐3.641, p = 0.013) for UPDRS III ≥14‐point increase in the poorly controlled DM group, and 1.066 (95% 0.572‐1.986, p = 0.841) in the well‐controlled DM group, relative to the non‐DM group (p trend = 0.025), after adjustment of sex, age, age of onset, BMI, and UPDRS III and MoCA scores at baseline (Table 2). The adjusted HRs were 2.079 (95% CI 1.212‐3.566, p = 0.008) for H&Y stage ≥3 in patients with poorly controlled DM, and 0.879 (95% CI 0.413‐1.871, p = 0.737) in patients with well‐controlled DM, compared with patients without DM (p trend = 0.021). In contrast, time to death and time to MoCA >3‐point decrease were not significantly different among the three groups.
Discussion
To the best of our knowledge, this is the first study to evaluate the effects of diabetes control status on PD progression in a cohort of Chinese patients. We observed that the risk of motor progression, as assessed by UPDRS III and H&Y stage, was double in individuals with poorly controlled DM compared with those without DM, but had no differences between the two populations. However, the risk for mortality and cognitive decline was not different between patients with well or poorly controlled DM and those without DM.
The association between DM and motor severity in PD has been disclosed by several observational and case‐control studies 1 , 5 in which reported pre‐existing DM by medical record or fast blood glucose test. The fast blood glucose test only reflects the transient glucose levels and probably changes in a short period, which is not suitable to select as a predictor. However, HbA1C in blood can provide evidence about an individual’s average blood glucose levels for a long period, which has been recommended as a standard of testing and monitoring DM. 25 There is a direct association between HbA1C and insulin resistance, and insulin resistance has been considered as a possible pathway to link PD and DM. Insulin resistance is associated with mitochondrial dysfunction, a potential way to contribute to DM, rather than the involvement of the pathogenesis of DM [30]. Therefore, in the current study, we used HbA1C as a biomarker to monitor disease progression.
Although no association between the coexistent DM and motor progression was observed in our cohort, we found that poor control status of DM is associated with faster disease progression in patients with PD. In addition, we found that there is no difference between patients with well controlled DM and those without DM. The majority of patients (77.8%) still had poor blood glucose control at the time of follow‐up, which also supports the finding that the uncontrolled status of DM is associated with faster disease progression. Therefore, we think that only poor control status plays a role in accelerating the motor progression of PD. Our finding emphasizes the importance of adequate control of diabetes, especially in monitoring serum HbA1C levels, in patients with PD.
One explanation for the association between DM and motor progression in PD is that diabetes is a risk factor for cerebrovascular and cardiovascular conditions which can contribute to parkinsonian‐like signs. 26 , 27 However, in the current study, we still observed an association between poor control status of DM and motor progression after excluding patients with stroke, myocardial infarction, suggesting that diabetes influences motor progression probably through some other mechanisms. A retrospective cohort study 28 using 18F‐FP‐CIT PET imaging found that the coexistent DM in PD had a significant adverse effect on decreased striatal dopamine transporter availability. Similarly, a prospective cohort study 7 demonstrated that patients with DM had lower striatal dopamine transporter binding and accelerated motor deterioration, supporting the notion of an acceleration in the disease process. In addition, PD and DM are reported to share common biologically plausible cellular mechanisms. The insulin receptor is one of the core targets in substantia nigra neurons, which can be regulated by hyperglycemia to suppress substantia nigra dopaminergic neuronal firing and to decrease dopamine turnover. 29
Two previous studies 4 , 30 found that the pre‐existing DM was associated with a faster cognitive decline. Our results did not support the above finding. The different ways to define cognitive decline between previous studies and our research may contribute to such a discrepancy. Previous studies used the annual score decline in Mini‐Mental Status Examination (MMSE) 4 or self‐reported cognitive decline 30 as clinical milestones. In the current study, we used a >3‐point in the MoCA to define the cognitive decline. A more sensitive cognitive assessment scale with a defined cut‐off value in the future will help to verify this issue. Moreover no association between DM and mortality in our cohort is likely due to the result that our follow‐up period was too short to obtain such an endpoint. In addition, the cause of death in some patients was not related to PD (18/51, 35.3%), which may have a potential interference on our results. Further stratified longitudinal studies will assist in clarifying this issue.
Some limitations should be pointed out. First, although several confounding factors were adjusted, some potential unmeasured confounders, such as diabetes duration, will still interferent with our results. Second, the sample of DM in our cohort is relatively small, which limited the stratification analysis by the conversion of diabetes control status. Third, all the participants were solely recruited through a tertiary referral center in west China, which contributes to our results may not be generalized to other populations. Fourth, the relatively short observation of disease progression for some patients is not sufficient to conclude the impact of HbA1C on long‐term outcomes.
In conclusion, poorly controlled diabetes is an independent risk factor contributing to motor progression in PD. Our study highlights the importance of adequate control of diabetes in PD patients.
Funding Information
This study was supported by the 1.3.5 project for disciplines of excellence, West China Hospital, Sichuan University (ZYJC18038), and the National Clinical Research Center for Geriatrics, West China Hospital, Sichuan University (Z2018B08).
Conflict of Interest
The authors (ORW, WQQ, HYB, ZLY, LKC, LJY, JZ, SW, CB, and SHF) declare that they have no conflict of interest.
Supporting information
Table S1. Hazard ratios (HRs) and 95% confidence intervals (CIs) for each clinical outcome based on age and BMI in PD.
Acknowledgments
The authors thank the patients and their families for their participation in the study.
Appendix 1. Authors.
| Name | Location | Contribution |
|---|---|---|
| Ruwei Ou, MD&PhD | Department of Neurology, Laboratory of Neurodegenerative Disorders, National Clinical Research Center for Geriatrics, West China Hospital, Sichuan University, Chengdu, Sichuan, China | Conceived and designed the study, acquired the data, performed the analysis, and drafted the manuscript. |
| Qianqian Wei, MD&PhD | Department of Neurology, Laboratory of Neurodegenerative Disorders, National Clinical Research Center for Geriatrics, West China Hospital, Sichuan University, Chengdu, Sichuan, China | Acquired the data and performed the analysis. |
| Yanbing Hou, MD&PhD | Department of Neurology, Laboratory of Neurodegenerative Disorders, National Clinical Research Center for Geriatrics, West China Hospital, Sichuan University, Chengdu, Sichuan, China | Acquired the data and performed the analysis. |
| Lingyu Zhang, MD | Department of Neurology, Laboratory of Neurodegenerative Disorders, National Clinical Research Center for Geriatrics, West China Hospital, Sichuan University, Chengdu, Sichuan, China | Acquired the data and performed the analysis. |
| Kuncheng Liu, MD | Department of Neurology, Laboratory of Neurodegenerative Disorders, National Clinical Research Center for Geriatrics, West China Hospital, Sichuan University, Chengdu, Sichuan, China | Acquired the data and performed the analysis. |
| Junyu Lin, MM | Department of Neurology, Laboratory of Neurodegenerative Disorders, National Clinical Research Center for Geriatrics, West China Hospital, Sichuan University, Chengdu, Sichuan, China | Acquired the data and performed the analysis. |
| Zheng Jiang, MM | Department of Neurology, Laboratory of Neurodegenerative Disorders, National Clinical Research Center for Geriatrics, West China Hospital, Sichuan University, Chengdu, Sichuan, China | Acquired the data and performed the analysis. |
| Wei Song, MD&PhD | Department of Neurology, Laboratory of Neurodegenerative Disorders, National Clinical Research Center for Geriatrics, West China Hospital, Sichuan University, Chengdu, Sichuan, China | Acquired the data and performed the analysis. |
| Bei Cao, MD | Department of Neurology, Laboratory of Neurodegenerative Disorders, National Clinical Research Center for Geriatrics, West China Hospital, Sichuan University, Chengdu, Sichuan, China | Acquired the data and performed the analysis. |
| Huifang Shang*, MD | Department of Neurology, Laboratory of Neurodegenerative Disorders, National Clinical Research Center for Geriatrics, West China Hospital, Sichuan University, Chengdu, Sichuan, China | Conceived and designed the study, and edited the manuscript. |
Funding Statement
This work was funded by 1.3.5 project for disciplines of excellence, West China Hospital, Sichuan University grant ZYJC18038; National Clinical Research Center for Geriatrics, West China Hospital, Sichuan University grant Z2018B08.
References
- 1. Sandyk R. The relationship between diabetes mellitus and Parkinson's disease. Int J Neurosci 1993;69:125–130. [DOI] [PubMed] [Google Scholar]
- 2. Marques A, Dutheil F, Durand E, et al. Glucose dysregulation in Parkinson's disease: too much glucose or not enough insulin? Parkinsonism Relat Disord 2018;55:122–127. [DOI] [PubMed] [Google Scholar]
- 3. Yue X, Li H, Yan H, et al. Risk of Parkinson disease in diabetes mellitus: an updated meta‐analysis of population‐based cohort studies. Medicine 2016;95(18):e3549. [DOI] [PMC free article] [PubMed] [Google Scholar]
- 4. Mollenhauer B, Zimmermann J, Sixel‐Doring F, et al. Baseline predictors for progression 4 years after Parkinson's disease diagnosis in the De Novo Parkinson Cohort (DeNoPa). Mov Disord 2019;34(1):67–77. [DOI] [PubMed] [Google Scholar]
- 5. Kotagal V, Albin RL, Muller ML, et al. Diabetes is associated with postural instability and gait difficulty in Parkinson disease. Parkinsonism Relat Disord 2013;19(5):522–526. [DOI] [PMC free article] [PubMed] [Google Scholar]
- 6. Bohnen NI, Kotagal V, Müller ML, et al. Diabetes mellitus is independently associated with more severe cognitive impairment in Parkinson disease. Parkinsonism Relat Disord 2014;20(12):1394–1398. [DOI] [PMC free article] [PubMed] [Google Scholar]
- 7. Pagano G, Polychronis S, Wilson H, et al. Diabetes mellitus and Parkinson disease. Neurology 2018;90(19):e1654–e1662. [DOI] [PubMed] [Google Scholar]
- 8. Mohamed Ibrahim N, Ramli R, Koya Kutty S, Shah SA. Earlier onset of motor complications in Parkinson's patients with comorbid diabetes mellitus. Mov Disord 2018;33(12):1967–1968. [DOI] [PubMed] [Google Scholar]
- 9. Arvanitakis Z, Wilson RS, Schneider JA, et al. Diabetes mellitus and progression of rigidity and gait disturbance in older persons. Neurology 2004;63(6):996–1001. [DOI] [PubMed] [Google Scholar]
- 10. Wei Q‐Q, Chen Y, Cao B, et al. Blood hemoglobin A1c levels and amyotrophic lateral sclerosis survival. Mol Neurodegener 2017;12(1):69. [DOI] [PMC free article] [PubMed] [Google Scholar]
- 11. Hughes AJ, Daniel SE, Kilford L, Lees AJ. Accuracy of clinical diagnosis of idiopathic Parkinson's disease: a clinico‐pathological study of 100 cases. J Neurol Neurosurg Psychiatry 1992;55(3):181–184. [DOI] [PMC free article] [PubMed] [Google Scholar]
- 12. Postuma RB, Berg D, Stern M, et al. MDS clinical diagnostic criteria for Parkinson's disease. Mov Disord 2015;30(12):1591–1601. [DOI] [PubMed] [Google Scholar]
- 13. World Health Organization . Use of Glycated Haemoglobin (HbA1c) in the Diagnosis ofDiabetes Mellitus. Available at http://www.who.int/diabetes/publi‐cations/report‐hba1c_2011.pdf. Last. accessed 24 July 2012.
- 14. American Diabetes A . 6. Glycemic Targets. Diabetes Care 2017;40(Suppl 1):S48–S56. [DOI] [PubMed] [Google Scholar]
- 15. Tomlinson CL, Stowe R, Patel S, et al. Systematic review of levodopa dose equivalency reporting in Parkinson's disease. Mov Disord 2010;25(15):2649–2653. [DOI] [PubMed] [Google Scholar]
- 16. Goetz CG, Fahn S, Martinez‐Martin P, et al. Movement Disorder Society‐sponsored revision of the Unified Parkinson's Disease Rating Scale (MDS‐UPDRS): process, format, and clinimetric testing plan. Mov Disord 2007;22(1):41–47. [DOI] [PubMed] [Google Scholar]
- 17. Hoehn MM, Yahr MD. Parkinsonism: onset, progression and mortality. Neurology 1967;17(5):427–442. [DOI] [PubMed] [Google Scholar]
- 18. Ritz B, Rhodes SL, Bordelon Y, Bronstein J. alpha‐Synuclein genetic variants predict faster motor symptom progression in idiopathic Parkinson disease. PLoS One 2012;7(5):e36199. [DOI] [PMC free article] [PubMed] [Google Scholar]
- 19. Wang G, Hong Z, Cheng Q, et al. Validation of the Chinese non‐motor symptoms scale for Parkinson's disease: results from a Chinese pilot study. Clin Neurol Neurosurg. 2009;111(6):523–526. [DOI] [PubMed] [Google Scholar]
- 20. Nasreddine ZS, Phillips NA, Bédirian Vr, et al. The montreal cognitive assessment, MoCA: a brief screening tool for mild cognitive impairment. J Am Geriatr Soc 2005;53(4):695–699. [DOI] [PubMed] [Google Scholar]
- 21. Rothlind JC, Brandt J. A brief assessment of frontal and subcortical functions in dementia. J Neuropsychiatry Clin Neurosci. 1993;5(1):73–77. [DOI] [PubMed] [Google Scholar]
- 22. Hamilton M. Development of a rating scale for primary depressive illness. Br J Soc Clin Psychol 1967;6(4):278–296. [DOI] [PubMed] [Google Scholar]
- 23. Clark DB, Donovan JE. Reliability and validity of the Hamilton Anxiety Rating Scale in an adolescent sample. J Am Acad Child Adolesc Psychiatry 1994;33(3):354–360. [DOI] [PubMed] [Google Scholar]
- 24. Shulman LM, Gruber‐Baldini AL, Anderson KE, et al. The clinically important difference on the unified Parkinson's disease rating scale. Arch Neurol 2010;67(1):64–70. [DOI] [PubMed] [Google Scholar]
- 25. Sherwani SI, Khan HA, Ekhzaimy A, et al. Significance of HbA1c test in diagnosis and prognosis of diabetic patients. Biomarker Insights 2016;11:95–104. [DOI] [PMC free article] [PubMed] [Google Scholar]
- 26. Murrow RW, Schweiger GD, Kepes JJ, Roller WC. Parkinsonism due to a basal ganglia lacunar state: clinicopathologic correlation. Neurology 1990;40(6):897. [DOI] [PubMed] [Google Scholar]
- 27. Winikates J, Jankovic J. Clinical correlates of vascular parkinsonism. Arch Neurol 1999;56(1):98–102. [DOI] [PubMed] [Google Scholar]
- 28. Chung SJ, Jeon S, Yoo HS, et al. Detrimental effect of type 2 diabetes mellitus in a large case series of Parkinson's disease. Parkinsonism Relat Disord 2019;64:54–59. [DOI] [PubMed] [Google Scholar]
- 29. Das RR, Unger MM. Diabetes and Parkinson disease: a sweet spot? Neurology 2018;90(19):869–870. [DOI] [PubMed] [Google Scholar]
- 30. Xu Q, Park Y, Huang X, et al. Diabetes and risk of Parkinson's disease. Diabetes Care 2011;34(4):910–915. [DOI] [PMC free article] [PubMed] [Google Scholar]
Associated Data
This section collects any data citations, data availability statements, or supplementary materials included in this article.
Supplementary Materials
Table S1. Hazard ratios (HRs) and 95% confidence intervals (CIs) for each clinical outcome based on age and BMI in PD.
Data Availability Statement
Data are available upon request to the corresponding authors.